
Tenjin: Ad Monetization in Mobile Games in Q1'24
Tenjin: Ad Monetization in Mobile Games in Q1'24
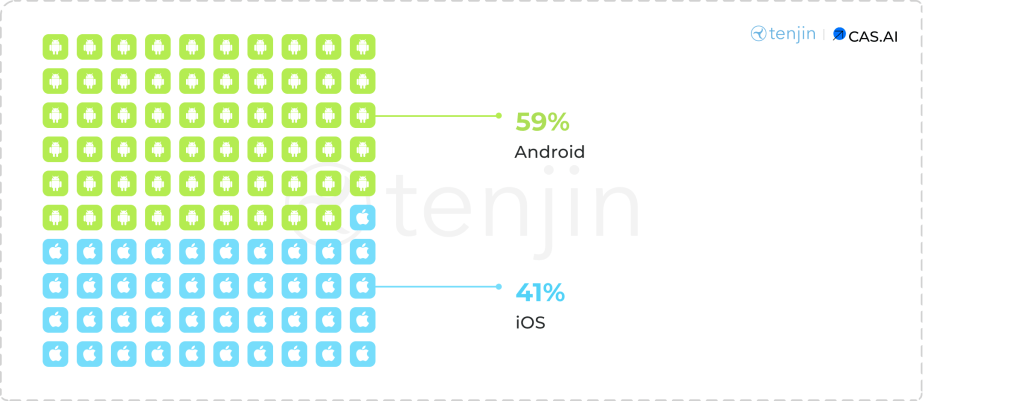
Android turned the table with mobile monetization, now leading over iOS.

The research is based on 146 billion ad impressions from January 1 to March 31, 2024. eCPM data is based on 6 billion ad impressions. Applications for children were excluded from the sample.
In 2024, iOS accounts for 41% of all ad revenue. In 2019, the platform had 63%. Such significant changes occurred largely due to the introduction of ATT.
❗️ Tenjin advises increasing ATT opt-in rates to boost ad revenue on iOS.
GameDev Reports Newsletter offers promotion opportunities to gaming companies. Reach out to learn more.
iOS - Q1’24 Results
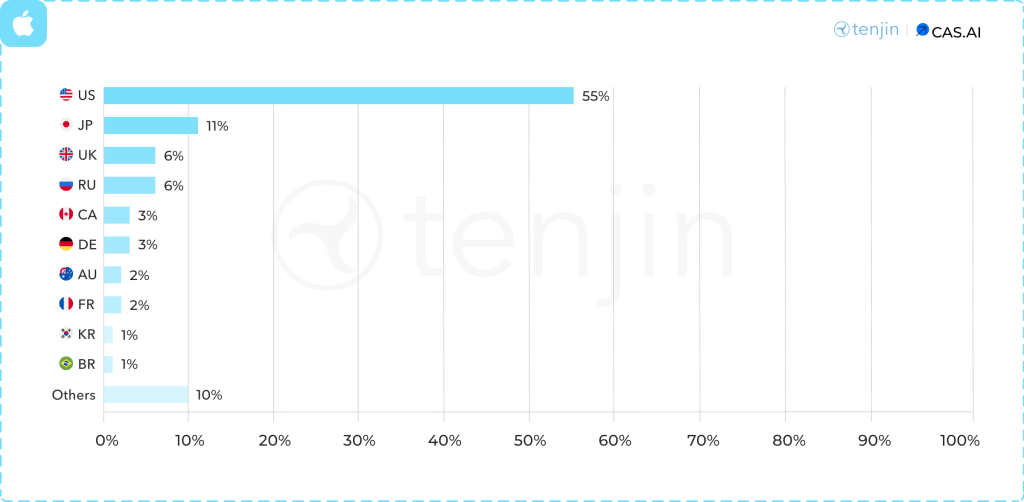
55% of all ad revenue on iOS comes from the USA. Following are Japan (11%); the United Kingdom (6%); Russia (6%); and Canada and Germany (3% each).
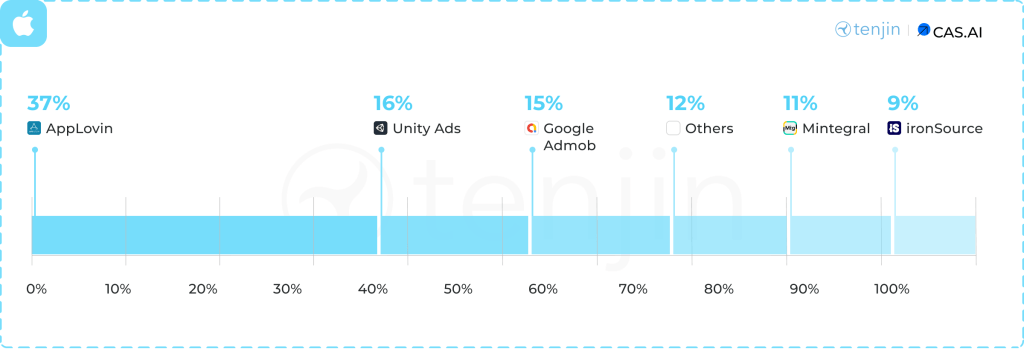
The most popular ad networks on iOS are AppLovin (37%); Unity Ads (16%); Google Admob (15%); Mintegral (11%); ironSource (9%).
Android - Q1’24 Results
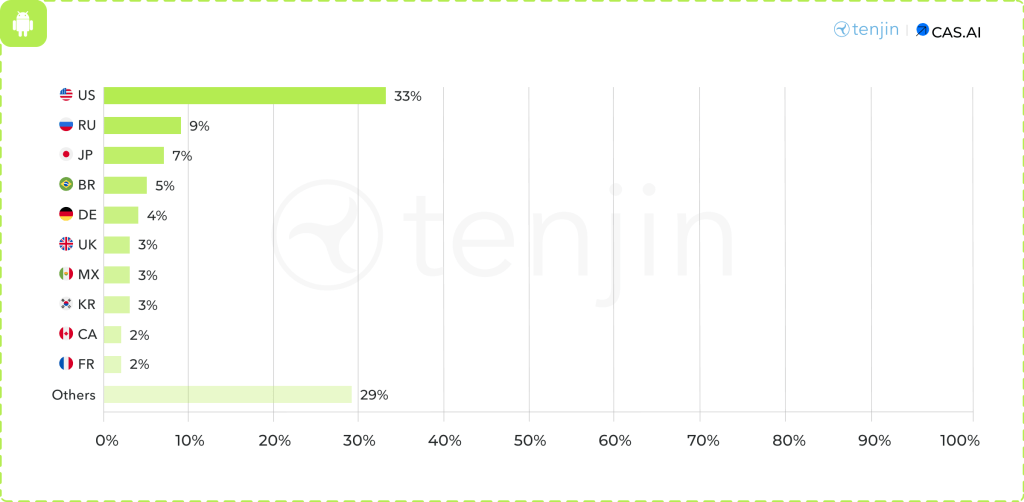
The USA also dominates on Android with 33% of all ad revenue. Russia is in second place (9%), Japan in third (7%), Brazil in fourth (5%), and Germany in fifth (4%).
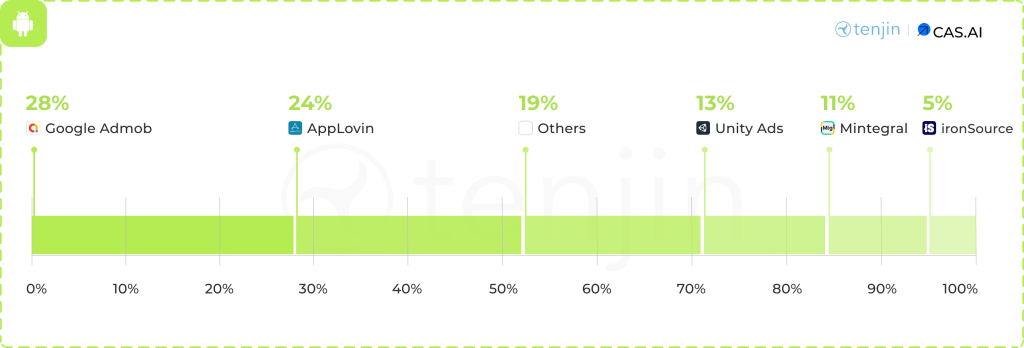
Among the ad networks on Android, the leading positions are held by Google Admob (28%); AppLovin (24%); Unity Ads (13%); Mintegral (11%); ironSource (5%).
eCPM - Benchmarks in Q1’24
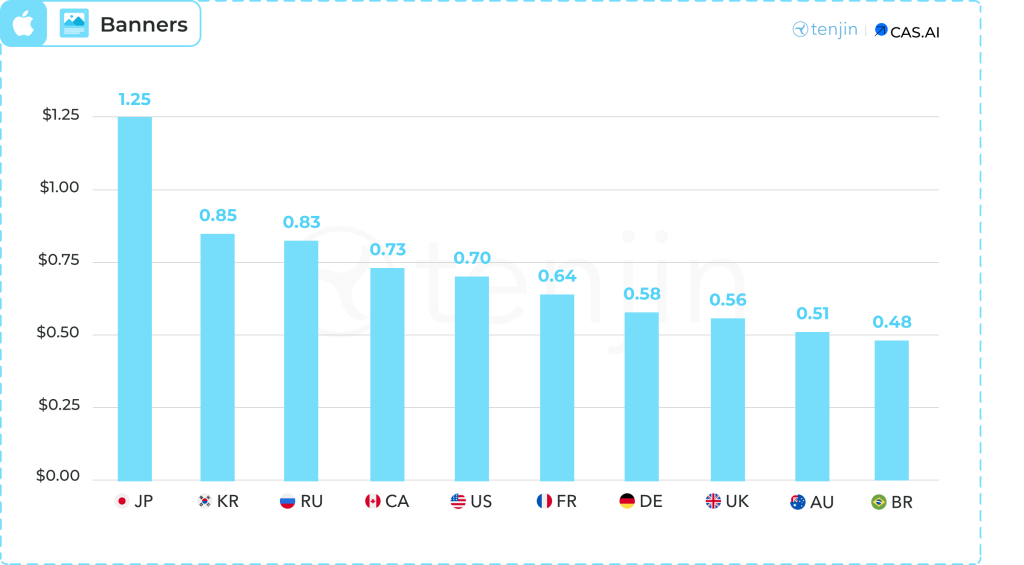
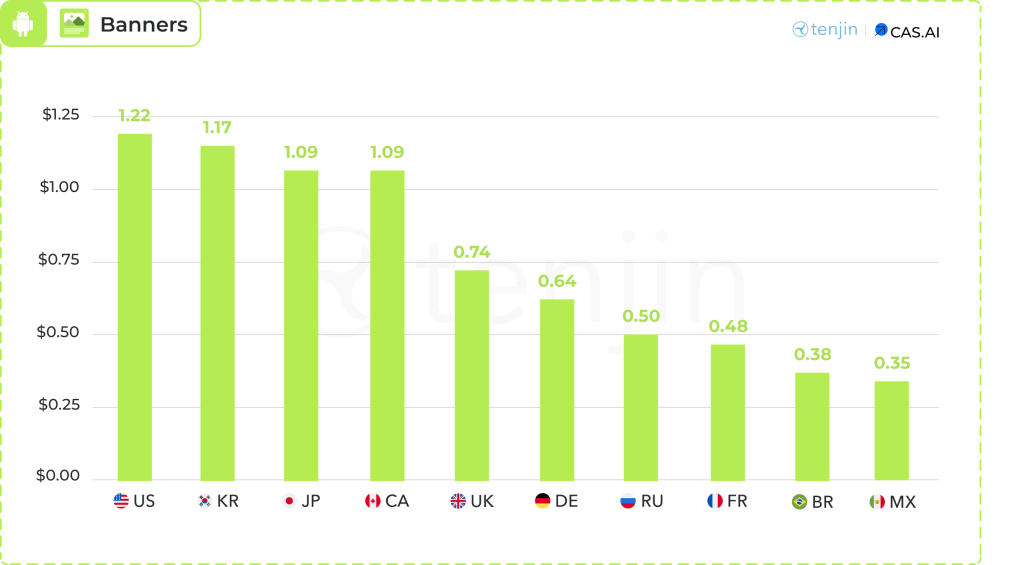
Banners - On iOS, the highest eCPM is in Japan ($1.25); South Korea ($0.85), and Russia ($0.83). On Android, it is in the USA ($1.22); South Korea ($1.17), and Japan ($1.09).
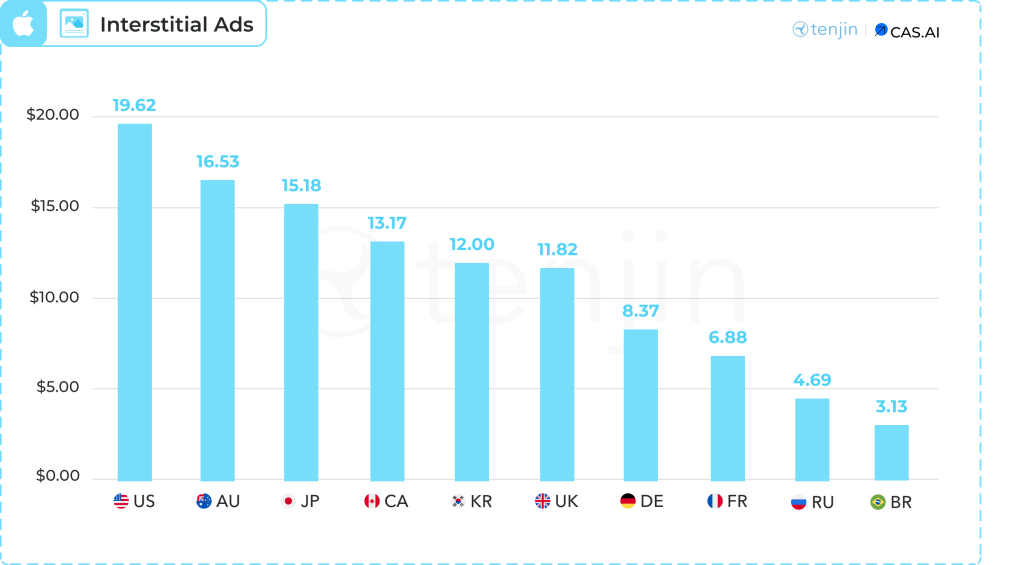
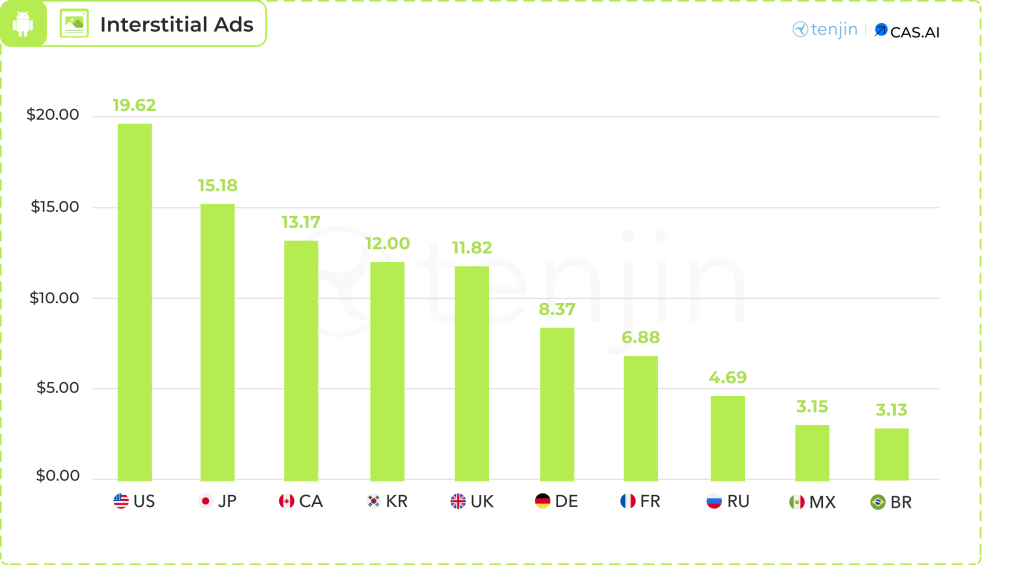
Interstitial ads - On iOS, the leaders are the USA ($19.62); Australia ($16.53), and Japan ($15.18). On Android, it is the USA ($19.62), Japan ($15.18), and Canada ($13.17).
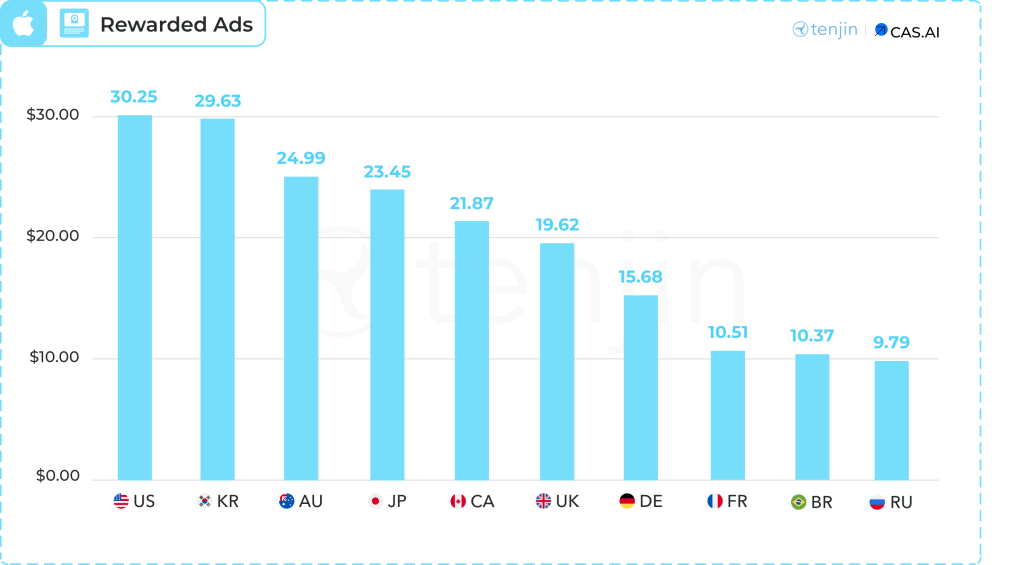
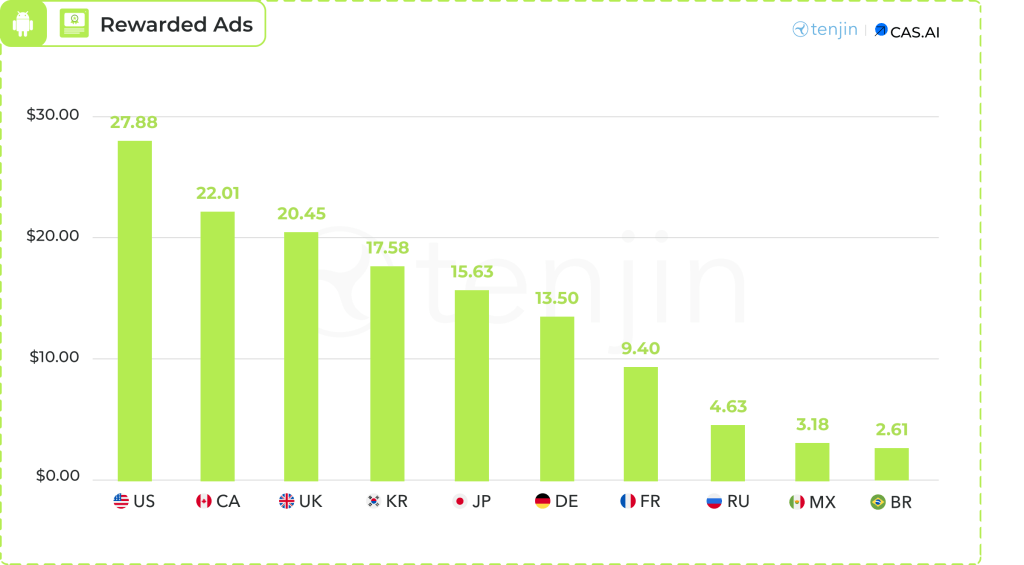
Rewarded Ads - The highest eCPM on iOS is in the USA ($30.25); South Korea ($29.63), and Australia ($24.99). On Android, it is in the USA ($27.88); Canada ($22.01), and the United Kingdom ($20.45).