
Weekly Gaming Reports Recap: June 17 - June 21 (2024)
Weekly Gaming Reports Recap: June 17 - June 21 (2024)
VGI calculated the PlayStation ventures on PC; Sensor Tower provided data for AAA marketing; GameAnalytics shared key metrics of the Roblox games.

Reports of the week:
Tenjin: Ad Monetization in Mobile Games in Q1'24
Famitsu: Paper Mario: The Thousand-Year Door topped the Japanese retail chart in May 2024
Video Game Insights: How much money has PlayStation made by releasing games on Steam?
Sensor Tower: AAA Marketing in 2023
Take This & Nielsen: In games with toxic communities, people spend less money
GameAnalytics: Key Roblox & Games for Roblox metrics in 2023
Tenjin: Ad Monetization in Mobile Games in Q1'24
The research is based on 146 billion ad impressions from January 1 to March 31, 2024. eCPM data is based on 6 billion ad impressions. Applications for children were excluded from the sample.
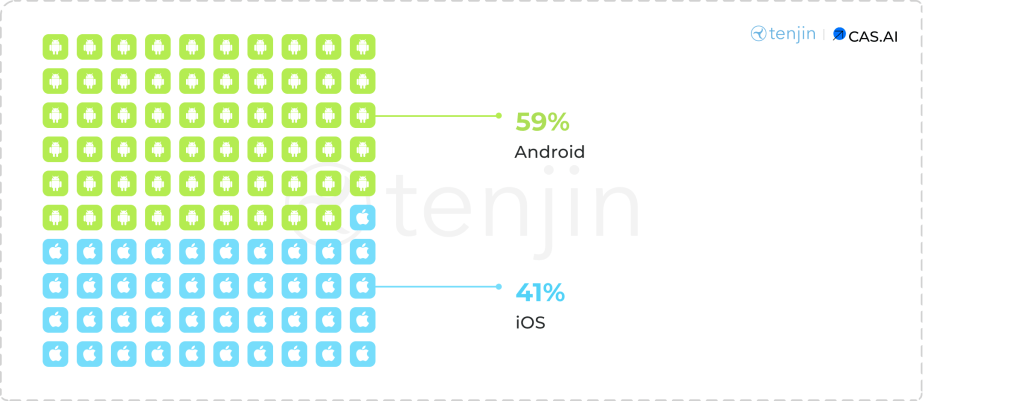
In 2024, iOS accounts for 41% of all ad revenue. In 2019, the platform had 63%. Such significant changes occurred largely due to the introduction of ATT.
❗️ Tenjin advises increasing ATT opt-in rates to boost ad revenue on iOS.
iOS - Q1’24 Results
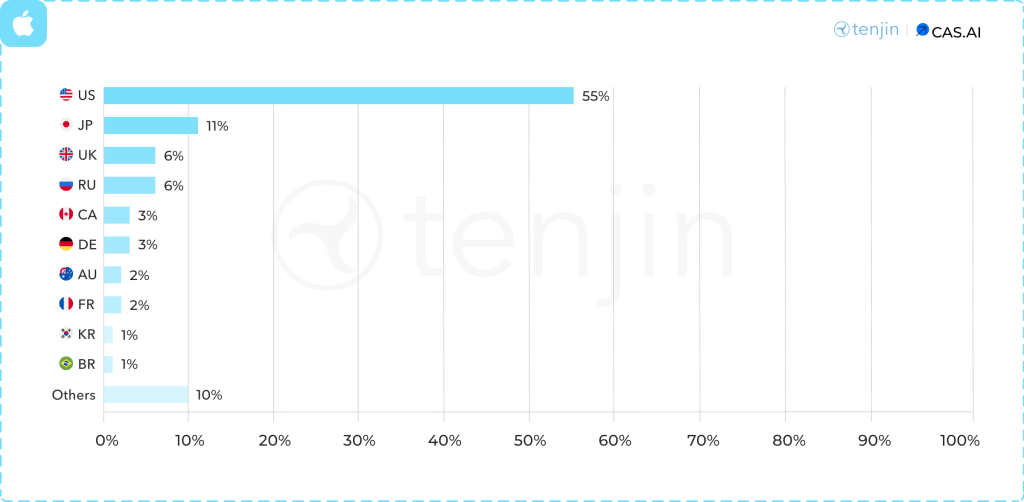
55% of all ad revenue on iOS comes from the USA. Following are Japan (11%); the United Kingdom (6%); Russia (6%); and Canada and Germany (3% each).
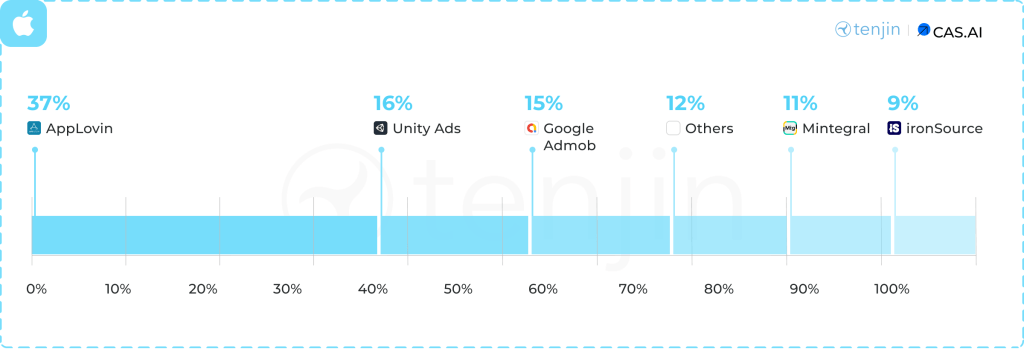
The most popular ad networks on iOS are AppLovin (37%); Unity Ads (16%); Google Admob (15%); Mintegral (11%); ironSource (9%).
Android - Q1’24 Results
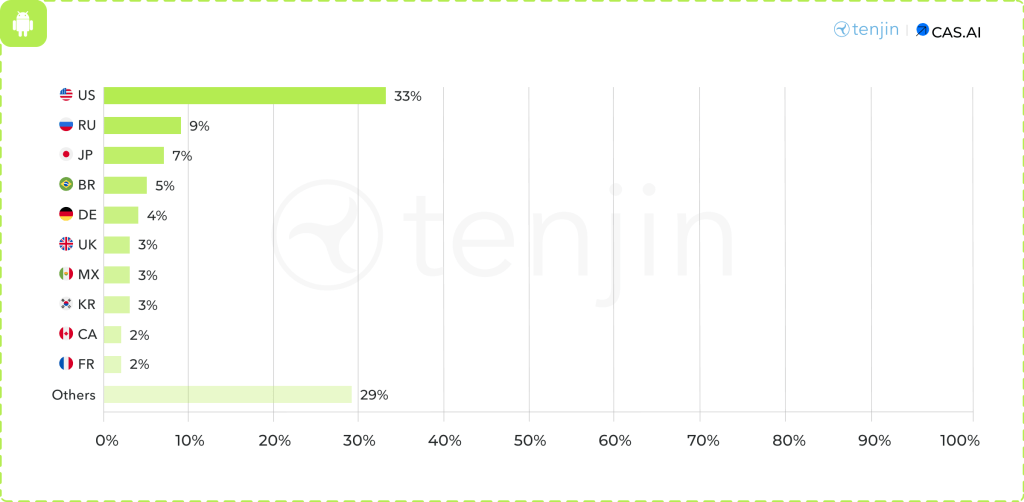
The USA also dominates on Android with 33% of all ad revenue. Russia is in second place (9%), Japan in third (7%), Brazil in fourth (5%), and Germany in fifth (4%).
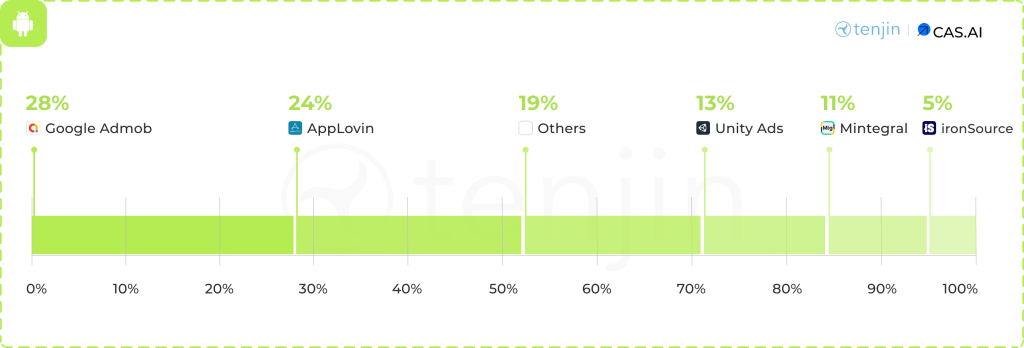
Among the ad networks on Android, the leading positions are held by Google Admob (28%); AppLovin (24%); Unity Ads (13%); Mintegral (11%); ironSource (5%).
eCPM - Benchmarks in Q1’24
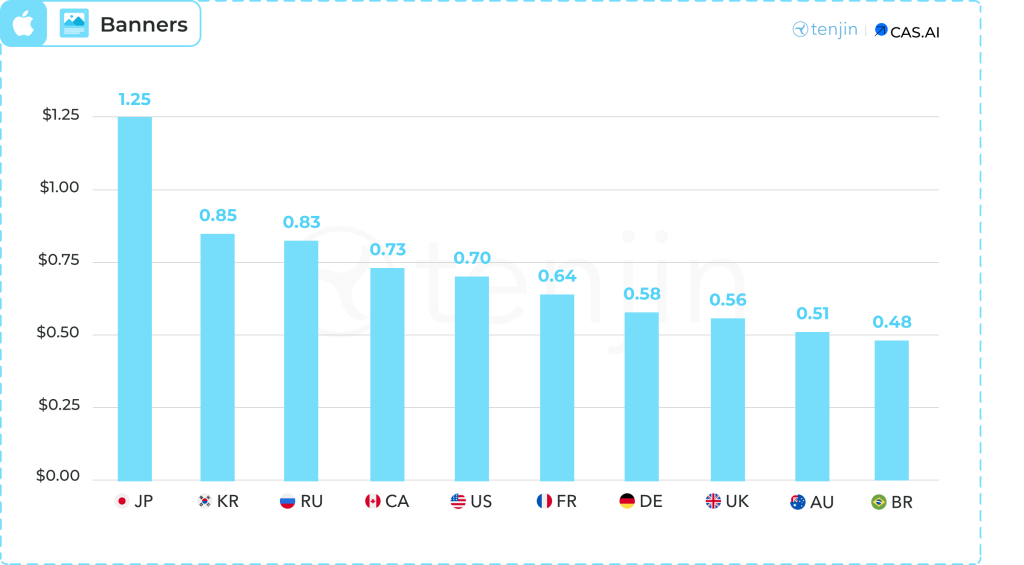
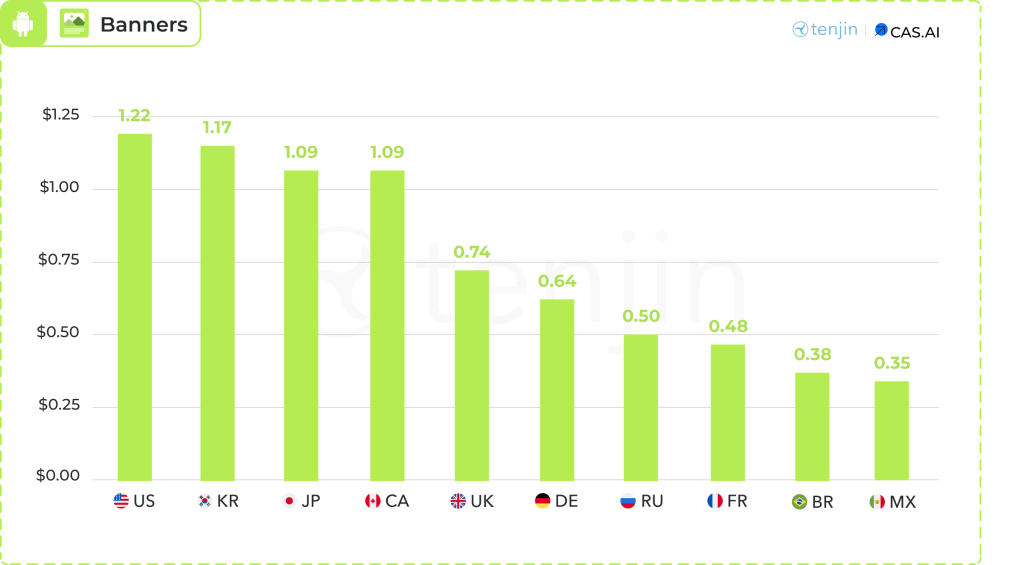
Banners - On iOS, the highest eCPM is in Japan ($1.25); South Korea ($0.85), and Russia ($0.83). On Android, it is in the USA ($1.22); South Korea ($1.17), and Japan ($1.09).
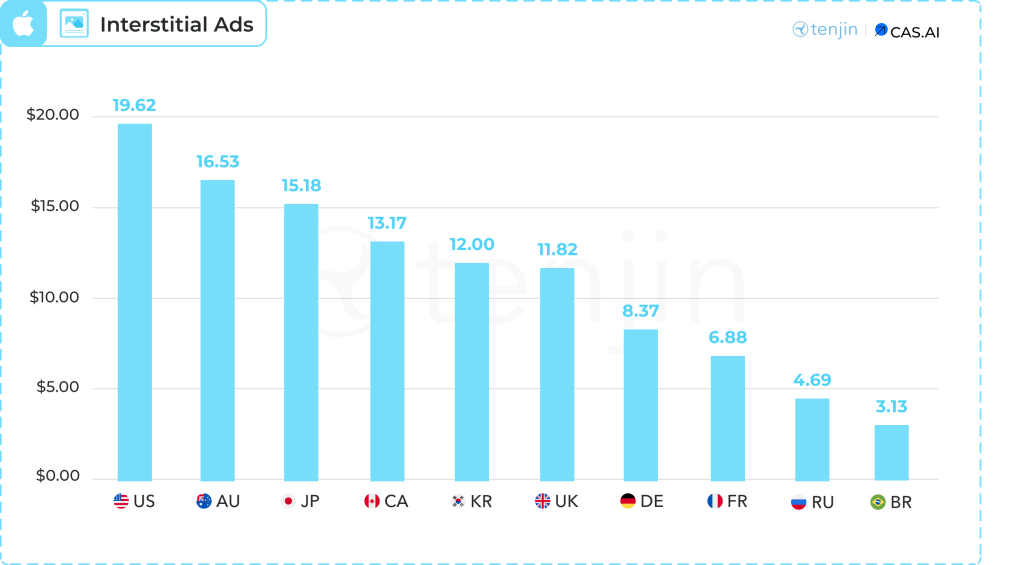
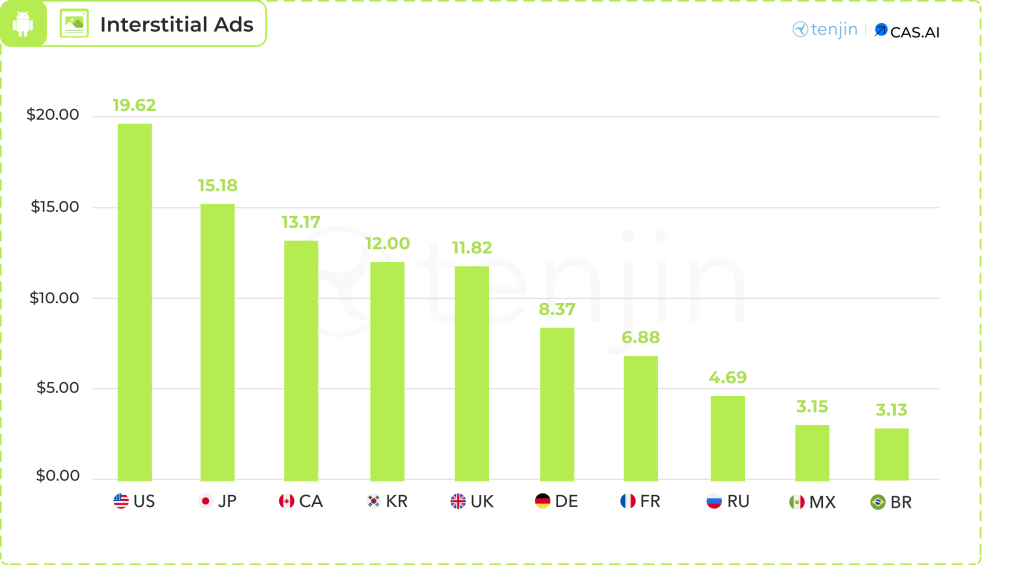
Interstitial ads - On iOS, the leaders are the USA ($19.62); Australia ($16.53), and Japan ($15.18). On Android, it is the USA ($19.62), Japan ($15.18), and Canada ($13.17).
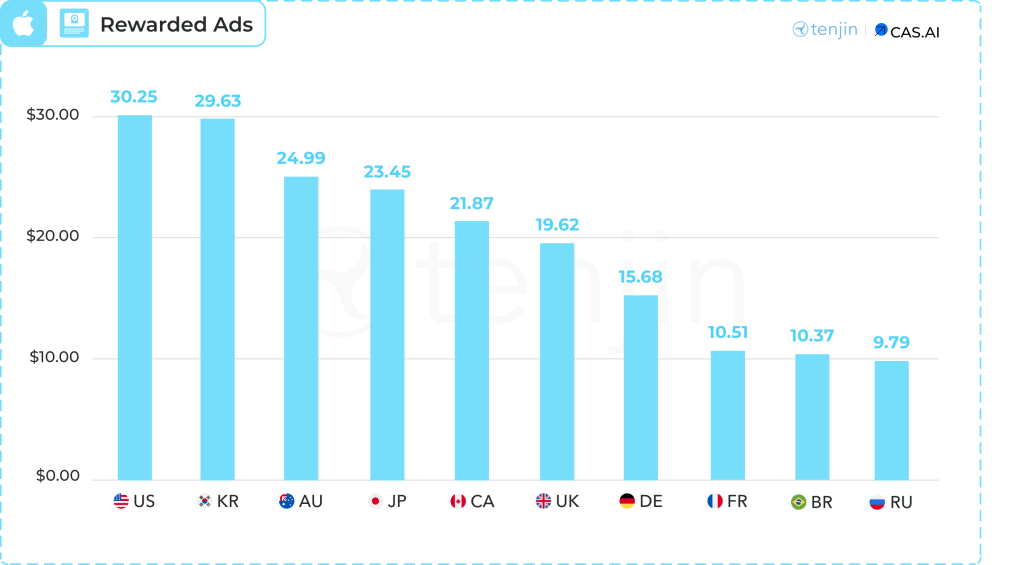
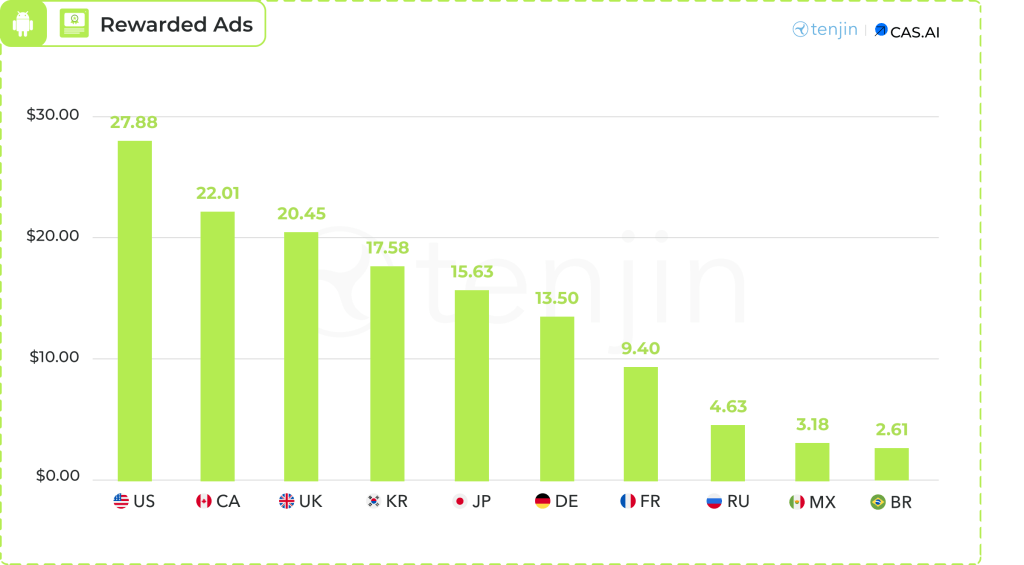
Rewarded Ads - The highest eCPM on iOS is in the USA ($30.25); South Korea ($29.63), and Australia ($24.99). On Android, it is in the USA ($27.88); Canada ($22.01), and the United Kingdom ($20.45).
Famitsu: Paper Mario: The Thousand-Year Door topped the Japanese retail chart in May 2024

Famitsu only considers physical game sales.
Game Sales
Paper Mario: The Thousand-Year Door sold 115.6 thousand copies in 3 days. The game was released on May 23. The re-release nearly matched the record of the original game, which was released in 2004 on the GameCube and sold 138 thousand copies in retail during the same period.
❗️Digital sales are not included here, so, in reality, the remaster might have higher launch sales with Nintendo eShop numbers.
Stellar Blade (46.4 thousand copies) holds the second place; Endless Ocean Luminous (42.8 thousand) is in third place.
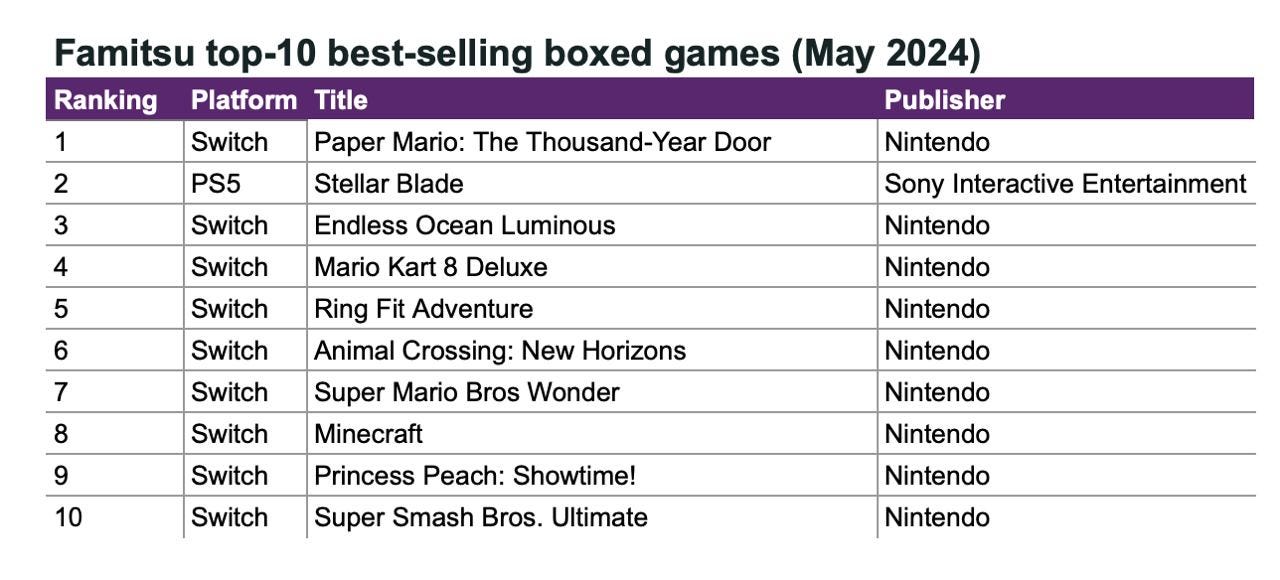
Stellar Blade is the only game in the chart not released by Nintendo. Nintendo holds 48.5% of the total retail sales volume.
79.9% of all games sold were for the Nintendo Switch (769.9 thousand copies). Games for the PS5 account for 15% of the market (144 thousand copies).
Hardware Sales
The Nintendo Switch is the sales leader, with the console being purchased 193 thousand times in May.
The PlayStation 5 sold 89.2 thousand units.
Video Game Insights: How much money has PlayStation made by releasing games on Steam?

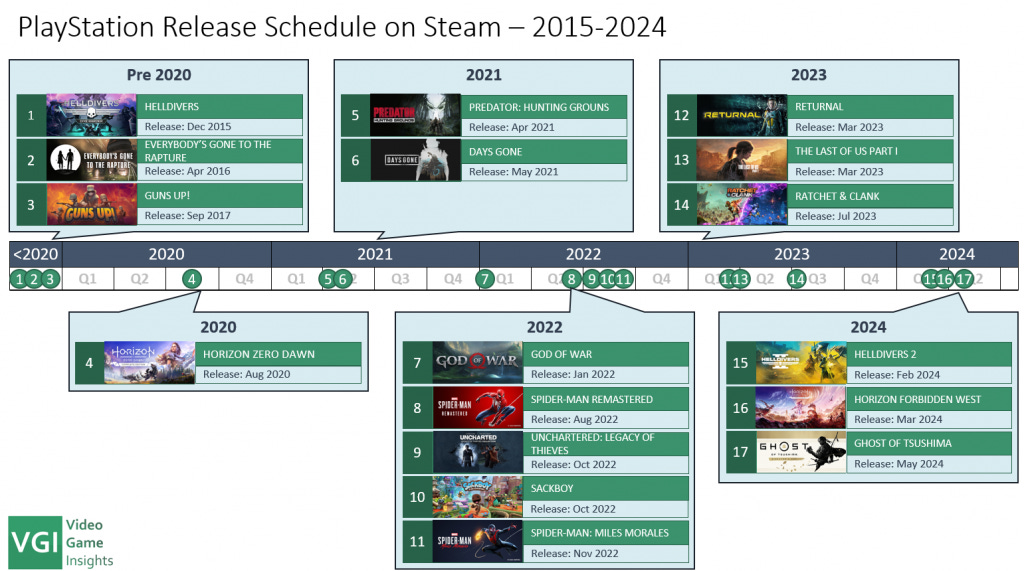
Until 2020, Sony had released only 3 games on Steam. The first of them was the original Helldivers. The strategy shift began with the release of Horizon: Zero Dawn in August 2020, after which Sony released 14 projects on PC. And it doesn’t plan to stop.
PlayStation performance on Steam
Including Helldivers II, Sony has sold 28 million copies of its games on Steam. Without counting the latest hit, it's 17 million copies.
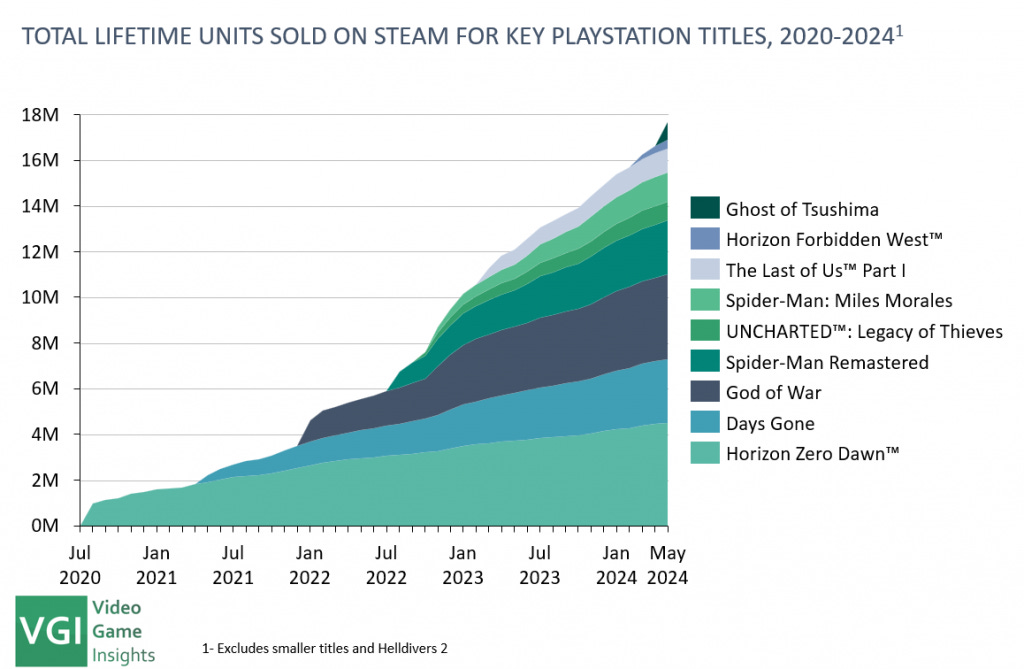
Over the past 4 years, PlayStation games on Steam have earned $830 million. Helldivers II accounts for 34% of this amount.
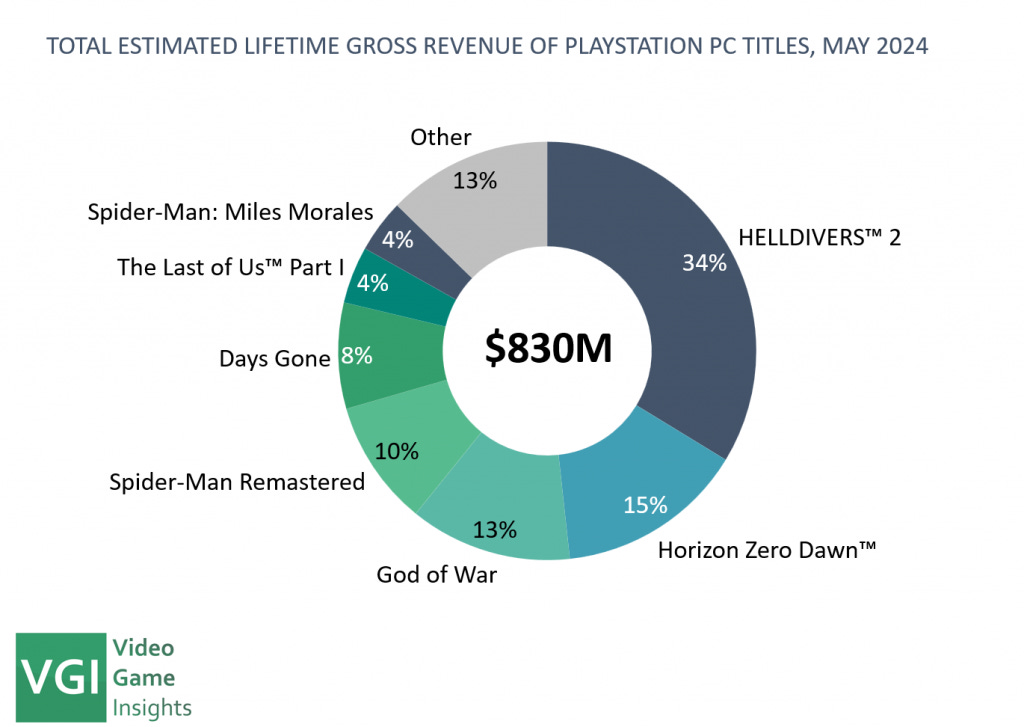
Using Horizon Zero Dawn as an example: out of 24 million copies sold, 3.7 million were on PC (15%). According to VGI estimates, the game earned $120 million on PC and around $500 million on PlayStation. Thus, releasing on Steam increased sales by about a quarter. Considering that the entire game cost about $47 million to develop, the PC port alone has recouped the development cost several times over.
However, revenue from PC ports is a small part of Sony's overall gaming revenue. In the 2023 fiscal year, the PlayStation business earned $29.4 billion.
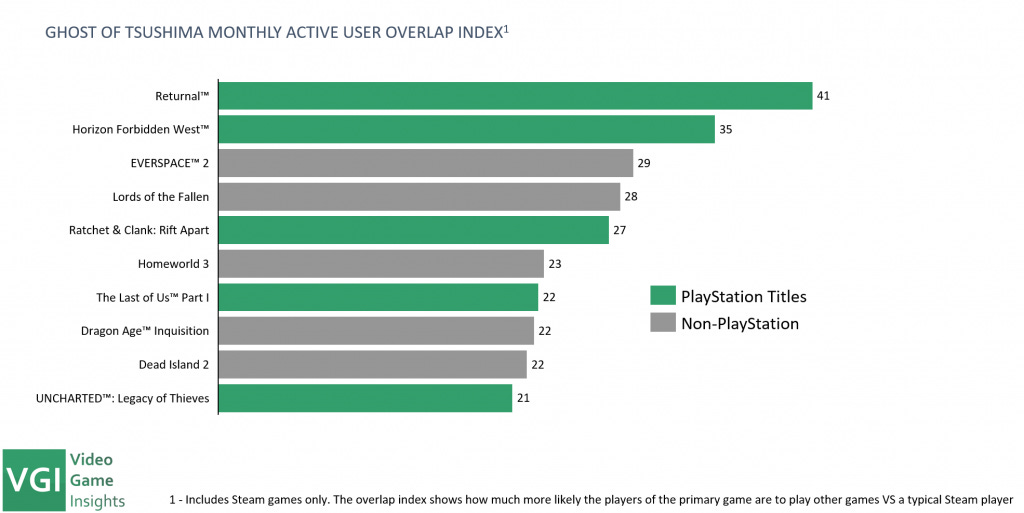
Ghost of Tsushima Case Study
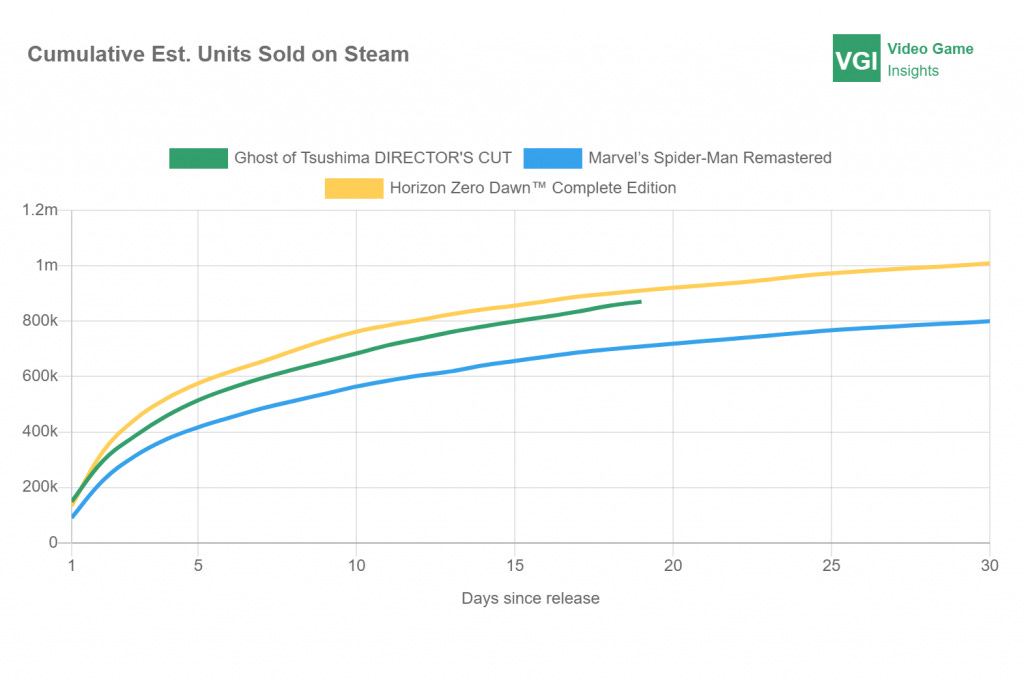
Ghost of Tsushima, released in May 2024, sold 800 thousand copies in Steam in the first 20 days. The launch is comparable to the release of Marvel’s Spider-Man and Horizon: Zero Dawn.
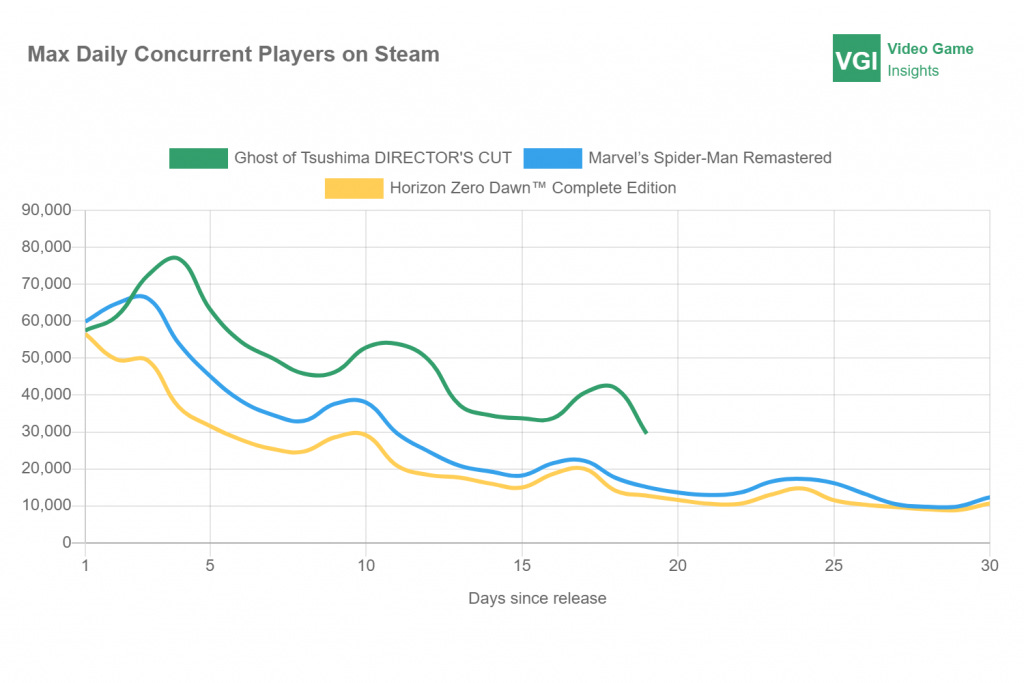
Moreover, Ghost of Tsushima retains users better. On the 20th day, the project had twice the CCU (concurrent users) compared to the two aforementioned projects.
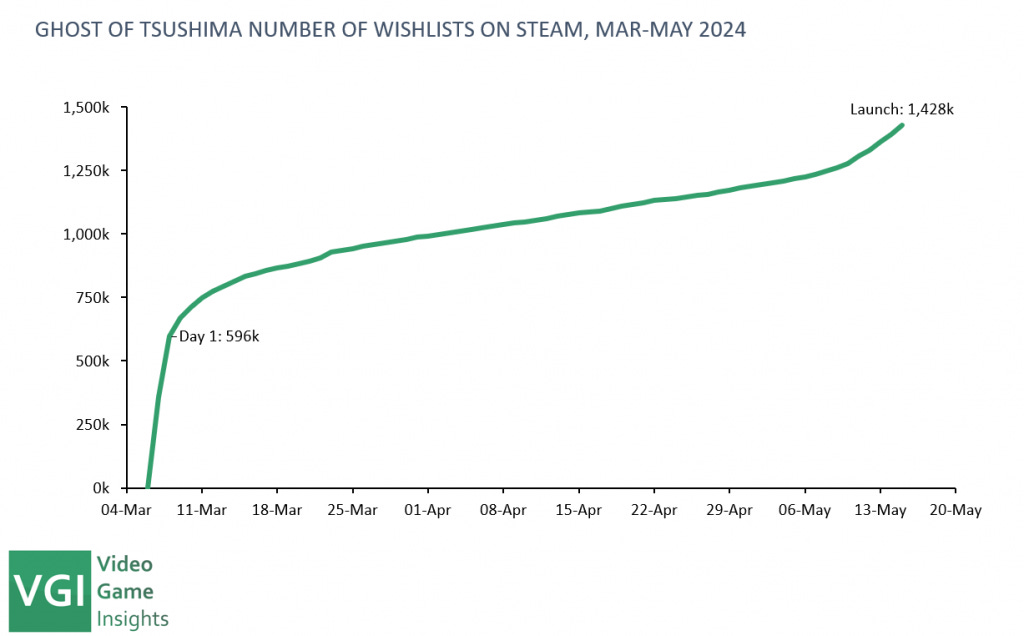
VGI, analyzing the success of Ghost of Tsushima, notes that the project approached its launch with 1.428 million wishlists.
The audience of Ghost of Tsushima overlaps significantly with the audience of other PlayStation games on Steam. In the top-10 for overlaps, 5 are from PlayStation.
Sensor Tower: AAA Marketing in 2023
50% of the advertising budgets in 2023 were spent on supporting new launches. In 2022, only 20% of the budgets were used for this purpose.
The largest launches of 2023 include Hogwarts Legacy ($33 million); Diablo IV ($26 million); Call of Duty: Modern Warfare III ($19 million); Star Wars Jedi: Survivor ($16 million); and Avatar: Frontiers of Pandora ($15 million).
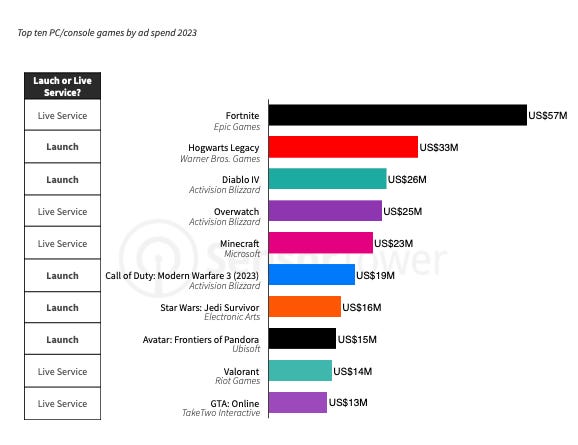
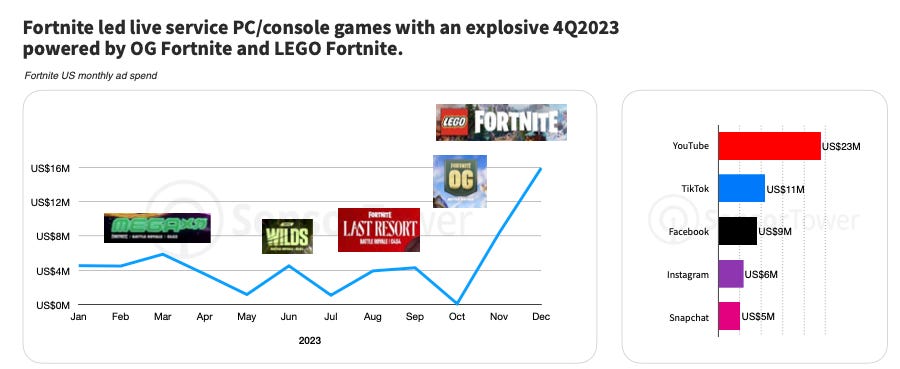
The leader in advertising budgets was Fortnite - developers spent $57 million on advertising in 2023, according to Pathmatics, a service owned by Sensor Tower.
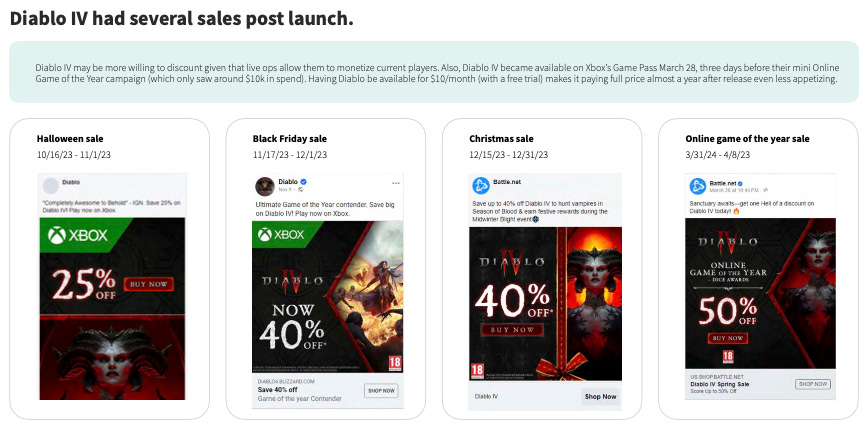
❗️I believe the actual marketing budgets for these projects are higher. Based on the budgets of projects I’ve seen, it's hard to imagine that Diablo IV's campaign, for instance, which included videos featuring Megan Fox and soundtracks by Billie Eilish, was all done for just $26 million.
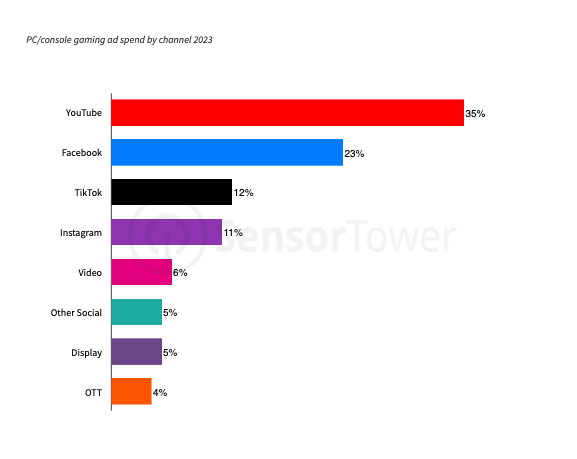
YouTube is the main channel for promoting PC/console games in the USA, accounting for 35% of all advertising budgets. Following it are Facebook (23%); TikTok (12%); and Instagram (11%). Sensor Tower estimates total advertising spending for PC/console games in the USA to be $600 million.
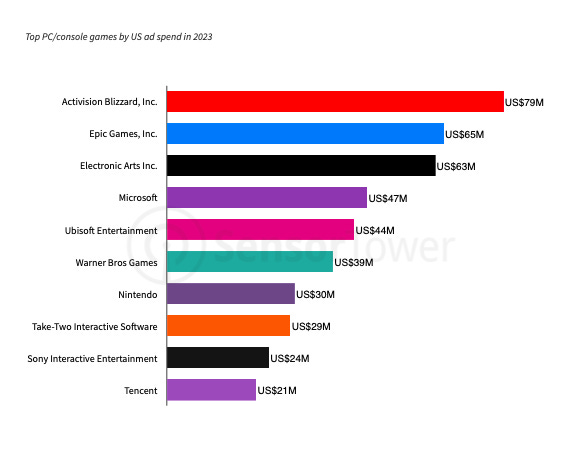
Activision Blizzard ($79 million); Epic Games ($65 million); and Electronic Arts ($63 million) spent the most on marketing in the USA in 2023.
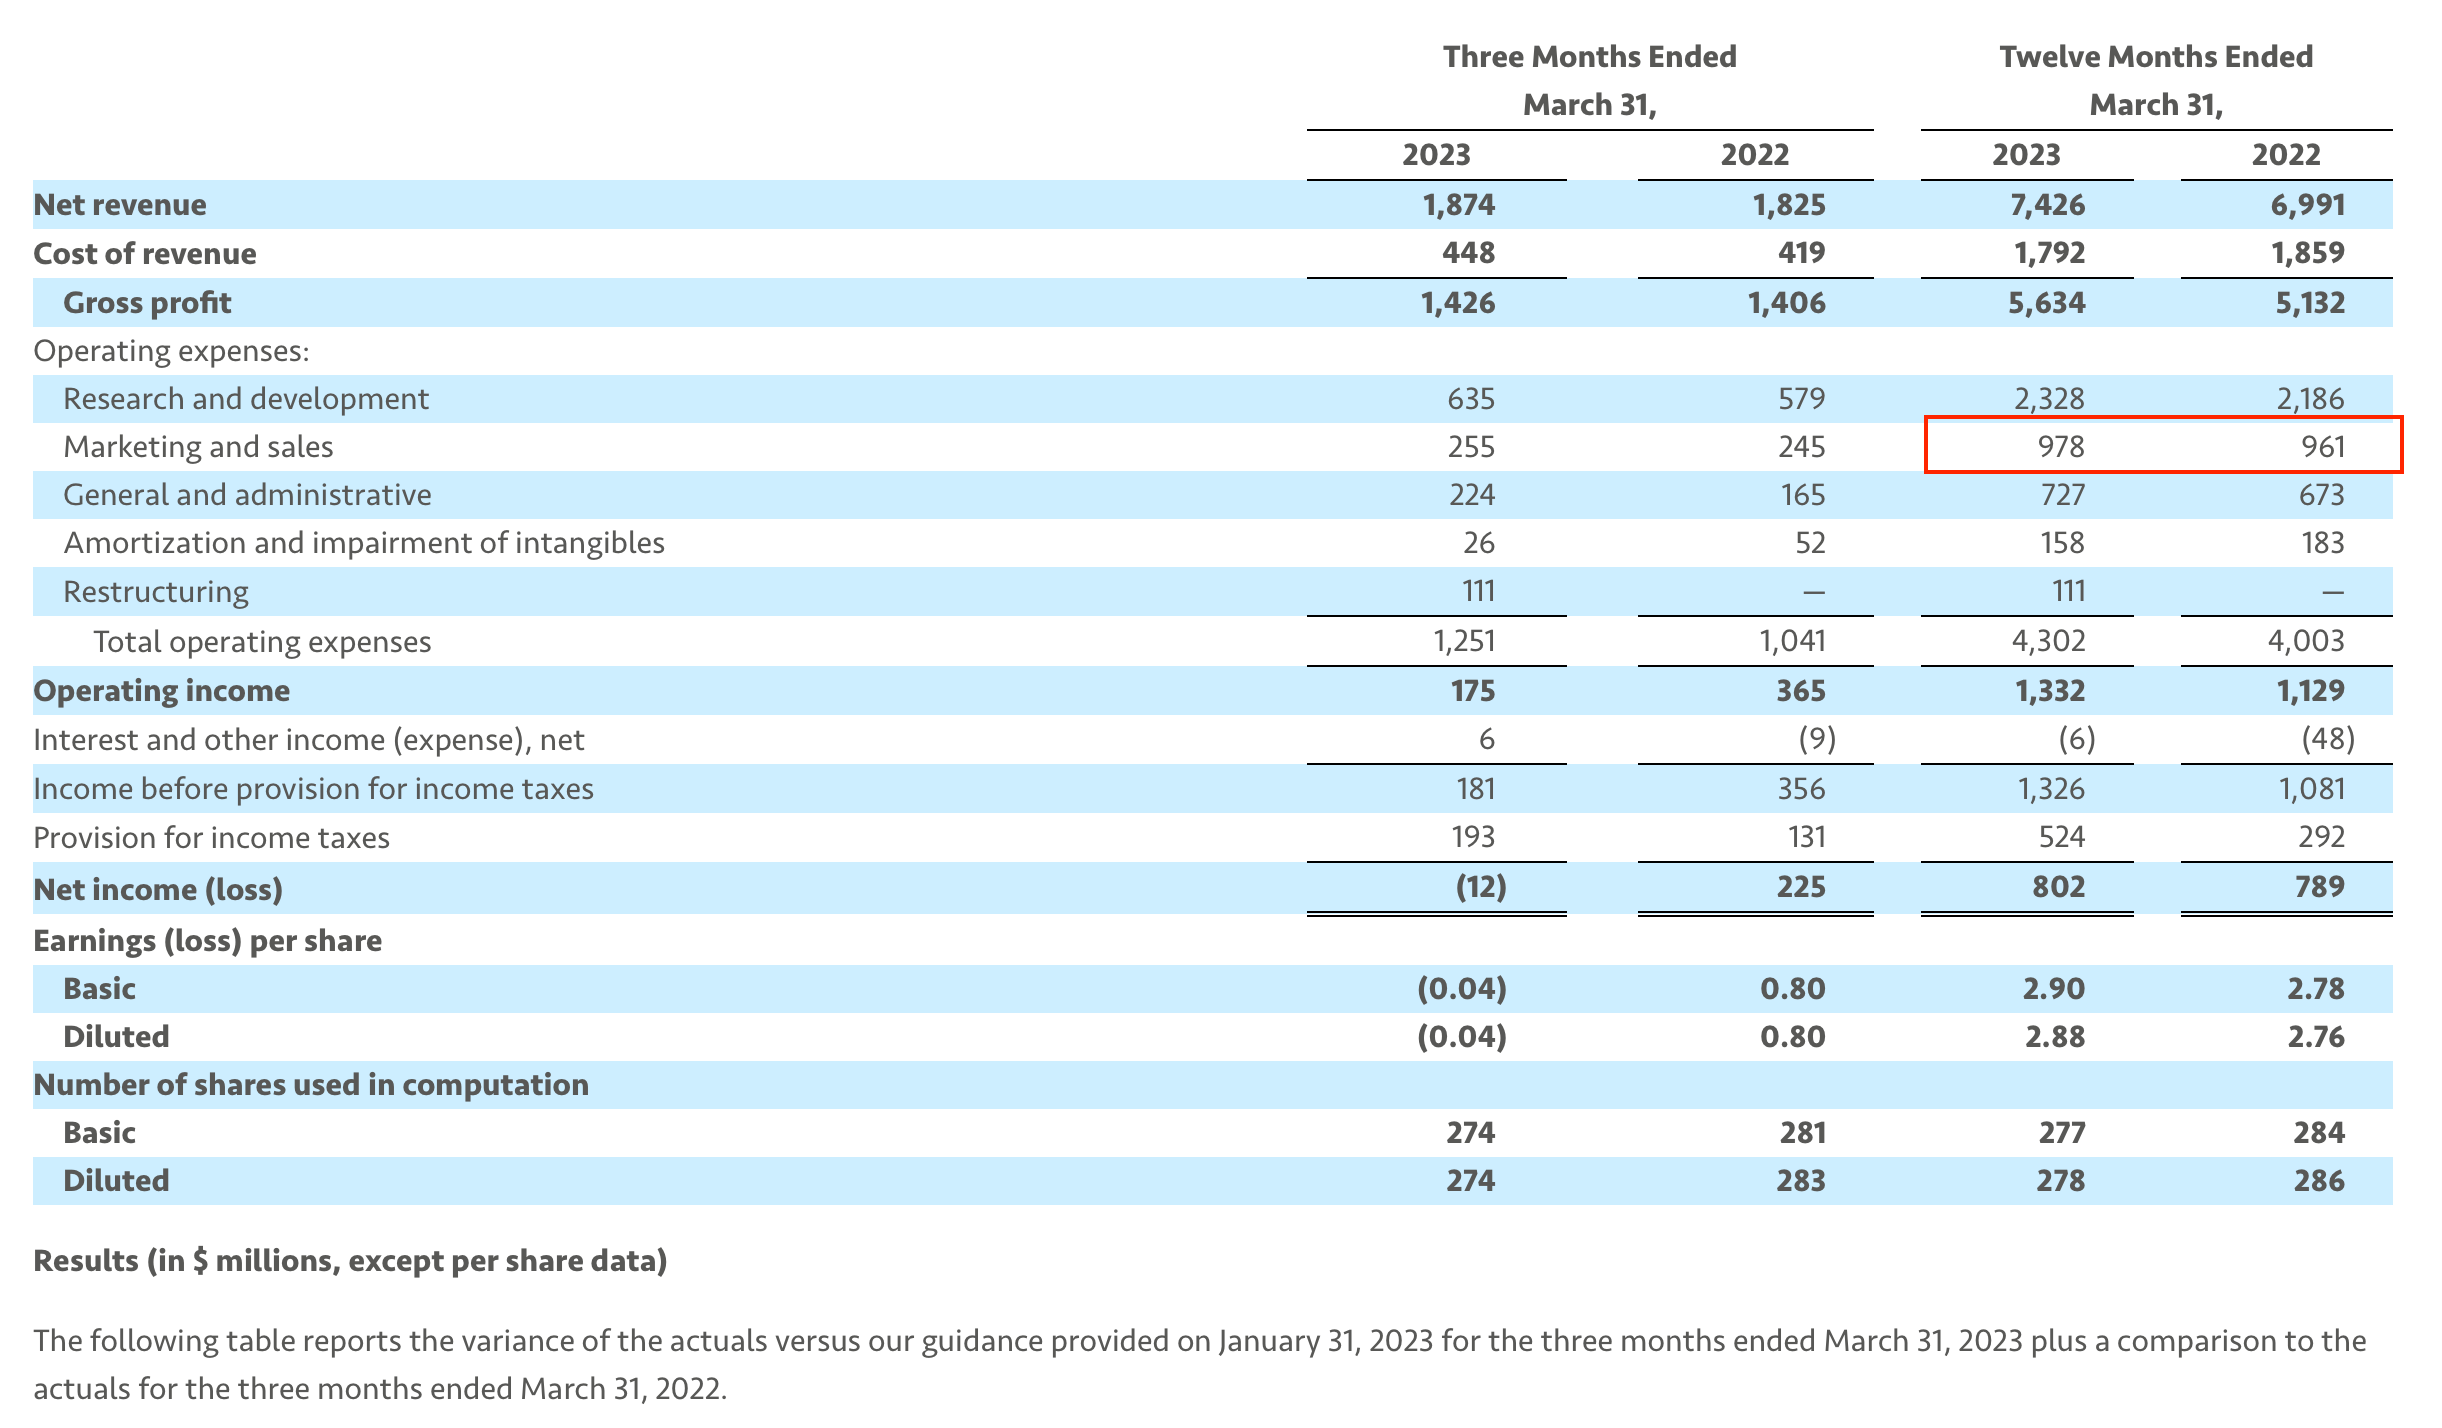
❗️Considering that EA spent $978 million on marketing and sales in the 2023 fiscal year, I’m very skeptical that only 6.4% of the budget was allocated to promoting its PC/console games in the USA, one of the company's key markets.
Advertising for Live-Service, Cross-Platform, Transmedia, and Sports IP
Fortnite set a record for spending in Q4'23, with campaigns for Fortnite OG and LEGO Fortnite.
miHoYo ranked third in spending in May 2023 with their game Honkai: Star Rail, surpassed only by P&G and Amazon. Most of the advertising budget for Honkai: Star Rail in 2023, 95%, was allocated to mobile devices.
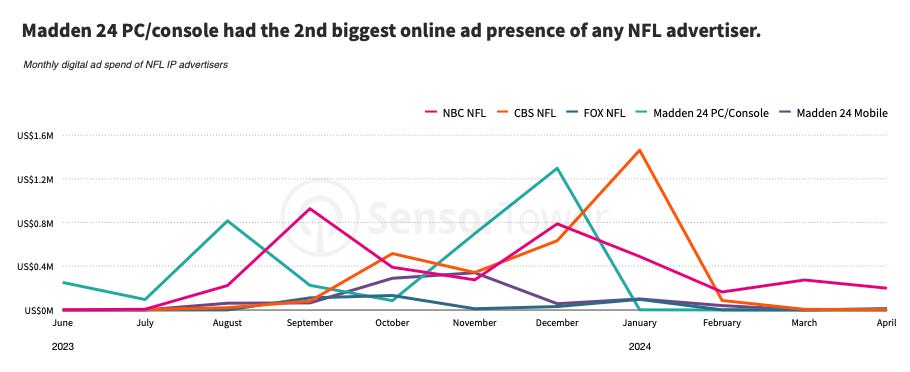
Madden NFL 24 on PC and consoles became the second-largest advertiser in the USA in the NFL segment, only behind the CBS Sports channel.
Case Study: Hogwarts Legacy - Q1'23
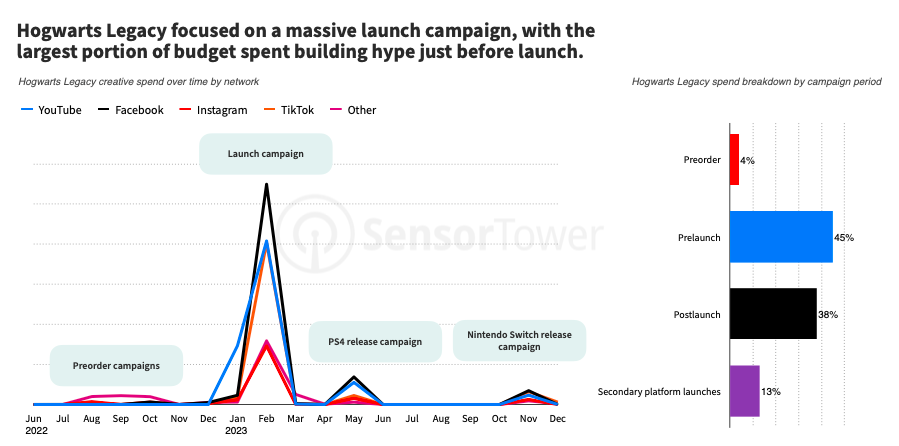
4% of the advertising budget went to promoting pre-orders; 45% on advertising before launch; 38% on post-launch advertising; 13% on launching on new platforms (PS4, Switch).
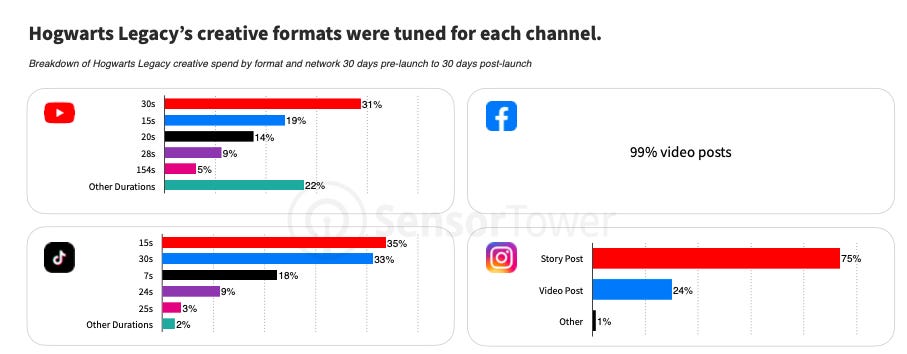
Hogwarts Legacy's marketing was adapted to different channels. For example, on TikTok, the focus was on short 15-second videos. On YouTube, most of the budget went to 30-second videos. And on Instagram - to Stories.
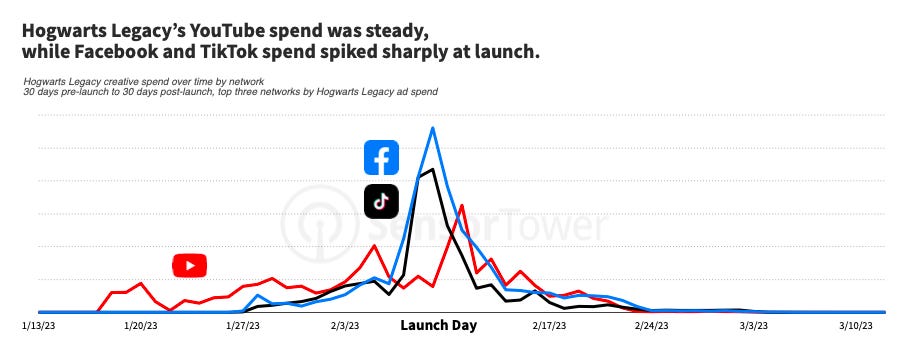
The marketing for the project on YouTube was relatively stable, while on Facebook and TikTok, peaks were associated with pre-launch campaigns.
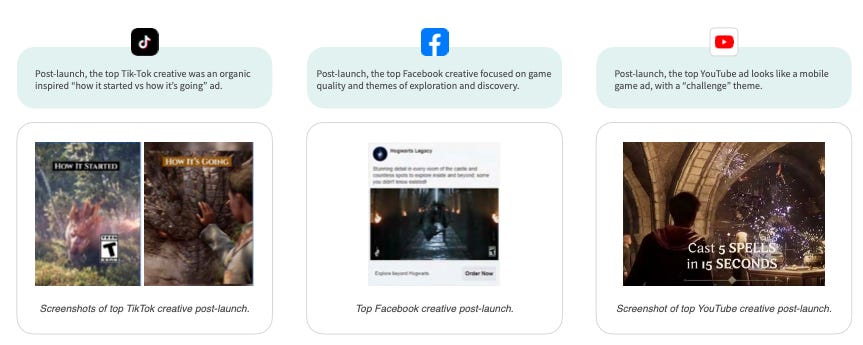
Hogwarts Legacy marketers carefully tailored the creative content for each channel. It varied between Facebook, TikTok, and YouTube. The partnership with PlayStation was also heavily highlighted.
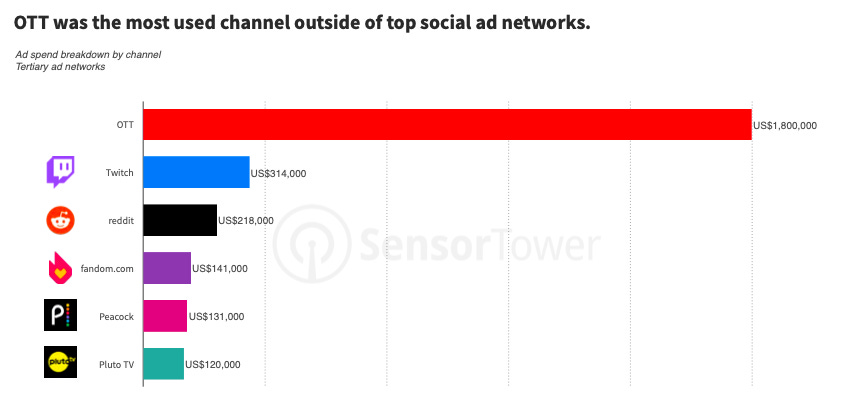
OTT became the most popular advertising channel outside the major social networks ($1.8 million). Interestingly, only $314,000 was spent on Twitch.
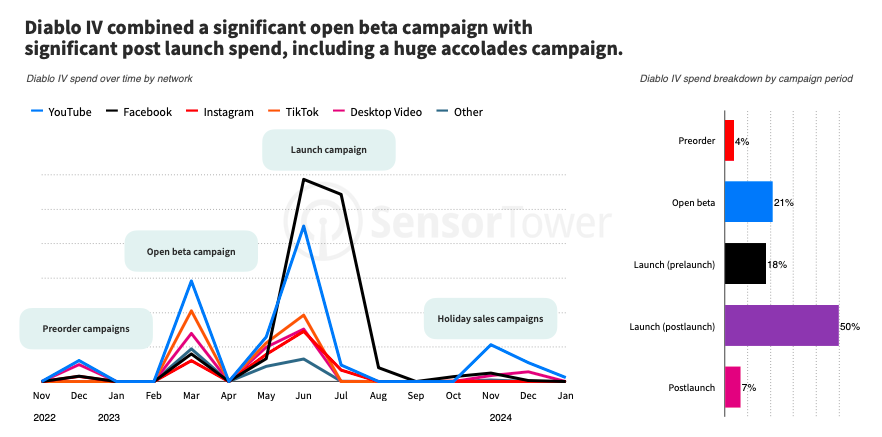
Case Study: Diablo IV - Q2'23
In the advertising creatives, the company positioned Diablo IV as a “return to the dark atmosphere of Diablo II.”
The marketing budgets were distributed as follows: 4% of the total budget went to pre-orders; 21% to open beta advertising; 18% to pre-launch advertising; 50% to launch advertising; and 7% to post-launch advertising.
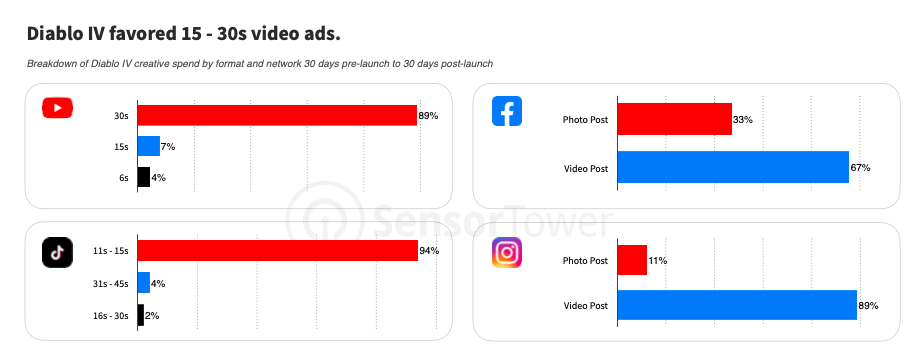
On YouTube, the preference was for 30-second videos; on TikTok, for videos up to 15 seconds.
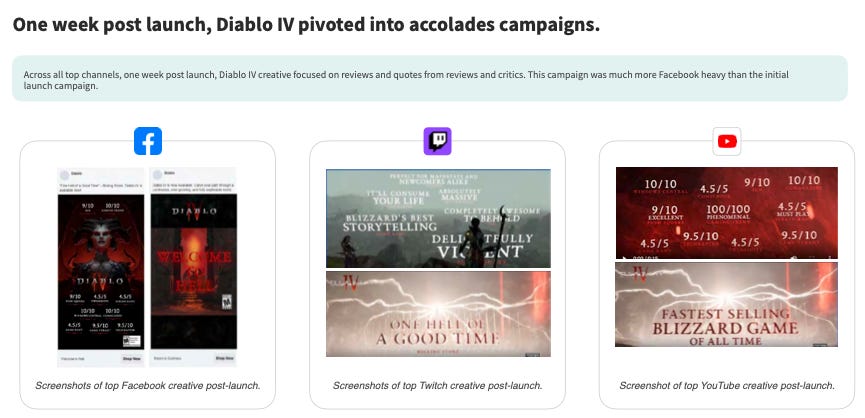
A week after the release, Diablo IV marketers launched a campaign highlighting the project's acclaim from the press.
The game was actively involved in sales promotions after its release.
Case Study: Starfield - Q3'23
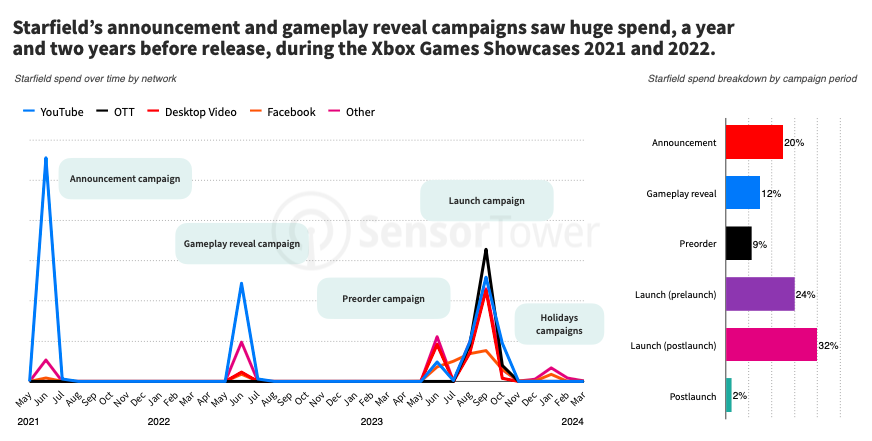
Advertising expenses for promoting the project were spread out over time. 20% of the budget was spent on the announcement in 2021; then in June 2022, 12% was spent highlighting a gameplay trailer. 9% of the budget went to pre-orders; 24% to pre-launch advertising; 32% to launch advertising; and 2% to post-launch advertising.
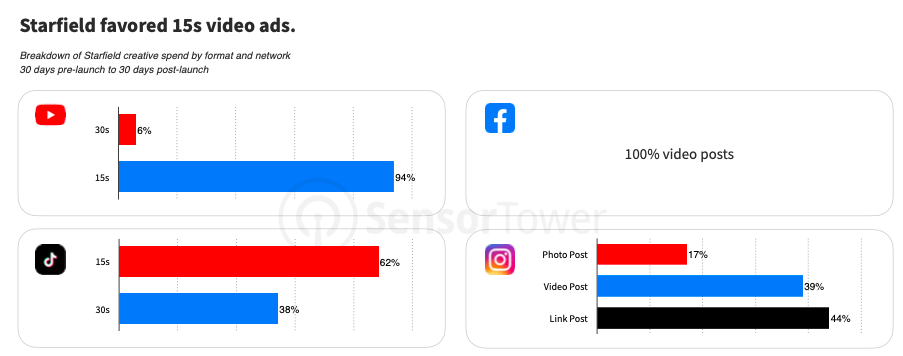
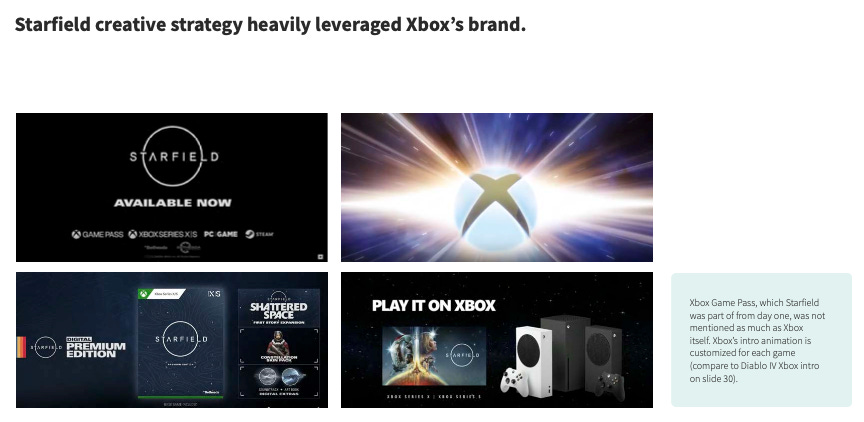
In advertising campaigns, Starfield focused on 15-second videos showcasing gameplay footage and live-action creatives. The Xbox brand was prominently featured.
Case Study: Call of Duty: Modern Warfare III - Q4'23
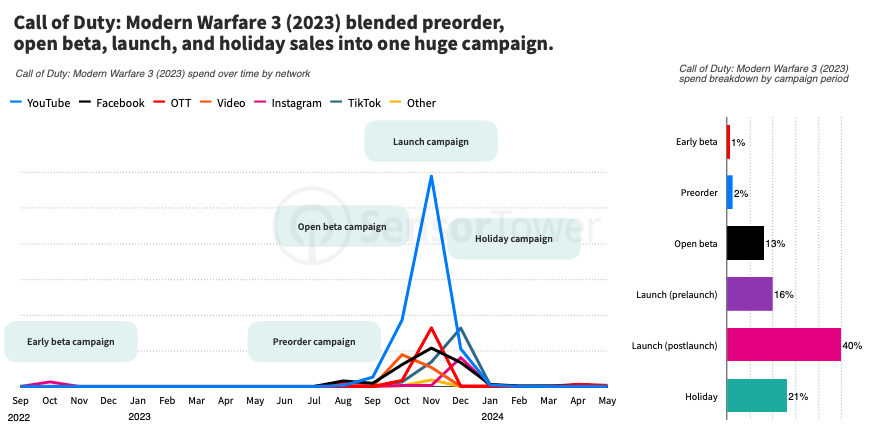
The advertising campaign for the project was very concentrated. 3% of the budget went to the early beta (1%) and pre-orders (2%). 13% was spent on the open beta; 16% on pre-launch advertising; 40% on launch advertising; and 20% on advertising during the holiday season.
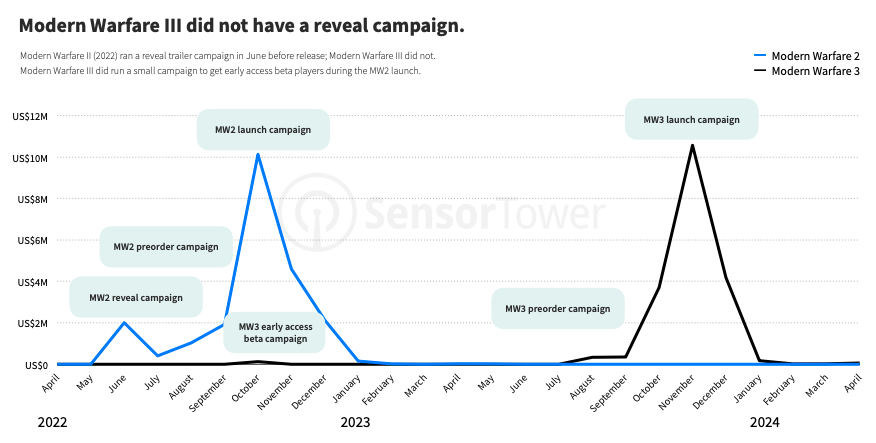
Interestingly, there was no advertising campaign around the announcement of Call of Duty: Modern Warfare III.
While the marketing campaign for Call of Duty: Modern Warfare II heavily used celebrities, Modern Warfare III focused on eSports influencers.
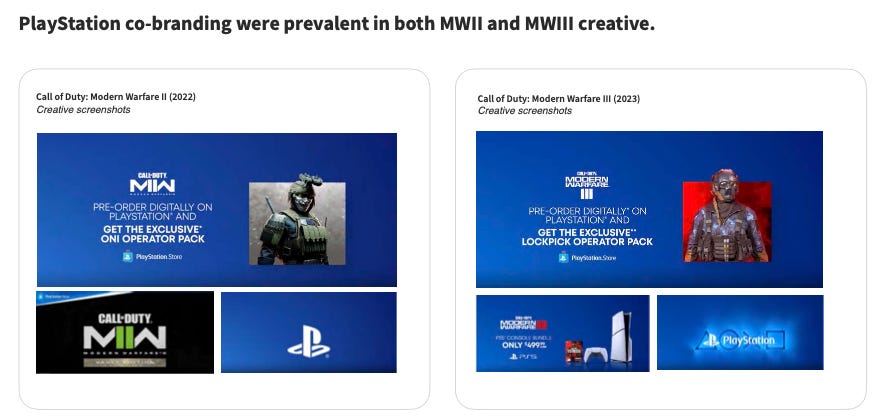
The PlayStation branding was prominently used in the creatives.
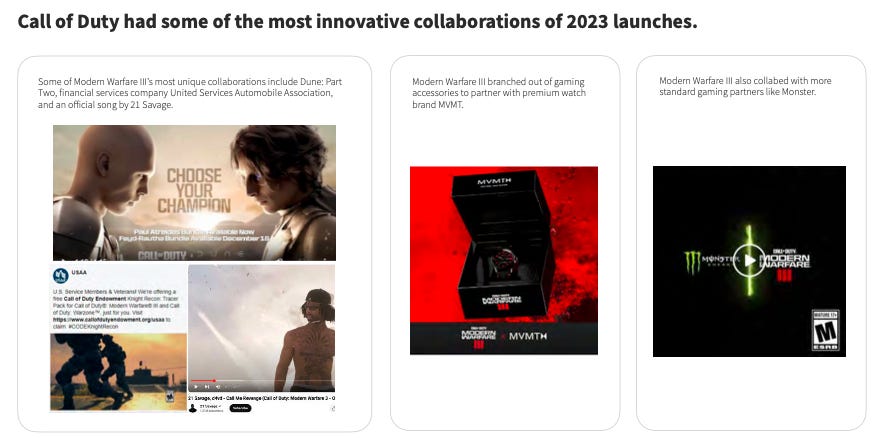
Call of Duty: Modern Warfare III had the most creative collaborations among the cases considered. The project included a song by 21 Savage; collaborations with Dune: Part II; and premium watchmaker MVMT.
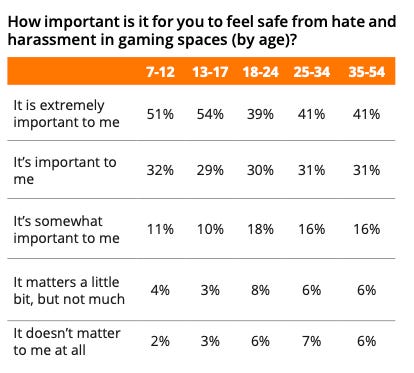
Take This & Nielsen: In games with toxic communities, people spend less money

The companies surveyed 2,408 players of different ages.
Every 4th player believes that the community should not be a place for hate and insults. More women (83%) support this view compared to men (70%). There is also a difference between age groups – the younger the player, the more important a safe environment is to them.
21% of players spend less time in games with toxic communities. A similar percentage of players refuse to spend money in games where they experience harassment. Men (22%) are more likely to make this decision than women (13%).
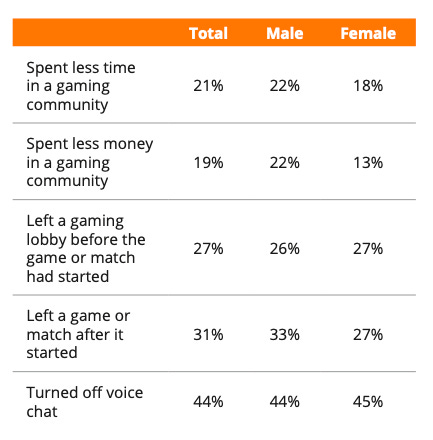
3 out of 10 players leave game lobbies when they encounter insults.
GameAnalytics: Key Roblox & Games for Roblox metrics in 2023
The GameAnalytics report analyzed thousands of projects that use the company's analytics tools. Among the selected projects, 60 have more than 10 million MAU, and 300 have more than 1 million MAU. In total, over 4 billion game sessions were analyzed.
❗️It is important to note that the selection does not include projects that do not use their analytics. Therefore, the data likely excludes projects from small or inexperienced developers.
▫️47% of Roblox players play on both mobile devices and PC. 37% play only on PC. 12% - only on mobile devices. Consoles accounted for just 1% in 2023.
❗️Official Roblox reports indicate that 78% of users play on mobile devices.
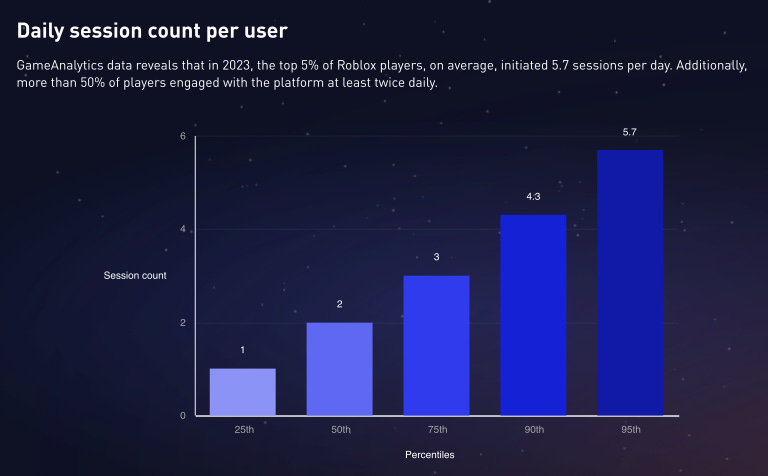
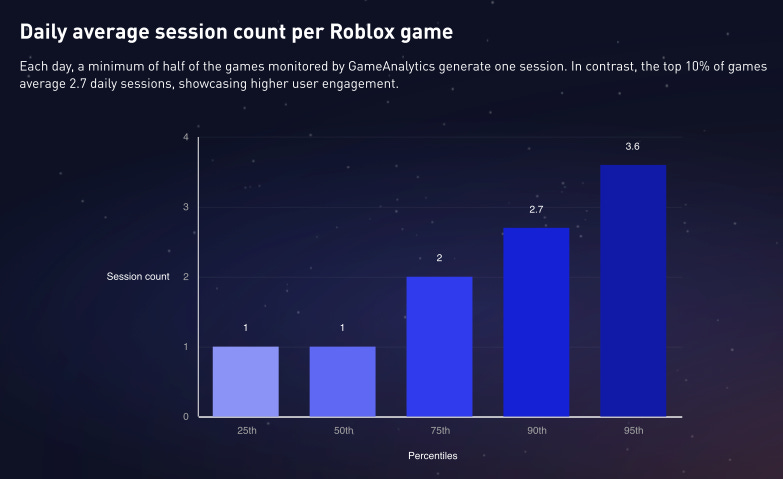
50% of players play games in Roblox at least twice a day. A quarter of players play up to 3 times a day. 5% of users engage in 5.7 sessions per day.
Consider subscribing to the GameDev Reports Premium tier to support the newsletter. Get access to the list of curated articles & archive of Gaming Reports that I’ve been collecting since 2020.
❗️Roblox previously reported that the average user spends 2.4 hours in the game per day.
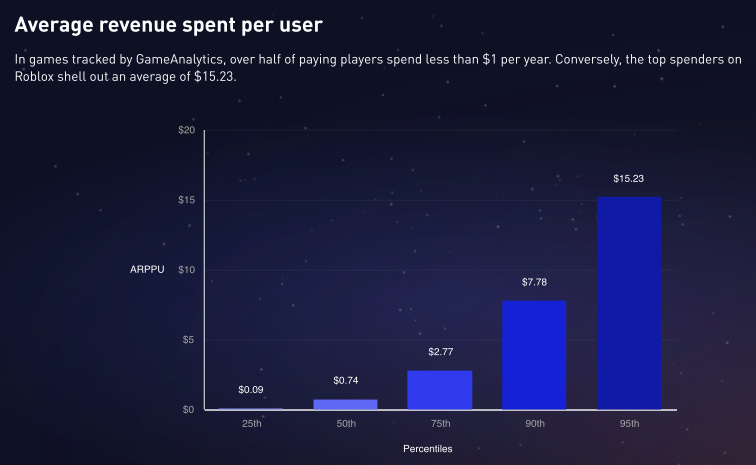
4.2% of users spend Robux (in-game currency) in games. According to GameAnalytics, more than half of Roblox users spend less than $1 per year in games (this does not include user-generated content or cosmetic items from the marketplace).
Benchmarks in Games
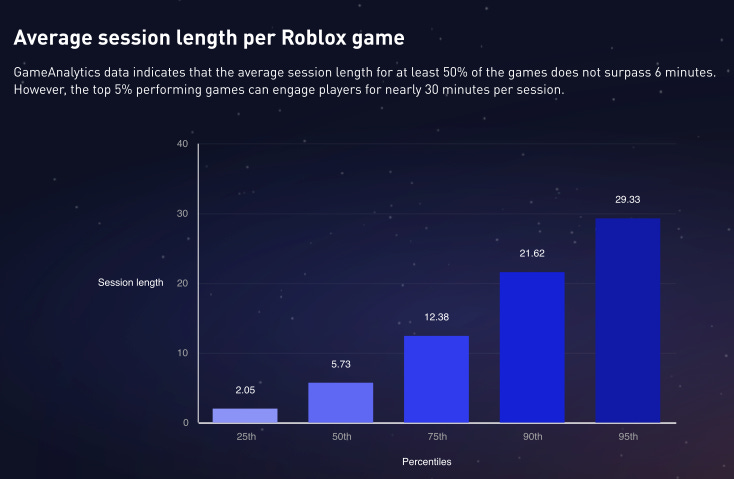
In half of the games, the average session length does not exceed 6 minutes. For the top 5% of games, it is approximately 30 minutes per session.
In the top 5% of projects, users return more than 3.5 times a day. In the top 25%, users return at least 2 times a day.
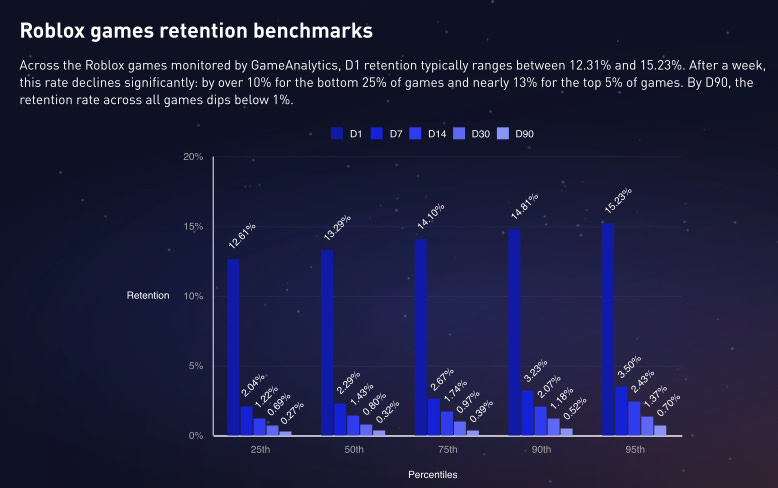
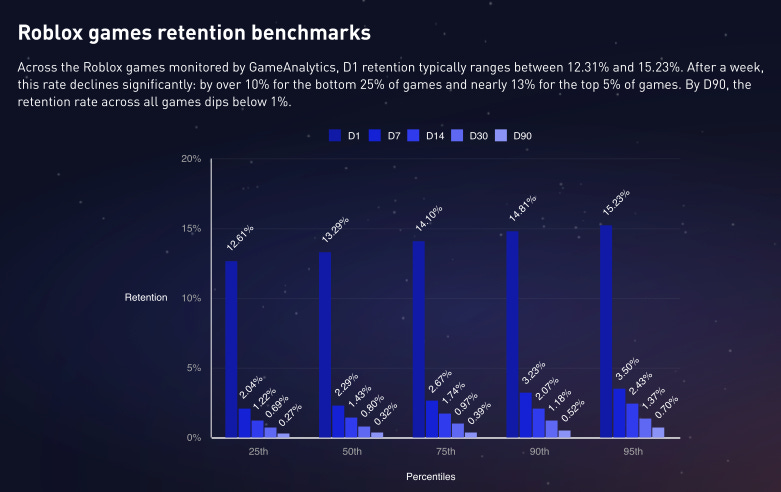
It is difficult for Roblox games to retain their audience. Only 12-15% of users return after the first day. The situation is not much better even for top games. For all the analyzed projects, even the best ones, Retention D90 (90-day retention) is less than 1%.
The top 5% of games earn $7 per year per player. But more than half report that a single player brings them $0.50 per year.