

Adjust: Mobile Games Insights Report (2025) | Sponsored by Neon
A lot of numbers for benchmarking lovers - ATT opt-in, CPM, CPI, ARPMAU, Retention & more!


The data for this study covers the period from January 2023 to March 2025. The study included more than 5,000 apps.
General market details
By the end of 2024, mobile devices account for 49% of all gaming revenue. Consoles make up 28%, and PC accounts for 27%.
Game app downloads in 2024 grew by an average of 4% YoY. Growth leaders are MENA (+10% YoY), LATAM (+8% YoY), and APAC (+4% YoY). Downloads are declining in Europe (–1% YoY) and North America (–11% YoY).

❗️Previously, Sensor Tower released a report stating that global game downloads fell by 6%.
The number of sessions decreased by 0.6%. Only Latin America (+7% YoY) and the MENA region (+5% YoY) showed growth.
A word from the newsletter sponsor

Neon is more than just another DTC provider for games. Our webshop, checkout, and merchant-of-record solutions are designed to attract players, increase conversions, and build long-term loyalty. The result is higher revenue and better profit margins. That’s why top studios like Metacore, PerBlue, and Space Ape choose Neon. If your direct-to-consumer strategy hasn’t come together or isn’t delivering the results you need, we can help. Visit Neon to learn more.
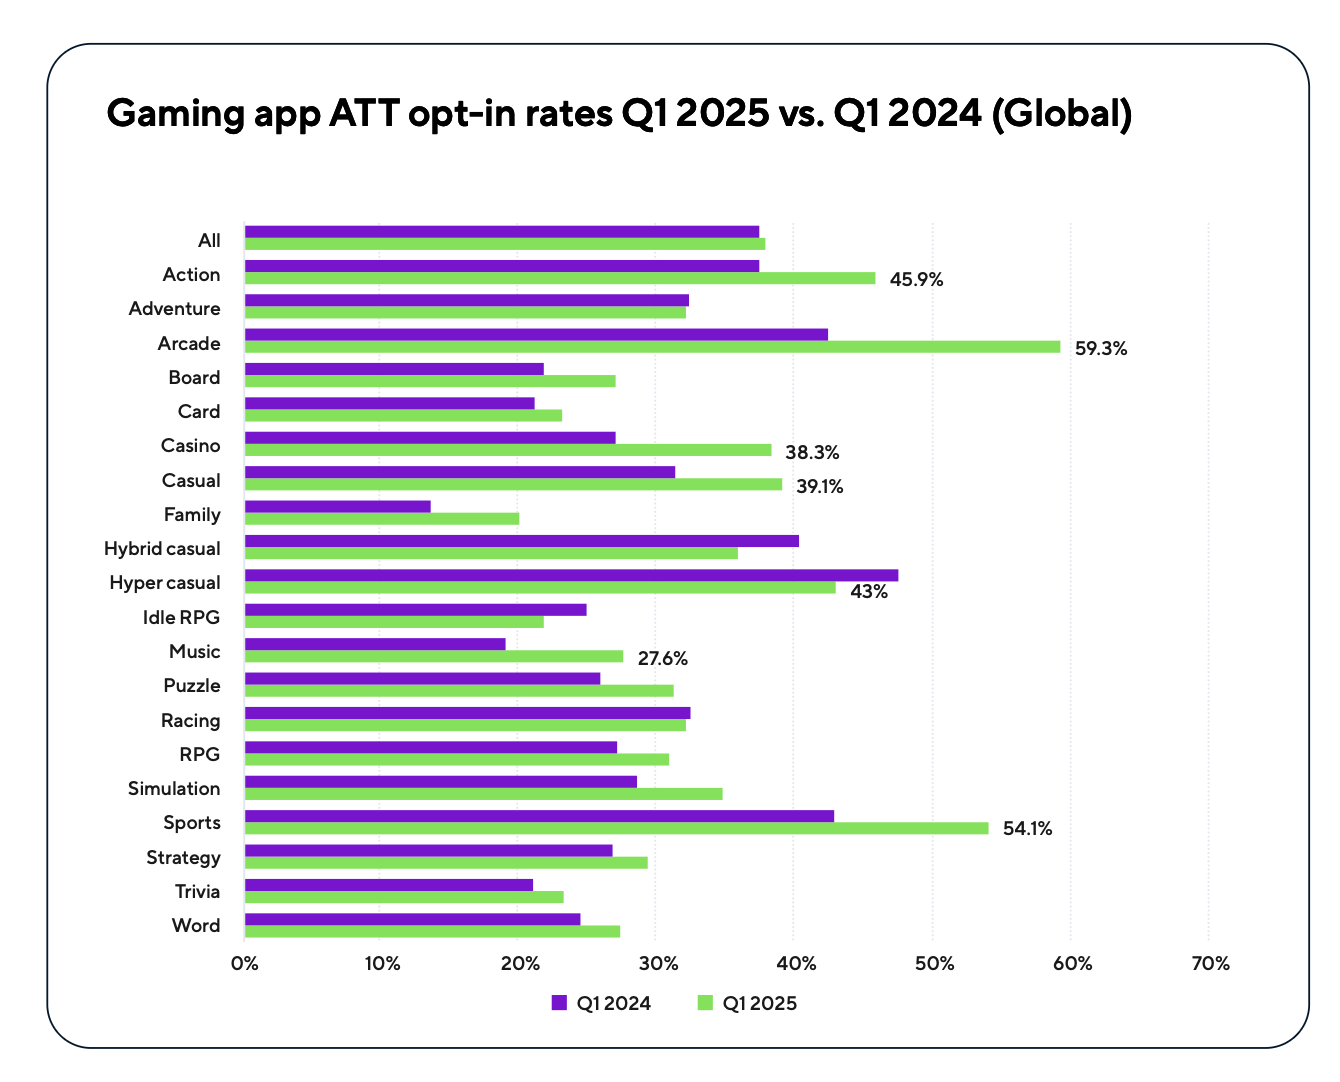
ATT Opt-in in games in Q1'25 increased to 37.9% from 37.5% in Q1'24. The growth, however, is barely noticeable. The best rates are in arcade games (59.3%), sports projects (54.1%), and action games (45.9%). ATT opt-in is not growing in all genres—some are declining (for example, Idle RPG).
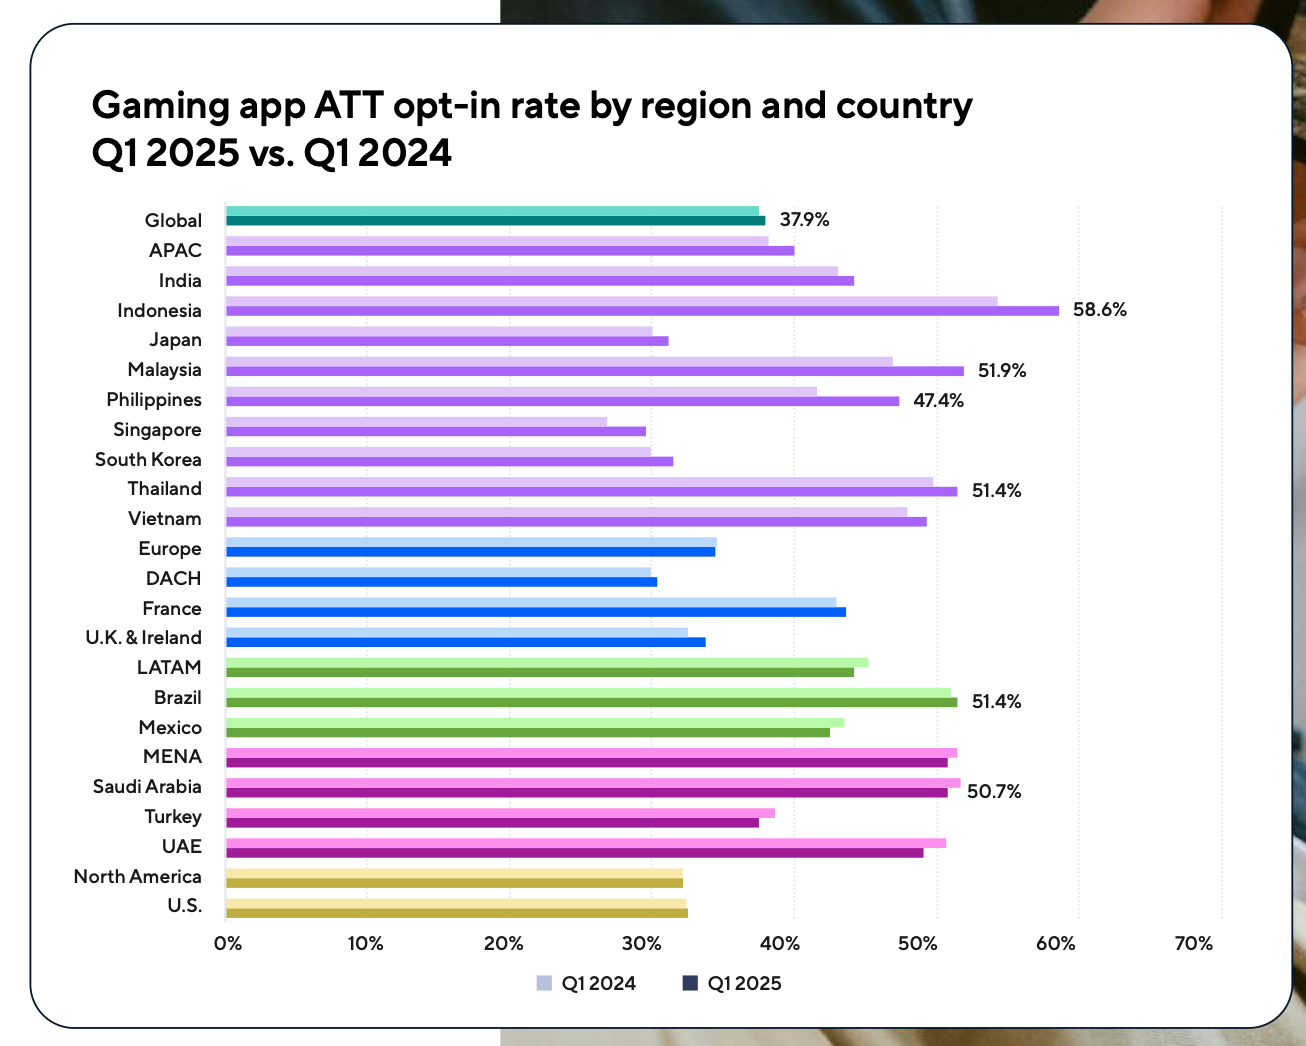
By region, Indonesia leads in ATT opt-in (58.6%), followed by Malaysia (51.9%), and Thailand and Brazil (both at 51.4%). In the US, this figure is 32% and has not changed over the past year.
Installs, Sessions, and Retention trends

In 2024, hyper-casual games continue to lead in a share of installs—accounting for 27% of all downloads. Puzzle and hybrid-casual projects each account for 11% of downloads.
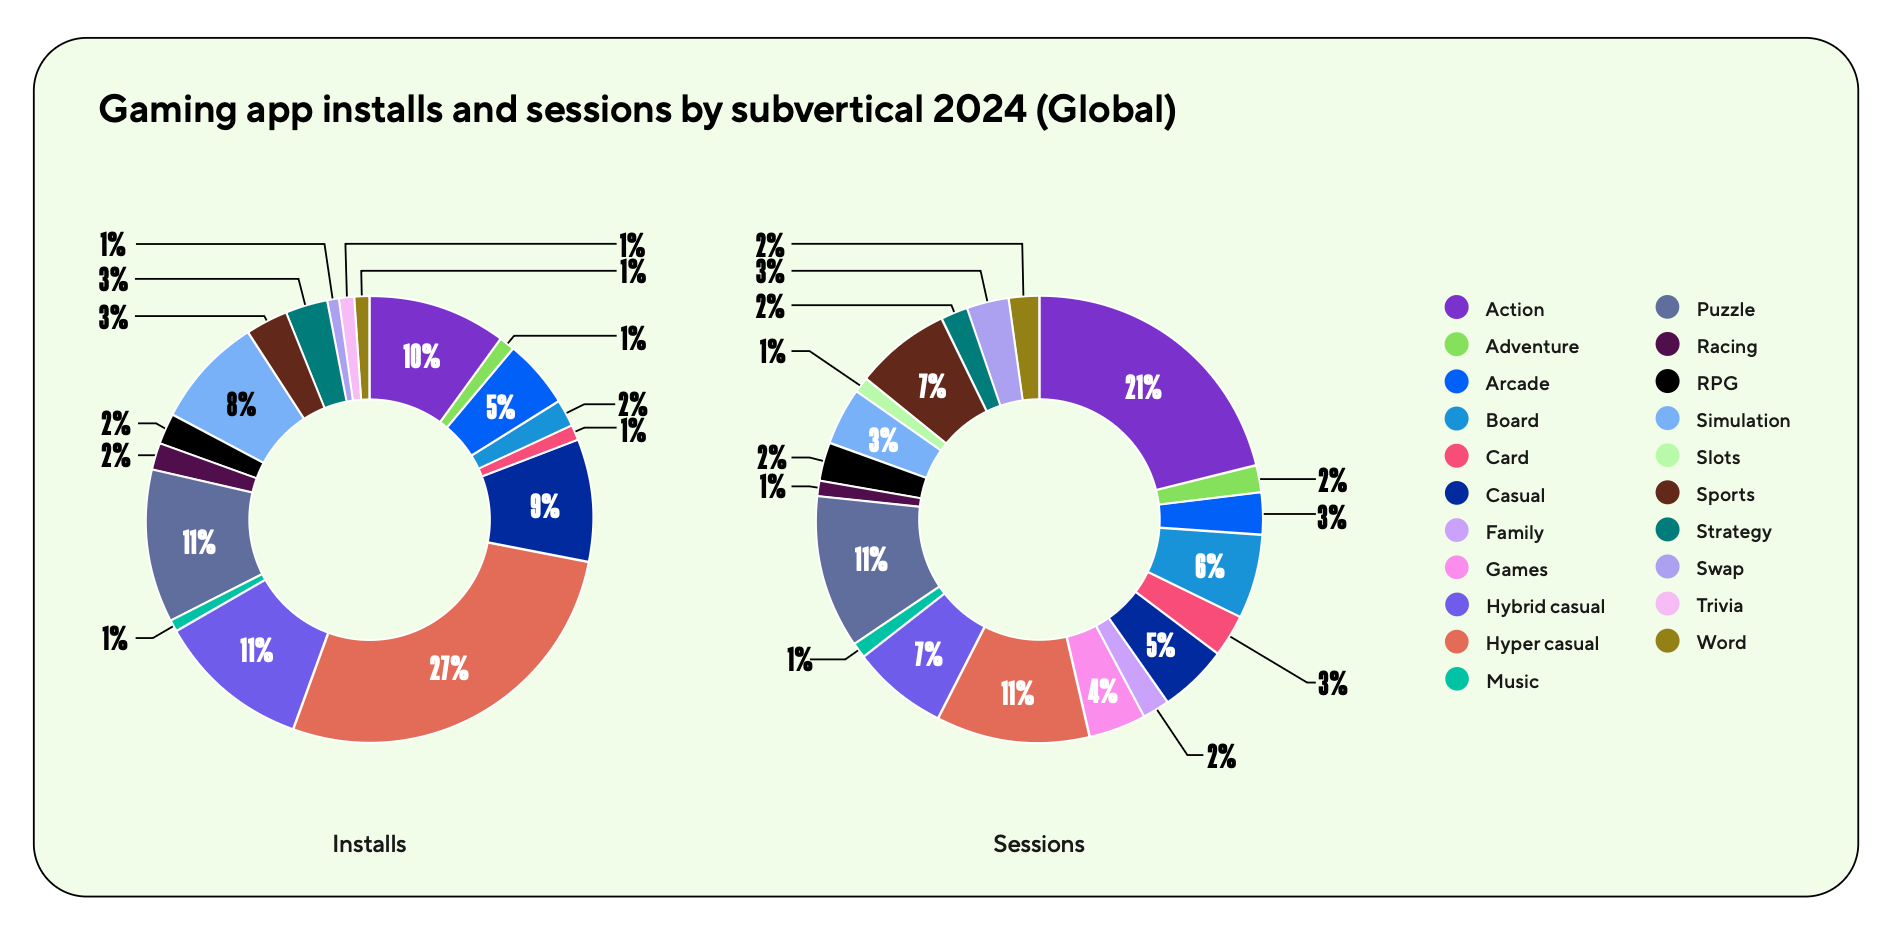
By number of sessions, action games lead (21%), followed by puzzles and hyper-casual projects (11% each).
Strategy game downloads in 2024 grew by a significant 83%. The number of sessions also increased by 17%. Adjust also notes growth in RPG downloads (+32% YoY) and simulators (+25% YoY). The biggest drops in downloads were in kids’ games (–30% YoY) and sports projects (–28% YoY).

Among countries, the largest growth in downloads is seen in Indonesia (+21% YoY), Turkey (+10% YoY), and Mexico (+8% YoY). However, most regions are declining by session numbers.

The share of re-attribution in 2024 averaged 0.02. For every 100 installs, 2 are re-attributions.

❗️There is a typo on the chart on the left—it should be 0.02, not 0.05.
The ratio of paid to organic traffic increased from 2.11 in 2023 to 2.18 in 2024. For every 100 organic users, there are now 218 paid users.

The strongest growth is in Mexico and Latin America overall—from 3.7 in 2023 to 4.32 in 2024. India is one of the few global regions where organic share increased (the ratio dropped from 3.82 in 2023 to 3.14 in 2024).
The average game session length in 2024 was 30.75 minutes—slightly higher than last year. The longest game sessions are in Indonesia (just over 45 minutes).

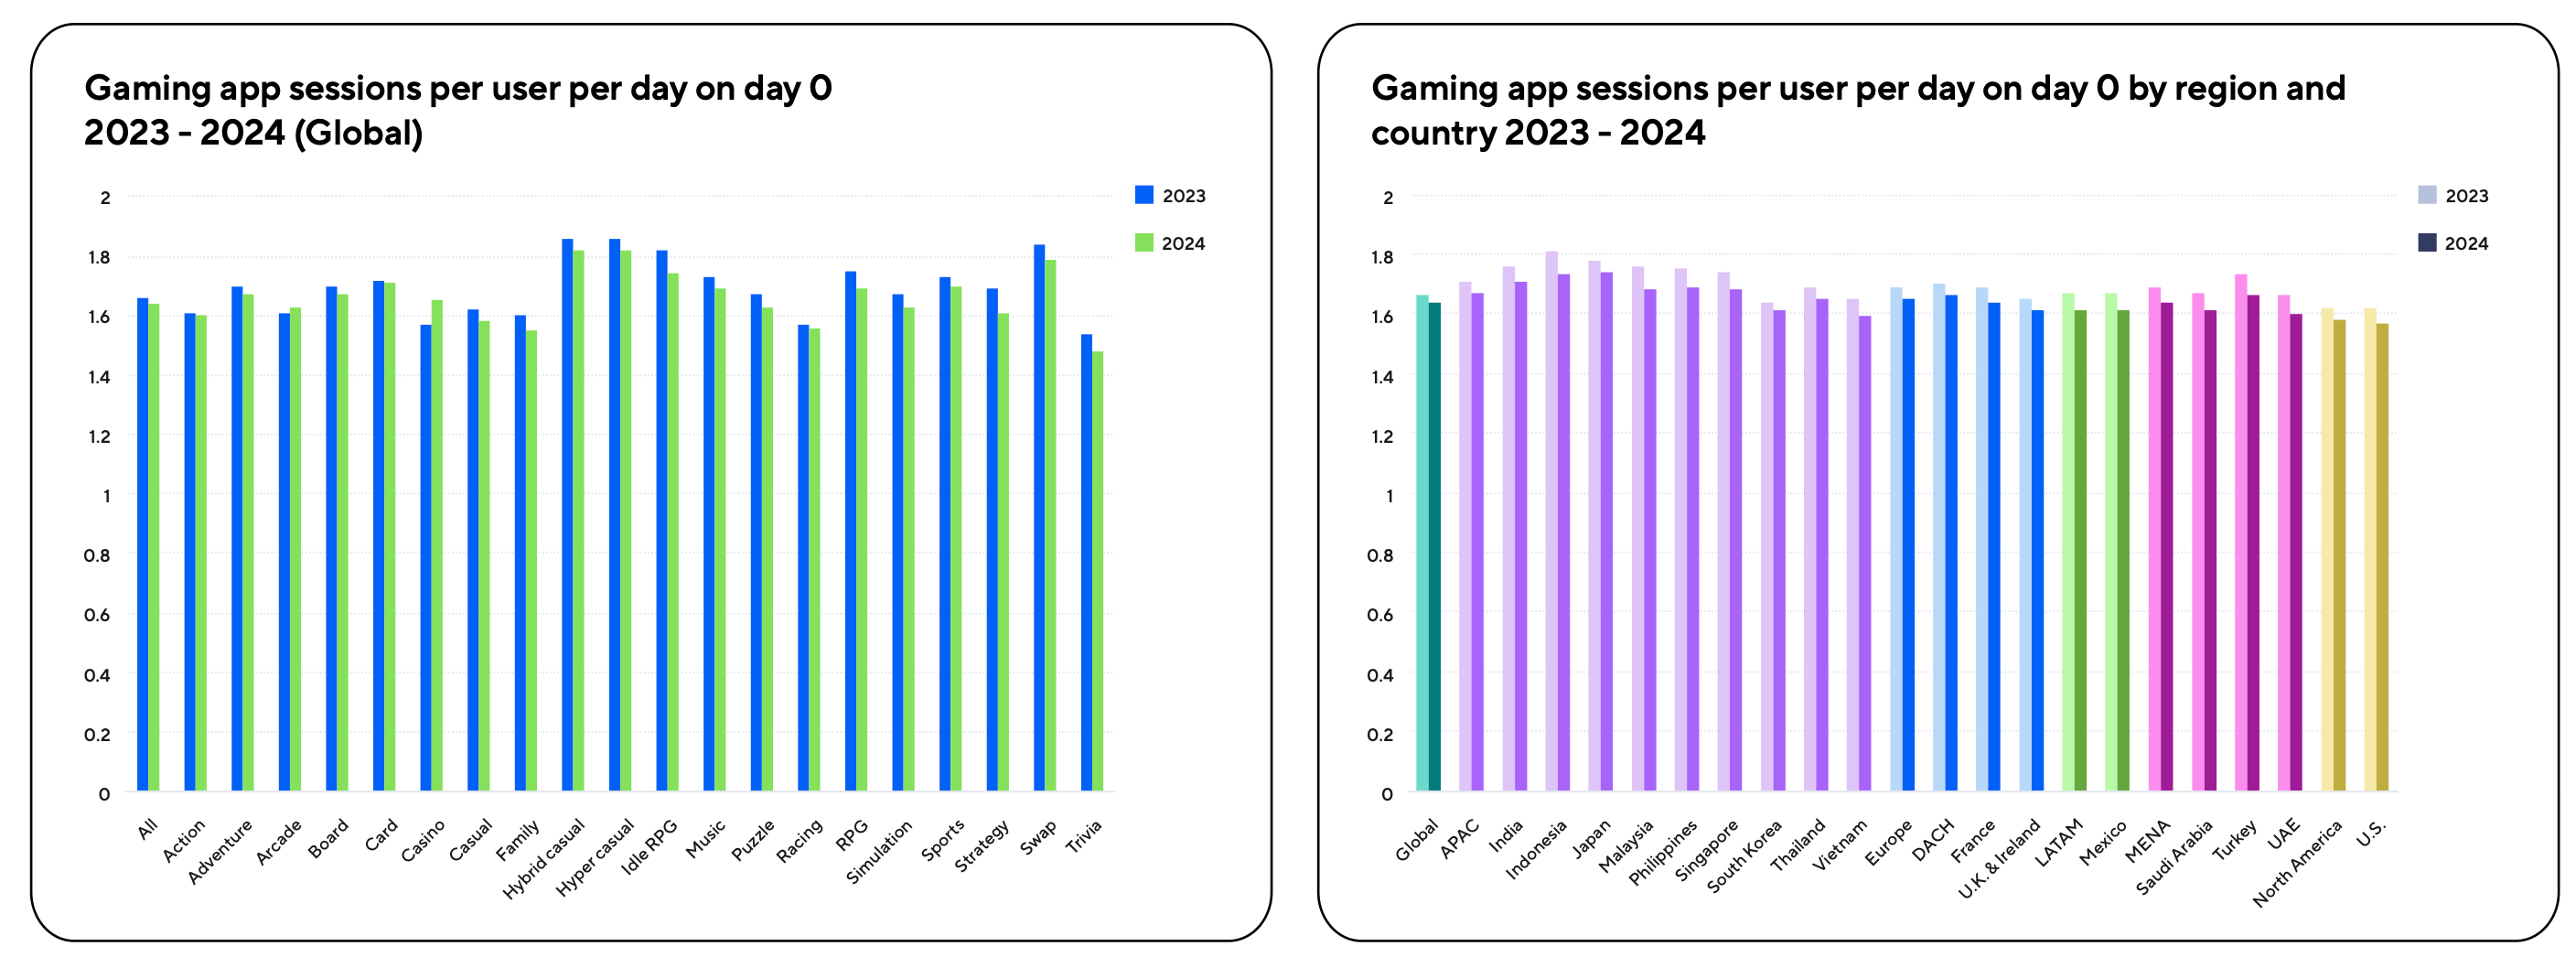
The median number of sessions by players immediately after installing a game (on Day 0) decreased from 1.66 in 2023 to 1.64 in 2024. Hyper- and hybrid-casual projects lead (1.82 sessions).
Average D1 Retention across all genres worldwide dropped from 28% to 27%. The average D30 for the market was 5%.

❗️All “average” metrics should be treated with skepticism.
UA Trends
IPM (Installs per mile) among game apps increased from 8.1 in 2023 to 8.86 in 2024. The highest IPM is in racing games (24.99 in 2024) and music games (14.41).
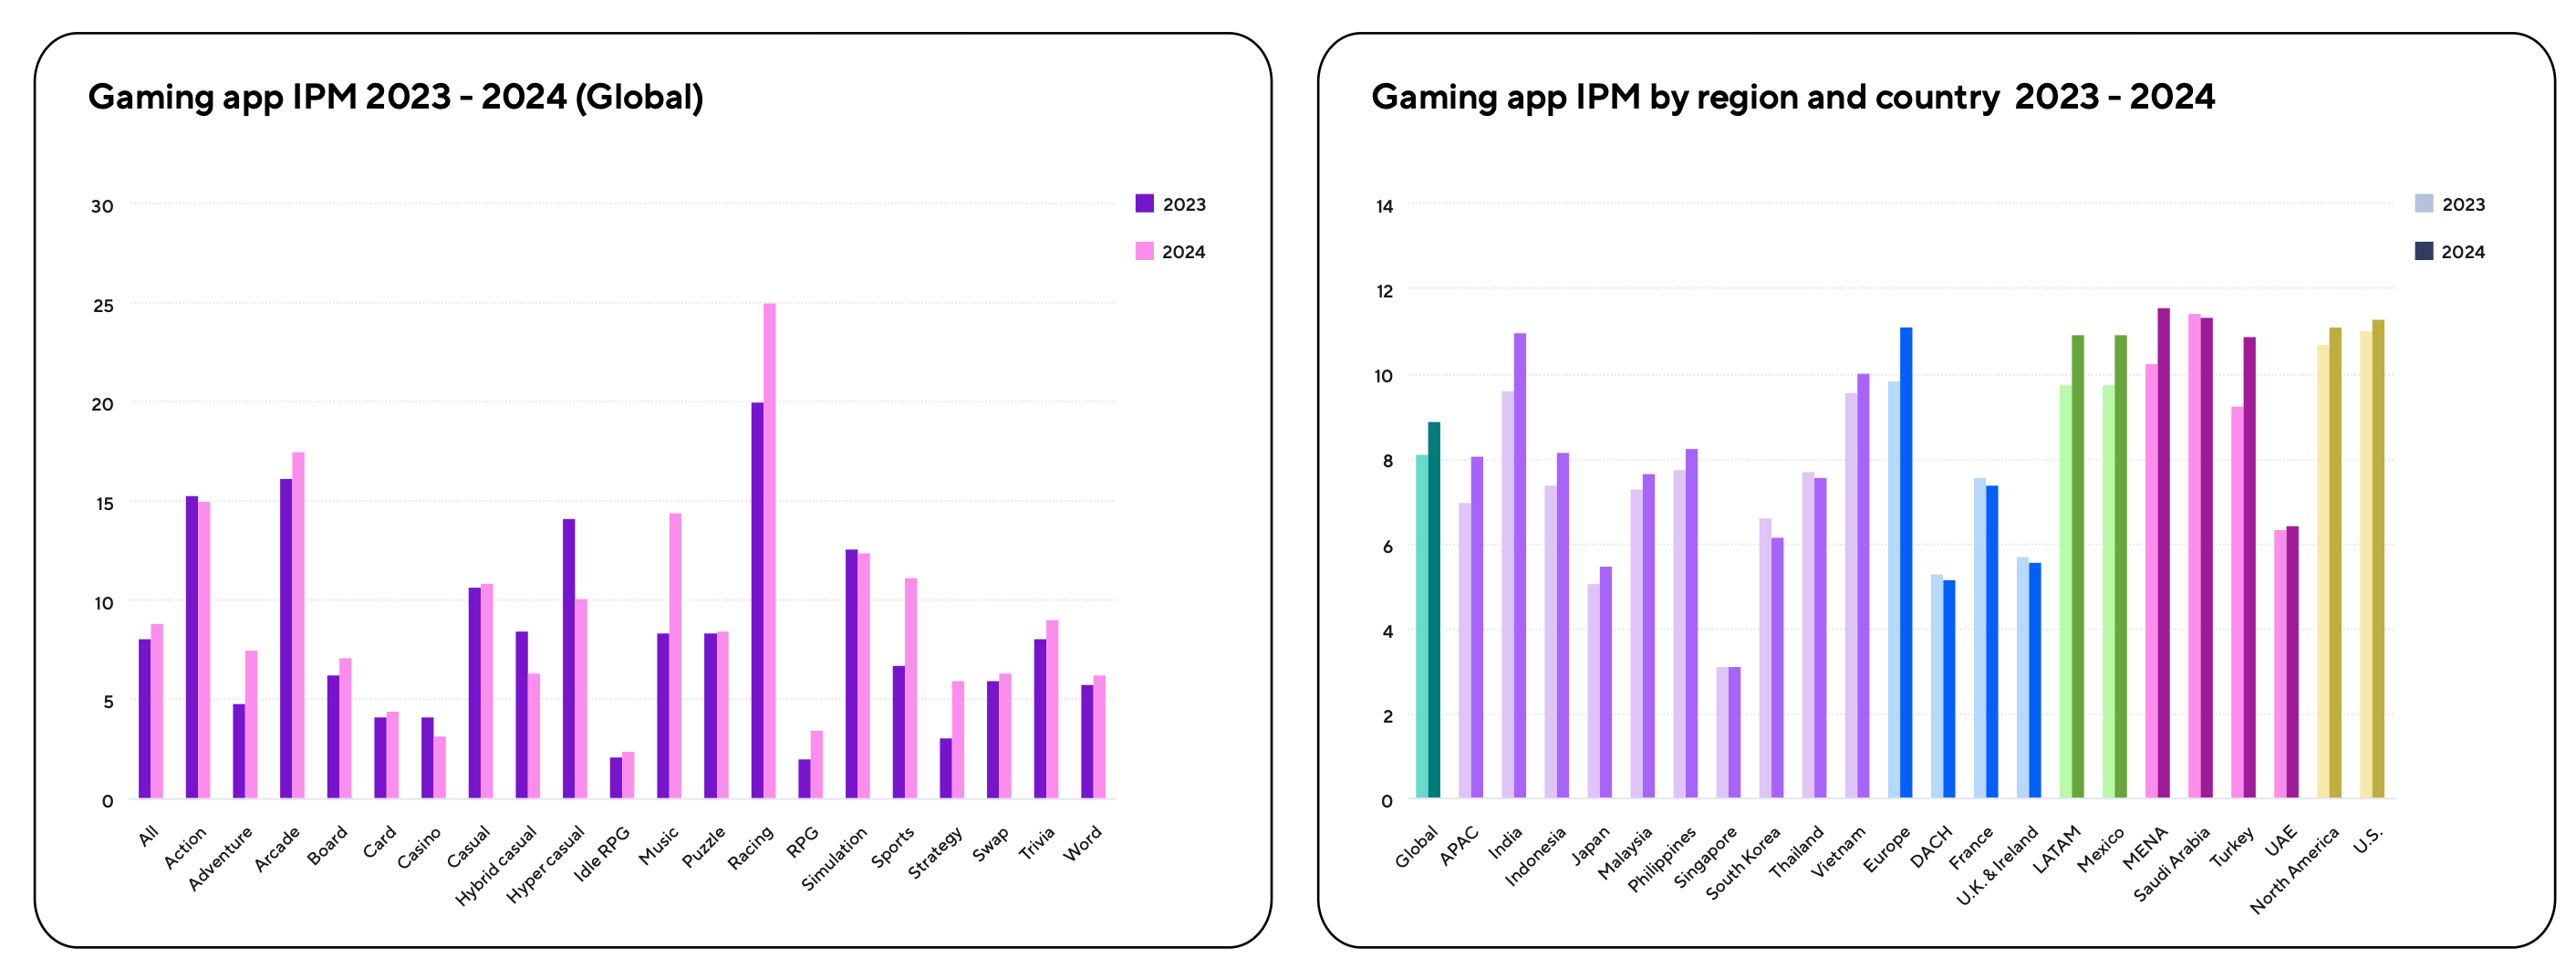
By region, the highest IPM is in the MENA region (11.56 in 2024). North America is second (11.11).
CPC among game apps in 2024 remained at a median level of $0.03. The cost dropped significantly for Idle RPG (from $0.43 to $0.24), and RPG (from $0.25 to $0.08)—which should indicate reduced competition in these genres. Interestingly, CPC also fell among strategy games (from $0.11 to $0.04)—despite growth in downloads and seemingly increased competition in the genre.
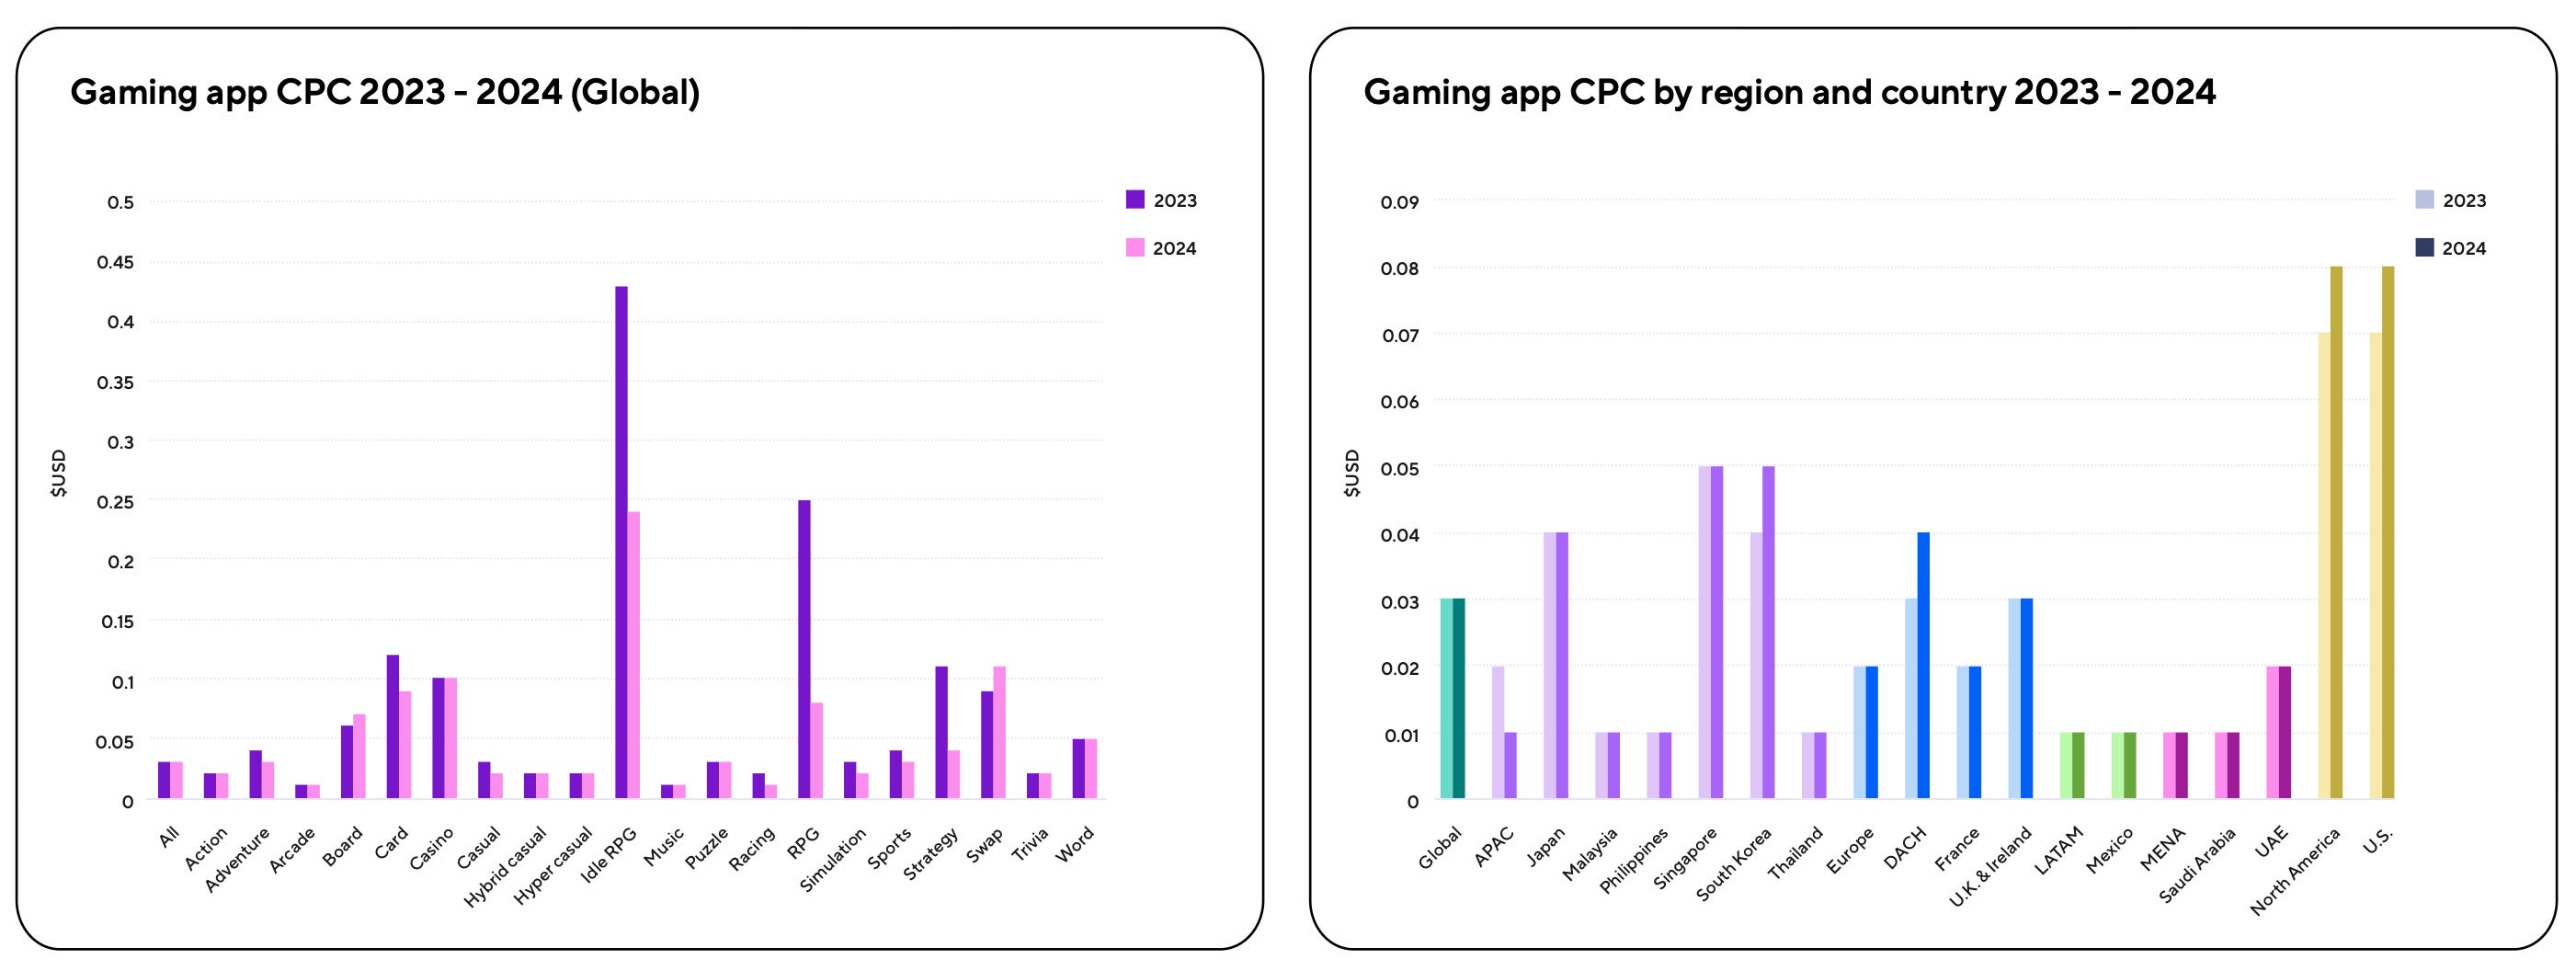
The highest CPC is in North America—and the US—at $0.08.
The average CPI in games dropped from $0.38 in 2023 to $0.36 in 2024. At the same time, CPI for hyper-casual games rose to $0.4; hybrid-casual almost doubled—to $0.95.

Record average CPI is in Singapore—$1.35. Also leading are North America ($1.2) and the DACH region ($1.2).
A word from the newsletter sponsor
Neon is more than just another DTC provider for games. Our webshop, checkout, and merchant-of-record solutions are designed to attract players, increase conversions, and build long-term loyalty. The result is higher revenue and better profit margins. That’s why top studios like Metacore, PerBlue, and Space Ape choose Neon. If your direct-to-consumer strategy hasn’t come together or isn’t delivering the results you need, we can help. Visit Neon to learn more.
The average CTR of game creatives increased from 7% to 9%. The biggest increase was in racing games (from 18% to 26%). But the leader is hybrid-casual projects (CTR—28%).

The highest CTR is in Japan (15%), followed by the US (14%).

Median CPM dropped to $3.41 in 2024. The biggest growth is in casino (from $8.01 in 2023 to $10.97 in 2024).

By country, the highest CPM is in the US ($16.21—in 2023 it was $15.66). Overall, CPM growth is seen in almost all regions in 2024. Declines are seen in some Asian countries and in Europe.
User revenue trends
In 2024, median ARPM (ad revenue per mile) decreased in most categories. The biggest drop was in board games (from $2.13 in 2023 to $0.75 in 2024). Adventure games also saw a significant drop (from $6.97 to $4.22).

Declines are also noticeable in almost all regions. A significant drop in the US (from $6.76 in 2023 to $4.71 in 2024), in the APAC region (from $2.2 to $1.57).
ARPMAU also dropped from $0.31 in 2023 to $0.28 in 2024. However, the metric grew significantly in casino (from $1.39 to $1.92) and in strategy (from $0.86 to $1.18).

In almost all countries worldwide, ARPMAU fell in 2024. The exception is the MENA region (growth from $0.15 in 2023 to $0.19 in 2024).

IAP ARPMAU (IAP average revenue per monthly active user) fell from $0.83 in 2023 to $0.58 in 2024. According to Adjust, strategy games grew significantly (from $2.6 to $5.34); RPGs also increased (from $5.36 to $6.48). The biggest drop was in board games—from $0.74 to $0.3.
❗️Previously, Sensor Tower reported that RPG IAP revenue fell by 17.3% in 2024. The data does not match. It’s a matter of sample and methodology.

All regions showed a decline in IAP ARPMAU in 2024. People are spending less—most likely due to economic instability.