

AppFigures: Mobile Gaming Market in 2025
New titles are harder to launch, and the pressure from Asia is very real.


The company analyzed the top 1,000 highest-grossing projects of 2024 across more than 100 markets. All revenue numbers in the report are Gross.
Market Overview
USA ($20.8 billion), China ($13.4 billion – iOS only), and Japan ($8.9 billion) are the world’s leading mobile markets by IAP revenue.
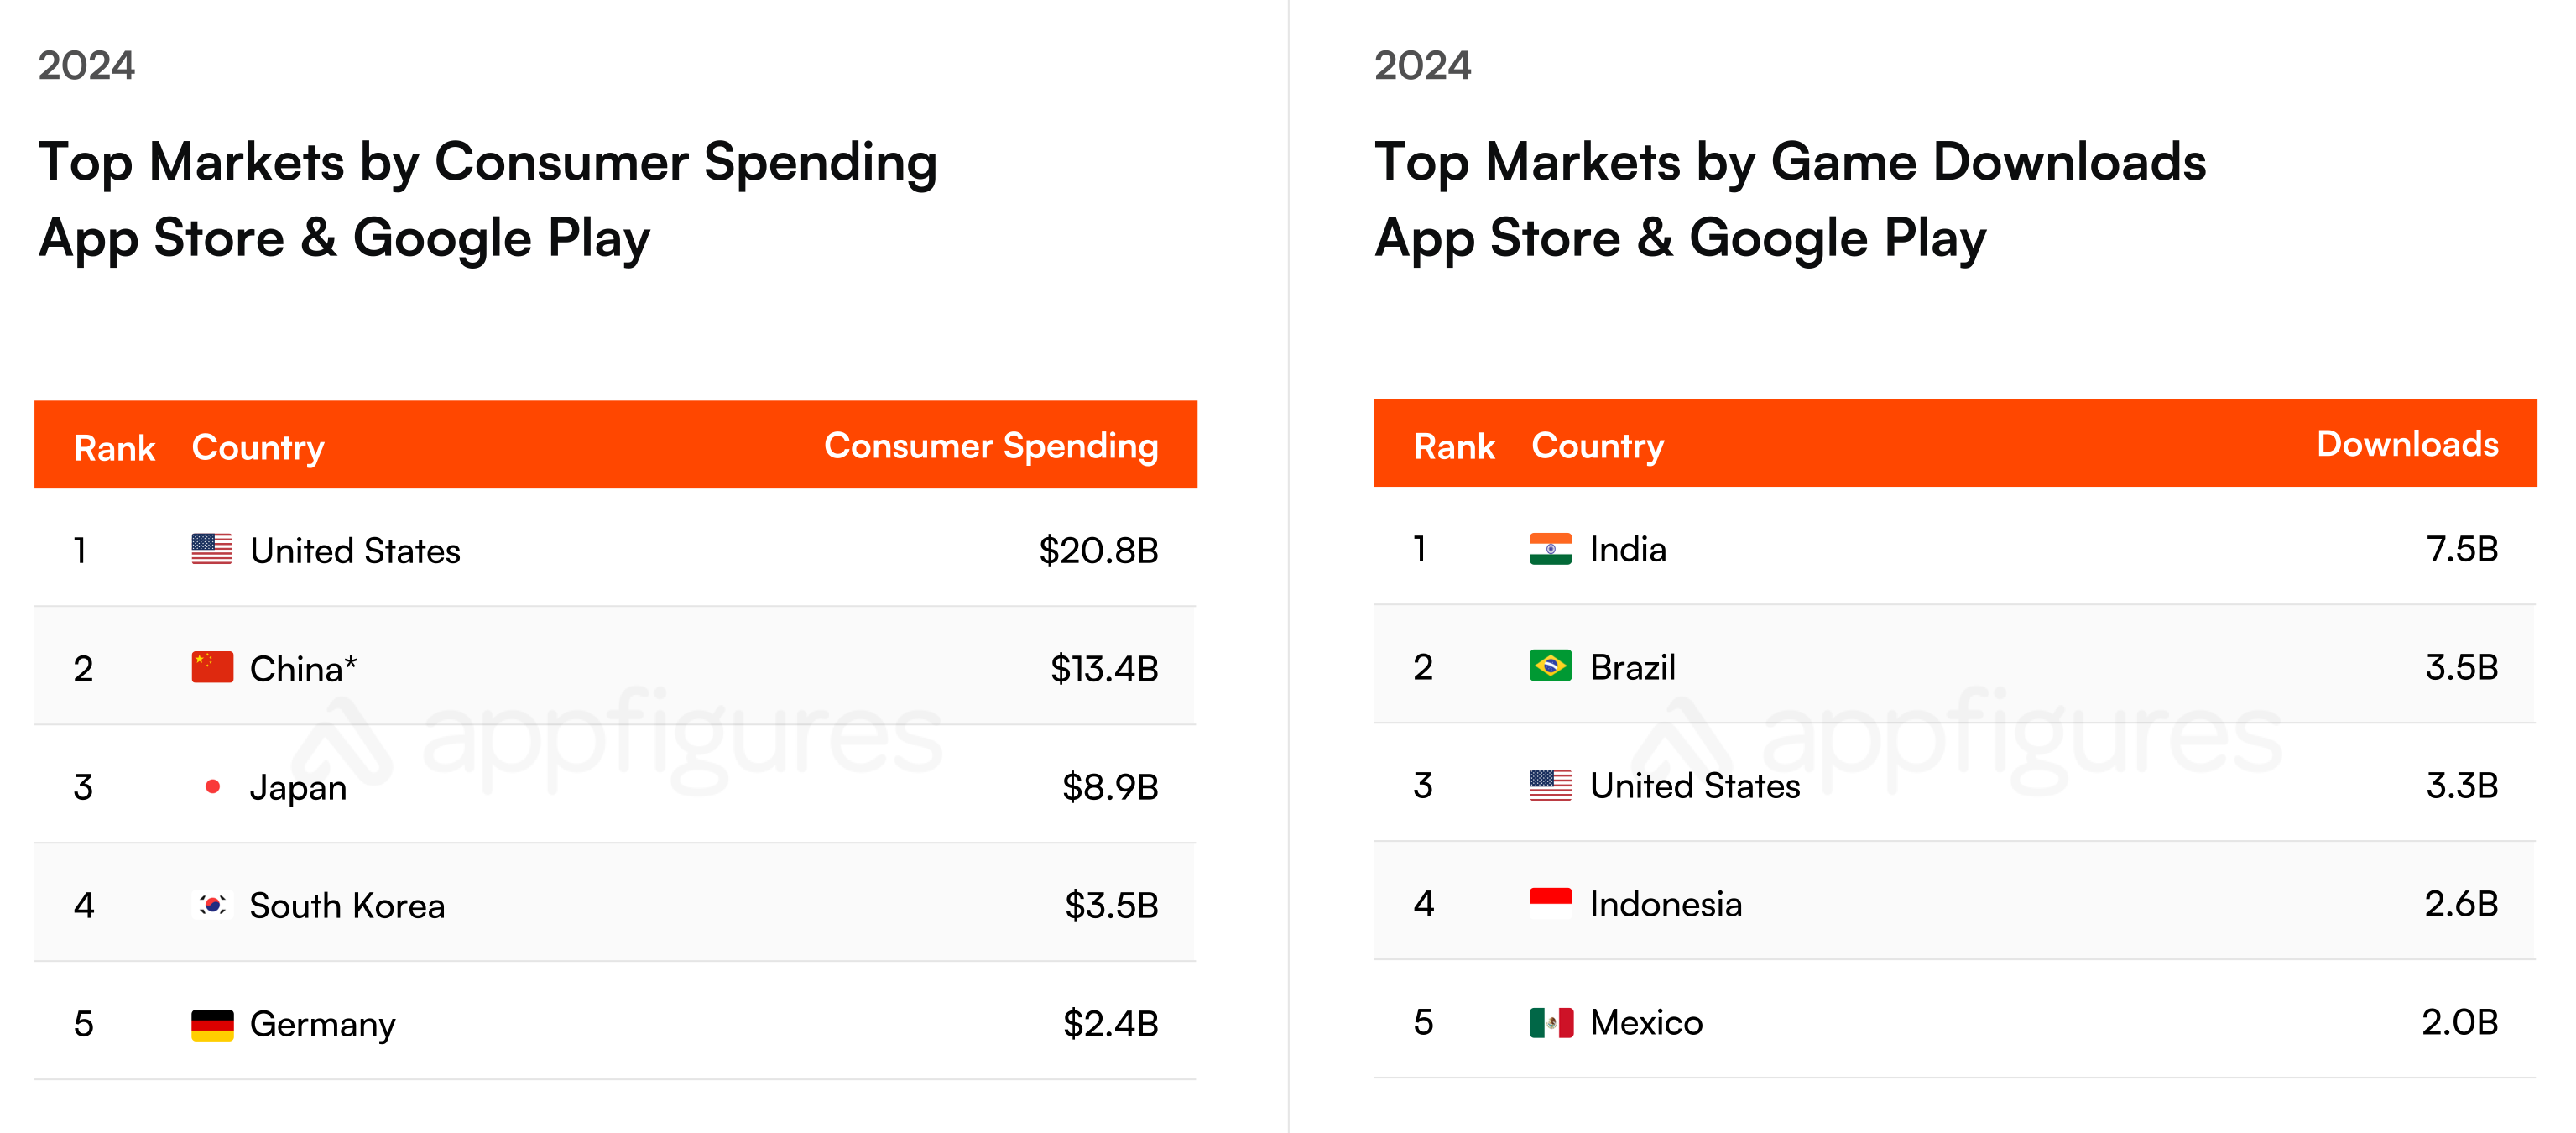
India (7.5 billion downloads), Brazil (3.5 billion downloads), and the USA (3.3 billion downloads) lead in installs.
AppFigures estimates the mobile gaming IAP market at $65.7 billion.
Global IAP revenue grew by 3.8% in 2024, from $63.3 billion to $65.7 billion.
The US market, in turn, grew by just 0.05% – from $20.7 billion to $20.8 billion.

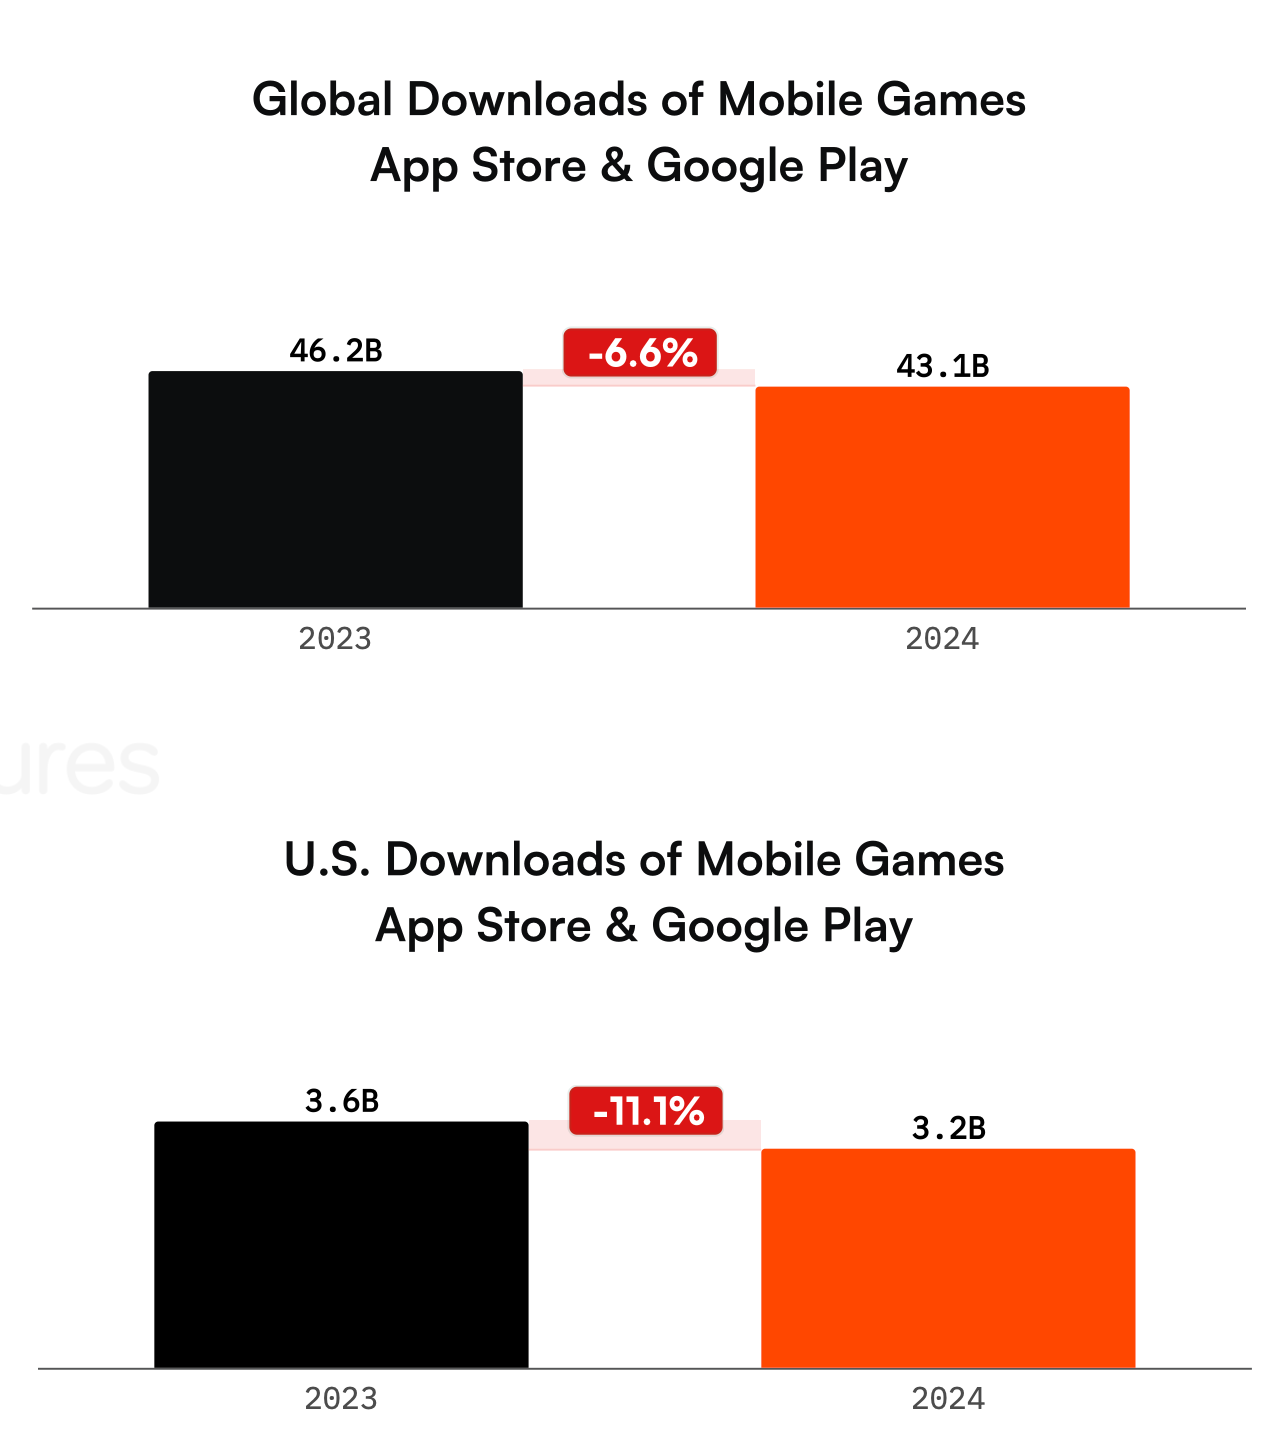
Downloads are declining. The market fell by 6.6% in 2024, from 46.2 billion installs to 43.1 billion.
The US is ahead of the trend. Downloads in the country dropped by 11.1% – from 3.6 billion to 3.2 billion.
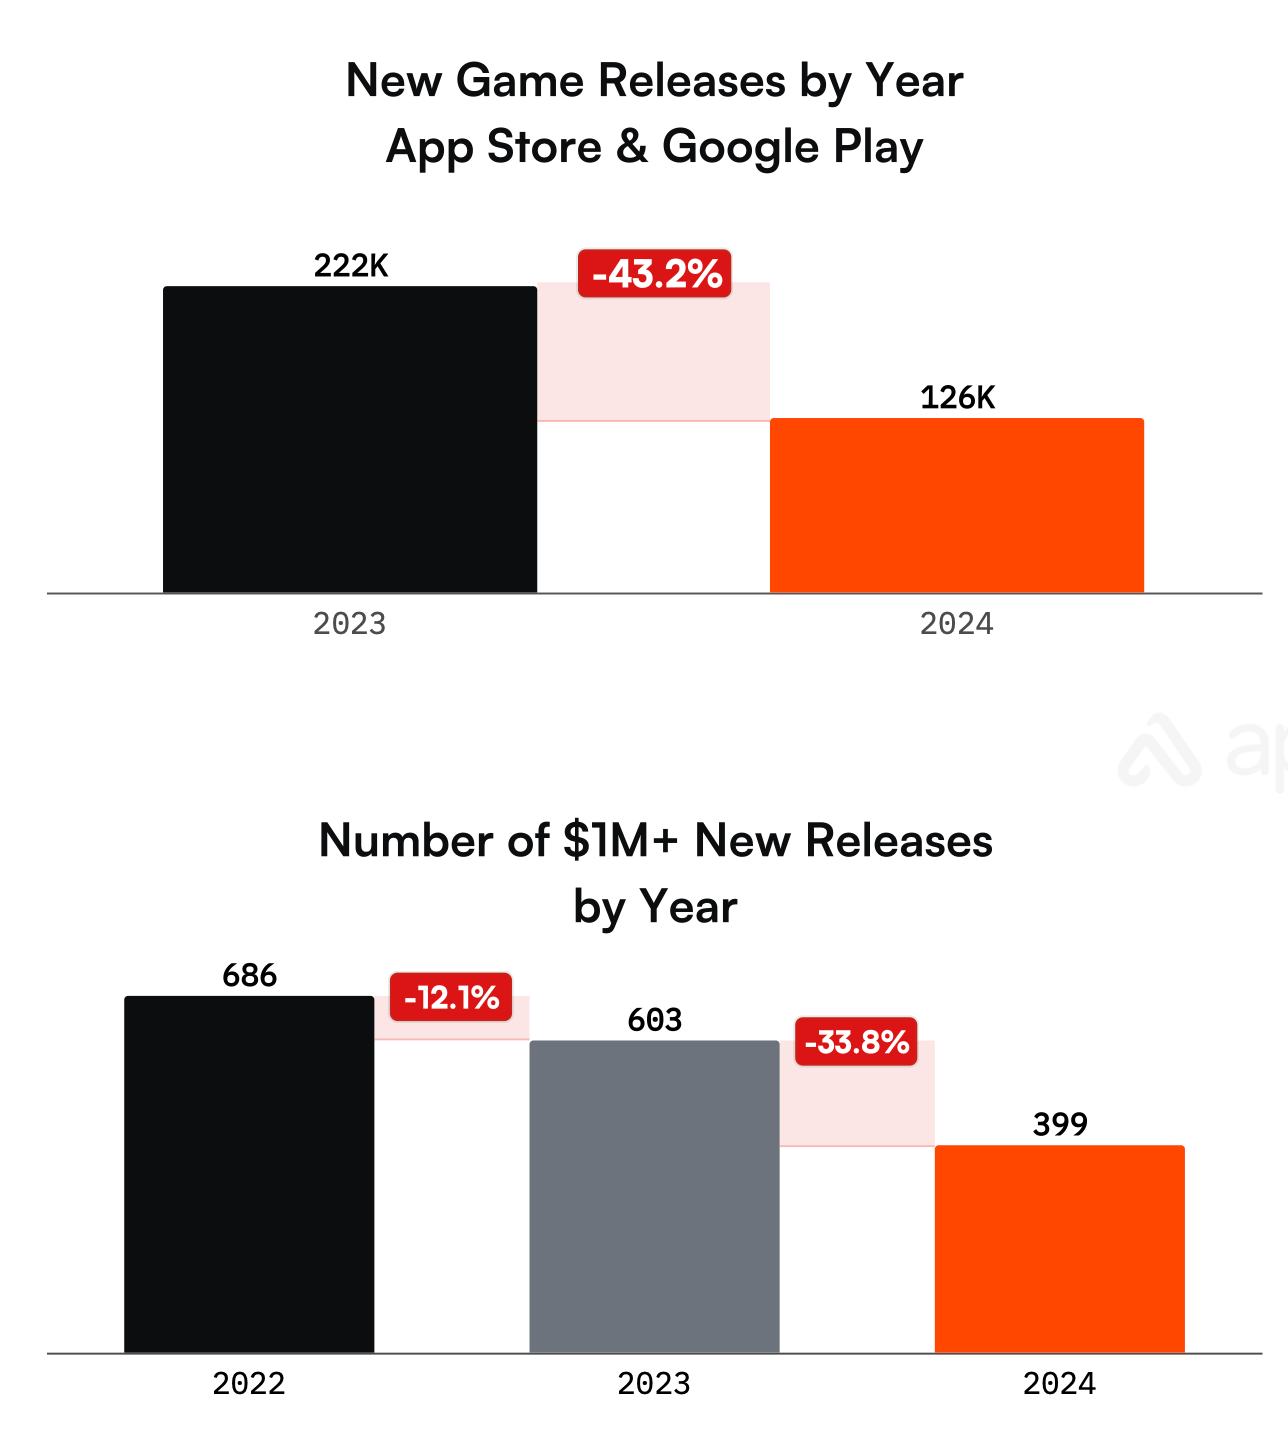
The number of new releases in 2024 on the App Store and Google Play decreased by 43.2%, from 222,000 apps to 126,000.
There’s also a continued annual decrease in new projects earning $1M+ per year. In 2022, there were 686, in 2023 – 603 (-12.1% YoY), and in 2024 – 399 (-33.8%). Launching in the modern market is getting harder.
 Download")
Speaking of new launches - Fable Town, a Merge-3 title I have the pleasure of working with at MY.GAMES, scaled to $5M lifetime revenue since global launch in late-2024. Quick numbers:
$5M lifetime revenue (and scaling)!
2 million installs.
#2 by installs in the merge-3 genre as of May 2025.
440k MAU.
95k DAU.
All of this, with sustainable ROI-efficient spend. The game has been developed and published in collaboration with MGVC Publishing (part of MY.GAMES).
Drop me a line if you want to discuss mobile publishing!
Interestingly, the number of days needed to reach the first $1M since 2022 has dropped almost threefold. Previously, achieving the milestone took an average of 273 days, but in 2024, it’s only 106 days.
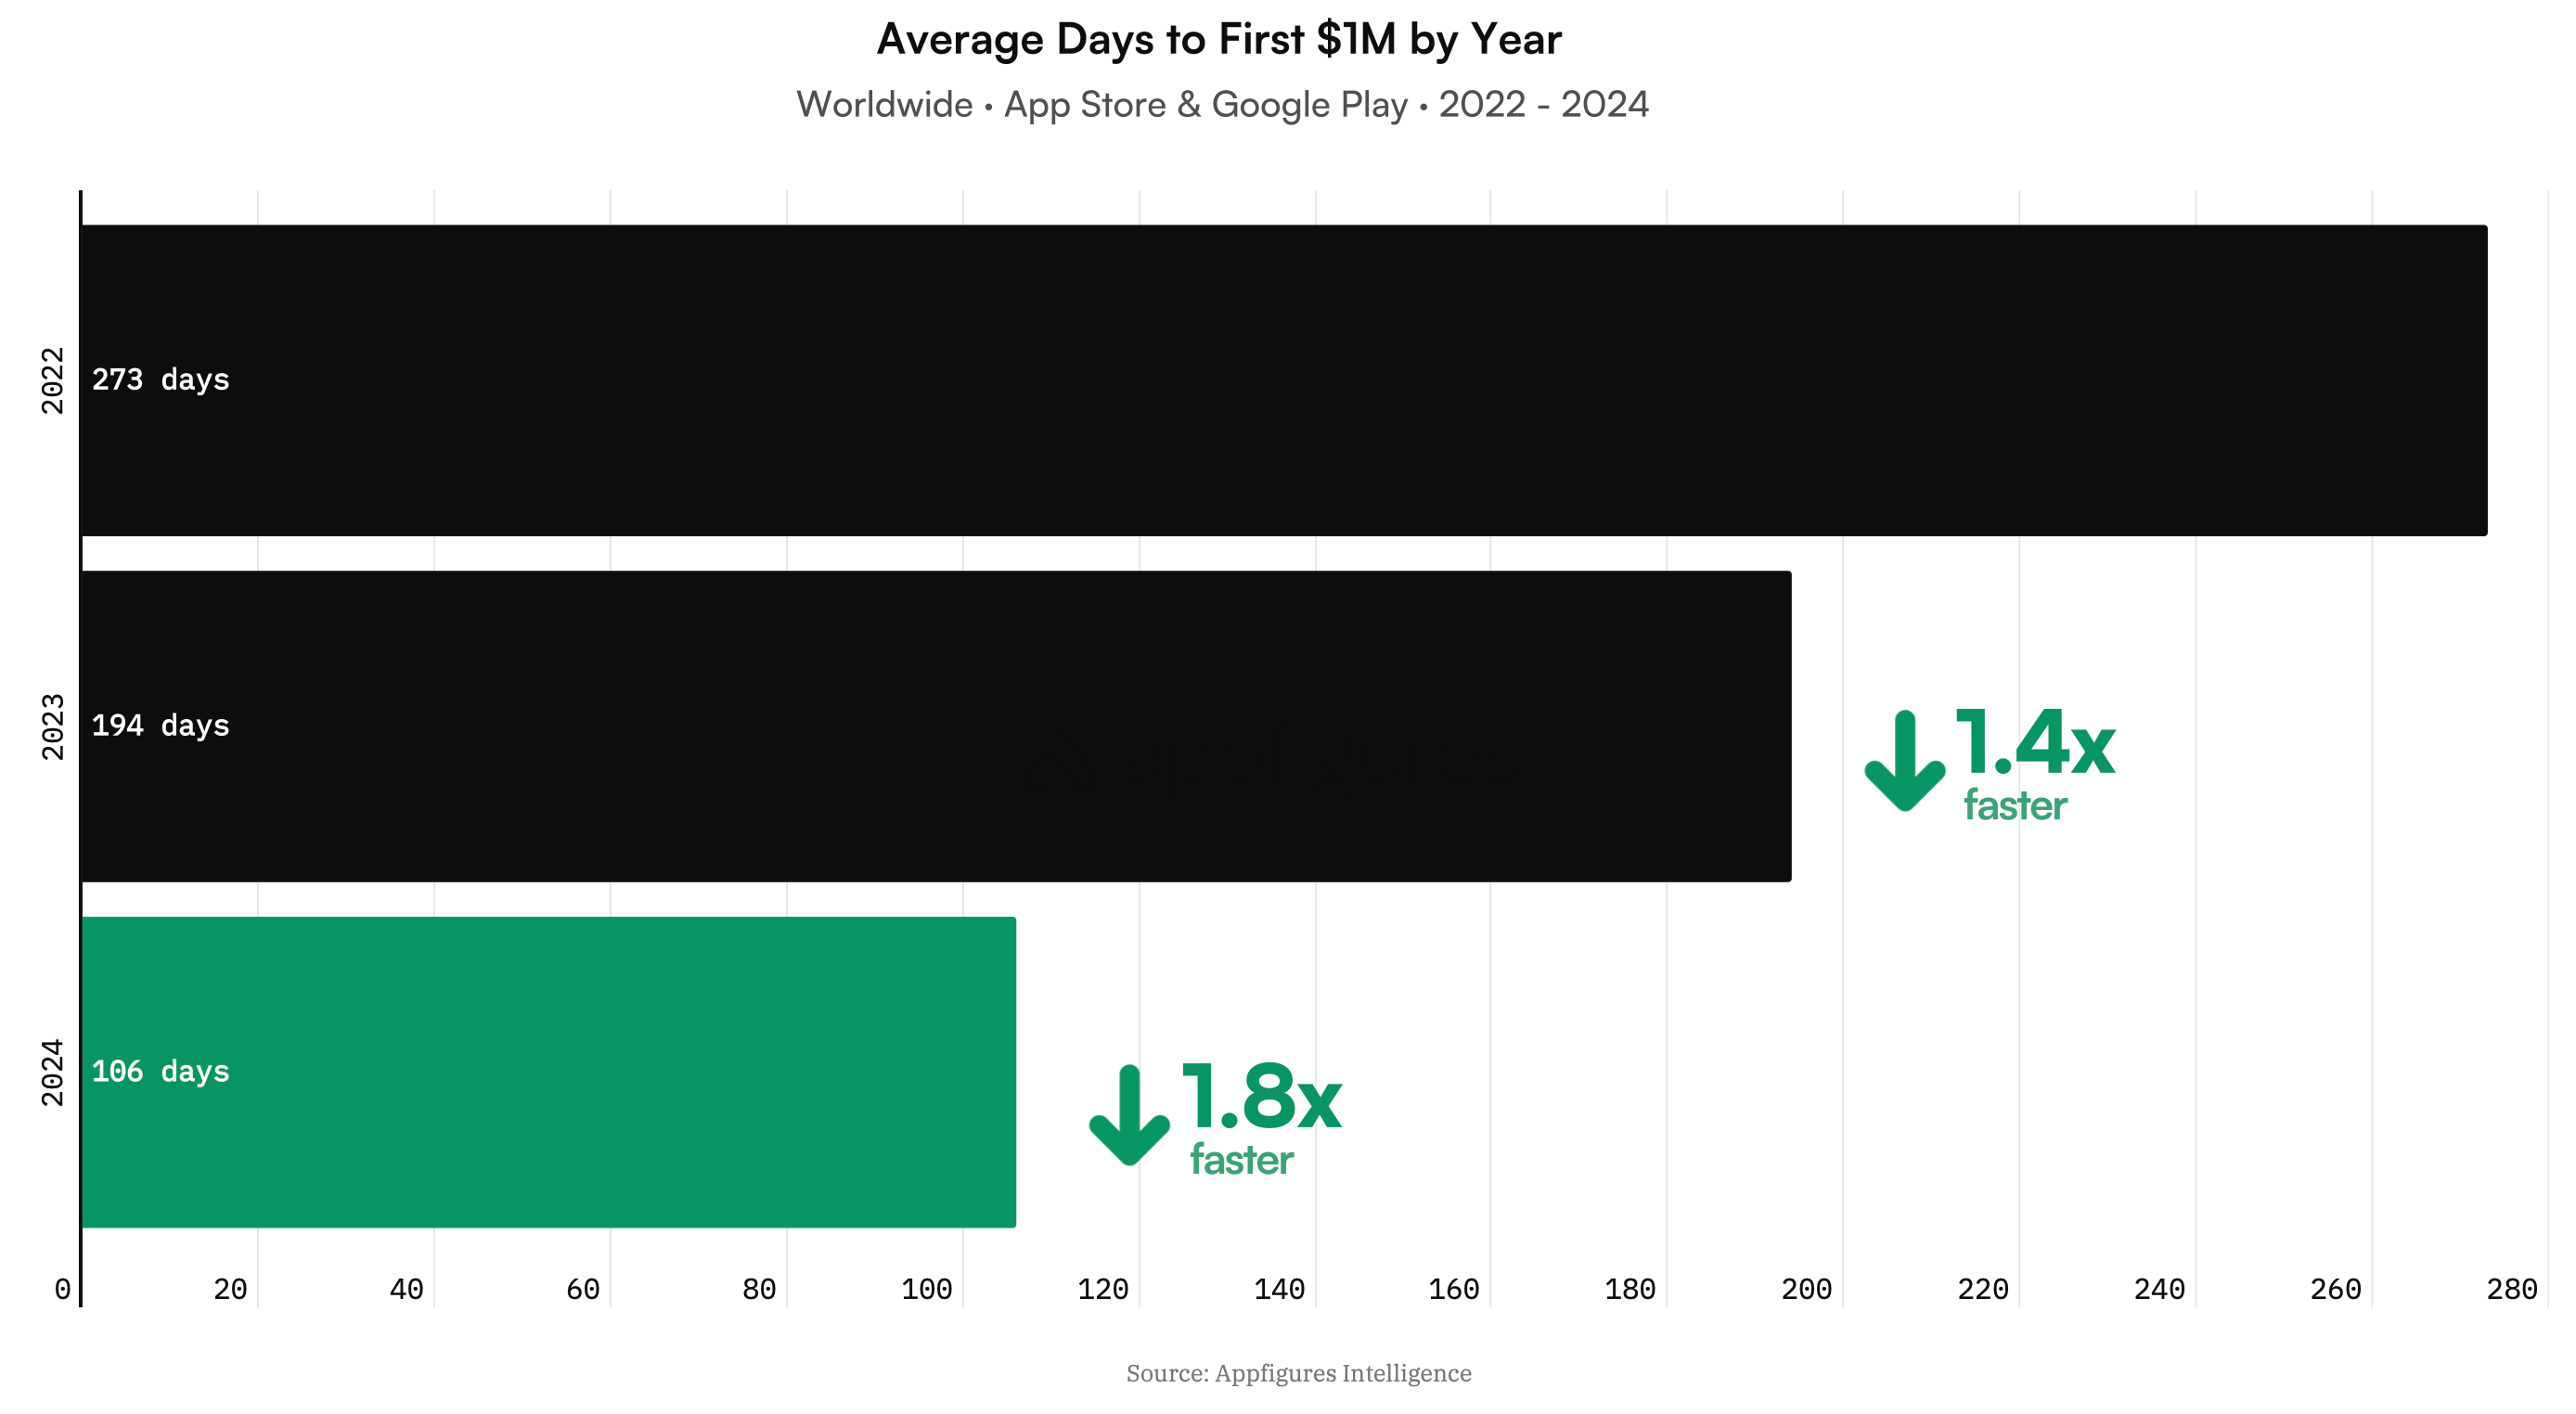
❗️This signals a more aggressive marketing approach in today’s market. As soon as developers see scalable metrics, they try to seize the moment.
Competition is rising – the number of available mobile games in 2024 in mobile stores grew by 23.1%, from 320,000 to 394,000.

On average, one user brings $1.52 (+11.2% YoY) IAP revenue per install. In the US, this figure rises to $6.43 (+11.1% YoY).
Looking at the 1,000 top-grossing projects in 2024, the leaders are games released in 2022 (they earned $5.7 billion). Second place – games from 2015 ($5.4 billion); third – games from 2018 ($4.8 billion).

Market Leaders
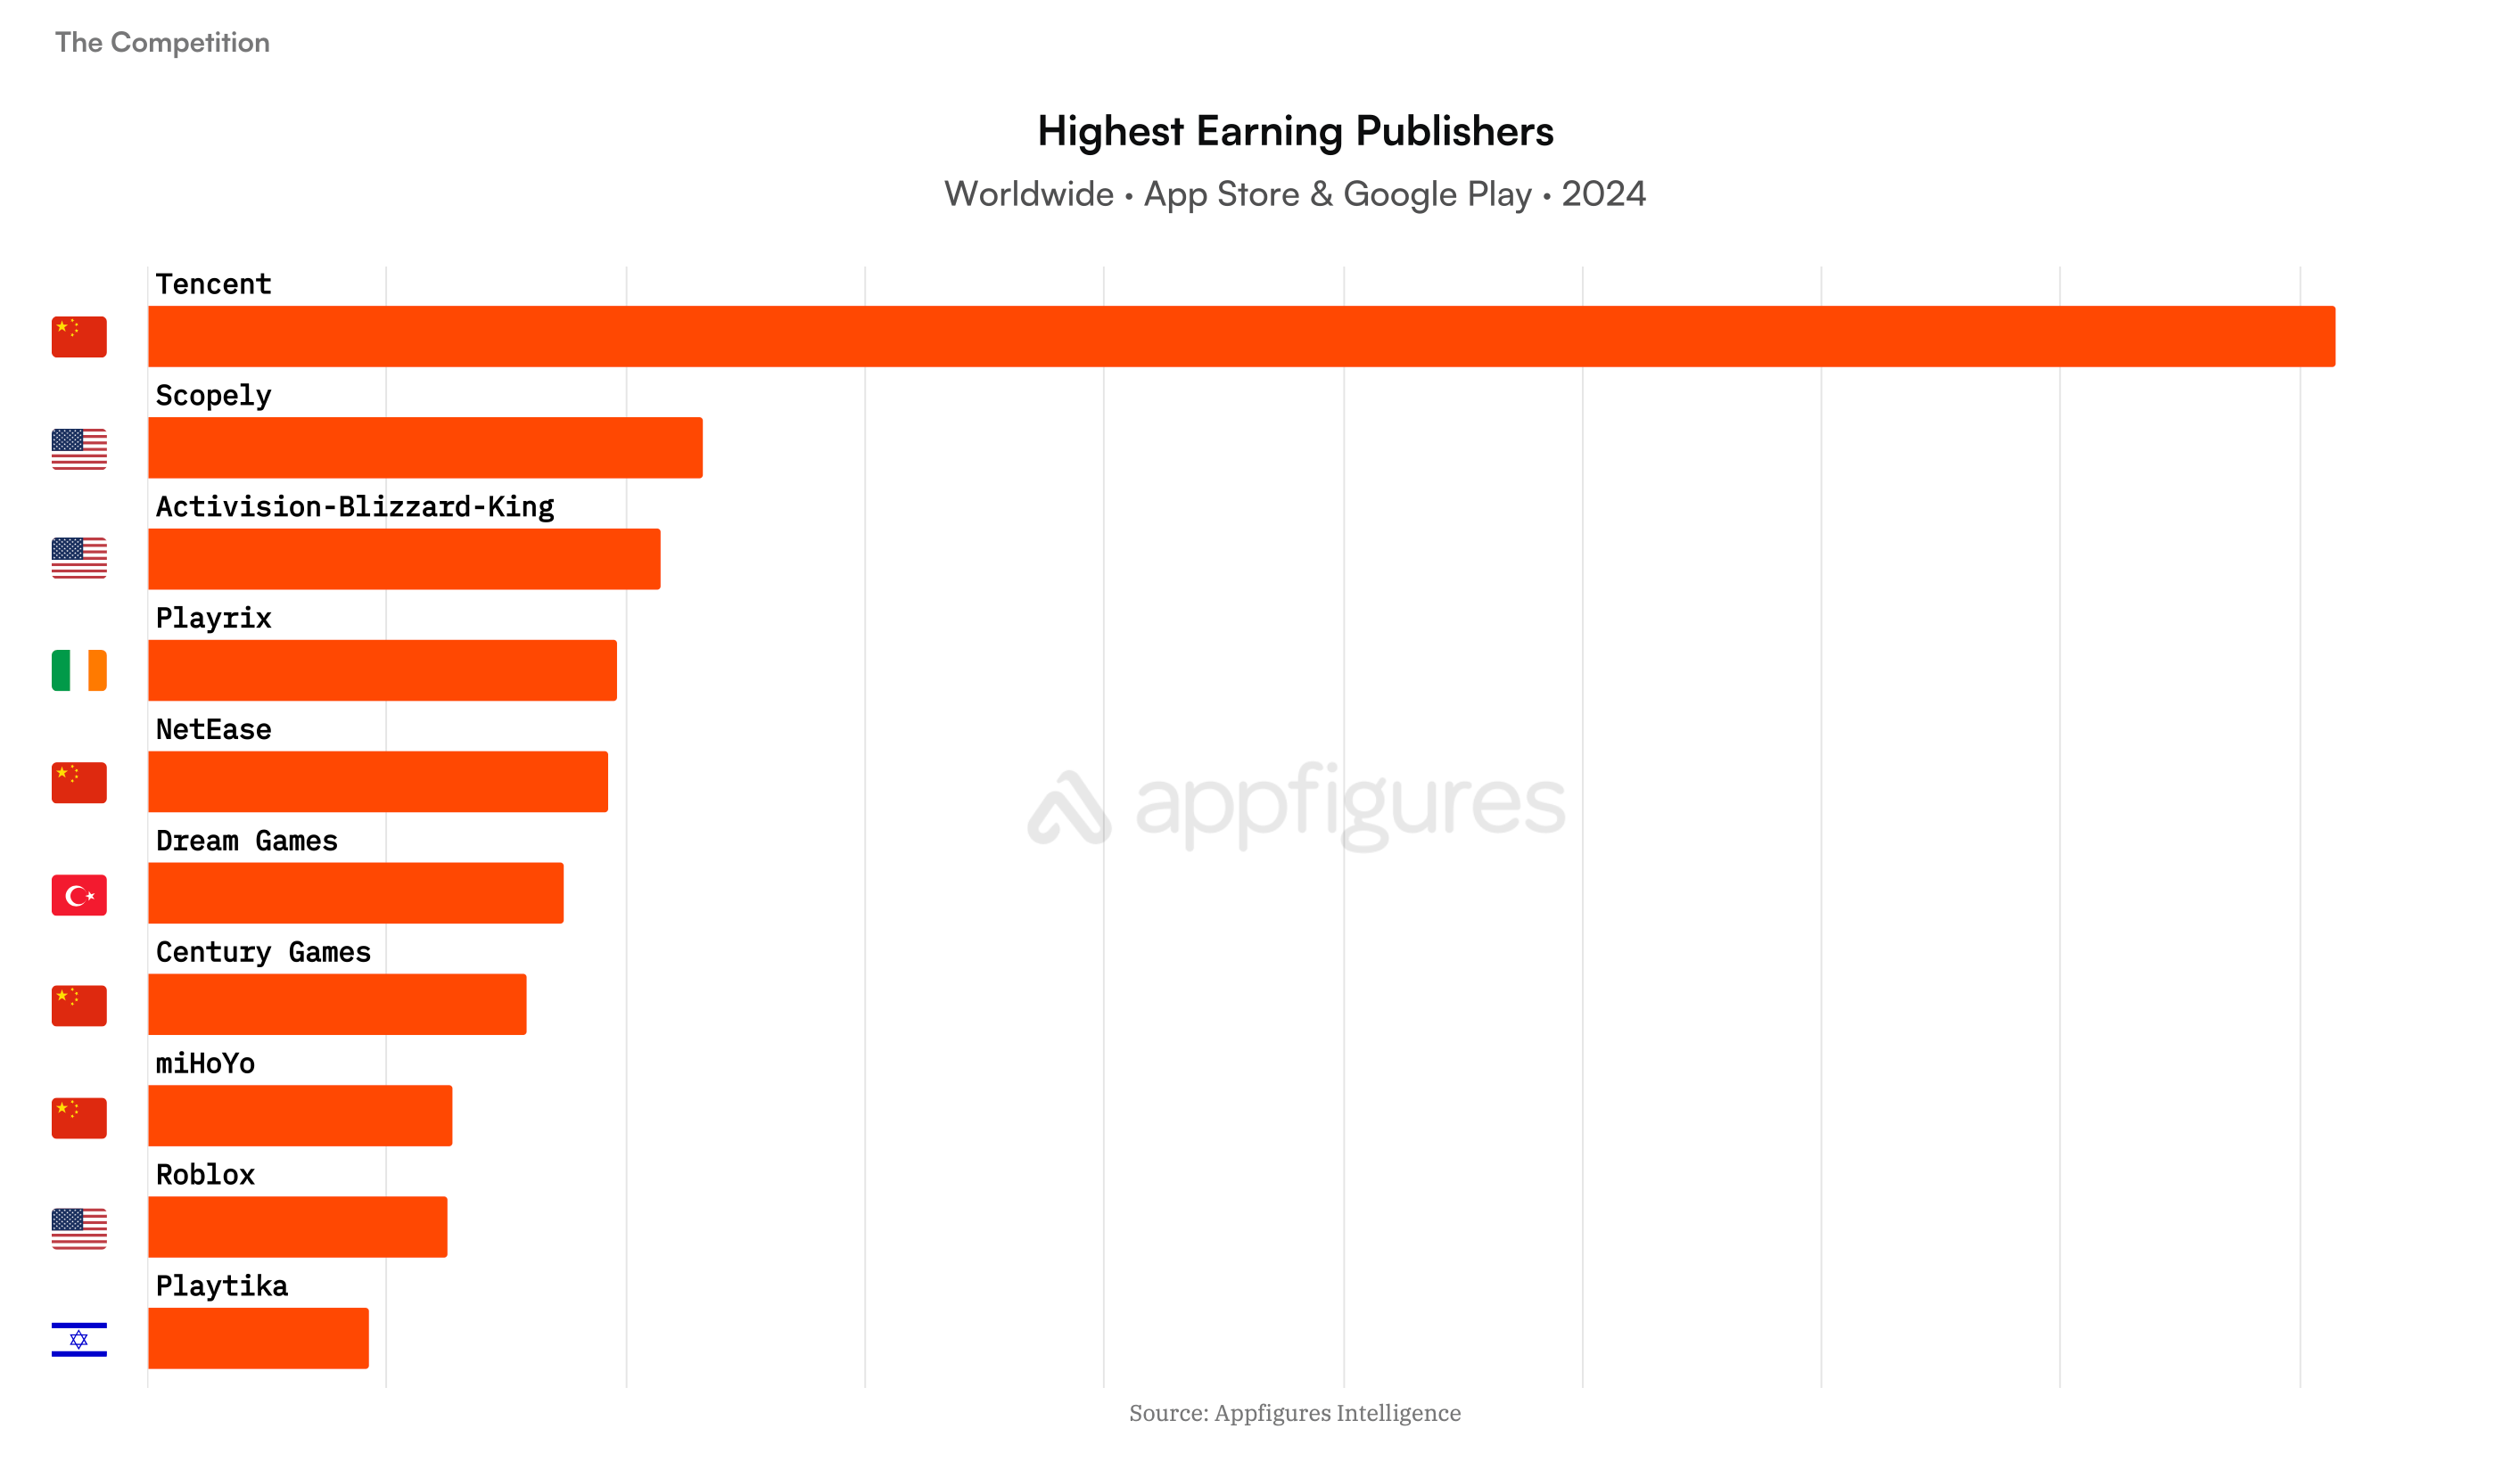
Tencent is the global revenue leader by a wide margin. The list includes 4 Chinese and 3 American companies – these countries can be called dominant in the mobile market.
Honor of Kings, Monopoly GO, and Royal Match are the highest-grossing projects in 2024.
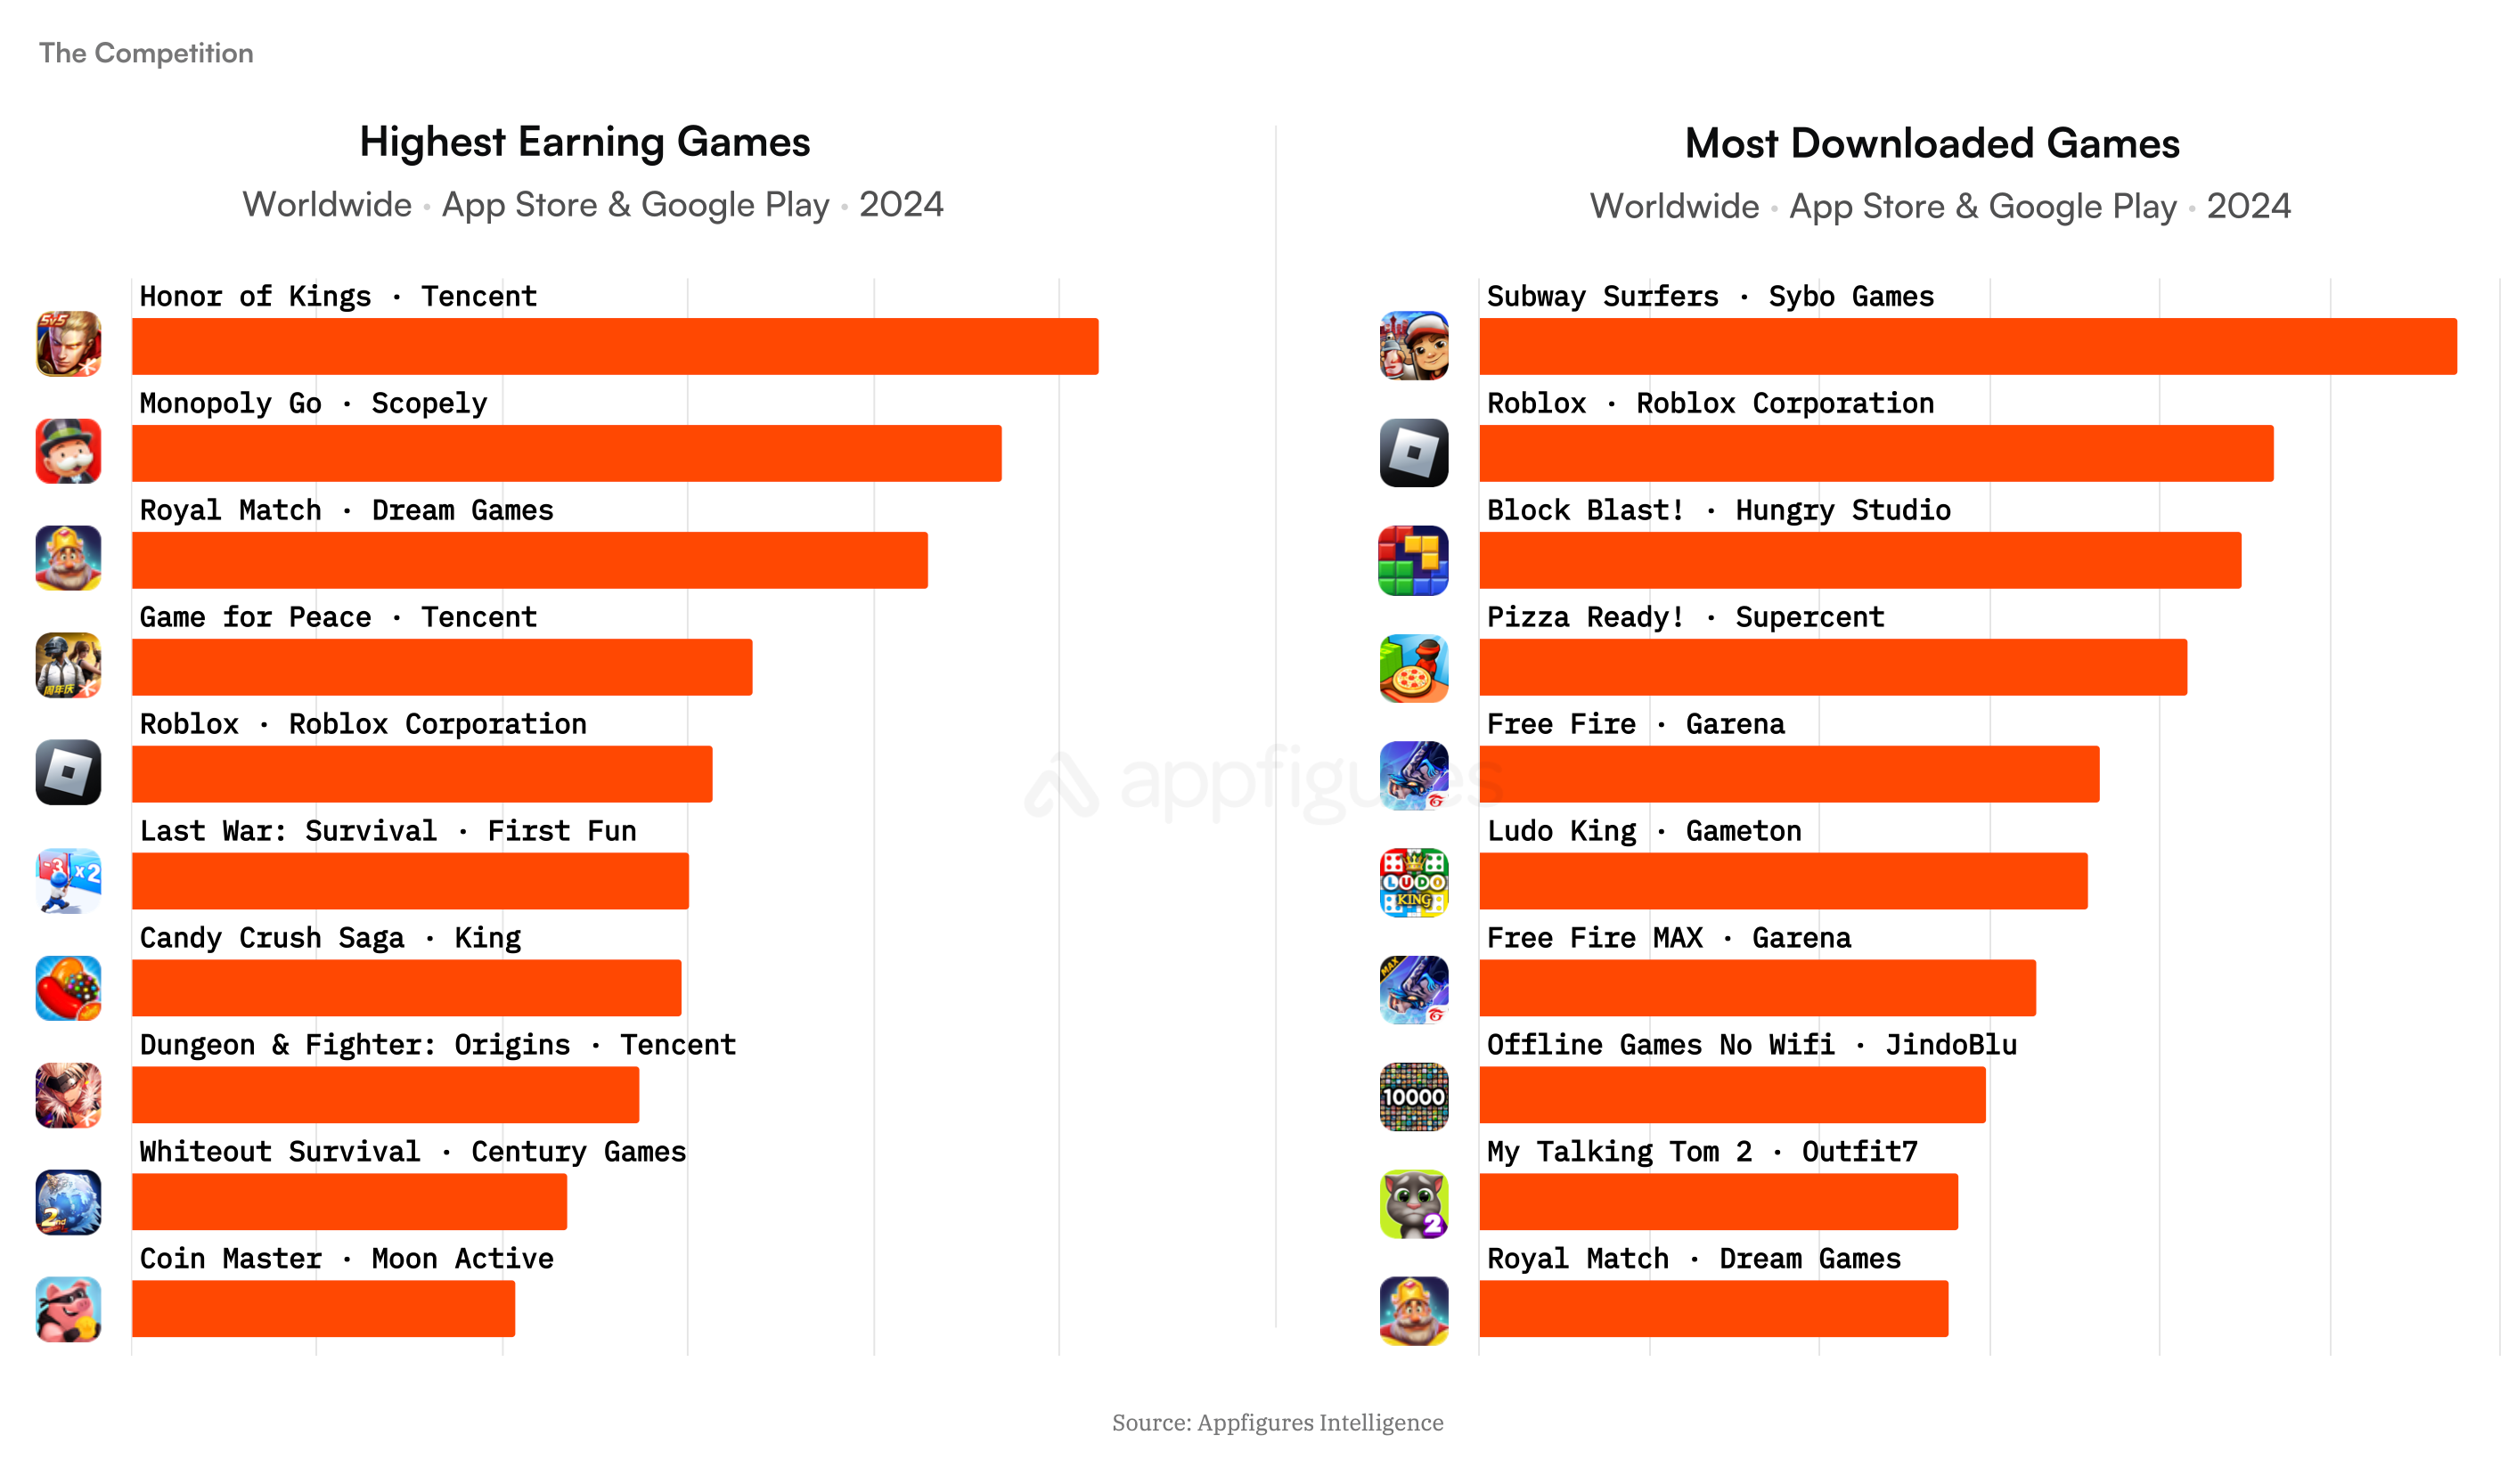
Download leaders – Subway Surfers, Roblox, and Block Blast!. It’s remarkable how long Subway Surfers has managed to stay relevant.
Top New Releases
Among games released in 2024, the most notable are Dungeon & Fighter: Origins (despite being released only in China and South Korea), Pokémon TCG Pocket, and Whiteout Survival (?).
❗️Whiteout Survival had its global release in 2023; its inclusion in the chart is a mistake.

Still, it doesn’t change the fact that among the successful games of 2024, only titles from Asian developers are present.
In 2024, considering the 1,000 top-grossing projects, midcore projects took 50% of the chart, casual games – 32%, casino – 11%, racing and sports – 7%.

❗️Important – this is not about revenue share, but about the number of projects in the top 1,000. In other words, 500 games in the top 1,000 by revenue are midcore.
RPGs accounted for 33.7% of all projects in the top 1,000 in 2024, puzzles – 16.3%, strategies – 11.6%.

❗️That is, there are 337 RPGs in the top 1,000. This does not mean they account for 33.7% of revenue.
The most popular RPG subgenres in the top 1,000 are MMORPG (22%), Action RPG (21%), and Idle RPG (15%).

Among puzzles, Match (38% of all releases), board games (13%), and, surprisingly, mahjong (8%) dominate.
In strategies, the lion’s share goes to strategy battlers (46%) and 4X strategies (35%).

Fastest Growing Global Markets
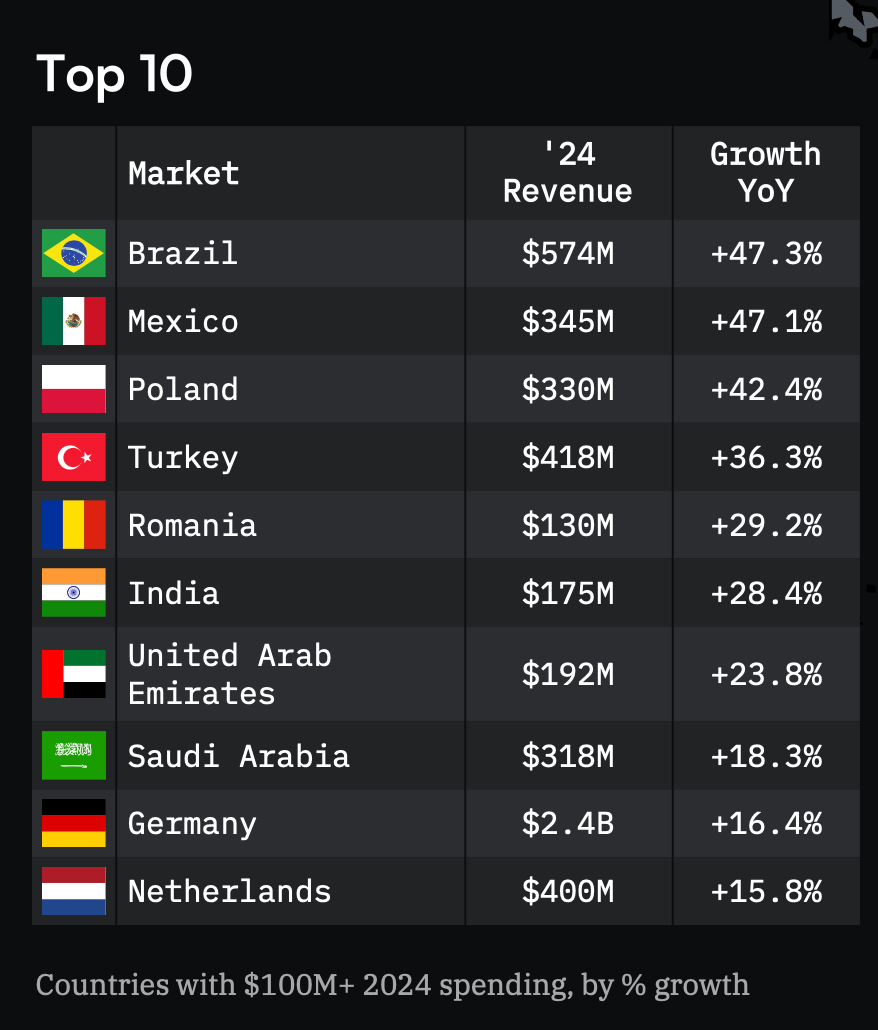
Brazil ($574 million – +47.3% YoY), Mexico ($345 million – +47.1% YoY), and Poland ($330 million – +42.4% YoY) are the fastest-growing markets of 2024.
Singapore ($291 million, -19% YoY), Malaysia ($286 million, -17.5% YoY), and Hong Kong ($779 million, -15.7% YoY) are the leaders in decline for 2024.
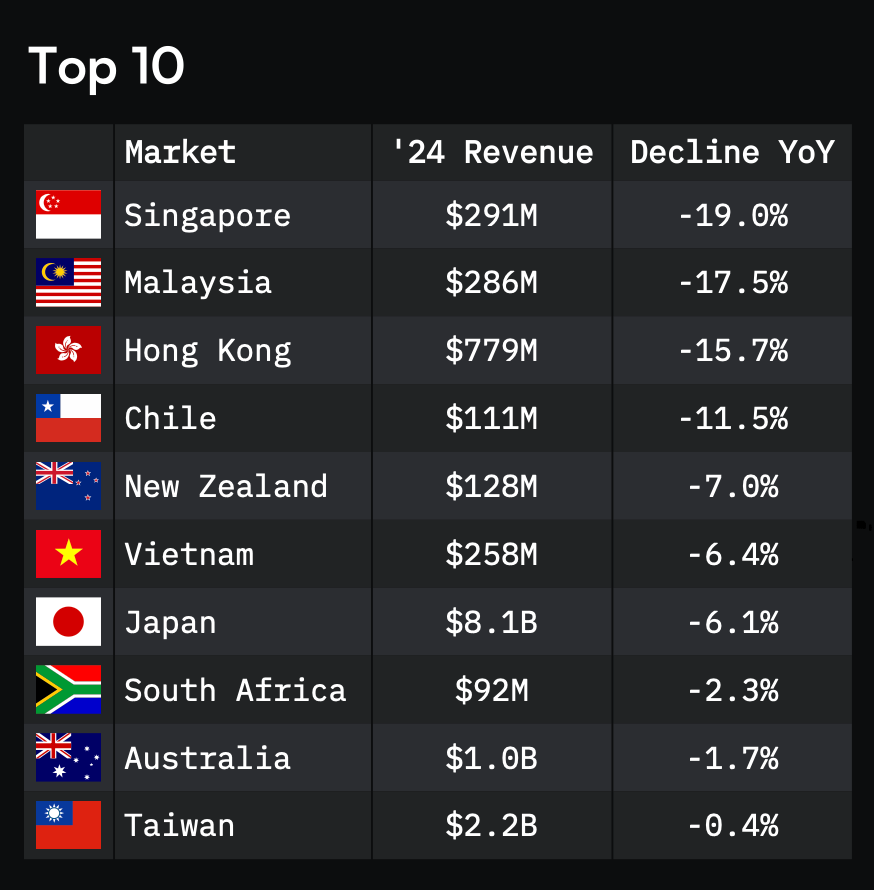
❗️It’s surprising to see so many Southeast Asian countries in the decline ranking. Recent reports from various sources, on the contrary, indicate that revenue in these regions is growing rapidly.
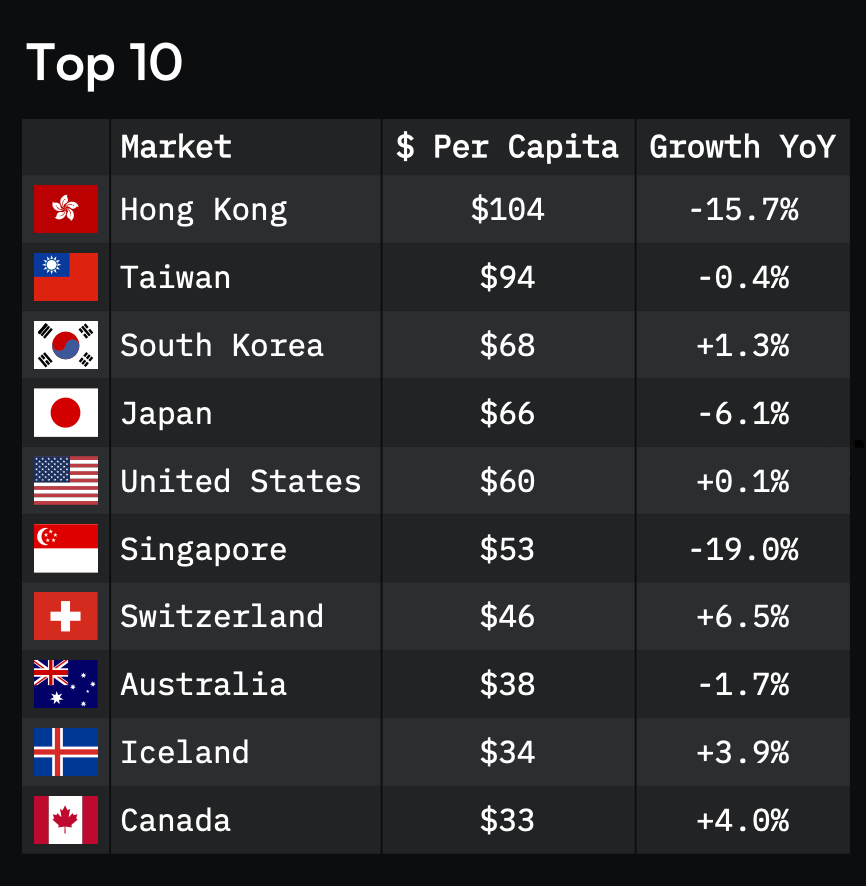
Regions leading in per capita spending on mobile games – Hong Kong ($104, -15.7% YoY), Taiwan ($94, -0.4% YoY), and South Korea ($68, +1.3% YoY).
User Habits
AppFigures provides an interesting chart showing the overlap between the audiences of top-grossing games of 2024 and non-gaming apps.

There are a few interesting points – League of Legends players use TikTok less than users of other games. But they exercise more (or at least download fitness apps). Gardenscapes users are more likely than others to study foreign languages on Duolingo.
In 2024, Brawl Stars held several IP collaborations. All shown in the material shown had a positive effect on revenue. The Godzilla collab increased revenue by 86% compared to the previous 4 weeks; SpongeBob – up 68%; Toy Story – up 22%.

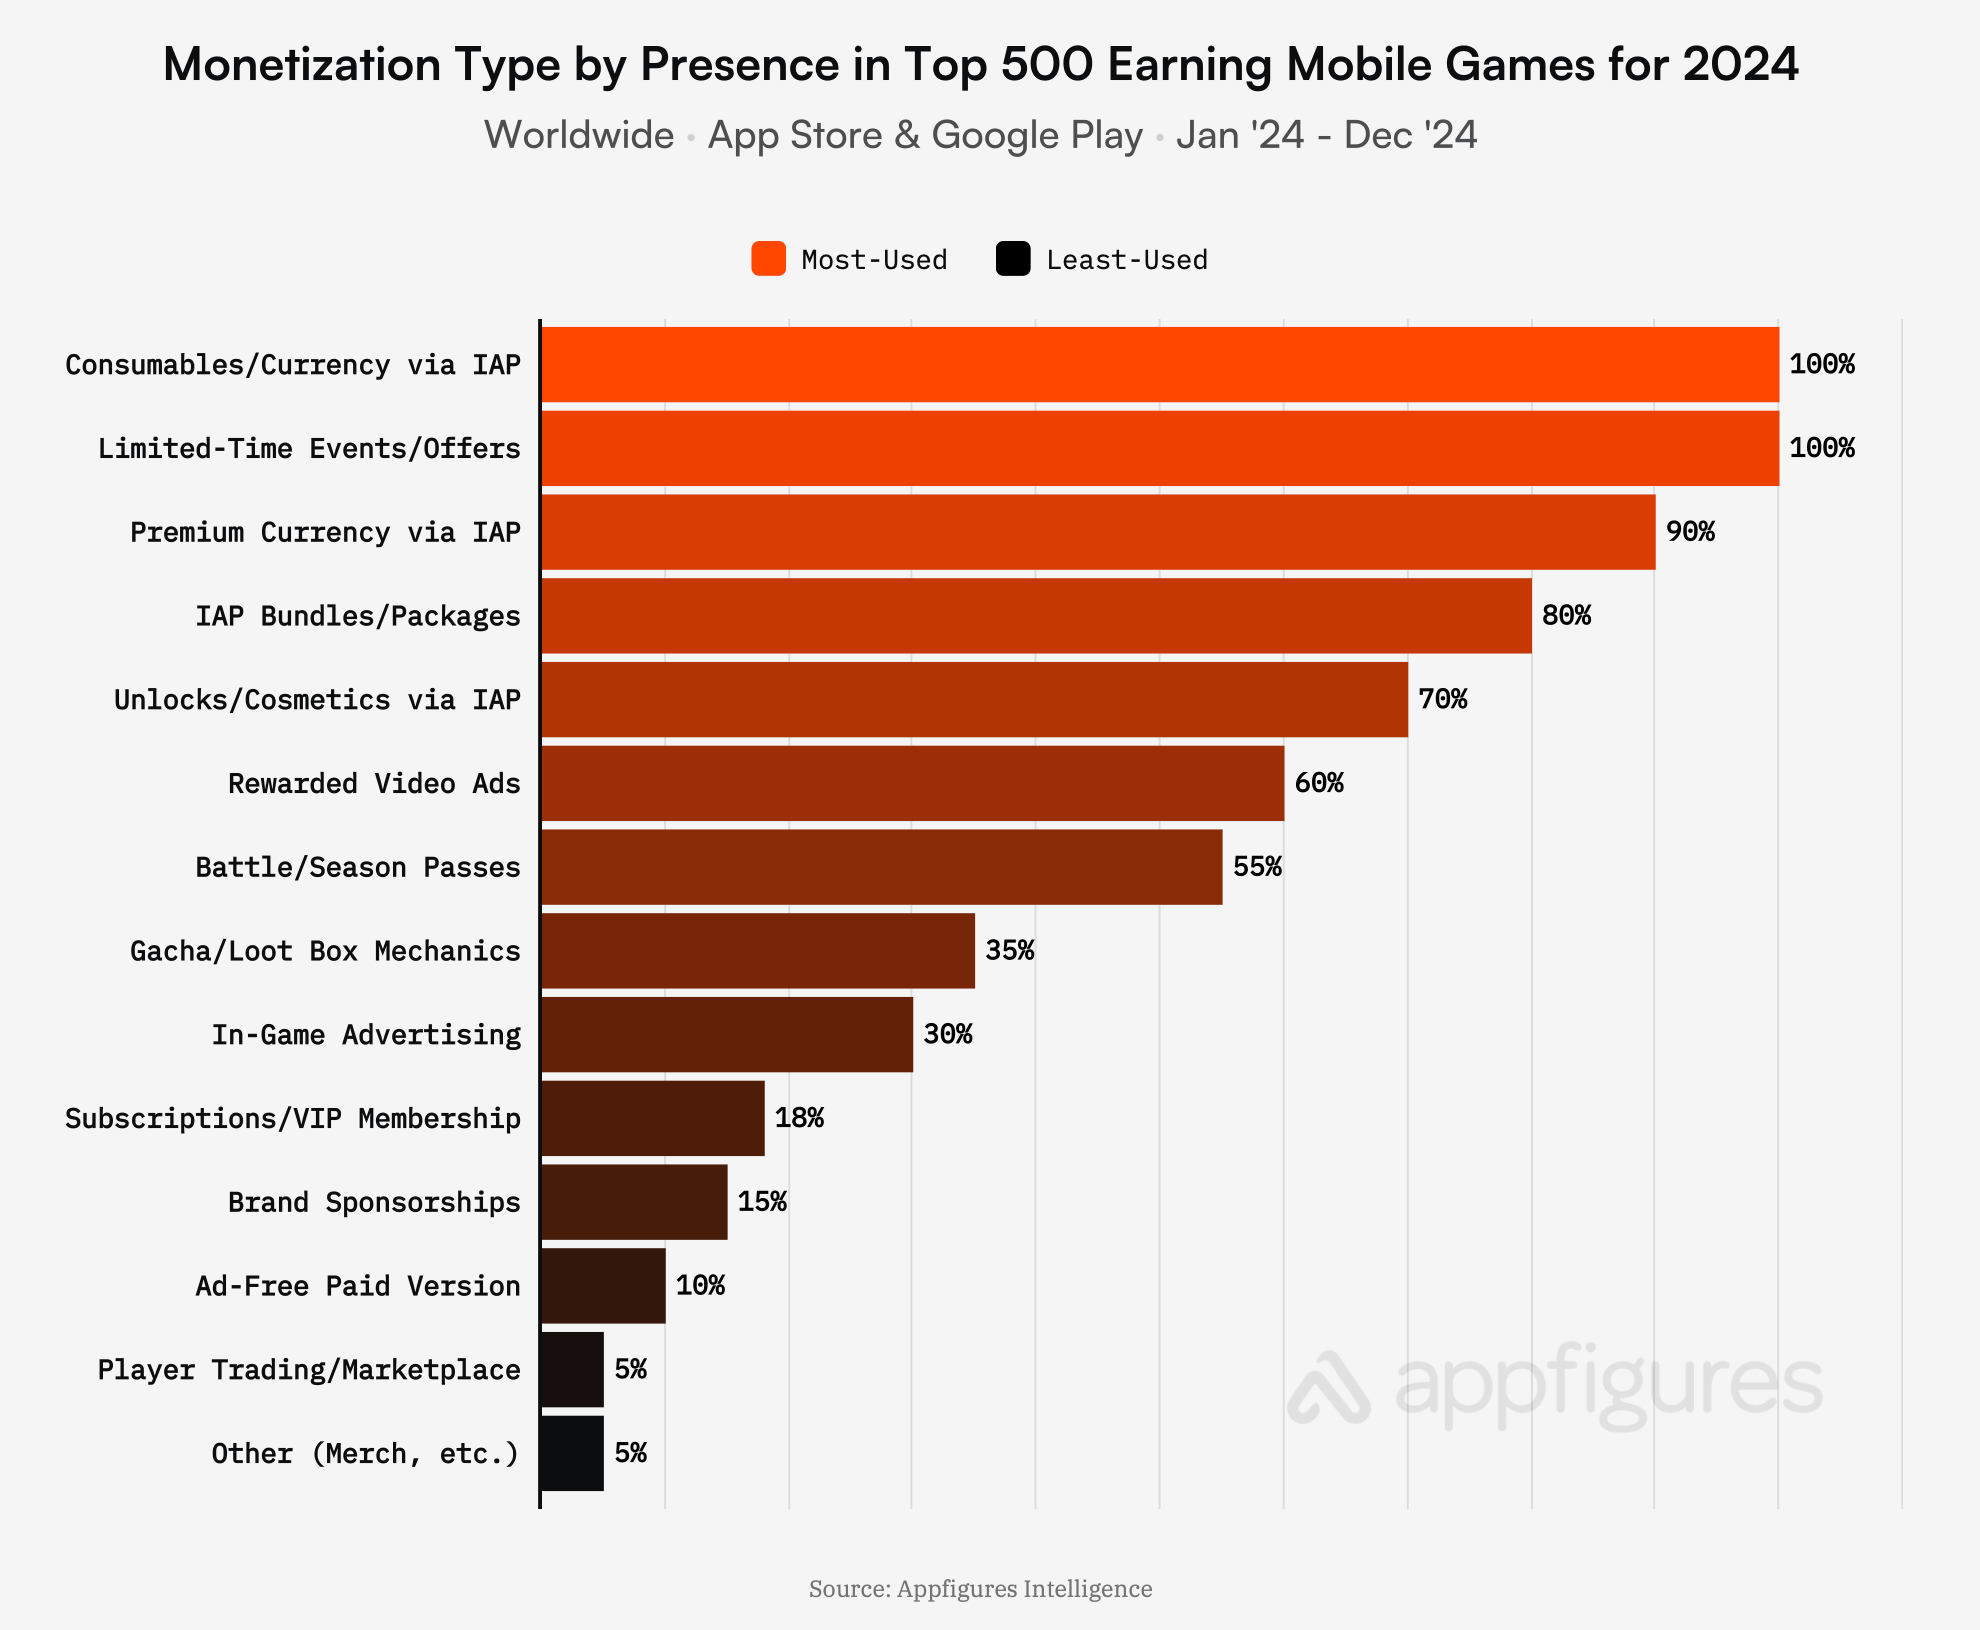
How top projects monetize
The chart is obvious, but all top-grossing projects in the top 500 sell currency with consumables and have limited-time offers. In 2024, 60% of the top-grossing games in the top 500 featured Rewarded Ads.
AppLovin has significantly expanded its market presence over the past couple of years – SDK penetration increased from 23% in 2022 to 42% in 2024. Facebook Ads also grew (from 45% in 2022 to 57% in 2024). The leader is Unity Ads – 69%.

