

AppsFlyer: App Monetization in 2026 - sponsored by PWN Games
Non-gaming apps are comparable with the top mobile genres by ARPPU; converting users better, but struggle to make them recurrent.


The report is based on $900 million in verified IAP purchases (January 2025–March 2026), $800 million in verified subscription revenue (over the same period), and $7.2 billion in advertising revenue (January 2025–March 2026).
Market numbers
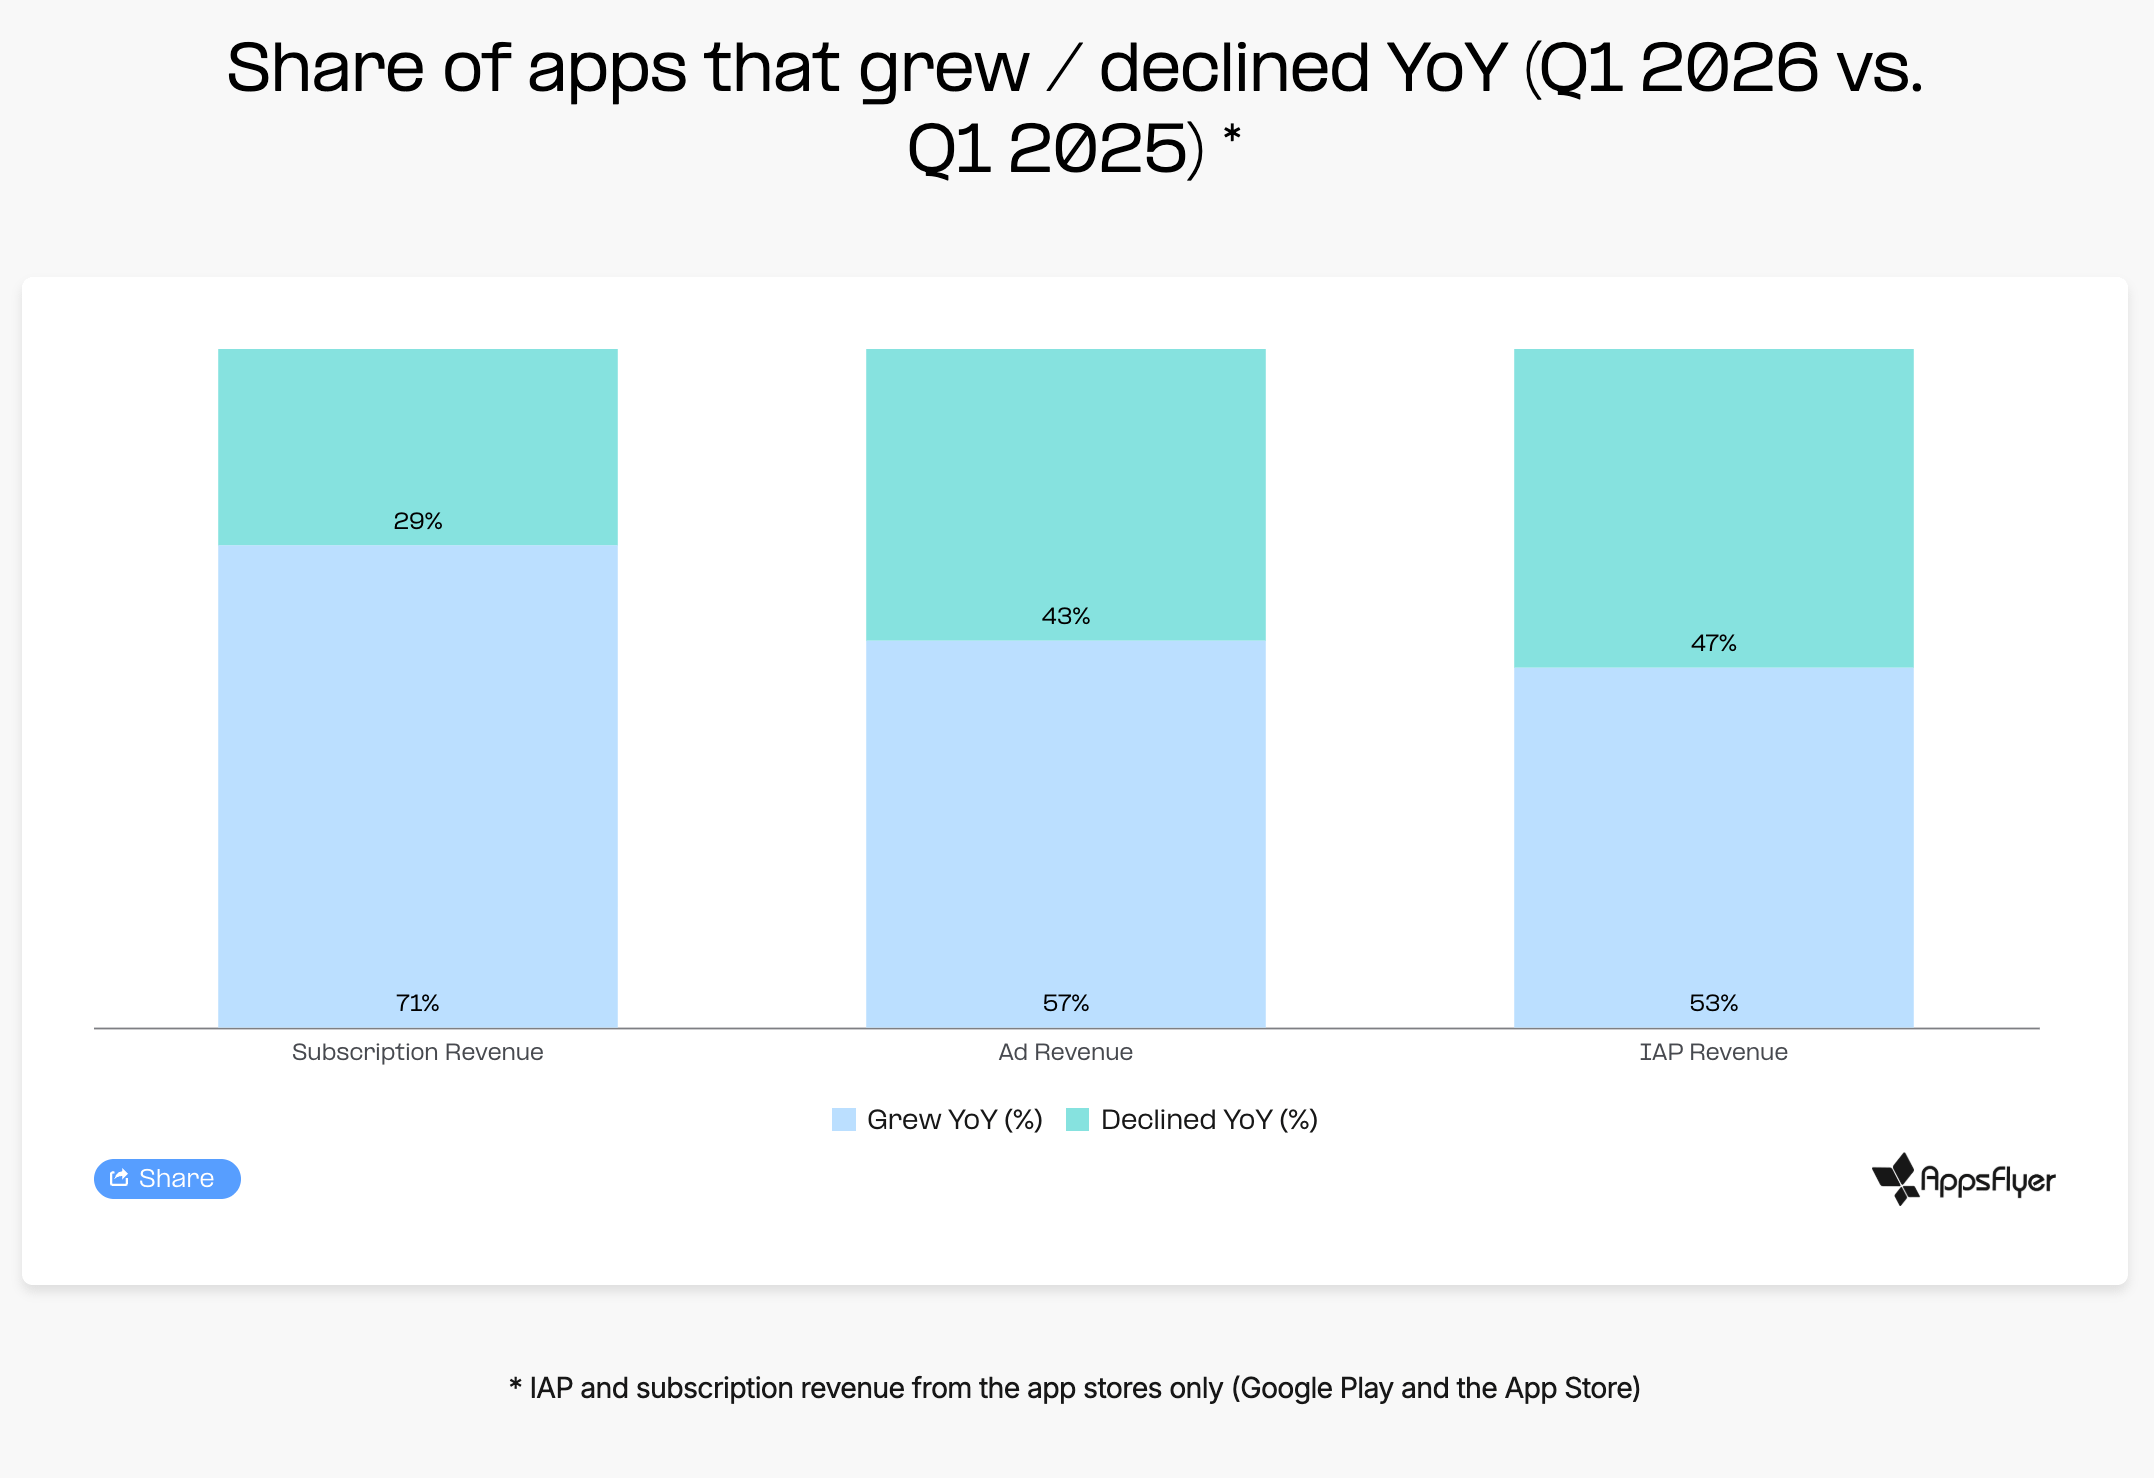
In Q1 2026, subscription revenue across the App Store and Google Play grew 105% YoY. IAP revenue increased by 29%, while advertising revenue rose by 14%. All figures are compared to the same period last year, and applicable to all apps.
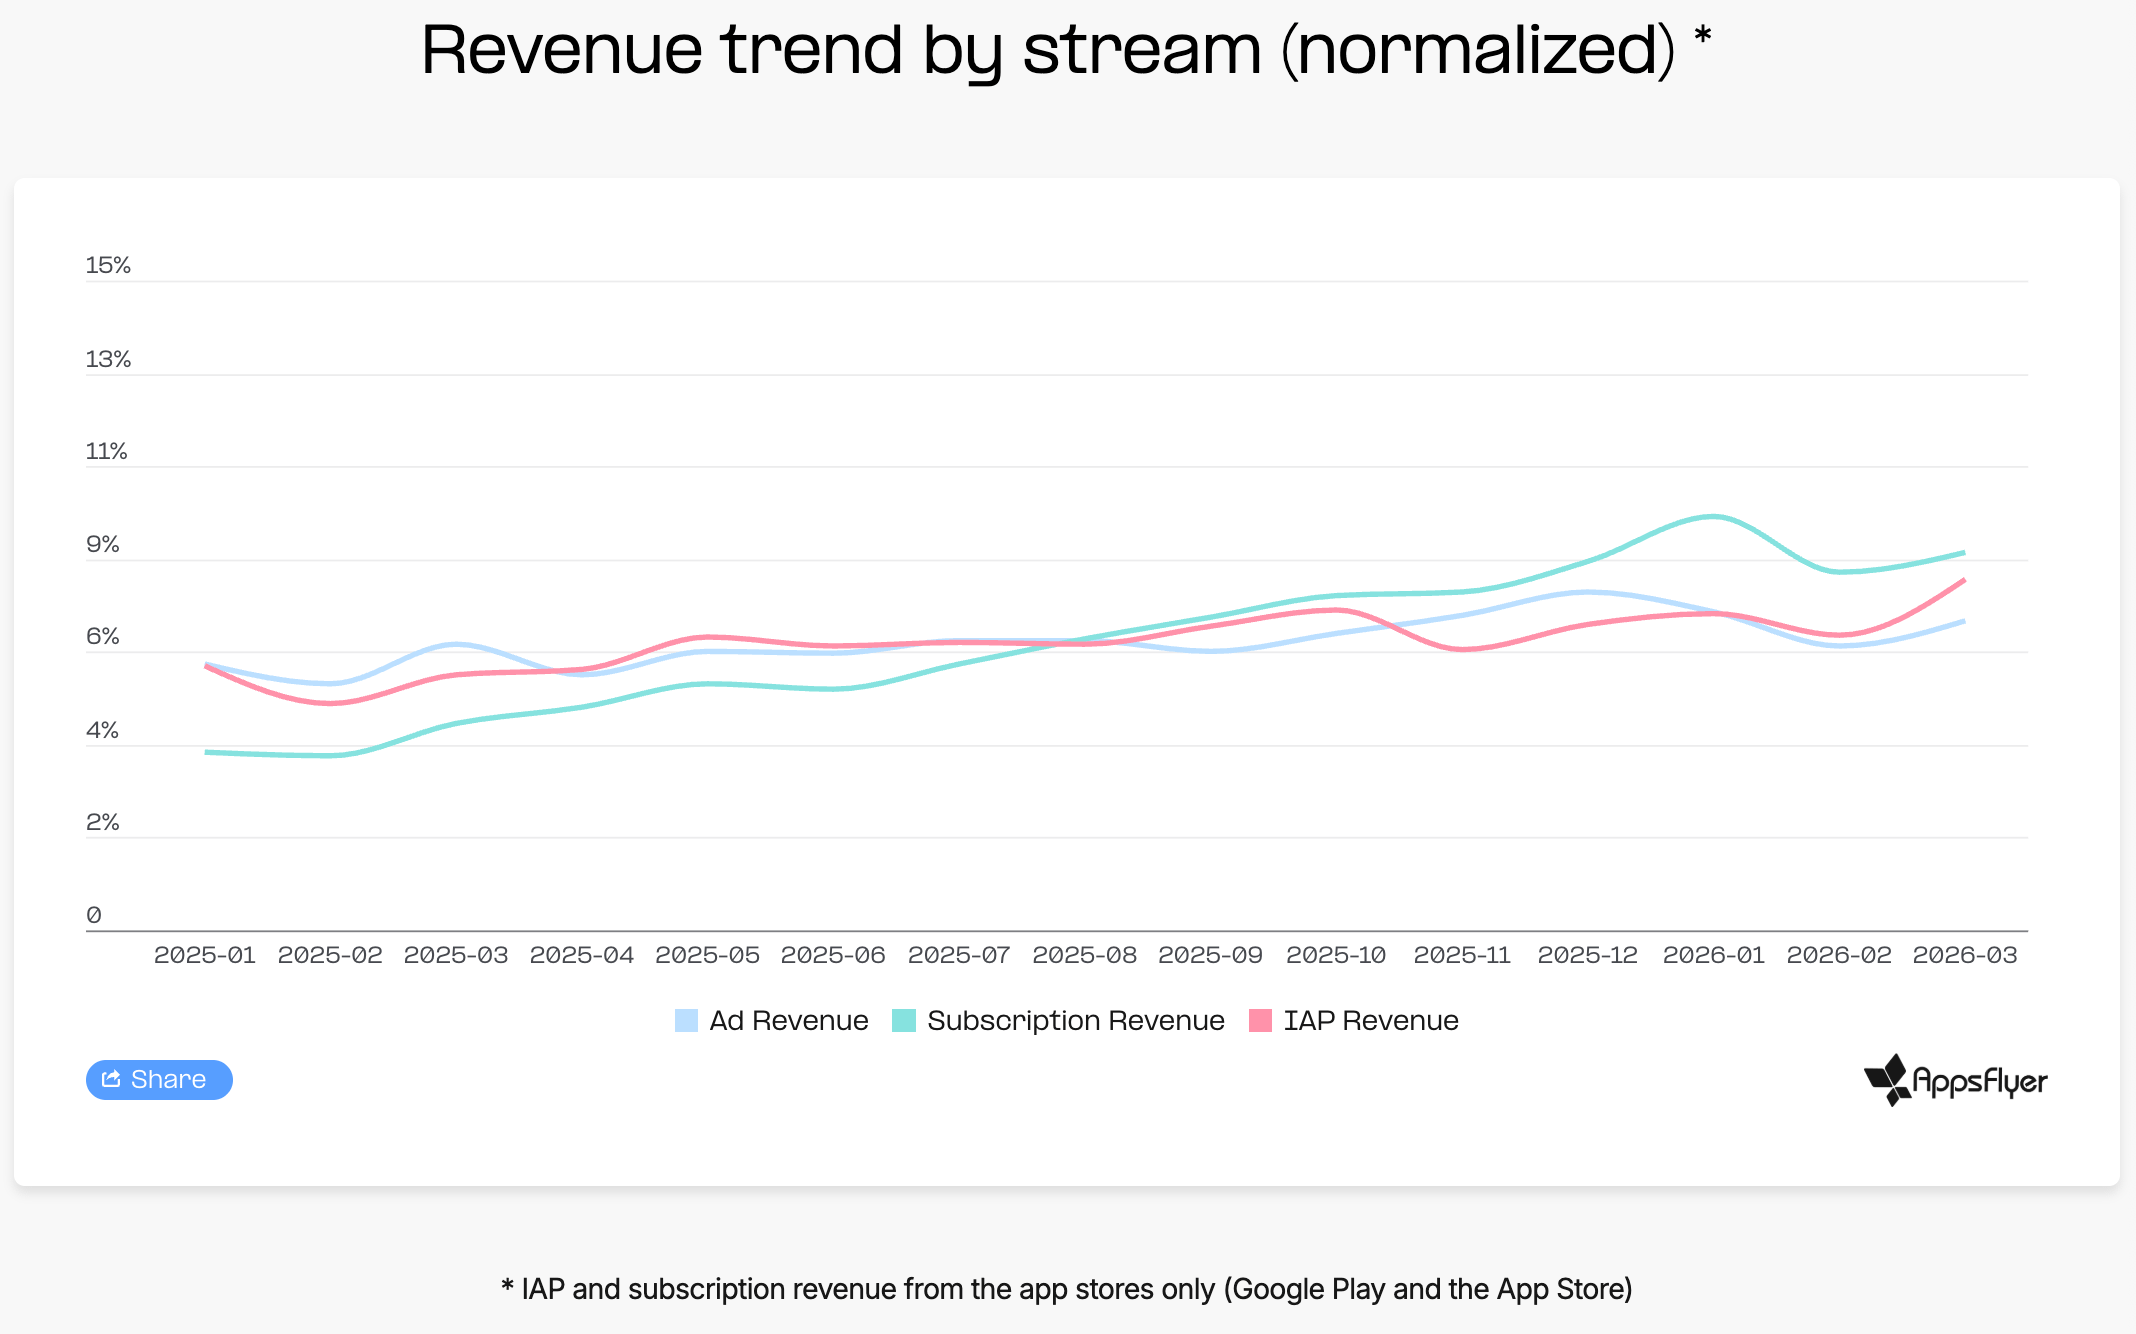
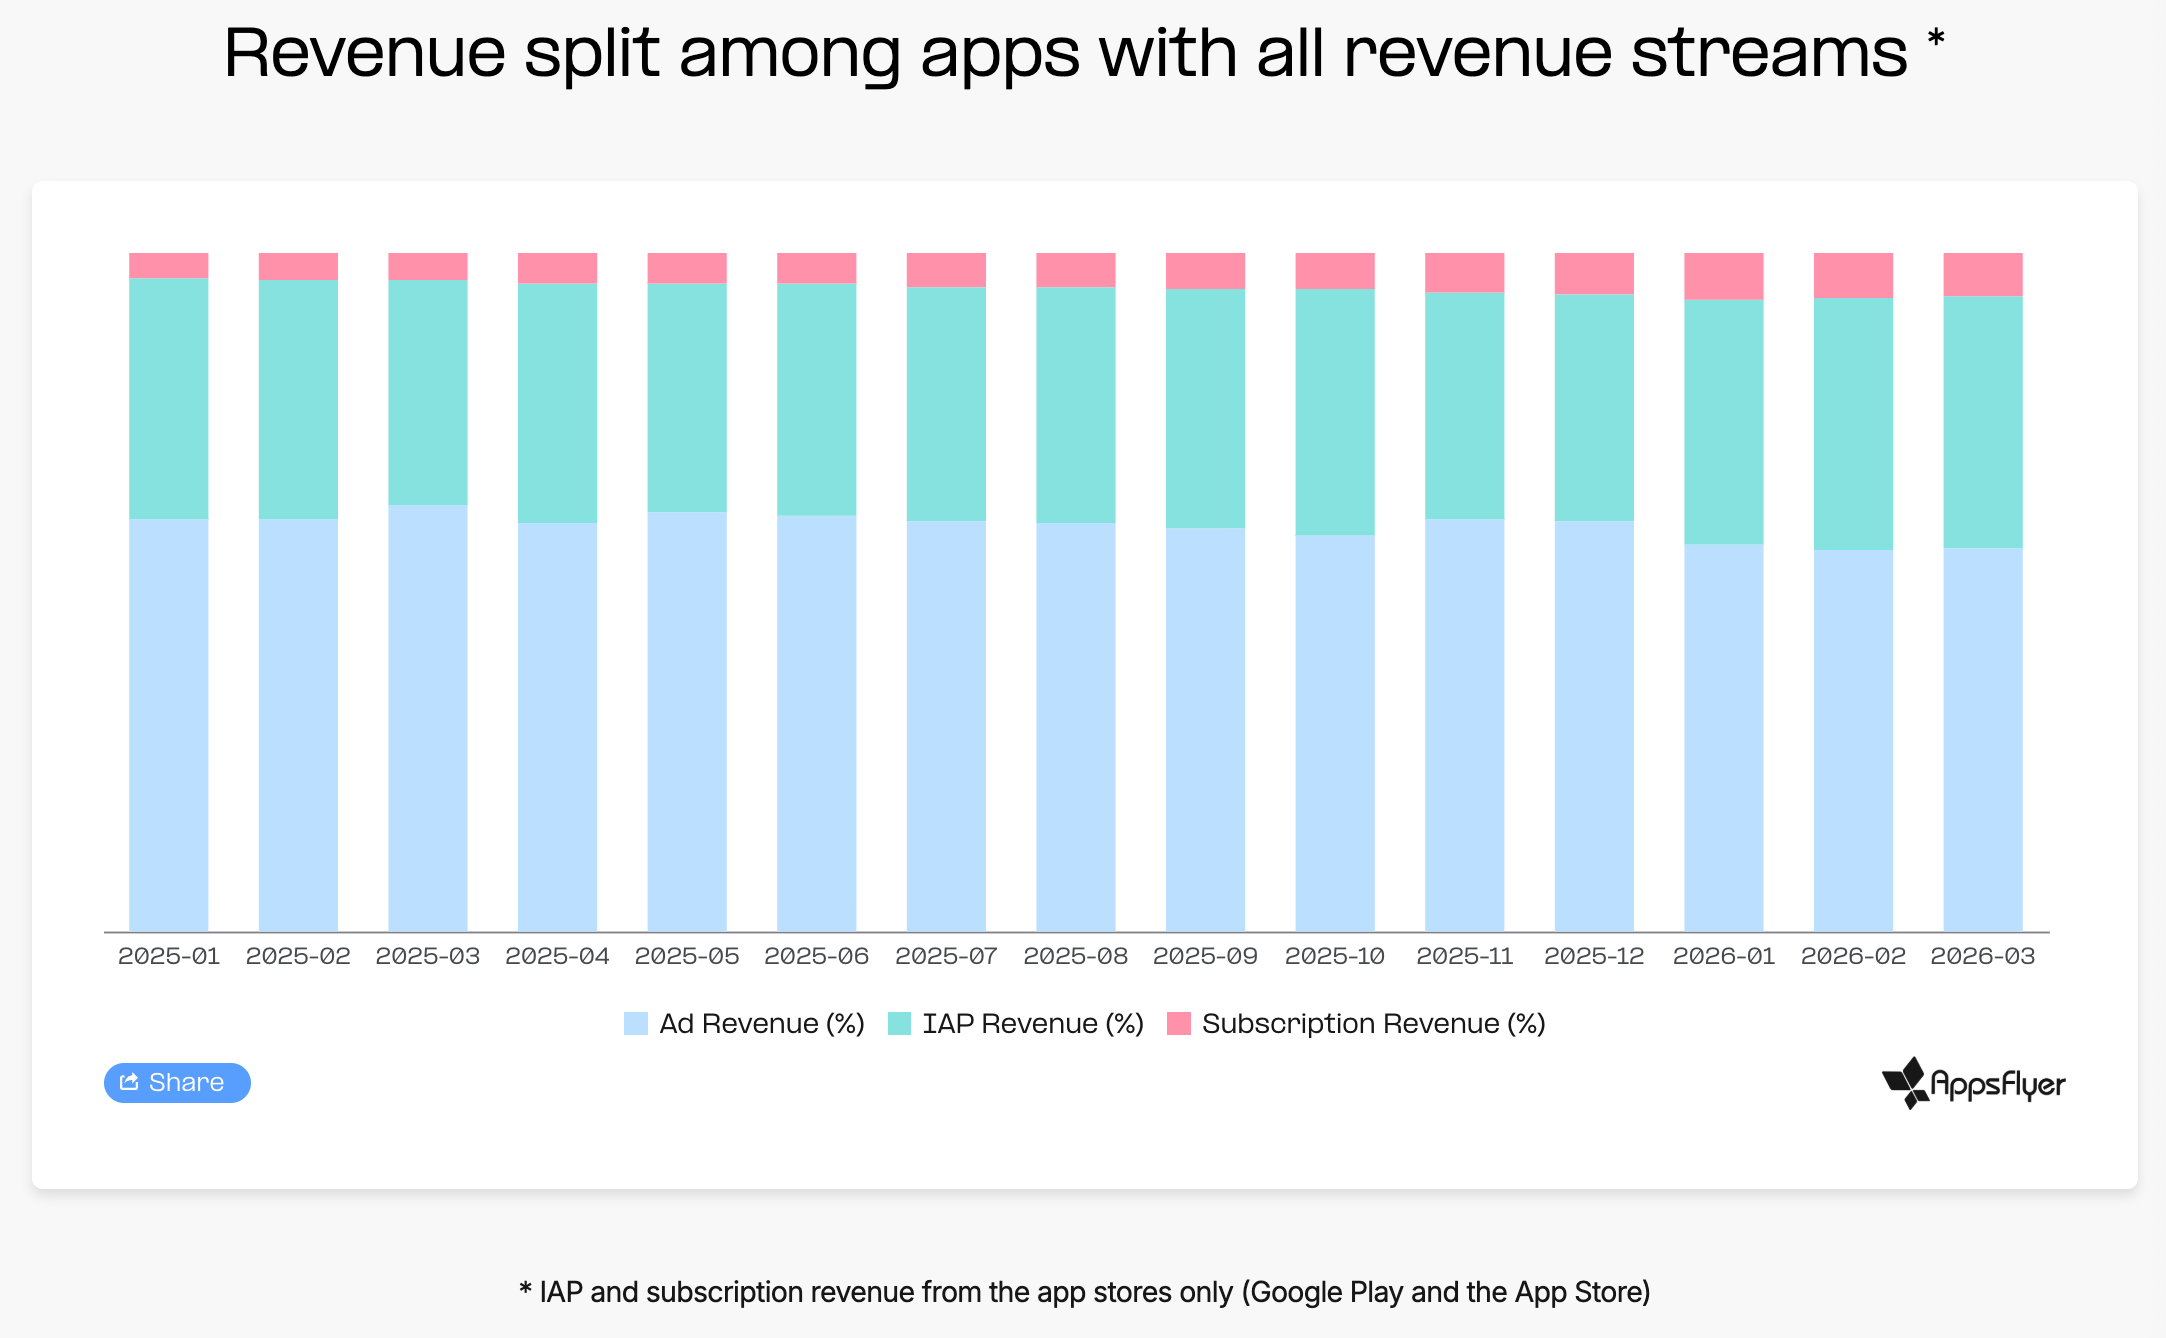
Subscription revenue has been the fastest-growing monetization stream over the past 15 months.
AppsFlyer notes that many applications combining all three monetization models are games. Within this cohort, subscription revenue increased from 4% of total revenue in January 2025 to 7% in early 2026. Most of that growth came at the expense of advertising revenue, which declined from 63% to 56% over the same period. IAP purchases account for roughly 35% of revenue within this group.
A word from our sponsor

Still paying for impressions and clicks that never convert? Advertise your PC game with PWN Games! With our CPA model, you only pay when a player installs, engages, or pays. 250+ PC games promoted, 42M+ players acquired, 10 years in the business. Trusted by top PC game publishers worldwide.
ARPU and ARPPU Benchmarks
Casino games have the highest D90 IAP ARPU globally at $2.43. Midcore titles follow at $2.13, while casual games reach $1.34.
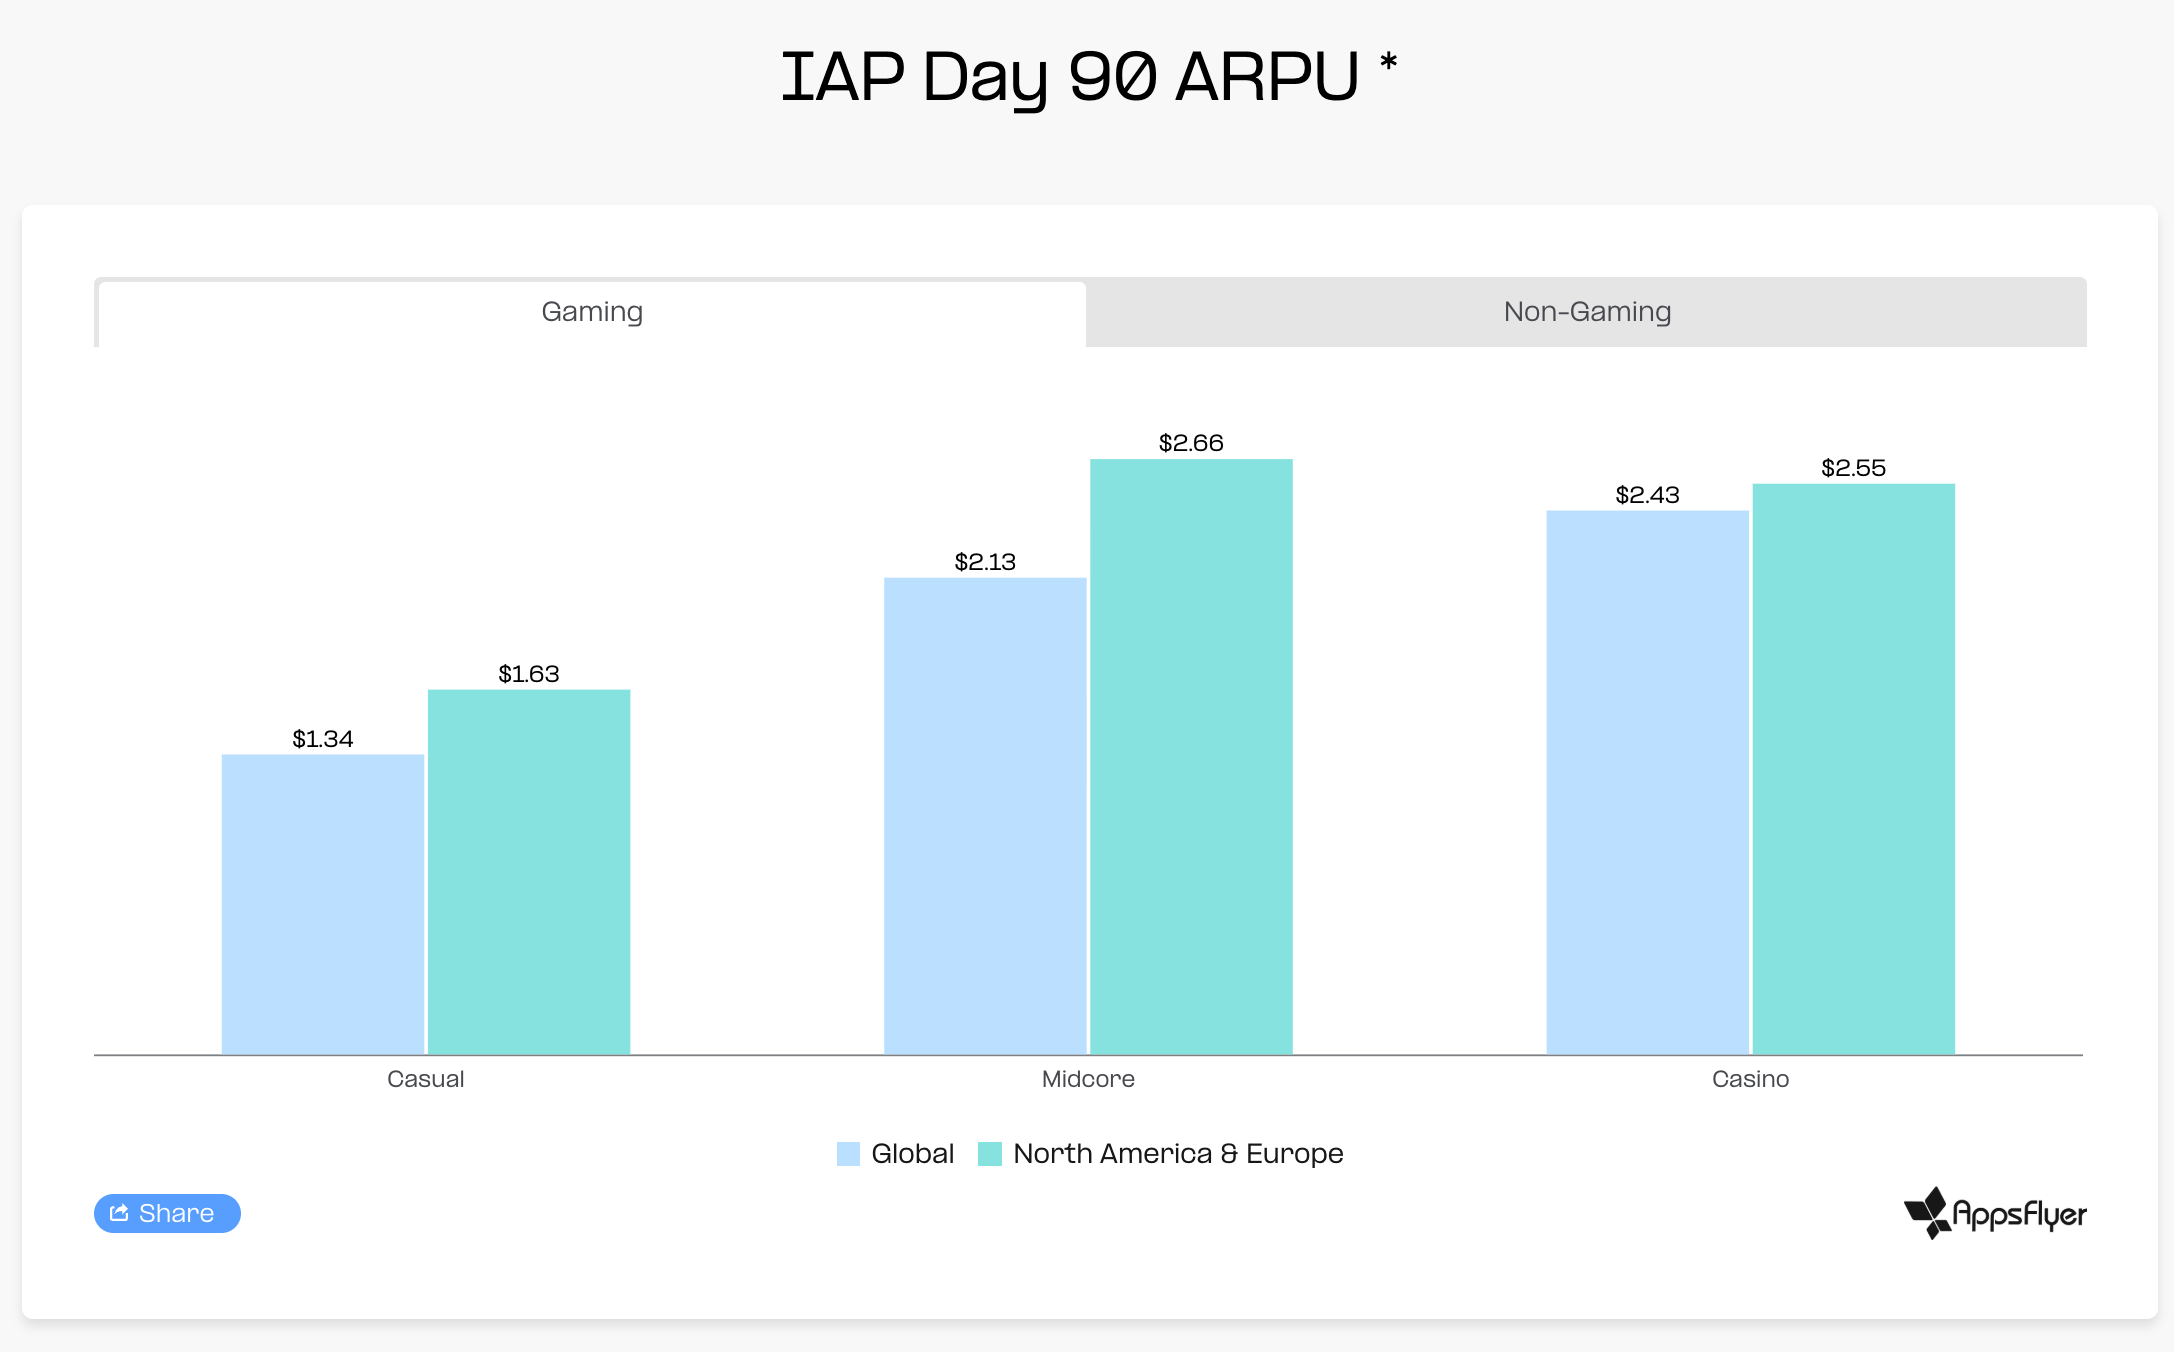
However, when looking only at North America and Europe, midcore games lead with a D90 IAP ARPU of $2.66, compared to $2.55 for casino games in the same regions.
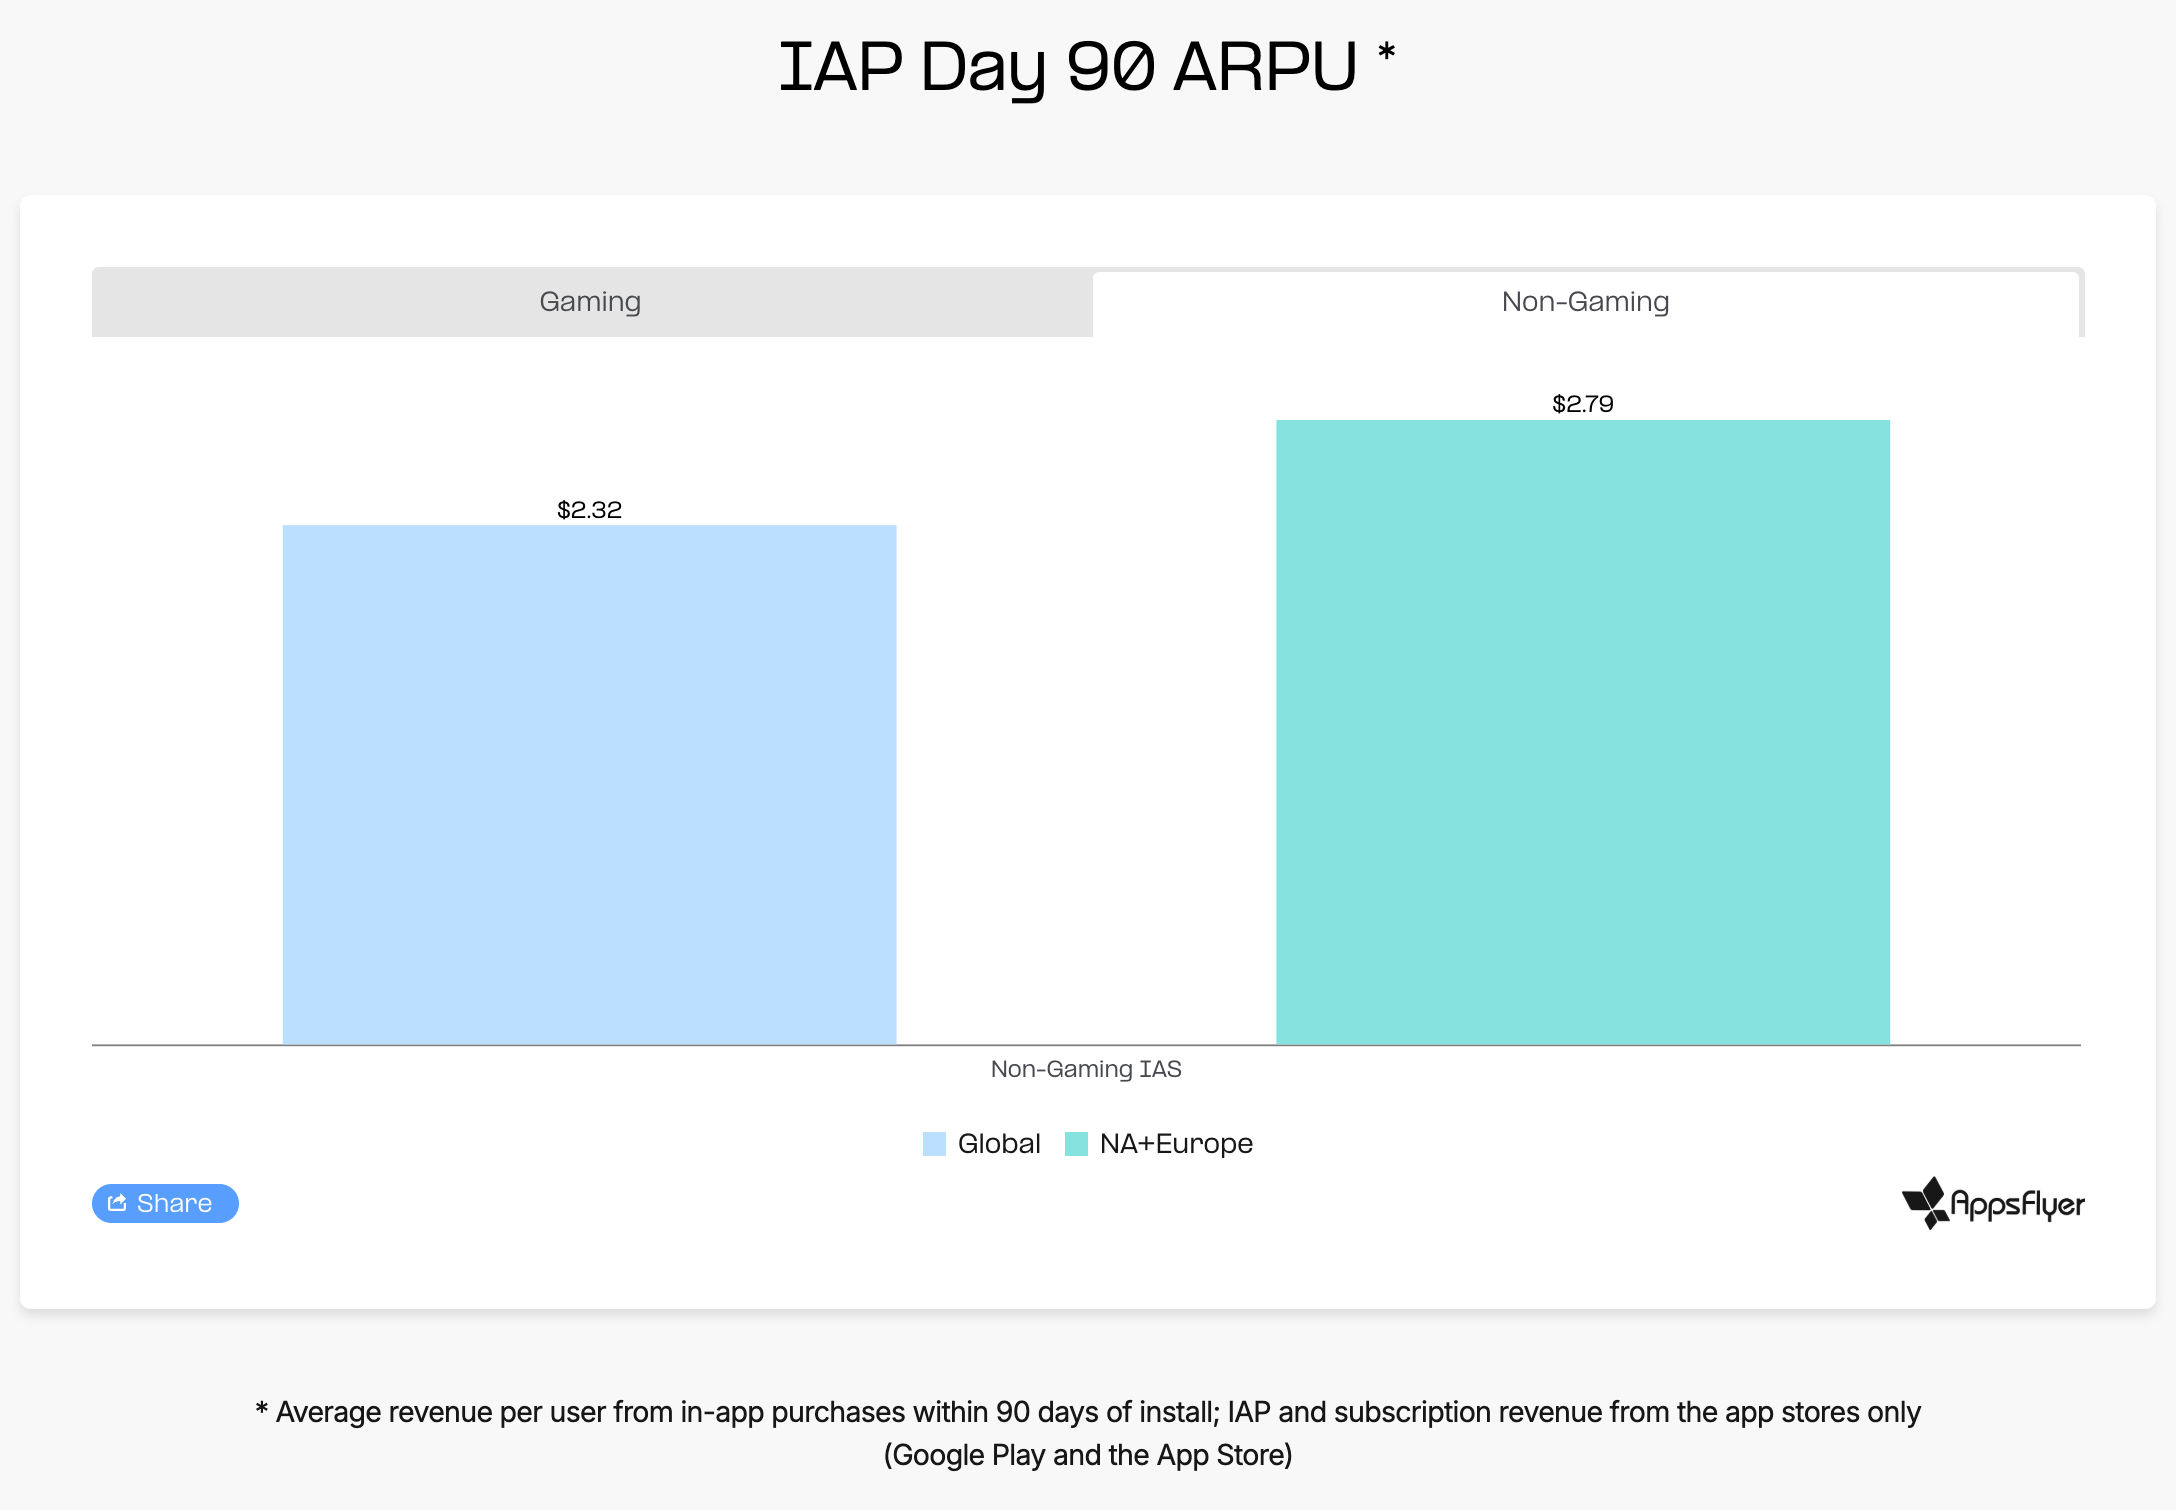
For comparison, non-gaming apps generate a global D90 IAP ARPU of $2.32, putting them on par with the highest-monetizing gaming genres. In North America and Europe, that figure rises to $2.79, surpassing midcore games.
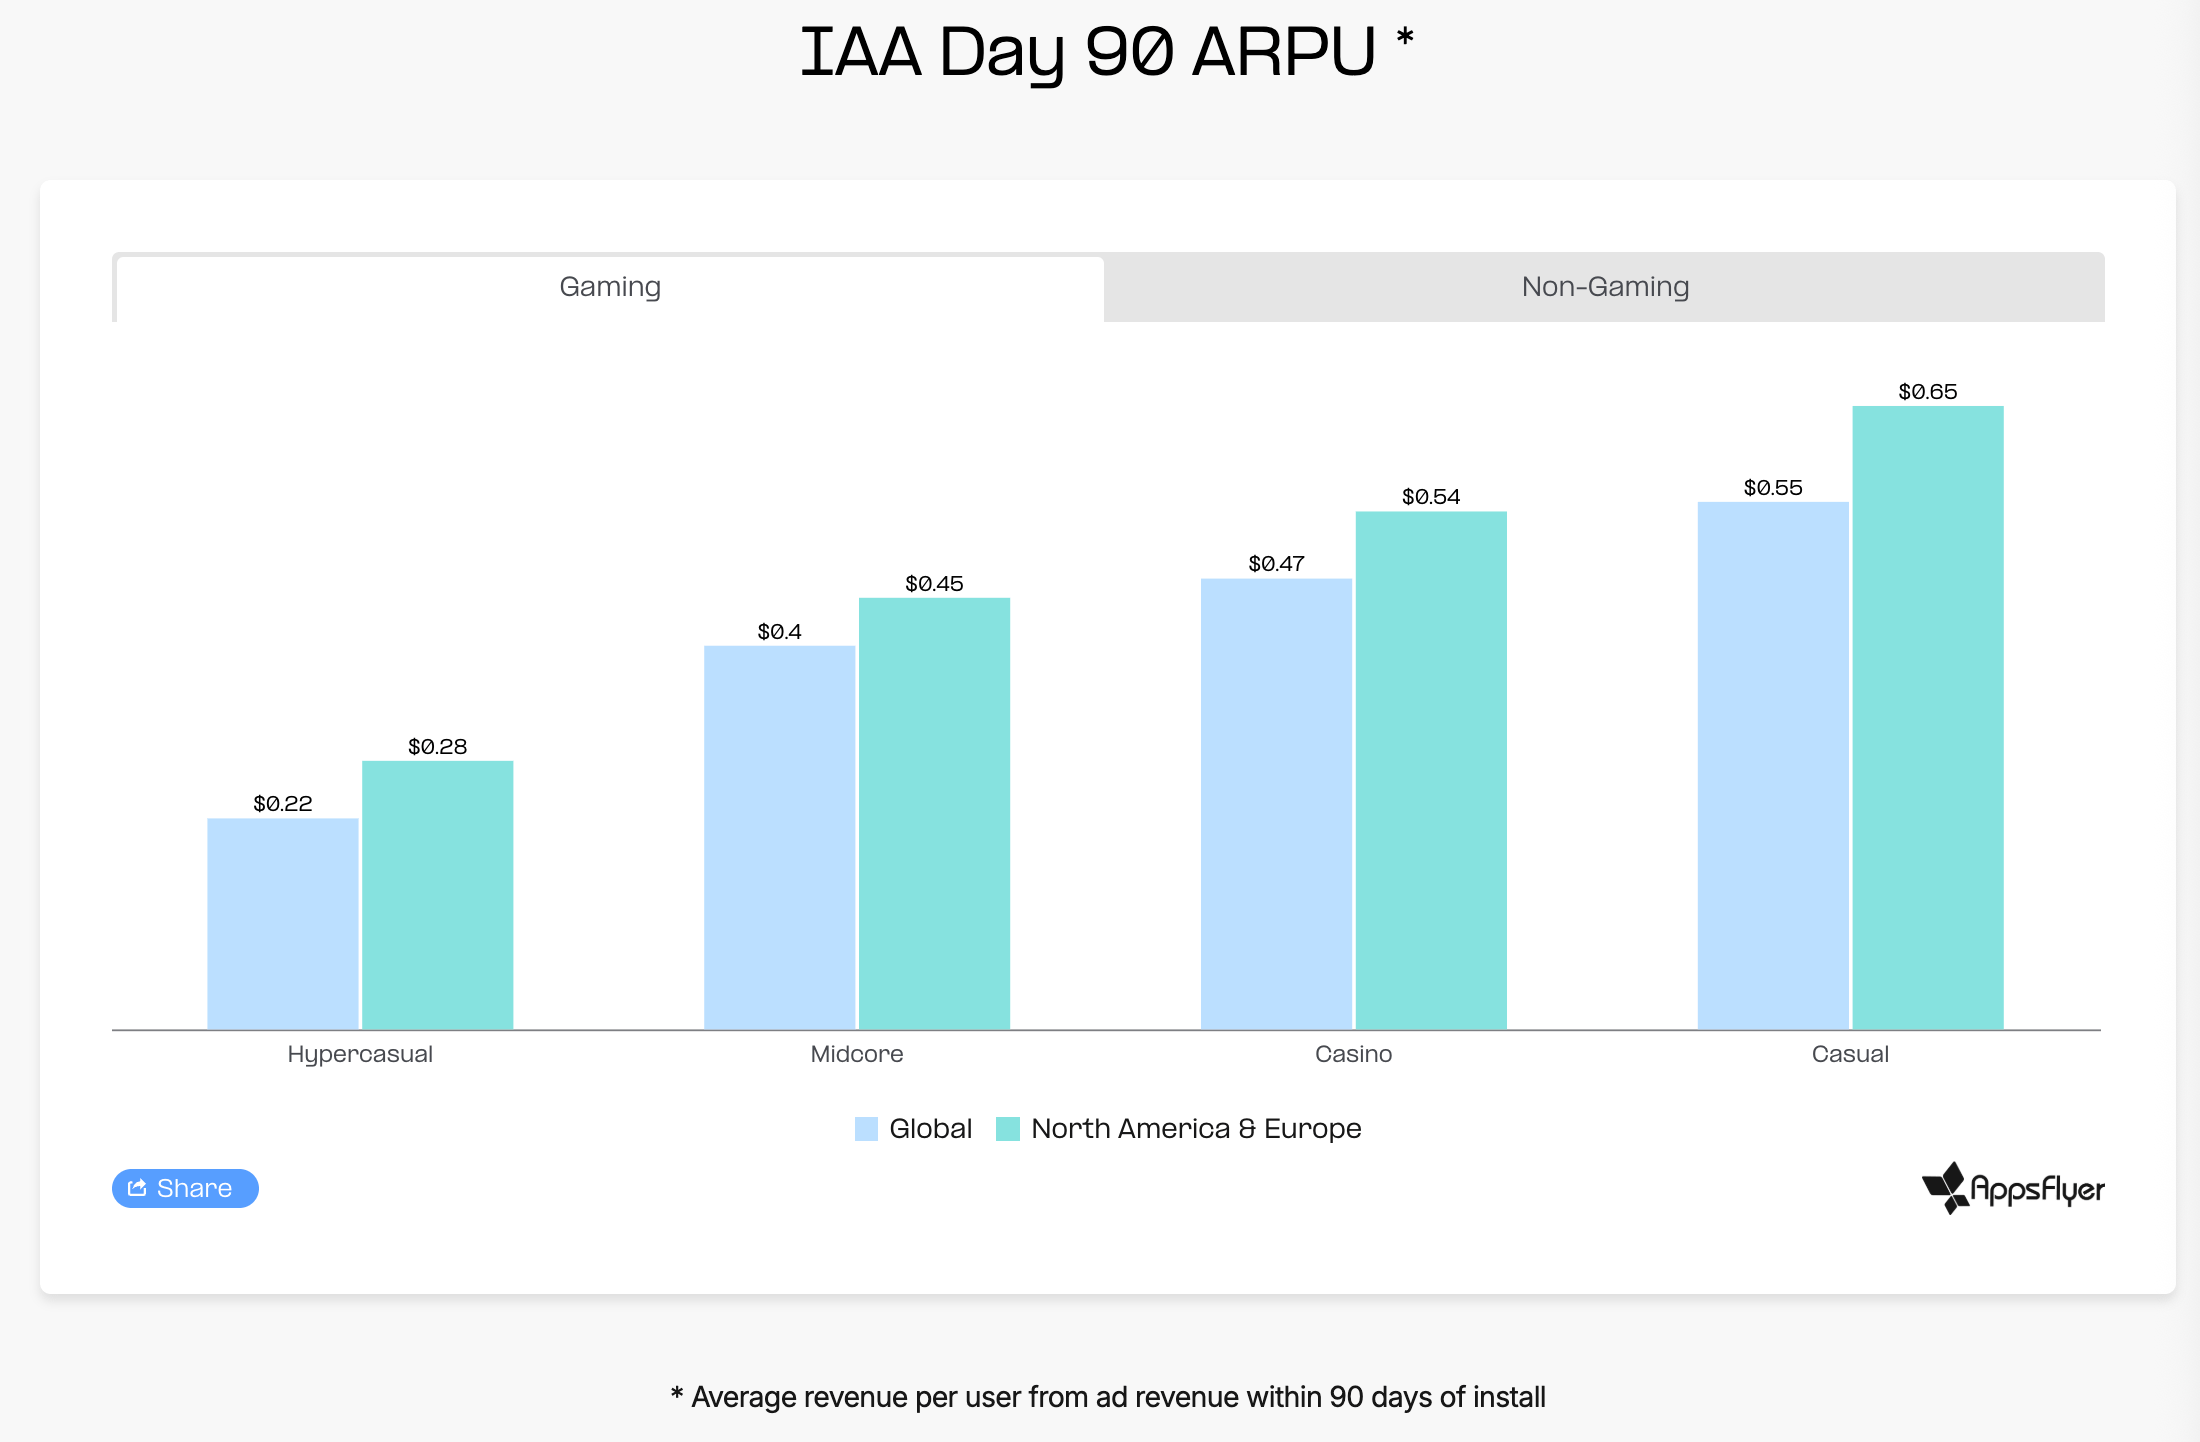
In terms of advertising monetization, casual games lead with a D90 IAA ARPU of $0.55. They are followed by casino games ($0.47), midcore titles ($0.40), and hypercasual games ($0.22). These figures are global averages; North America and Europe show higher results.
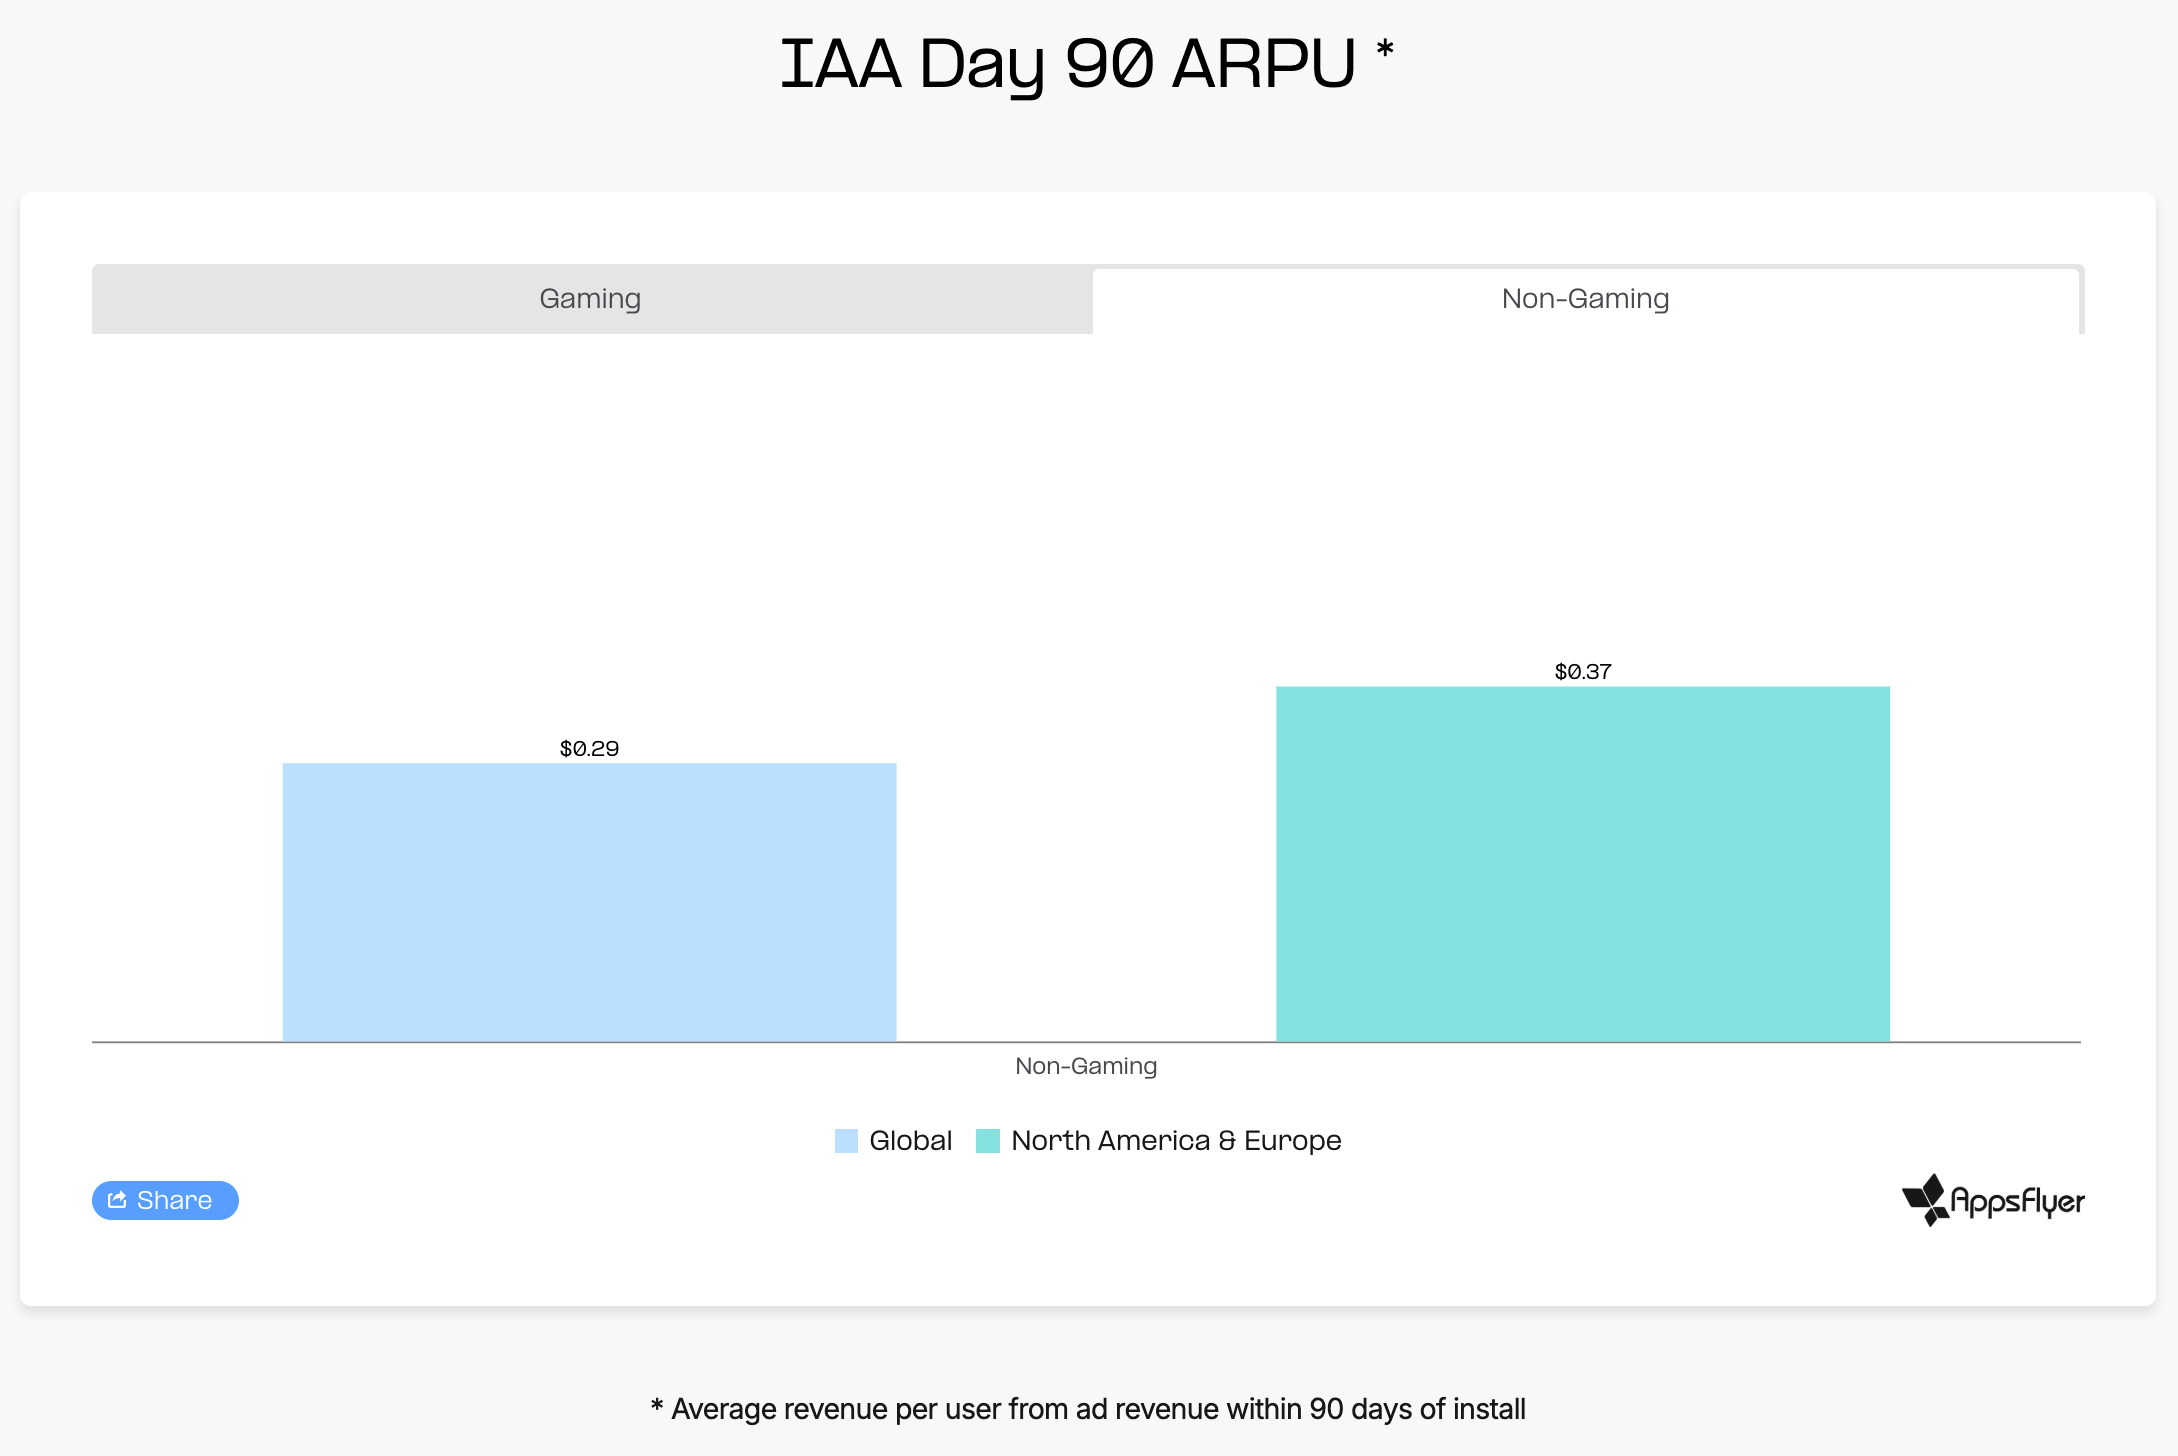
▫️Most gaming genres monetize users more effectively than non-gaming apps.
Looking at D90 IAP ARPPU, casino games rank first at $11.40. Midcore games are second at $9.80, with casual games close behind at $7.26.
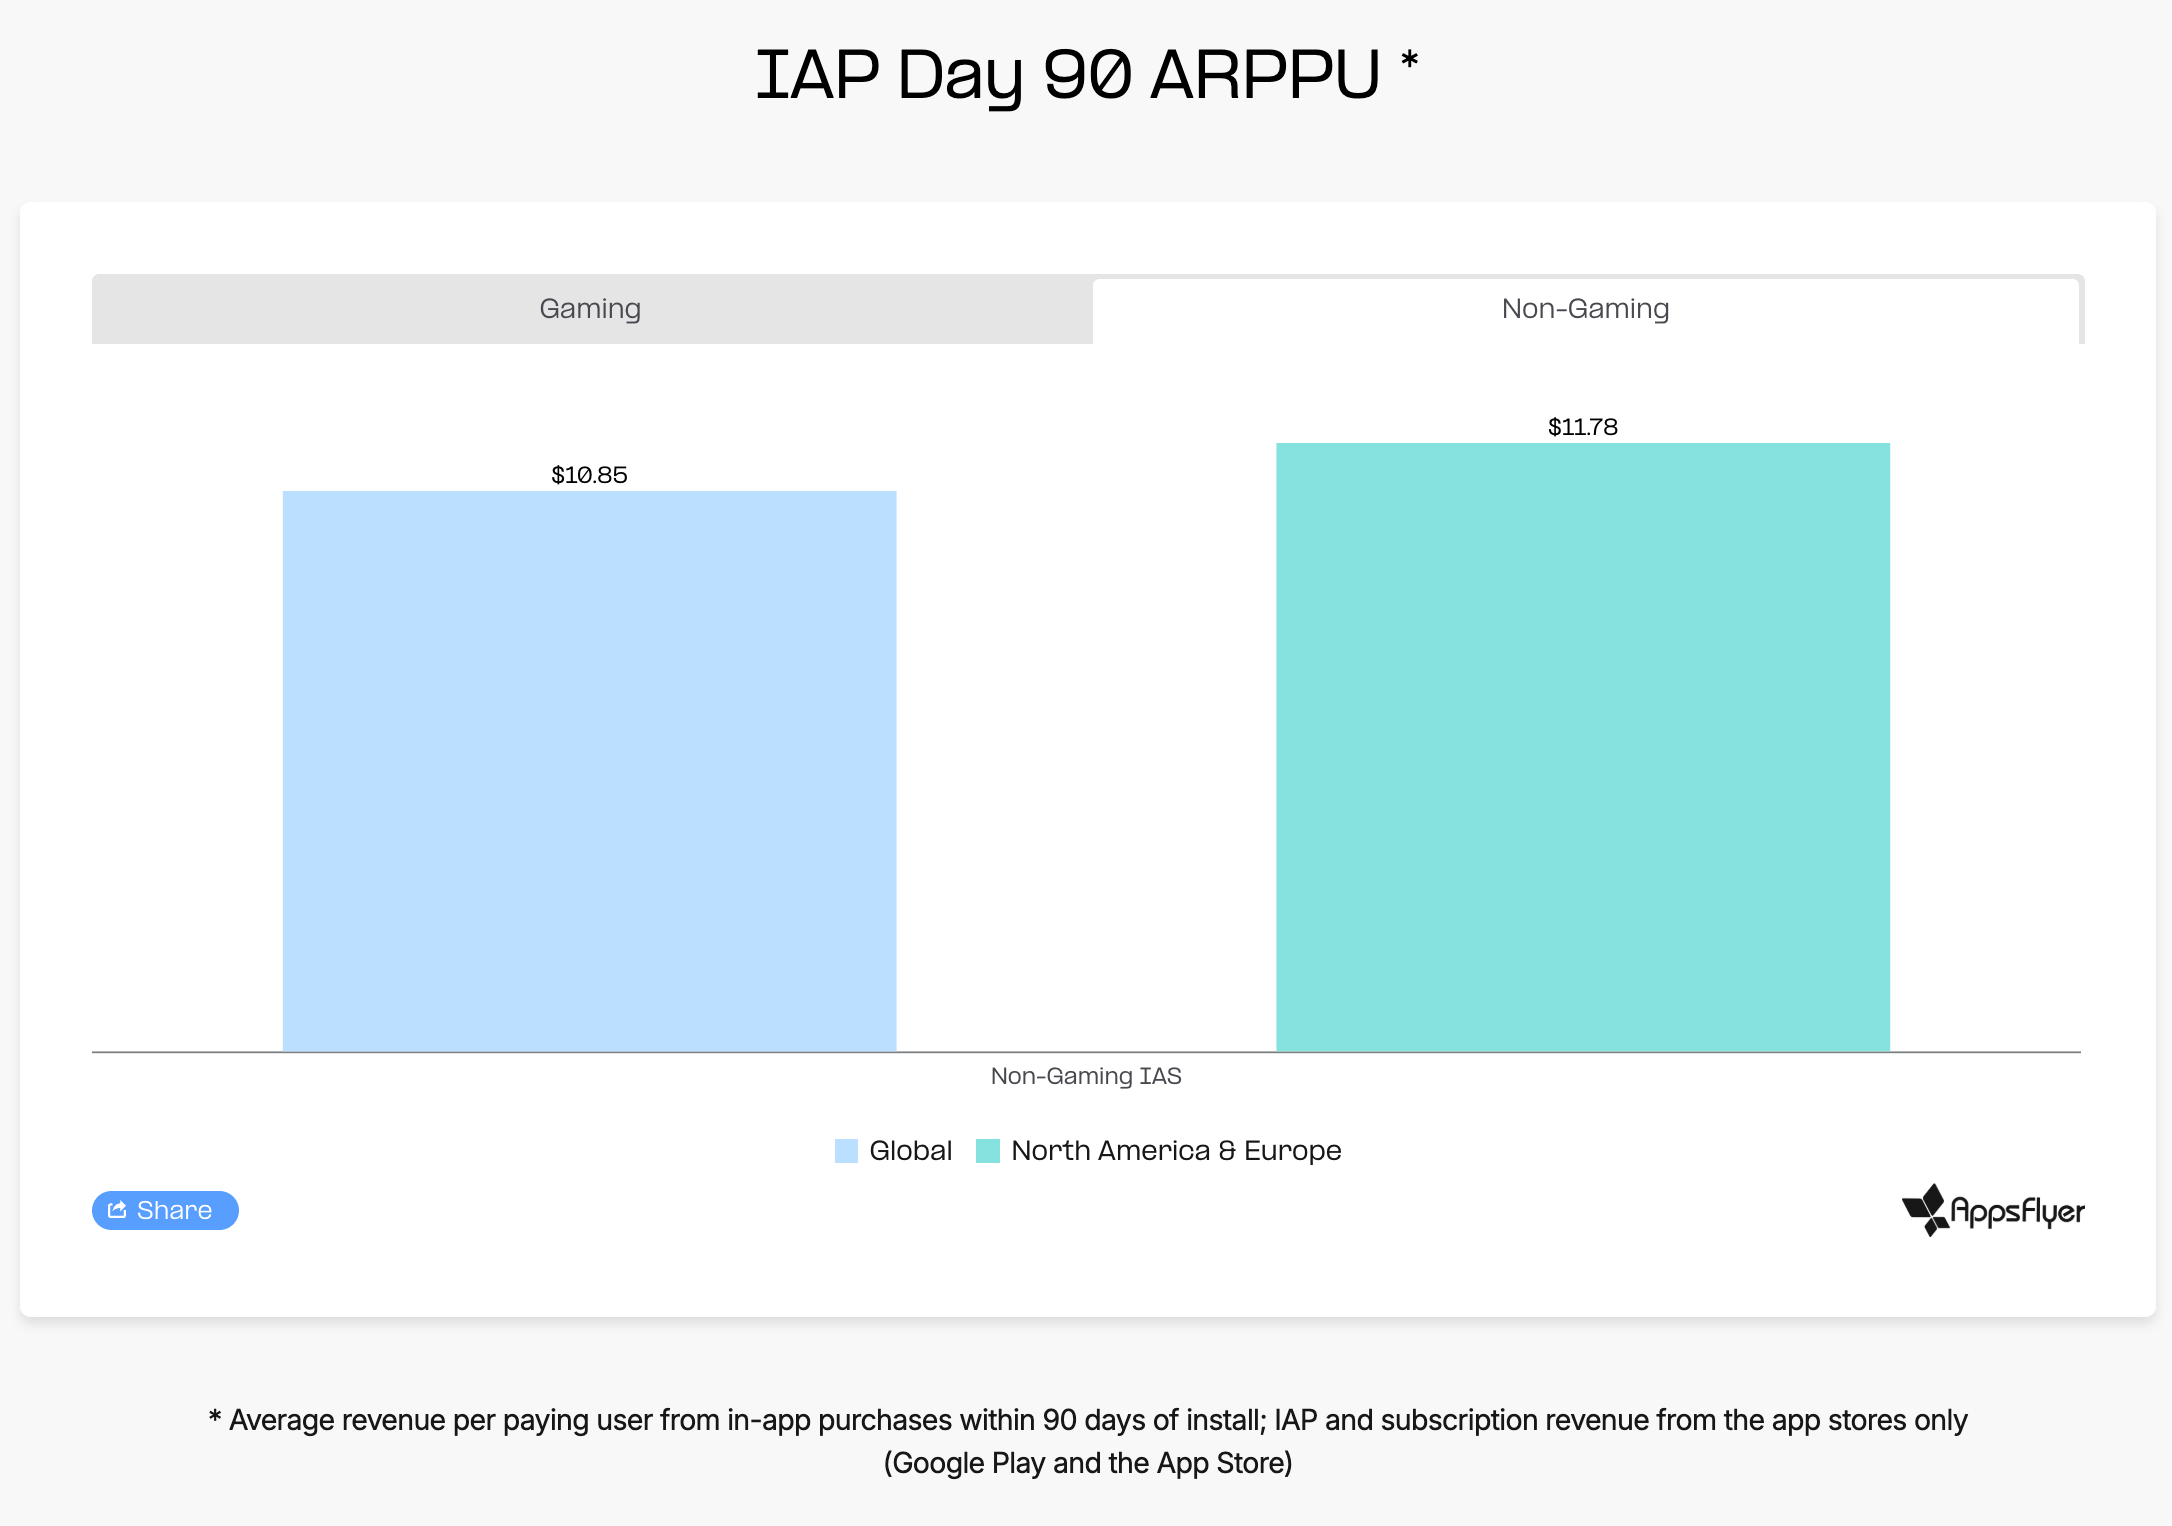
Non-gaming apps sit between casino and midcore games on this metric, with a D90 IAP ARPPU of $10.85. Thanks to their value proposition, non-gaming apps monetize paying users at a level comparable to social casino games.
Accumulation of Different Revenue Streams During the First 60 Days
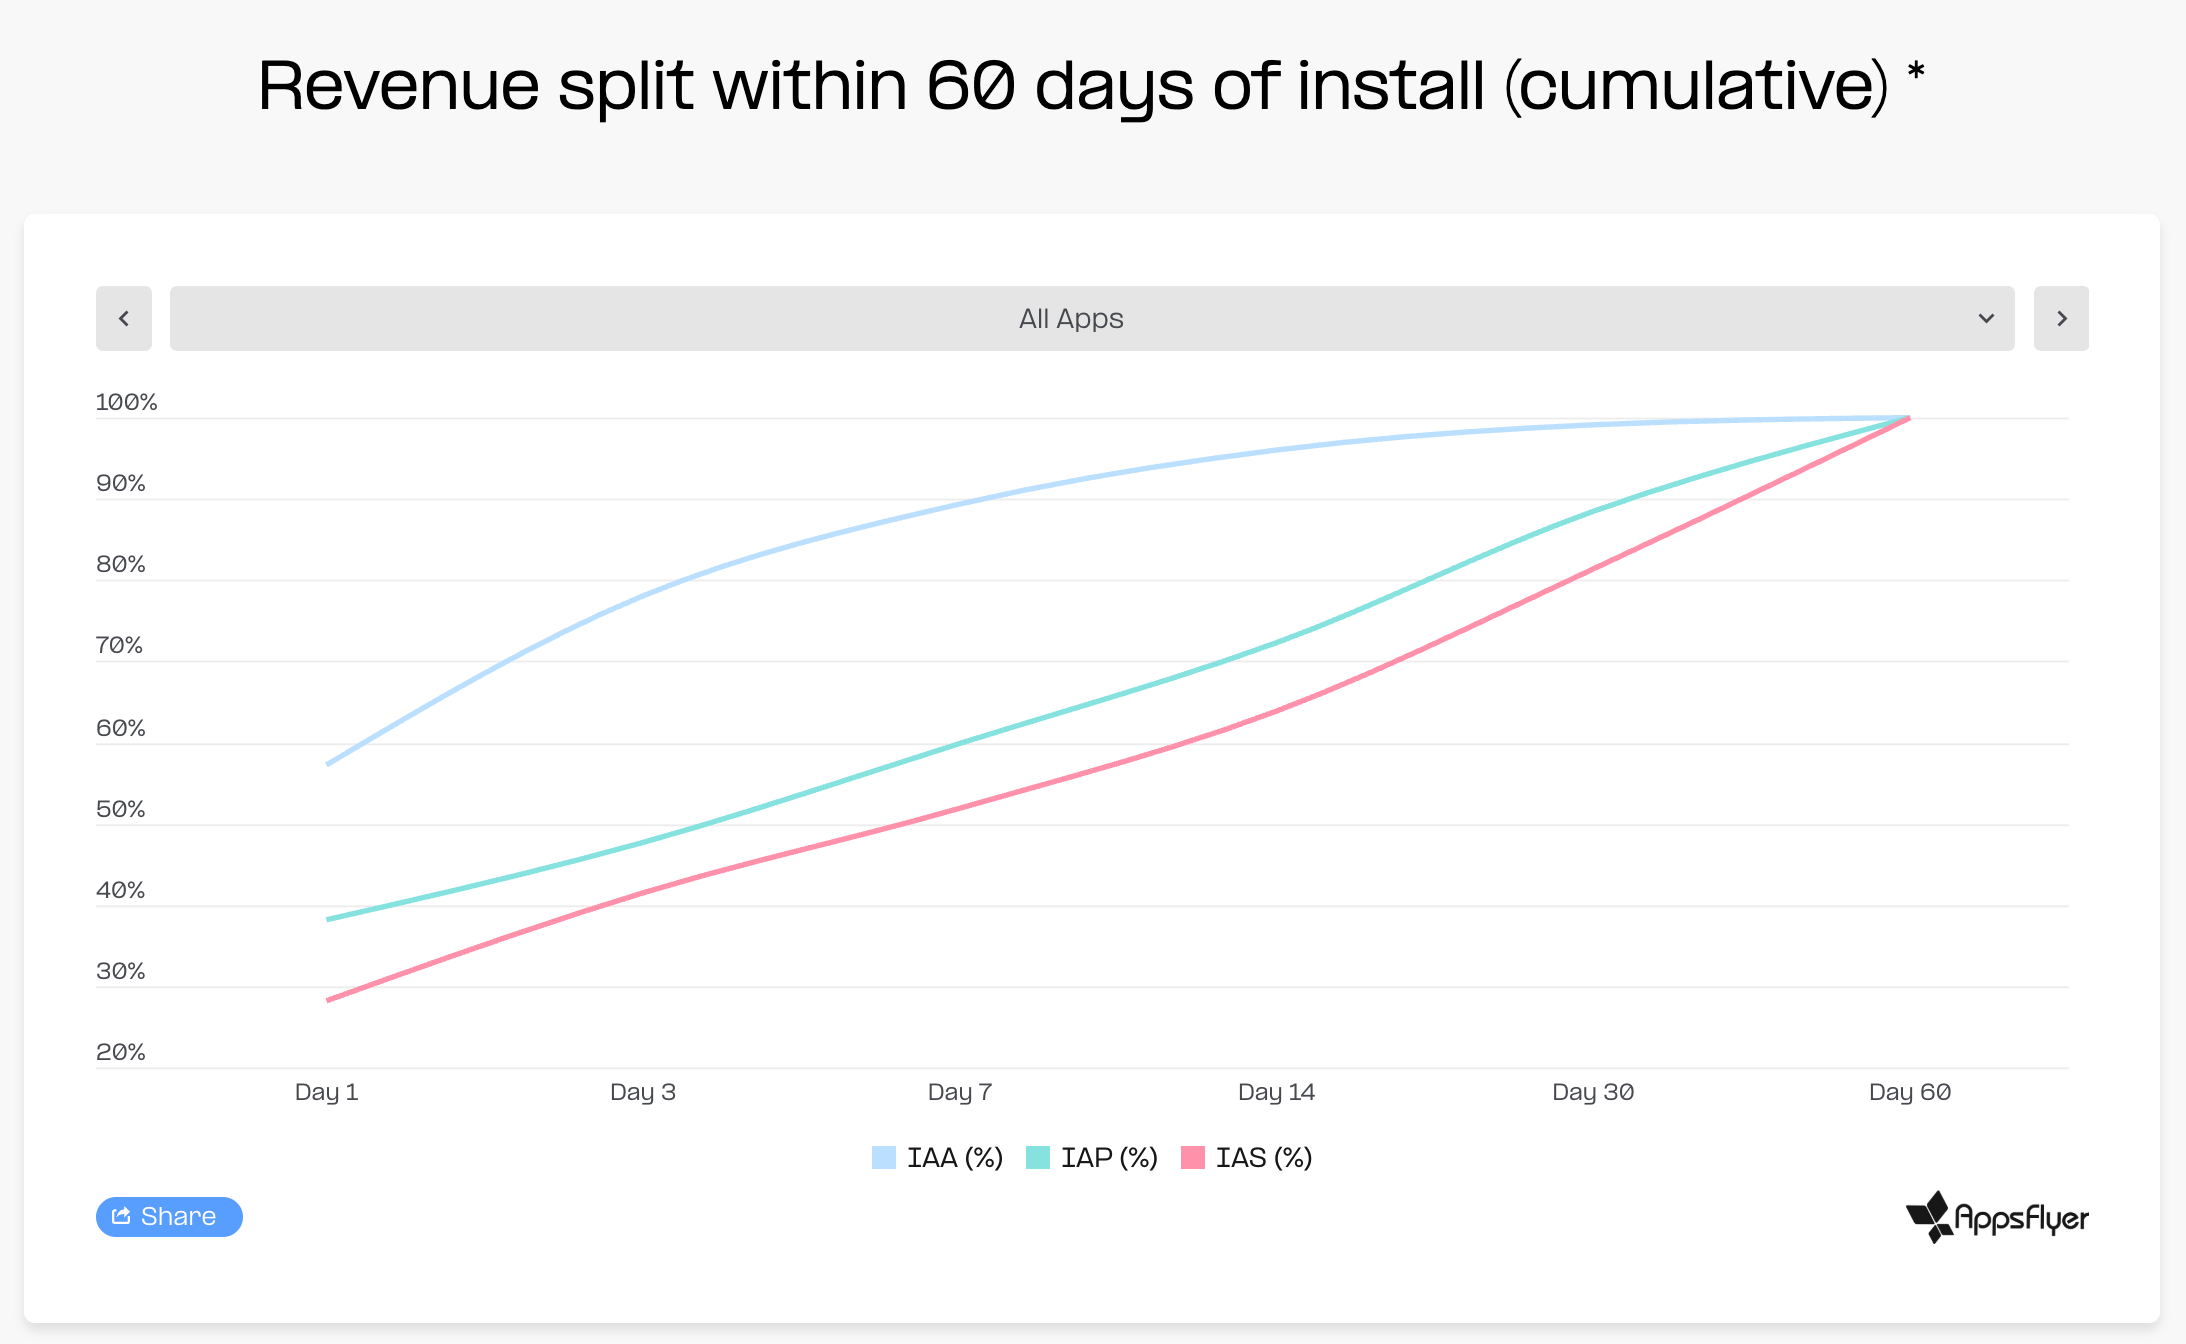
AppsFlyer provides interesting insights into how revenue accumulates across different monetization models. By Day 7, in-app advertising is already generating 89% of its total D60 revenue. IAP revenue reaches 60% of its D60 total by Day 7, while subscriptions reach 52%.
The differences are even more visible on Day 1. Advertising revenue on the first day already represents 57% of total D60 revenue. For subscriptions, Day 1 accounts for 28% of D60 revenue.
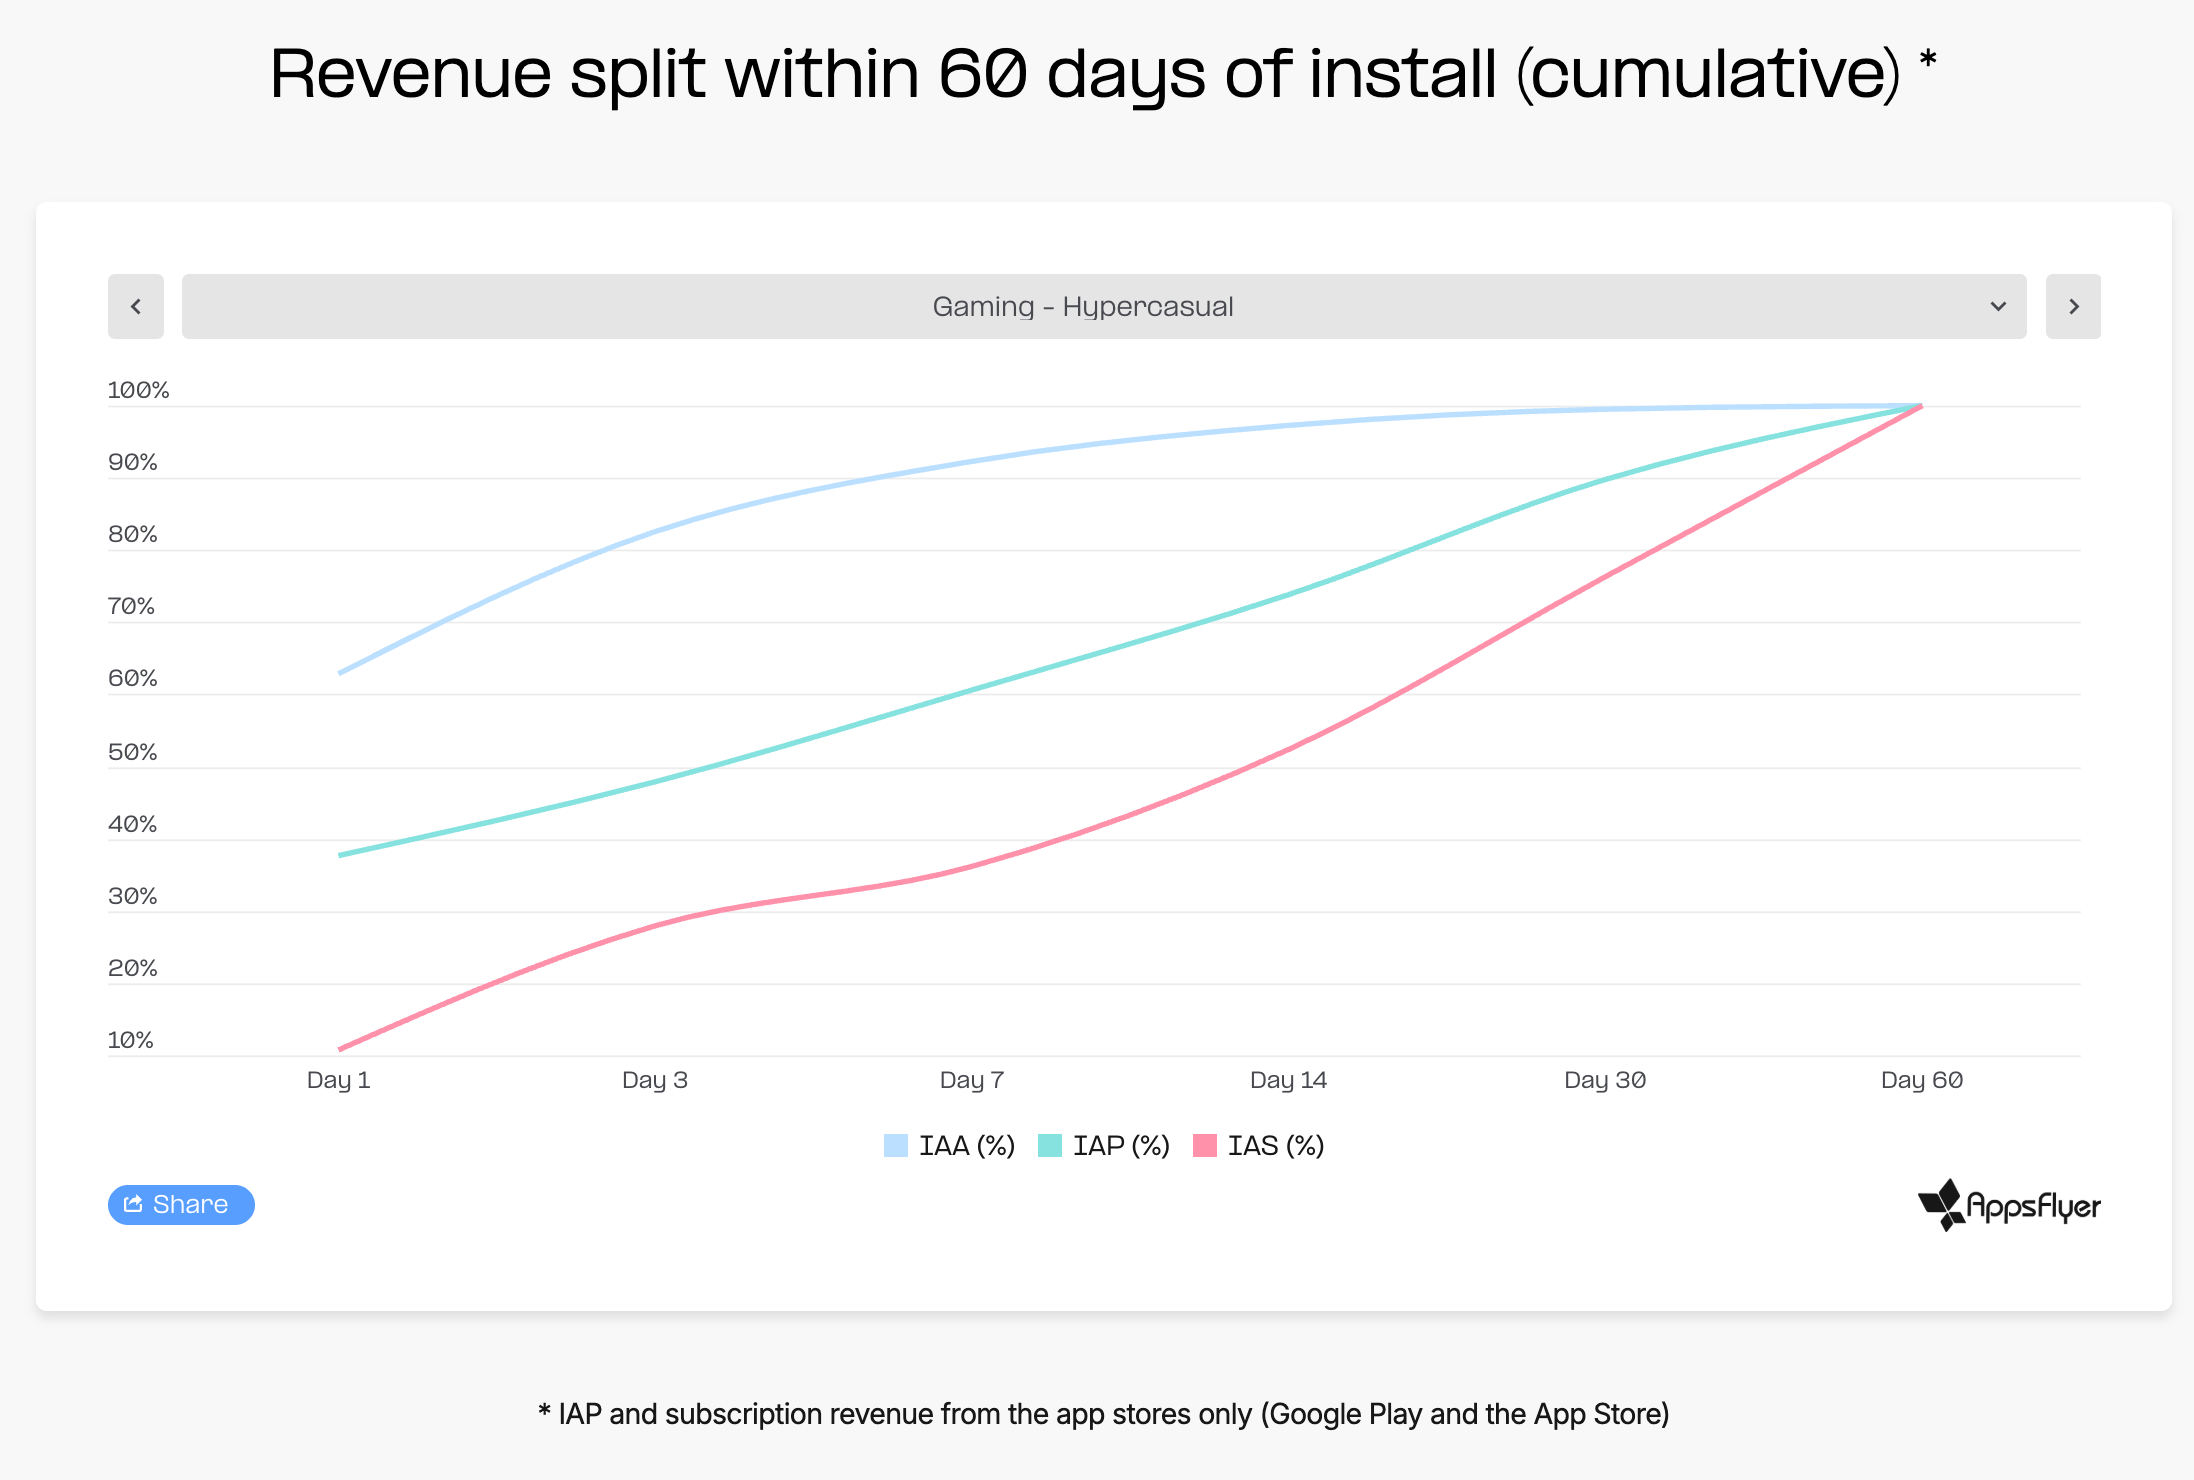
In gaming, these patterns are most visible in the hypercasual segment, where 63% of all D60 ad revenue is generated on Day 1.
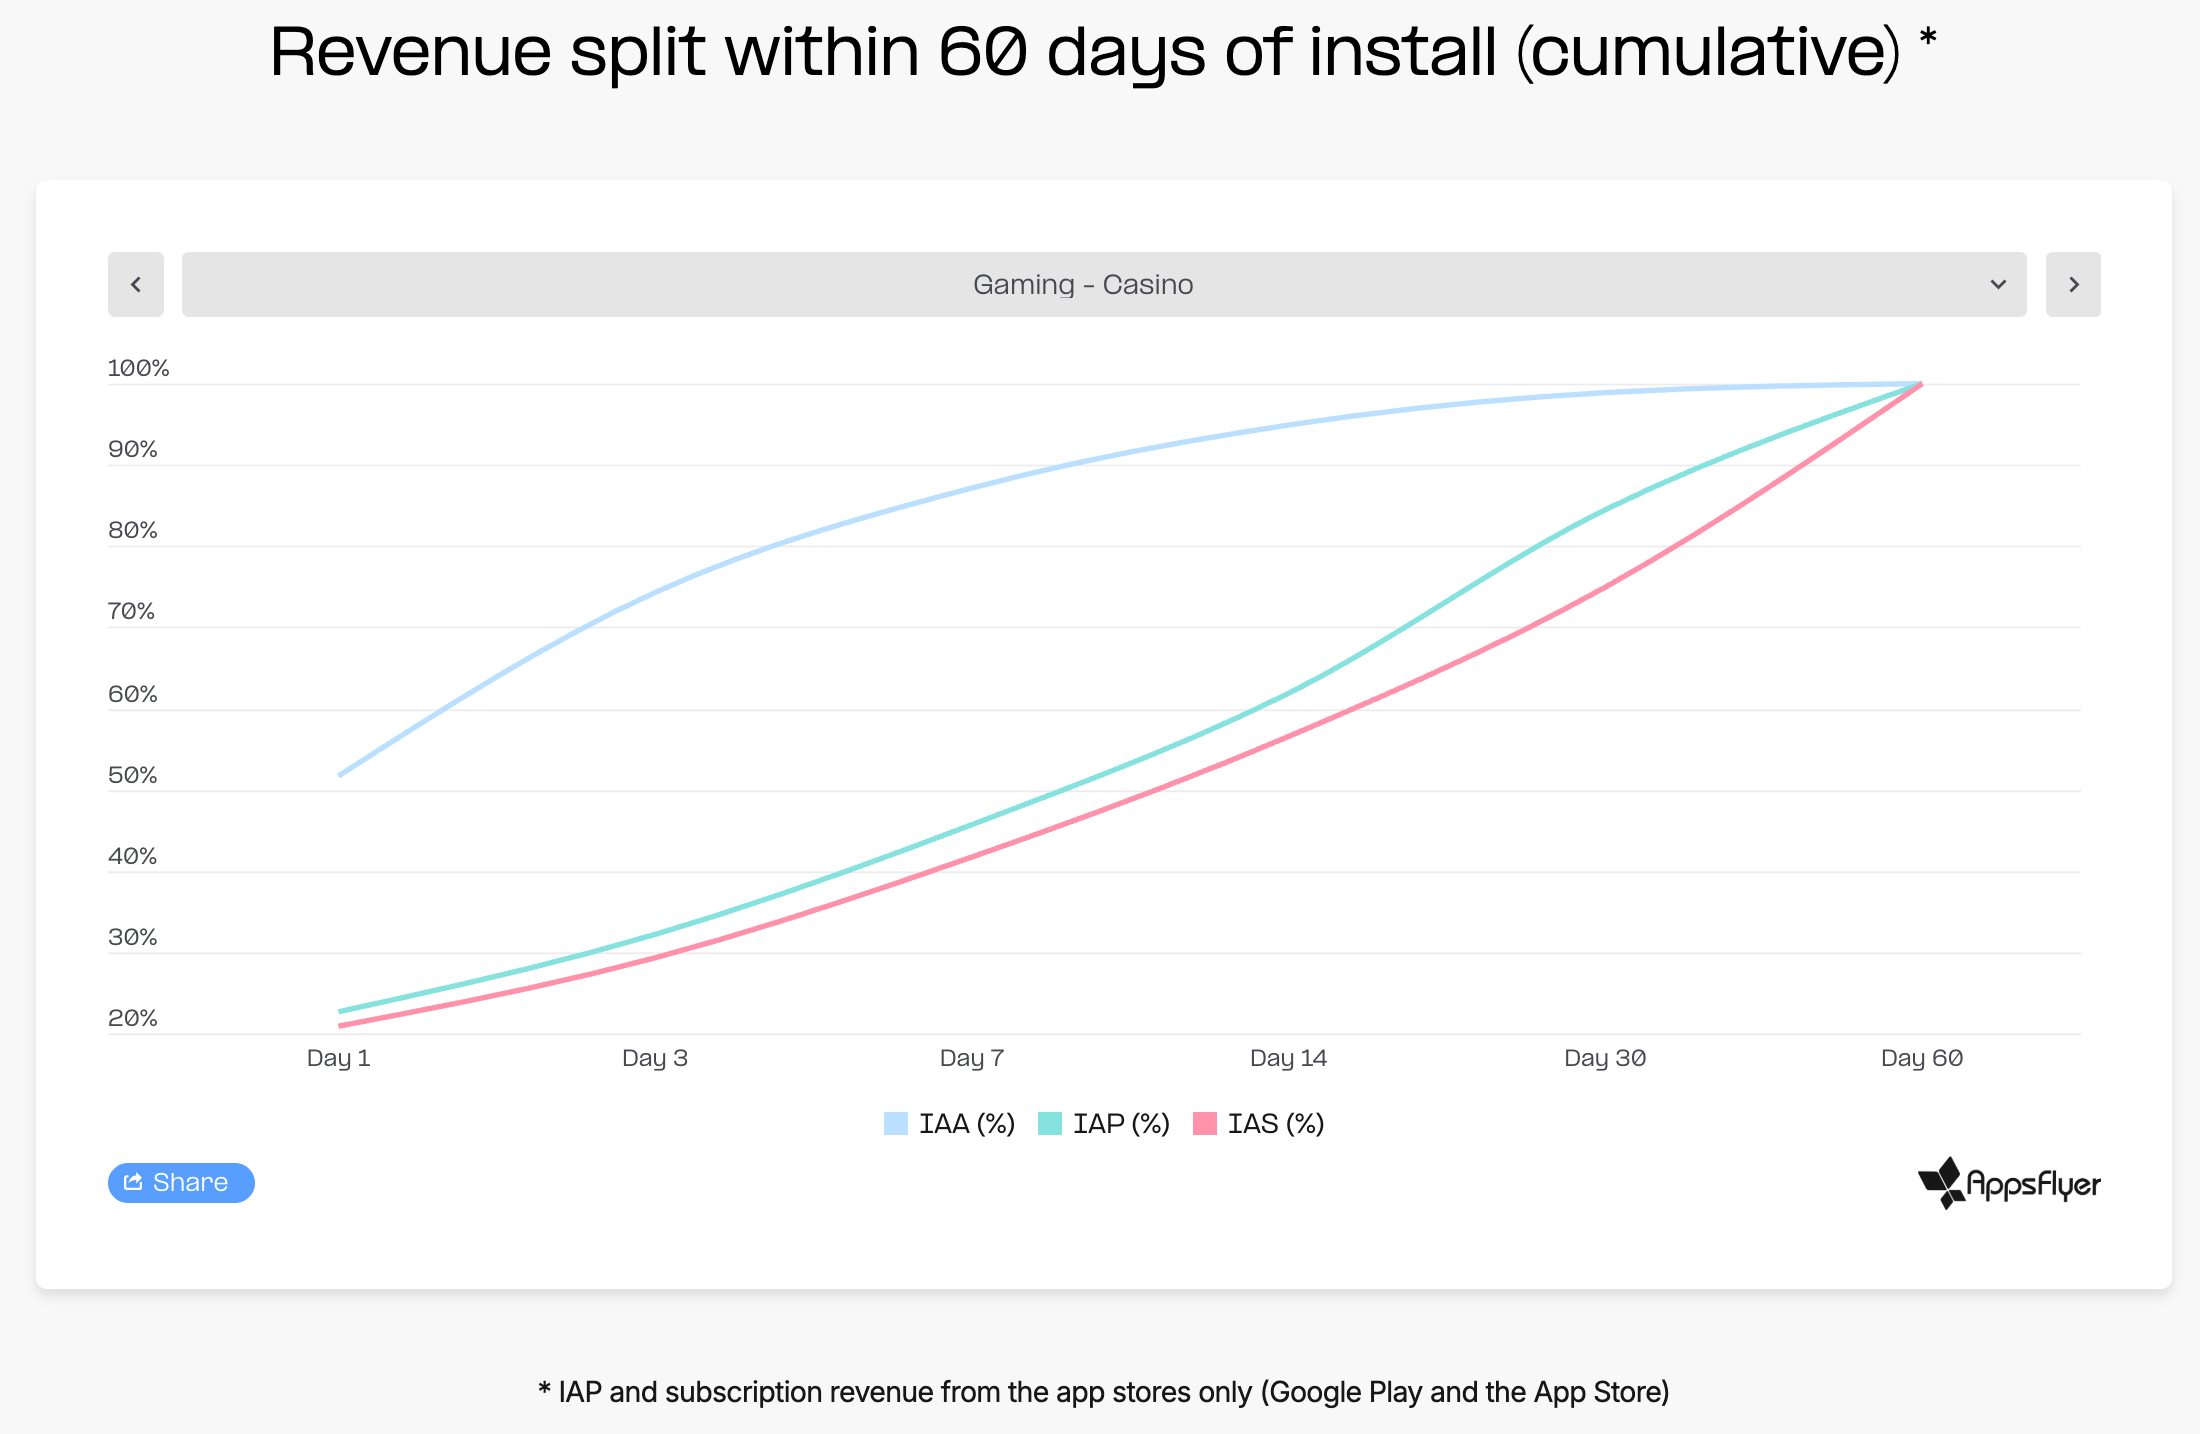
For casino games, Day 1 IAP revenue accounts for 23% of total D60 revenue, compared to an average of 38% across all apps.
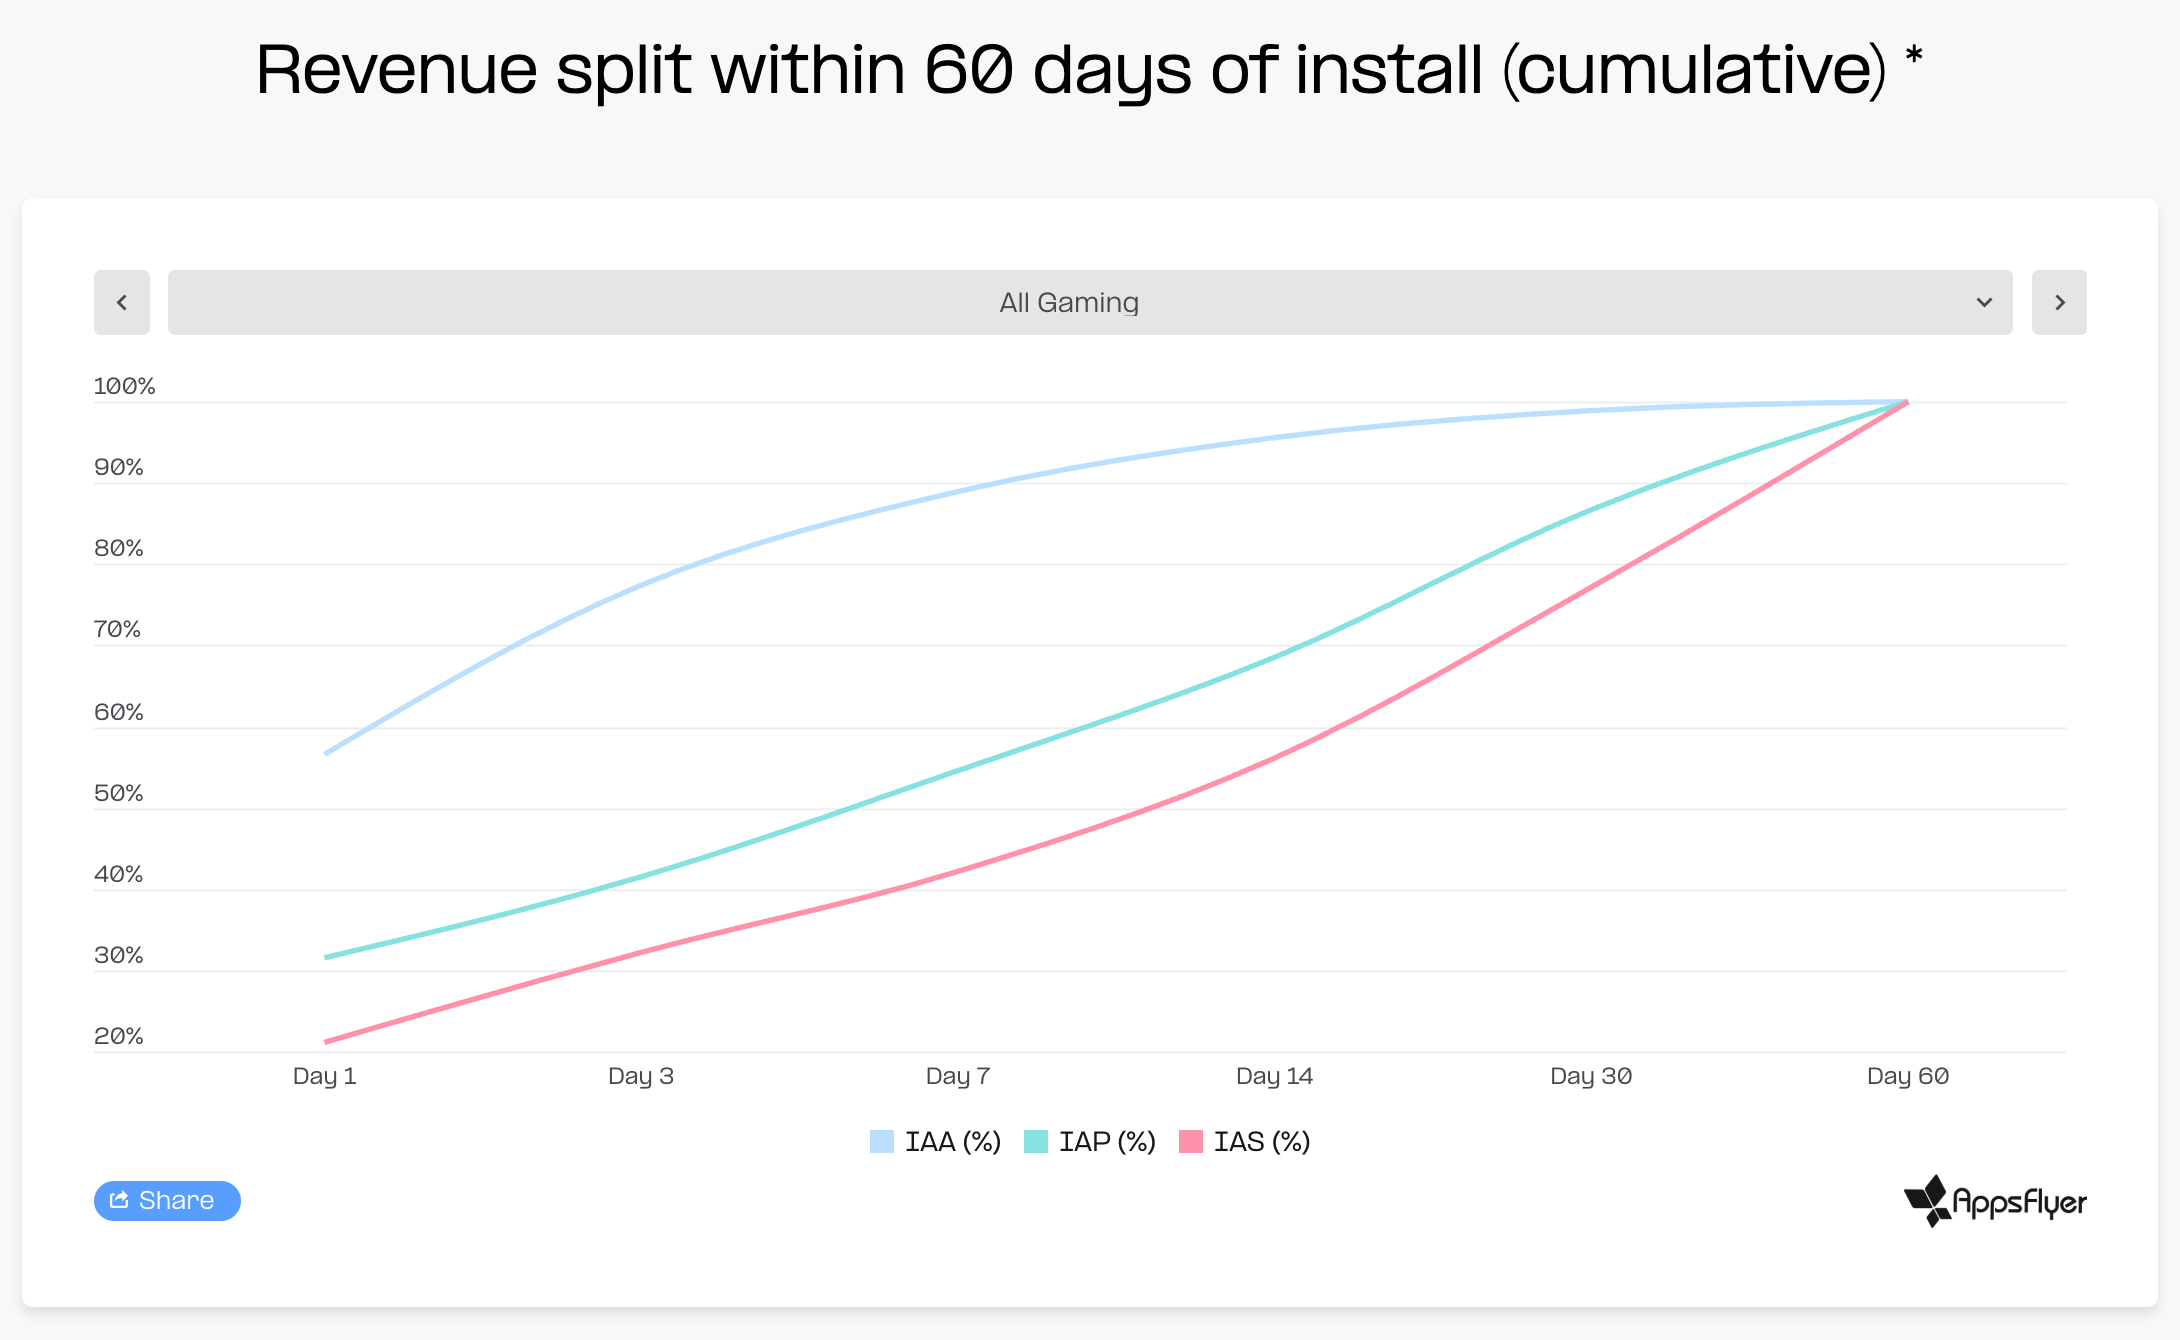
For subscription revenue, games generate 21% of their D60 subscription revenue on Day 1, compared to 28% across all apps.
❗️AppsFlyer attributes this to the fact that games need time to introduce players to the experience before monetizing them. Unlike utility apps, games do not provide an immediate functional benefit, making early-stage monetization more challenging.
Among non-gaming apps, there are two dominant approaches: monetizing users immediately upon launch, or offering a trial period and monetizing once it ends. Depending on the model, benchmarks vary significantly.
Revenue from Paid and Organic Users
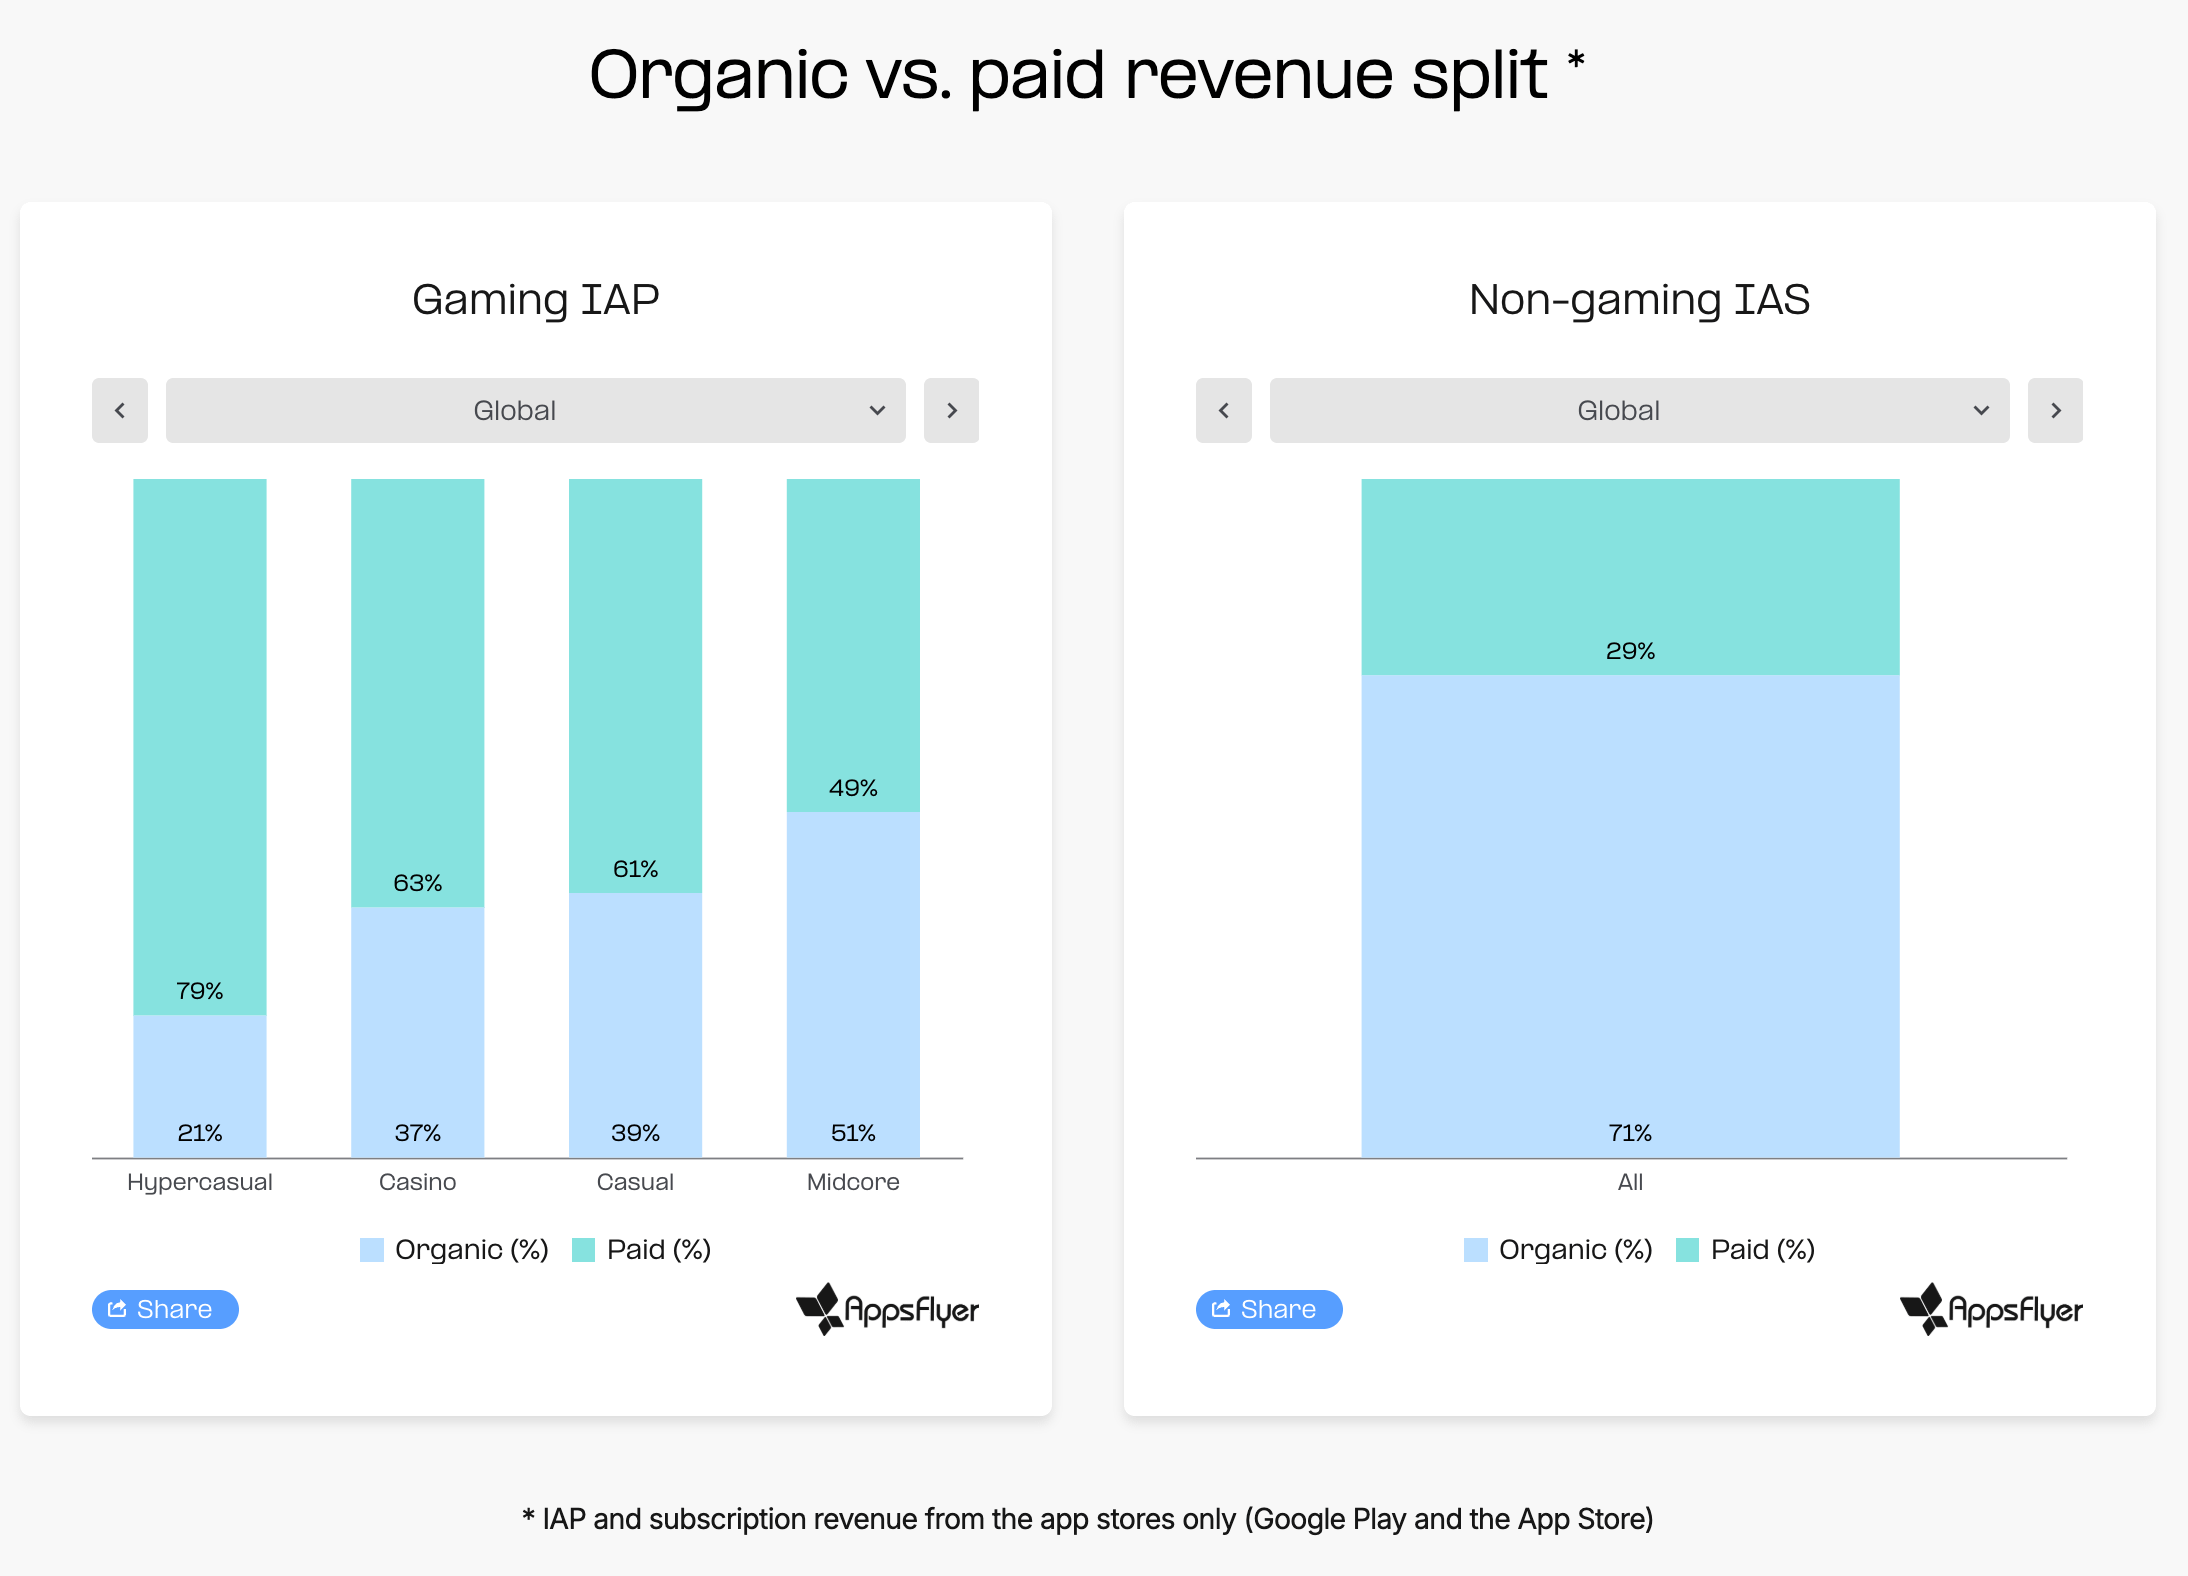
Paid installs account for 59% of all IAP revenue in gaming apps. For non-gaming apps, paid installs generate 30% of revenue, although that revenue is primarily subscription-based.
In hypercasual games, 79% of all payments come from paid traffic. The figure is 64% for casino games, 61% for casual games, and 49% for midcore games.
Regional differences also matter. In LATAM, paid traffic accounts for 37% of total revenue, and 43% in midcore games. This is largely because spending is concentrated in North American markets.
Non-gaming apps show a very different pattern. In North America, paid traffic accounts for only 31% of revenue, while in MEA, organic users generate 80% of all revenue. Different business models, different purchase motivations, and different marketing strategies drive these results.
A word from our sponsor

Still paying for impressions and clicks that never convert? Advertise your PC game with PWN Games! With our CPA model, you only pay when a player installs, engages, or pays. 250+ PC games promoted, 42M+ players acquired, 10 years in the business. Trusted by top PC game publishers worldwide.
Revenue Structure of Games and Non-Gaming Apps
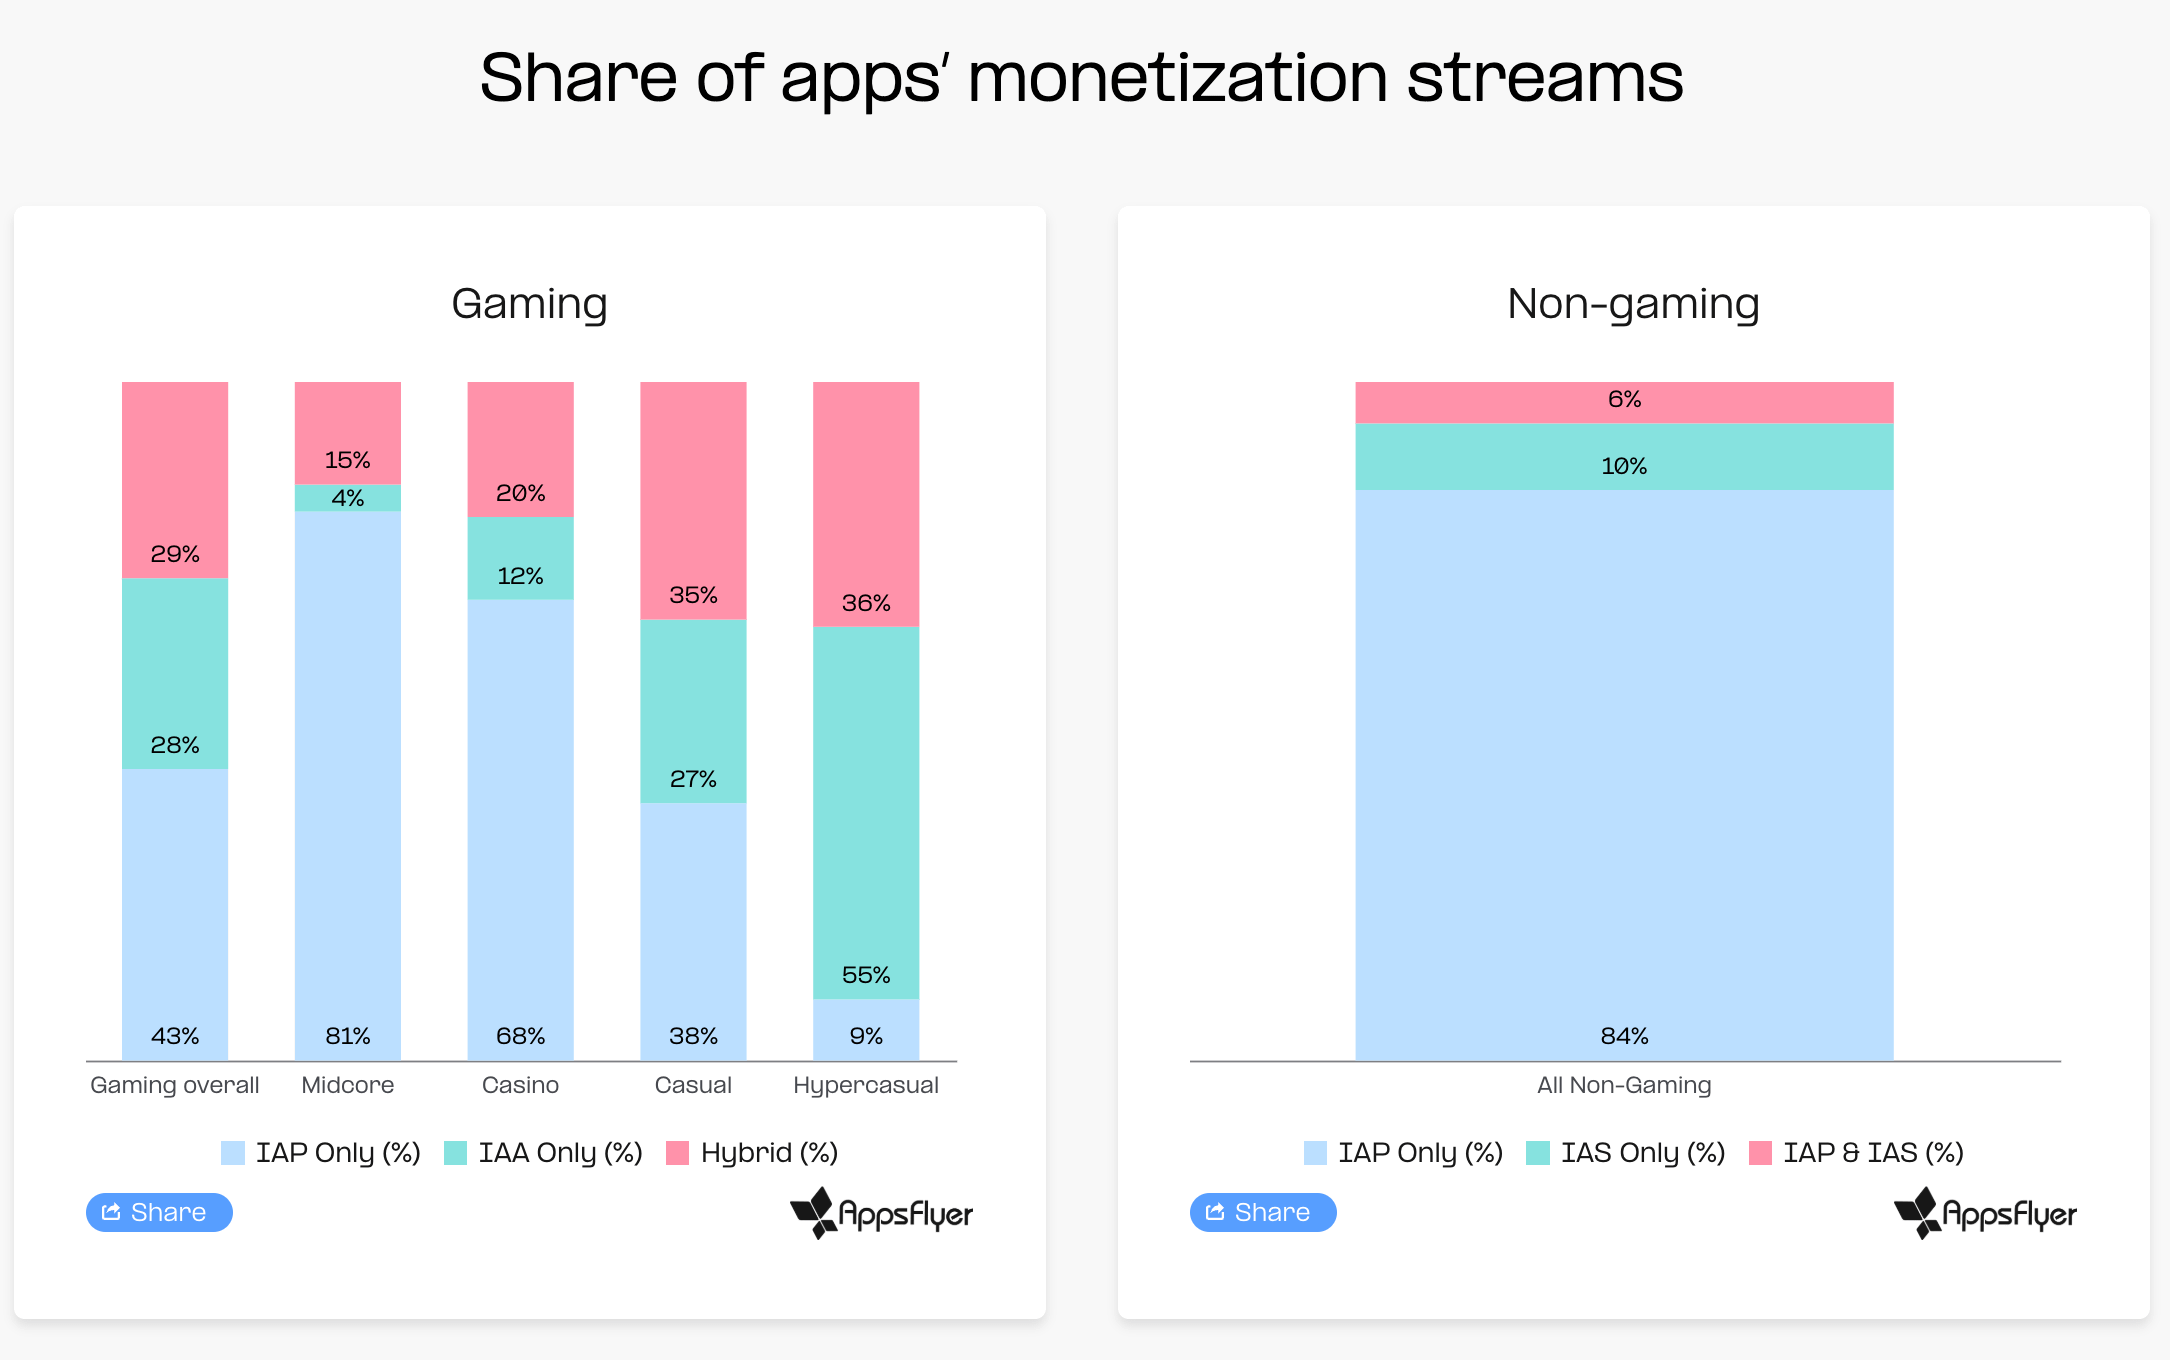
Subscriptions are the dominant monetization model for non-gaming apps, but they represent only a small share of revenue in games. In midcore games, for example, 90% of revenue comes from IAP purchases. In casino games, the figure is 83%.
Conversion to Paying Users
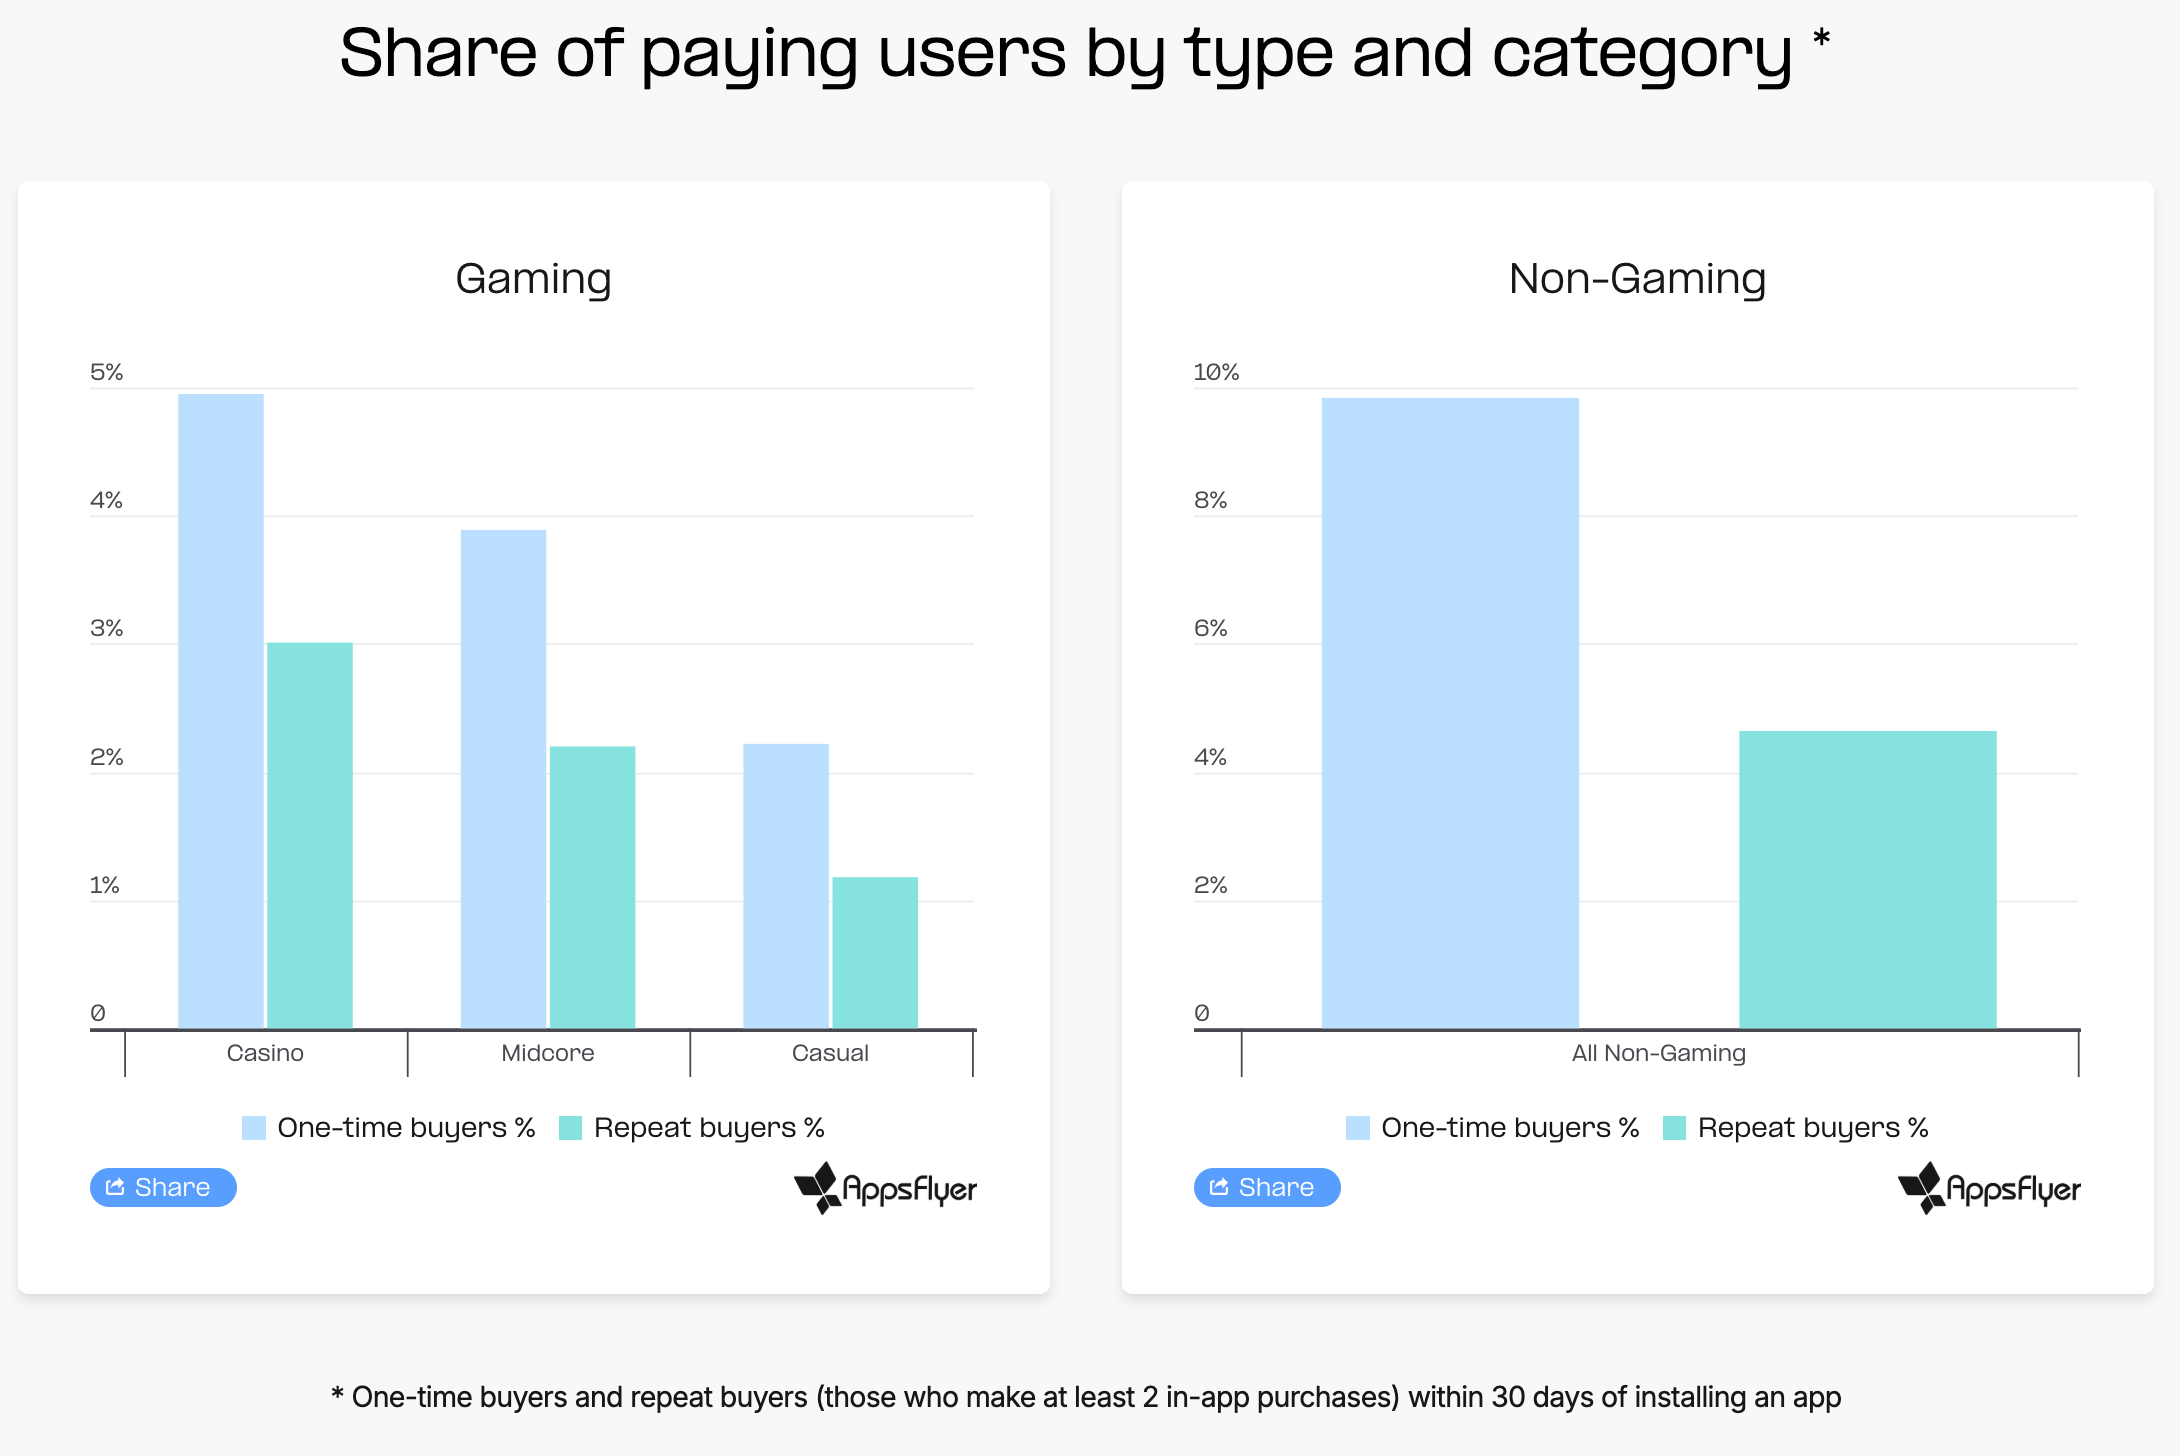
On average, non-gaming apps convert 9.84% of installs into first-time purchasers and 4.64% into repeat purchasers within 30 days. Non-gaming apps outperform games across every category. Put simply, roughly every second user who makes a first purchase will make another one.
Casino games convert 4.95% of new installs into paying users, while 3.01% make multiple purchases. This produces a first-to-repeat payer ratio of 1.65x. The ratio is 1.76x in midcore games and 1.89x in casual games. Lower is better.
Regional differences are also significant. In North America, first-purchase conversion reaches 11.14%, nearly double the 6.51% observed in LATAM. Similar patterns appear in repeat-purchase conversion rates. However, across all regions, the same trend remains: roughly every second first-time payer goes on to make another purchase.