

AppsFlyer: Games Creative Trends in 2025
Learn more about the working motivations, hooks, outcomes in casual, midcore, casino games in 2025.


The company analyzed over 1.1 million video creatives across more than 1,300 apps. These creatives accounted for over $2.4 billion in marketing spend.
IPM metric is Installs per mille.
General market overview
In Q1'25, the top 2% of creatives in games accounted for 53% of marketing spend (last year it was 56%).
In non-gaming apps, the top 2% of creatives accounted for 43% of all spend (last year it was 47%). AppsFlyer notes that game marketers are more focused on meeting performance KPIs.


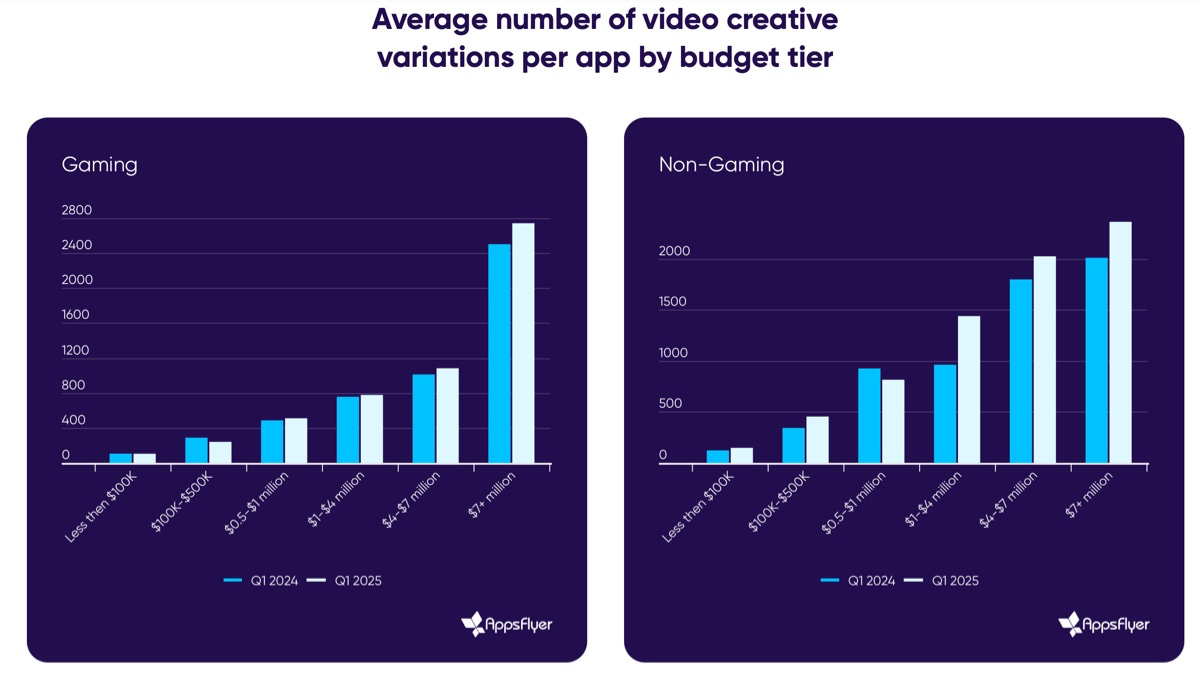
Games that spend over $7 million per quarter on marketing produce an average of 2,743 video creatives per quarter. That’s 3 times more than those spending $4M–$7M per quarter, and 5–6 times more than those spending $1M–$4M.
Games spending over $1M per quarter increased their creative volume by 8%. Those spending less, on the contrary, produced 3% fewer creatives.
AppsFlyer notes that while market leaders are growing, smaller companies are facing challenges. They are focusing not on growth, but on optimizing existing marketing campaigns.
Creative trends in Casual Games
❗️AppsFlyer uses AI creative categorization by motivation (e.g., completion), by hooks (e.g., humorous skit), by creative ending (e.g., pure failure/victory). UGC content is divided into three categories: gameplay review, reaction video, and creator recommendation. Read more about categories here.
Casual product marketers mostly work with creatives that evoke a sense of excitement, as well as creatives that show completion. The former performs better in terms of D7 Retention.

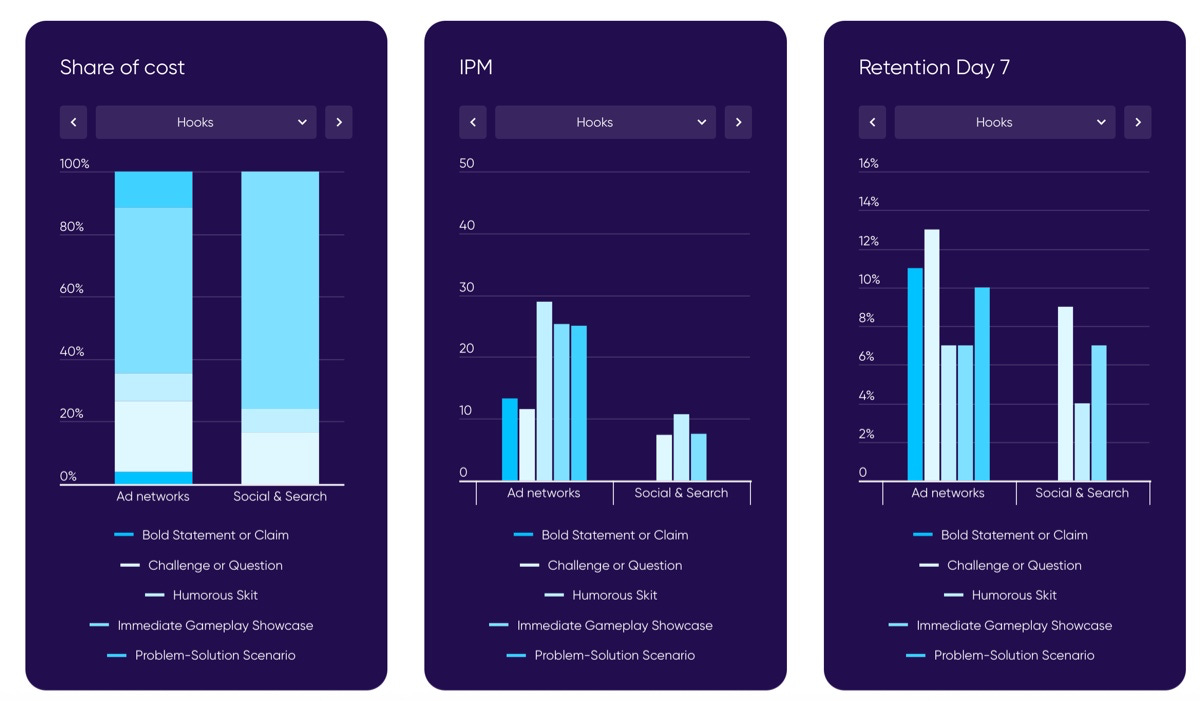
When it comes to hooks, the most popular type is gameplay showcase. On social media, bold statement hooks are often used, but these have low IPM. Most likely, the audience stops believing in such direct advertising. Humorous skits show good IPM. Interestingly, creatives with celebrities have low IPM.

Creatives that end with the user’s victory, on average, show 33% higher IPM. But on social media, creatives with a bad ending - where the player is offered a chance to fix the situation - perform 65% better.

In UGC creatives for casual games, testimonials/endorsements account for the majority of spend. However, creatives with gameplay reviews have higher IPM and D7 Retention, but account for less than 5% of all marketing spend.

Creative trends in Hyper-Casual Games
Creatives showing users a hard challenge deliver the best D7 Retention for the genre.
Consider subscribing to the GameDev Reports Premium tier to support the newsletter. Get access to the list of curated articles & archive of Gaming Reports that I’ve been collecting since 2020.
Meanwhile, creatives showing exciting moments from the game have the highest IPM, but lose out in terms of mid-term user retention.

Gameplay creatives dominate hyper-casual game advertising, they have over half of ad network spend, and more than 72% of all social media spend. IPM is higher in creatives with humorous skits.
The highest D7 Retention is in creatives that show a hard challenge or ask users a question.
In UGC creatives, most ad network traffic goes to testimonials/endorsements (83% of all spend). These have the highest D7 Retention - 14.56%. On social media, marketers focus more on creatives with emotional reactions from content creators.

The highest IPM is in “failure-to-success” scenario creatives. For D7 Retention, those showing the user achieving success are the leaders.

Creative Trends in Midcore Games
As with casual projects, creatives focusing on excitement account for 55–60% of all budgets. These creatives have strong IPM in ad networks, but weak D7 Retention. In DSP and social networks, such creatives also don’t show outstanding metrics.
Creatives demonstrating competition or social elements show better D7 Retention. Despite this, they account for only 8% of all marketing spend on social networks.

For hooks, most budgets go to creatives that immediately demonstrate gameplay. These have outstanding IPM in ad networks, but rather weak D7 Retention.

All types of UGC-creatives are actively used for midcore projects - gameplay reviews (44%), testimonials (39%), and reaction videos (18%).
In ad networks, testimonials show the highest D7 Retention, while on social networks, reaction videos perform best.

In terms of the scenario, most spend goes to creatives demonstrating user success. These also have decent D7 Retention.
Creative trends in Social Casino
Most spend goes to creatives showing the completion of a goal or task. In ad networks, this type accounts for over 80% of all spend and has the highest D7 Retention (11.6%).
This type of creatives also receives the most spend on social media (about 70%), but there, such creatives don’t show the best D7 Retention.

AppsFlyer notes an opportunity for marketers to shift budgets to creatives demonstrating other motivations for users on social media such as excitement or competition.
In terms of hooks, most spend goes to gameplay videos (from 55% to 78% of spend, depending on the channel). The highest IPM in ad networks is shown by creatives that ask the user a question or show a challenge.

For UGC creatives, most traffic is for testimonials and endorsements. These have slightly higher IPM and much higher D7 Retention, so the bet is justified.

Over 80% of all spending on ad creatives goes to those showing the user winning large sums.

Creatives with Celebrities in Games
Consider subscribing to the GameDev Reports Premium tier to support the newsletter. Get access to the list of curated articles & archive of Gaming Reports that I’ve been collecting since 2020.
Movie star ads account for 63% to 91% of all spend, depending on the channel. However, such creatives are far from leaders in IPM and D7 Retention. TV star creatives perform better in terms of IPM, while music artists and influencers in social networks lead in D7 Retention.

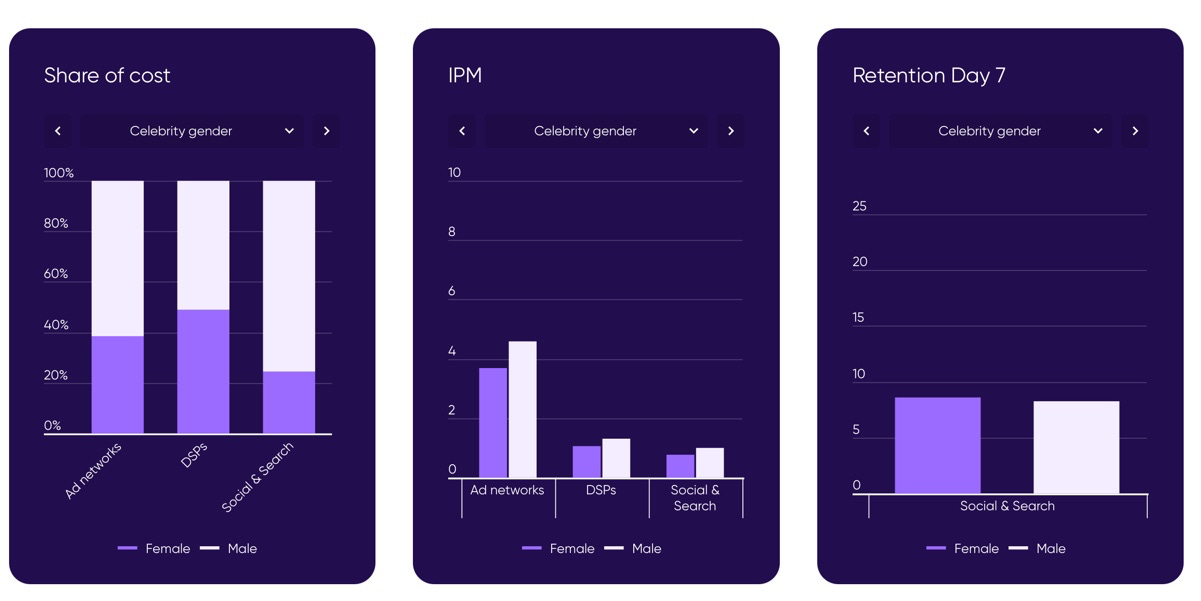
In terms of gender, more is spent on ads with male celebrities. But ads with female celebrities have slightly higher Retention on social media.
Creatives where celebrities do not play a central role have the highest IPM. But such creatives account for less than 10% of all spend.

The top spend goes to creatives, where celebrities play a supporting role. However, D7 Retention for these creatives is lower than for ads where celebrities have the main role.