AppsFlyer: Mobile game monetization in Q3'24 in North America and T1 Western countries
A lot of interesting numbers inside (with some of them I disagree).
AF analyzed aggregated data based on $130 million IAP revenue; $40M subscription revenue, and $900M advertising revenue. All data is for Q3’24. North America and Tier-1 Western countries were considered.
D90 ARPU by monetization models and genres
AF data for Tier-1 Western markets shows that projects with hybrid monetization demonstrate the best results in D90 ARPU on iOS. Their D90 ARPU is $9.69 (iOS) and $1.54 (Android) in mid-core projects. For comparison, mid-core projects with only IAP monetization have a D90 ARPU of $7.31 on iOS and $3.11 on Android.


IAP monetization currently performs best in casual games with the same set of parameters (Tier-1 Western countries; D90 ARPU). On iOS, D90 ARPU is $3.15; on Android - $2.15. In projects with hybrid monetization, the metric on iOS is $2.38; on Android - $2. Games with IAA monetization show the weakest results - $1.26 (iOS) and $0.81 (Android).


Interestingly, in hyper-casual projects, it’s not clear that hybrid monetization works better. D90 ARPU in projects with hybrid monetization is $0.82 on iOS and $0.6 on Android. Meanwhile, in projects with only advertising monetization, the metric is $0.71 on iOS and $0.47 on Android.


❗️ Most likely, this difference is related to taxonomy. Hybrid-casual games might be counted in the casual games category.
ROAS by genres and monetization types
AppsFlyer shows that casual projects with only IAP monetization achieve 215% D90 ROAS on iOS in T1 Western markets. Or they note that mid-core projects with hybrid monetization demonstrate 122% D30 ROAS on Android.


❗️This section raises more questions than answers. Such returns may occur in exceptional cases - in the best projects or the most successful campaigns. Based on the projects and metrics I’ve seen (hundreds of games in different genres), I’ve hardly seen such metrics from almost anyone. Therefore, I recommend treating the figures in this particular section skeptically.
Revenue accumulation in the first 90 days by genres and monetization types
65-66% of all revenue in casual projects with IAP monetization comes in the first 30 days. In mid-core games, 84-85% of all revenue comes in the first 30 days.


❗️The simple conclusion is that if your users don’t pay in the first weeks of the game, there’s a very high probability they won’t pay later.
In projects with advertising monetization, regardless of genre, about 85-95% of all revenue for 90 days comes in the first 30 days.


Similarly in projects with hybrid monetization. Regardless of genre, 81-86% of all revenue for 90 days accumulates in the first 30 days.


Consider subscribing to the GameDev Reports Premium tier to support the newsletter. Get access to the list of curated articles & archive of Gaming Reports that I’ve been collecting since 2020.
Revenue distribution between organic and paid traffic by genres
Purchased users bring 72-76% of all revenue for 90 days in hyper-casual and casual genres - regardless of the type of monetization.


In mid-core projects with IAP monetization, most of the cohort revenue for 90 days comes from organic users (56-61%). Where the focus is on IAA monetization, the share of organic in the revenue structure is from 28% to 37%.
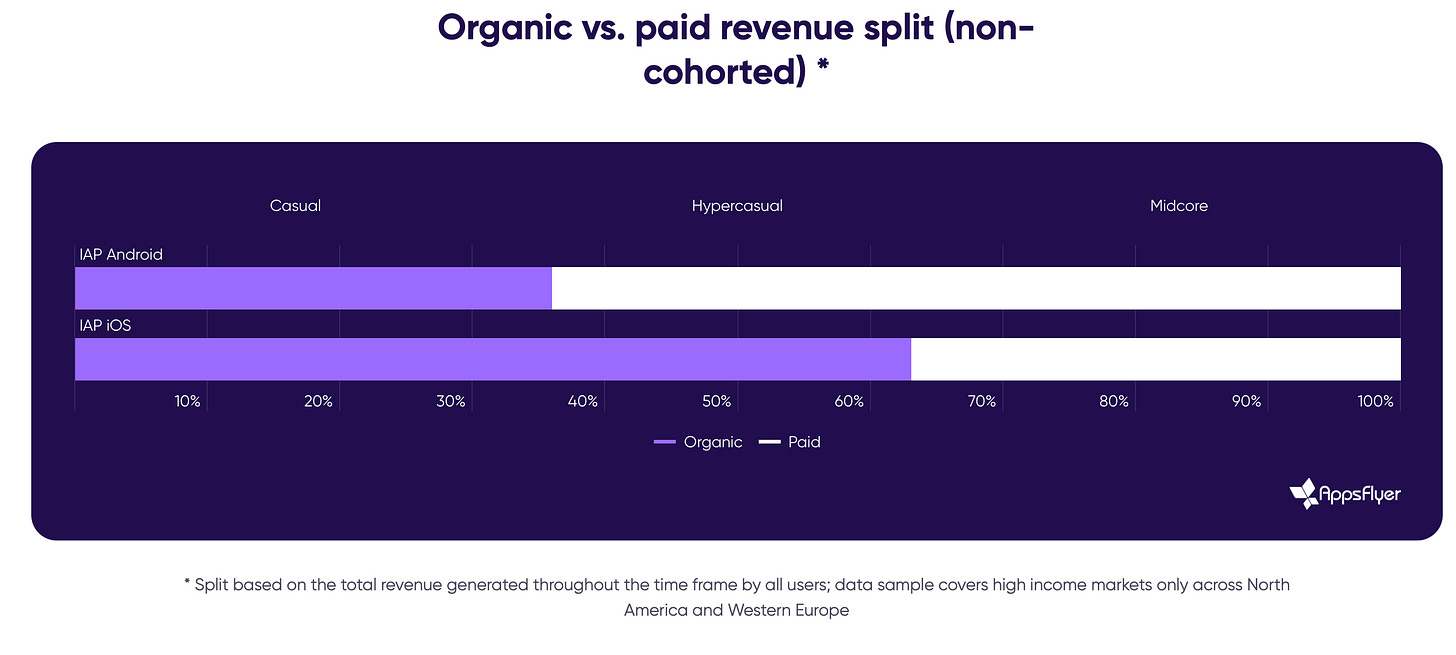
If we consider all revenue for 90 days, without breaking it down by cohorts, the share of revenue from paid users grows in casual projects with IAP monetization. Conversely, it decreases in hyper-casual and casual games with advertising monetization.


But in mid-core games on Android, changes are visible. In terms of total revenue (not cohort), the share of purchased users in revenue grows to 64%. On iOS, the same 61% of organic users make the cash.


