AppsFlyer: Mobile market trends in 2024
Non-gaming apps are performing much better than their gaming counterparts.
The report was prepared using data from over 35,000 apps. The total number of analyzed installations is 140 billion; and re-marketing conversions - 53 billion.
UA spending
Overall UA spending in 2024 increased by 5% to $65 billion. The market is recovering after a 6% decline in 2023.
However, there’s no good news for games. Spend on non-gaming apps increased by 8% while spend on gaming apps fell by 7%.
In the volume of gaming spending, the share of casual projects increased from 61% to 64%. The volume of UA on mid-core games (-21% YoY, share in total spend fell to 18%) and social casinos (-12% YoY, share in total spending fell to 8%) significantly decreased.


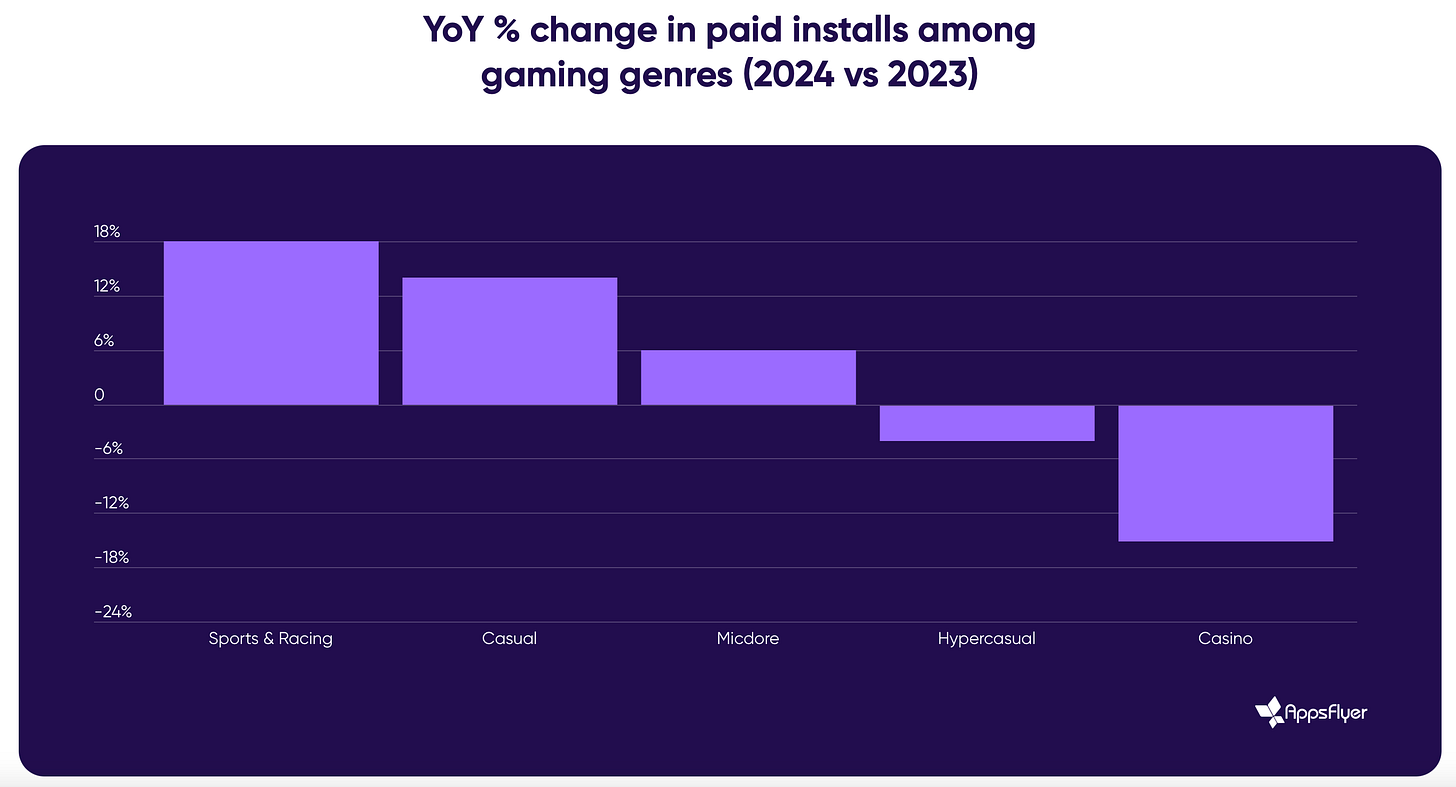
The number of attracted paid users increased in sports and racing projects (by 18% YoY), casual games (+14% YoY), mid-core projects (+6% YoY).
❗️AppsFlyer notes that due to the decrease in CPI, the mid-core genre, for example, managed to attract more users while spending less money.
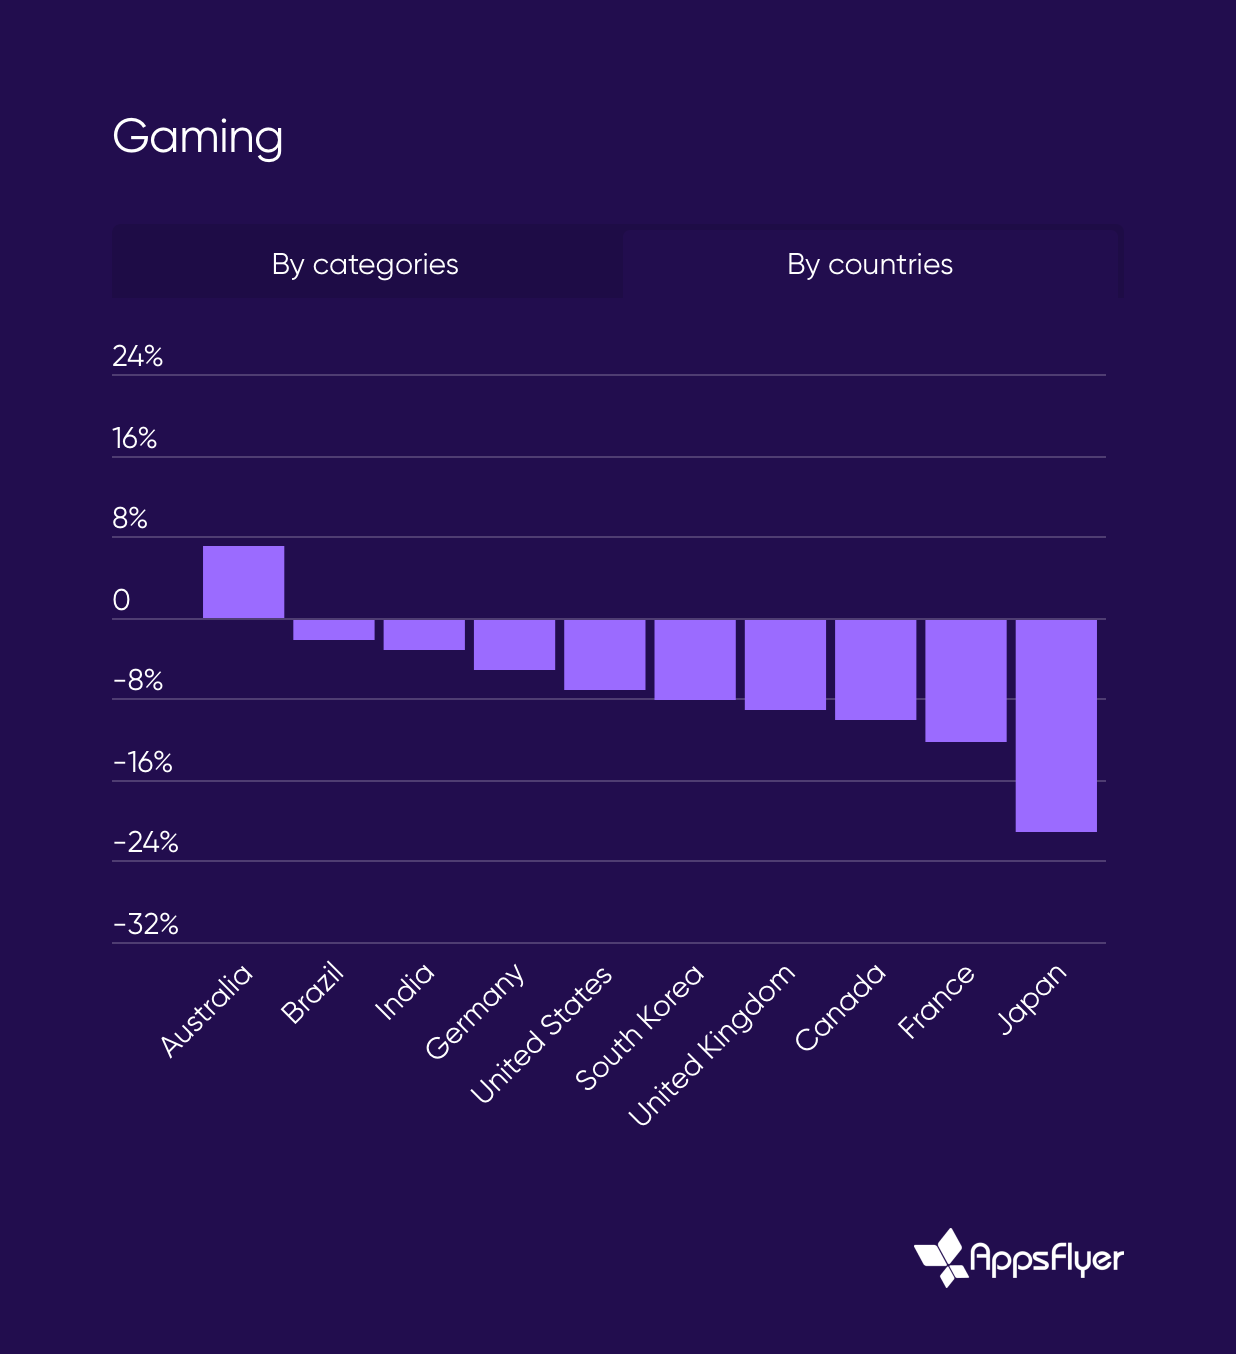
Looking at the regional breakdown, a decline is observed worldwide. This has affected developed countries the most.
AppsFlyer reports that the UA by non-gaming apps in “gaming” ad networks (such as Unity Ads) increased by 38% in 2024, while investments from gaming companies in these networks fell by 19%. Games still dominate in terms of purchase volume, but the trend is interesting.
Consider subscribing to the GameDev Reports Premium tier to support the newsletter. Get access to the list of curated articles & archive of Gaming Reports that I’ve been collecting since 2020.
Revenue
Non-gaming apps grew by almost 20% in IAP revenue in 2024. Among gaming apps, social casinos showed growth (+4% YoY), while mid-core projects fell by 2% YoY, and casual apps’ revenue fell even more (-5% YoY).
❗️The report doesn’t mention whether web shops were taken into account.
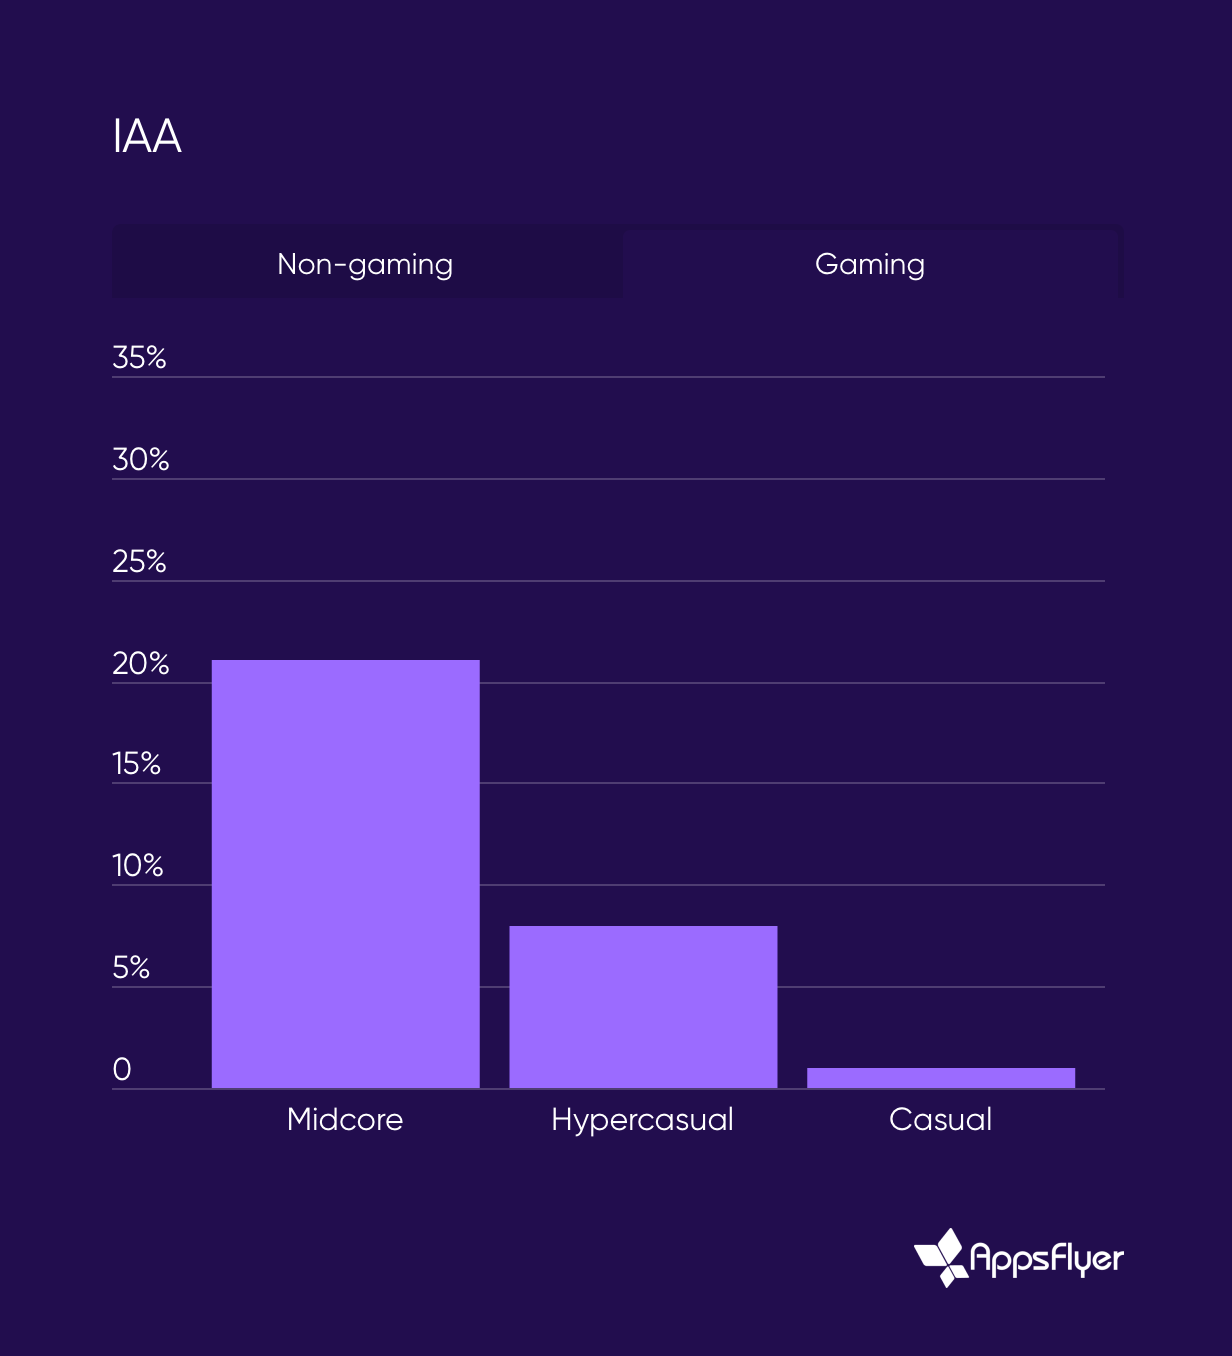
Advertising revenue is growing in both non-gaming (+26% YoY) and gaming (+7% YoY) segments. Advertising revenue grew the most in mid-core projects, by 21% compared to the previous year.
Downloads
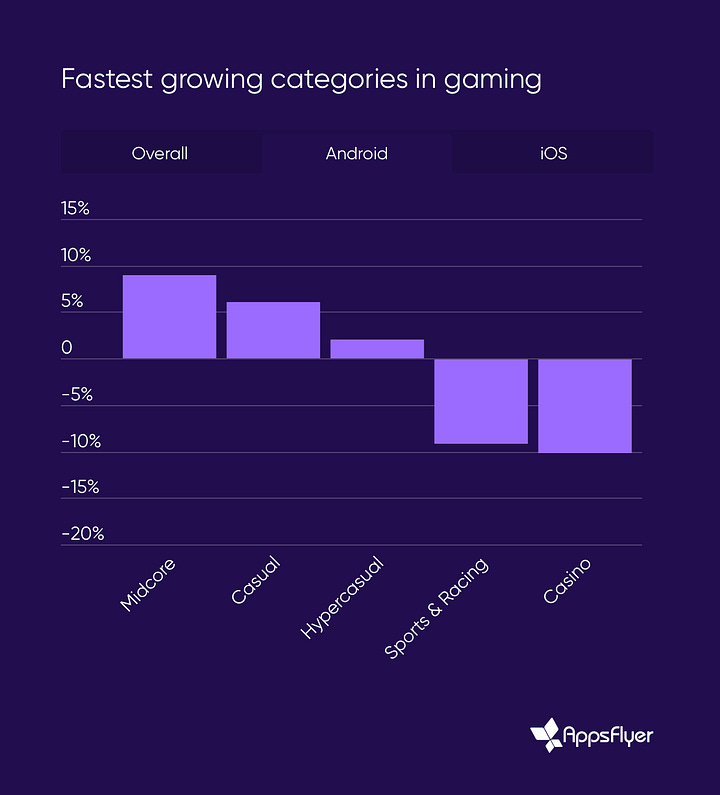
The number of installs increased by 5% in mid-core genres, by 4% in casual, and by 1% in sports and racing projects. The number of users decreased by 5% in social casinos and by 10% in hypercasual projects. All compared to 2023.
The picture differs on Android and iOS. On Android, mid-core projects grew in downloads (+9% YoY), casual games (+6% YoY), and the hypercasual segment (+2% YoY). On iOS, only social casinos have a positive balance (growth of 22% compared to the previous year).


Creative Production
In 2024, the number of creatives produced increased by 40%. Among the largest apps (with revenue over $1 million per month), the number of monthly creatives nearly doubled.
❗️This includes all versions of creatives, including those where only the icon color is changed.


