AppsFlyer: The Mobile Gaming Market in 2024
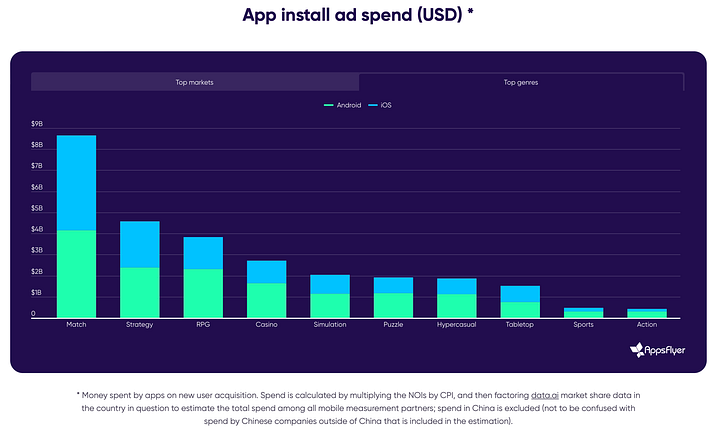
Marketers spent $29B in 2023 on performance marketing.
The company analyzed over 15,000 gaming apps (with at least 3,000 non-organic installs per month); 21.2 billion non-organic installs from January 2023 to June 2024; and 1.5 billion remarketing conversions.
Key Trends
Games in genres with IAP monetization are integrating ads; games in genres with IAA are integrating IAP monetization. For example, RPGs have seen an increase in ad revenue but a decrease in IAP revenue. The overall trend is as follows: the share of games with hybrid monetization grew from 36% in Q2 2023 to 43% in Q1 2024; the share of games with ad-only monetization decreased from 47% in Q2 2023 to 43% in Q1 2024; the share of games with IAP-only monetization decreased from 17% in Q2 2023 to 14% in Q1 2024.
Acquisition in casual games is growing; in mid-core and hyper-casual games, it is declining. In H1 2024, non-organic installs in mid-core games decreased by 5% on Android and by 15% on iOS. In hyper-casual games, ad spending decreased by 6%. Meanwhile, casual games are trending upward—Match games (+13% on Android); action games (+18% on iOS); simulation games (+25% on Android); board games (+29% on iOS). Puzzle and sports games are also showing growth on iOS.
Game ad revenue increased by 4% in Q2 2024 compared to Q2 2023. Android grew by 12%, while iOS dropped by 10%. Year-over-year, ad revenue grew by 3%. However, IAP revenue decreased by 15% on Android and by 35% on iOS.
The first week is crucial for assessing a project's monetization potential. On iOS, 22.99% of all paying users within the first 10 days make a purchase on Day 1. On Android, this figure is 21.11%.
It's becoming harder to find "whales" on iOS. The share of revenue from top-paying users in North America dropped from 34% in Q1 2023 to 27% in Q1 2024. On Android, however, it slightly increased—from 34% to 35% over the same period. On both iOS and Android, the top 5% of paying users generate about 50% of total revenue.
Installs on Android increased by 3% (both overall and non-organic installs) in the first half of 2024. On iOS, however, there was a 9% overall decline and a 2% drop in non-organic installs. The biggest declines in installs on iOS were in RPGs (-36% overall; -25% in paid traffic) and strategy games (-15% overall; -48% in paid traffic).
Growing Genres
The strongest growth in non-organic installs on iOS was seen in sports games, racing games, and merge games. Casino and bingo games are also growing.


On Android, puzzles showed the strongest growth in non-organic installs. Among subcategories, Sudoku saw the highest growth.
Acquisition by Region
AppsFlyer has a positive outlook on the marketing market over the past year and notes that the number of non-organic installs increased on both iOS and Android.
The U.S., the largest market for iOS, grew by 1%. The number of non-organic installs in the U.K. on iOS increased by 9%; on Android, by 14%. There were also significant declines—installs in South Korea fell by 39%; in Australia by 15%; in Japan by 15%. Mexico showed a strong growth trend, with non-organic installs in the country increasing by 21%.
On Android, things are better, with growth across all key markets. The leaders in non-organic traffic growth are the Philippines (26%); the U.K. (18%); Japan (16%); and Indonesia (13%). The U.S. market grew by 5%.
Marketing Spending
In 2023, mobile gaming companies spent $29 billion on marketing their games.
The U.S. accounted for $6.6 billion in iOS spending and $5.5 billion in Android spending in 2023. This is more than the next 10 markets combined.


The second-largest market in the world for marketing spending is Japan ($1.8 billion on iOS and $1.2 billion on Android). South Korea ranks third. The largest European markets are the U.K., Germany, and France.
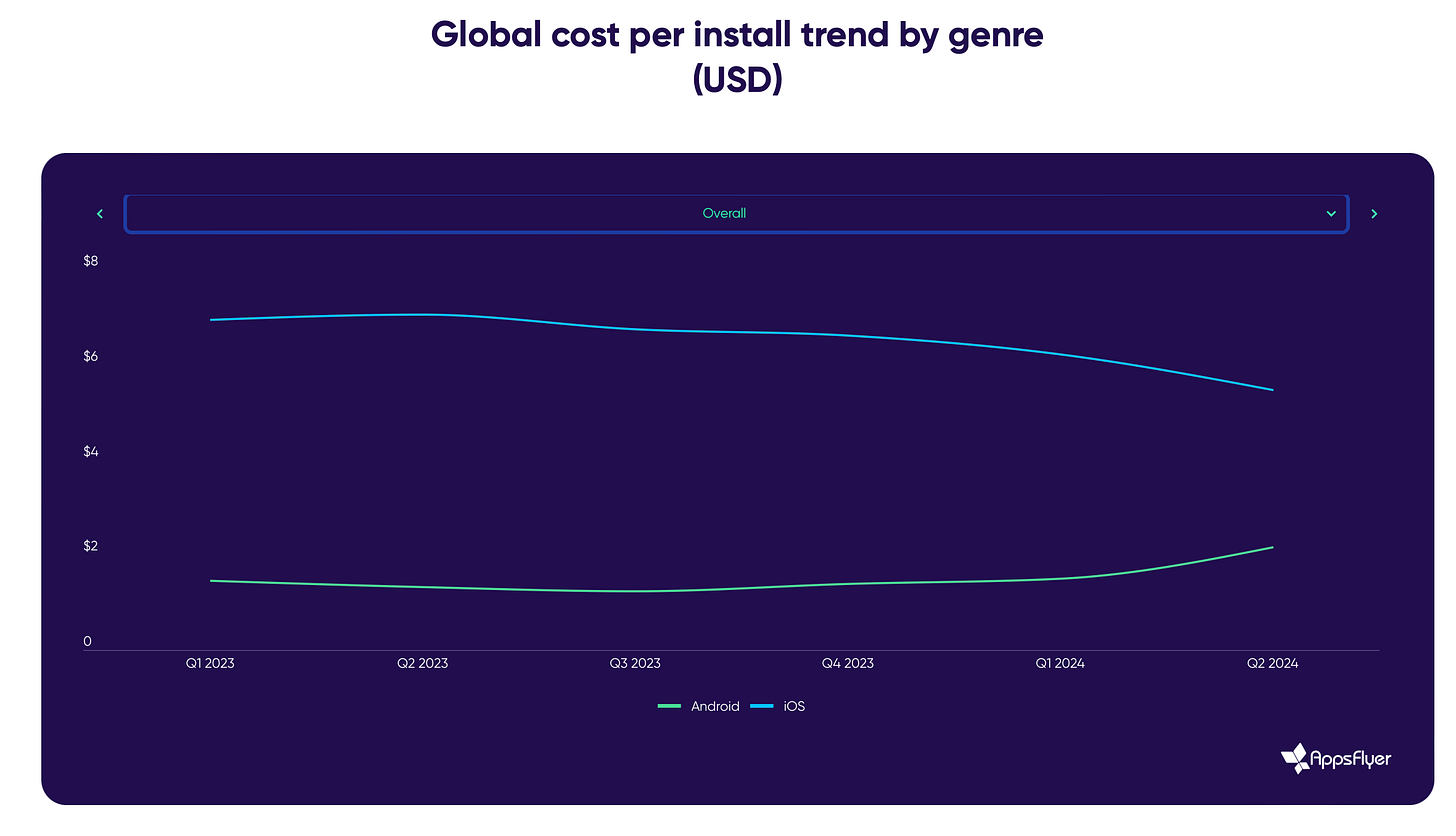
One of the key trends in 2023 was the decrease in installation costs on iOS and the increase on Android. This was especially noticeable in puzzles, the Match genre, hyper-casual games, and the simulation genre.
Top Creatives
UGC (User-Generated Content) creatives generally perform well on ad networks, DSPs, and social media.
AppsFlyer analyzed D30 Retention for different types of creatives across various ad channels. It was found that for hyper-casual games, the best combination is UGC with real or animated scenes. For mid-core projects, both UGC and gameplay videos—whether with real or animated scenes—work well.


