



Chris Zukowski (How To Market A Game) surveyed readers and collected wishlist and sales data for 160 games released on Steam from 2020 to 2025. 34 games launched in 2020-2022, and 126 in 2023-2025. The analysis excluded games released in 2026.
Wishlist Inflation
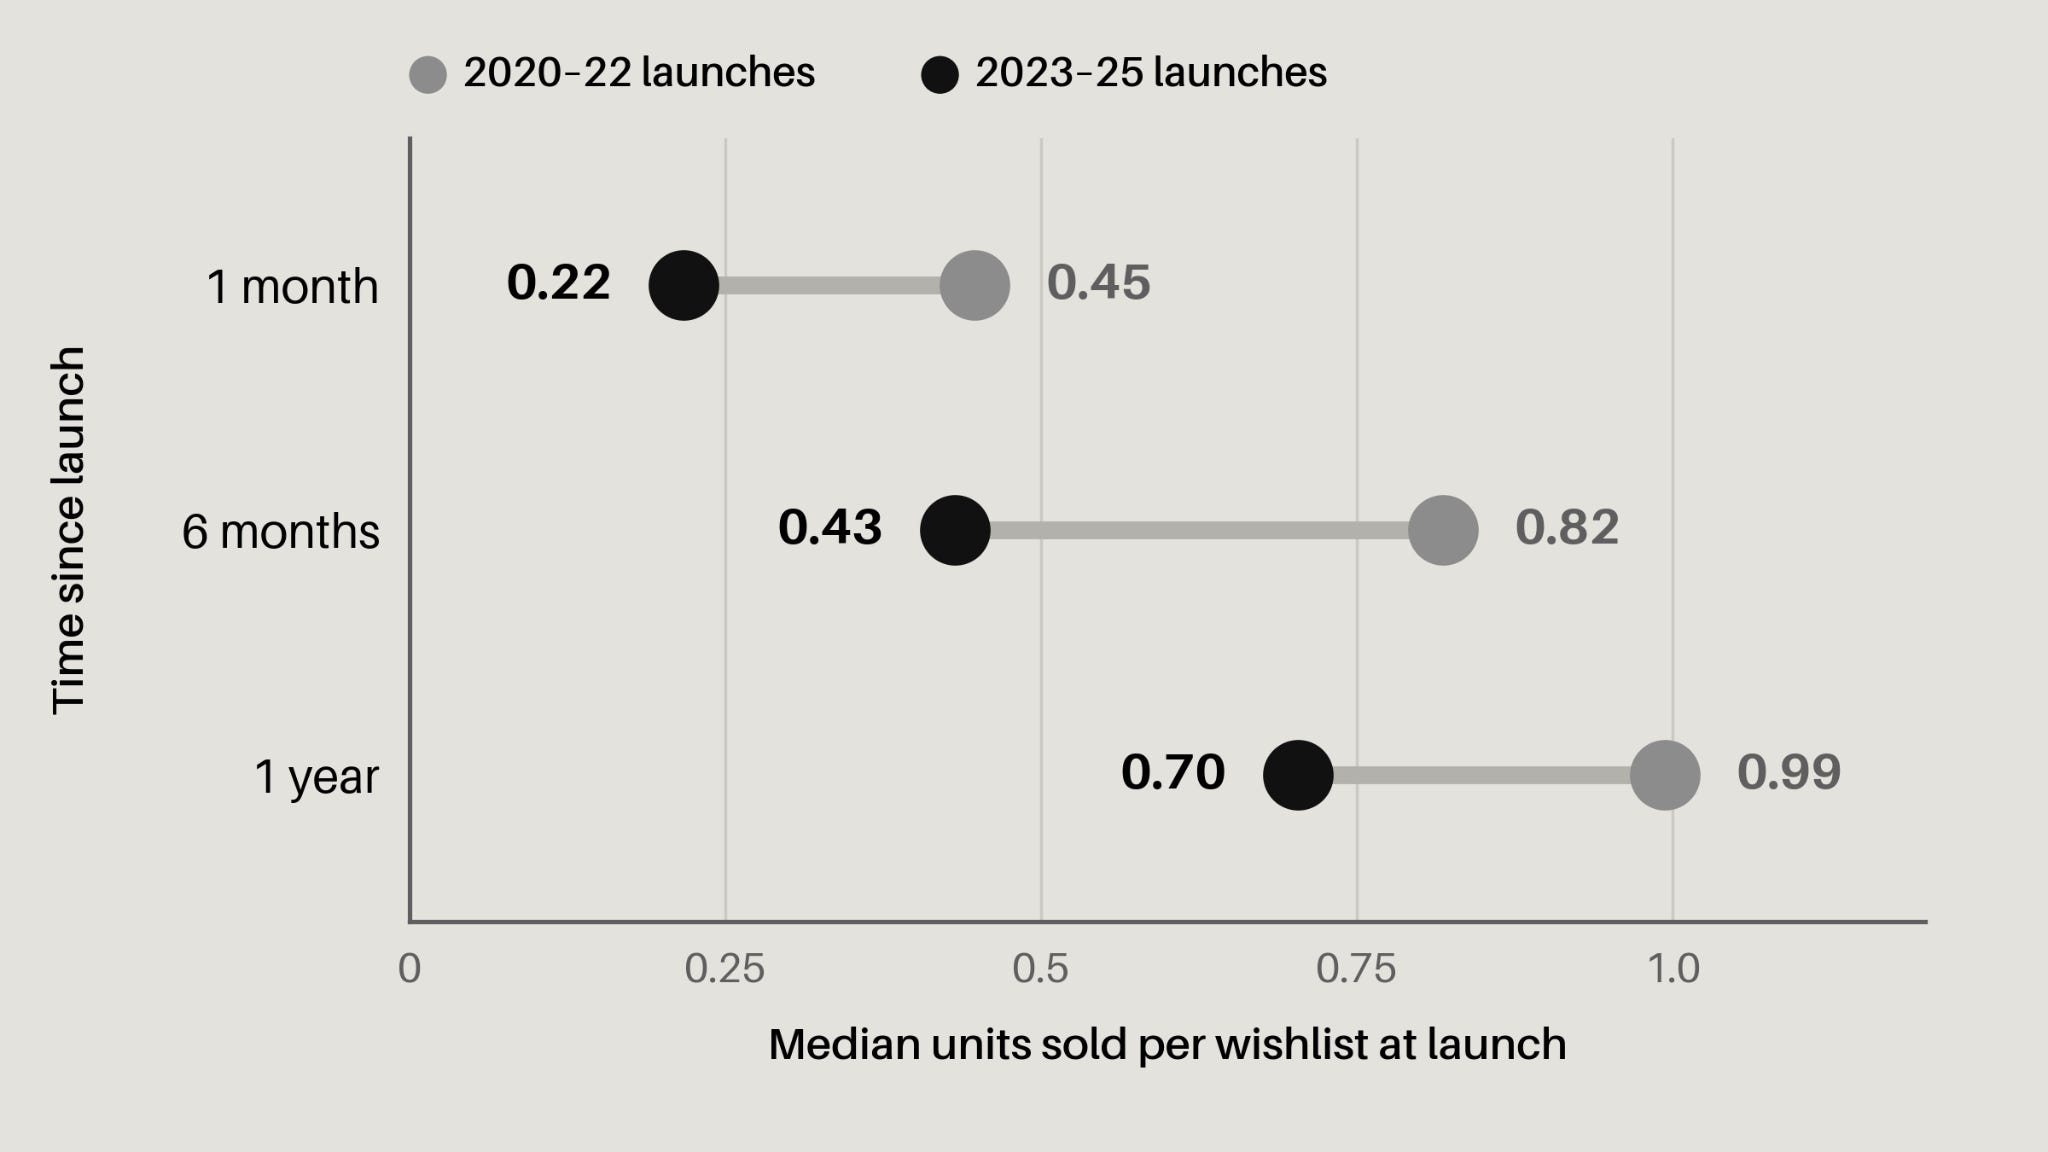
In the first month after release, 2023-2025 games sold a median of 0.22 copies per launch wishlist. For 2020-2022 games, the figure was 0.45. So wishlists now convert to sales about half as well.

From concept art to launch-day marketing, most game studios rely on contractors in multiple countries. Mellow makes it simple to hire, pay, and stay compliant with talent in 150+ countries — no legal entity required.
Conversion is also worse over the mid- and long-term. Six months after release, 2023-2025 launches converted at 0.43 sales per wishlist versus 0.82 for 2020-2022 projects; after a year, 0.7 versus 0.99.
❗️In 2024, GameDiscoverCo estimated the median first-month wishlist-to-sales conversion at 0.27. However, its sample included only games released since September 2023 with at least 5,000 wishlists and 500 first-month sales.
Zukowski sees several causes behind the inflation. First, Valve focuses on helping developers collect wishlists. Today, you can wishlist a game without even visiting its page. In the author's view, a wishlist has become more like a bookmark. Adding a game used to be harder, so only people who really liked it did so.
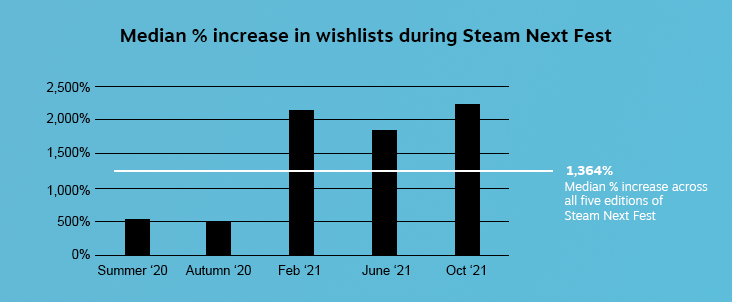
In 2021, Valve said Steam Next Fest increased the median wishlist count for participating games by 1,364%. That is the median across five festivals, from summer 2020 to October 2021.
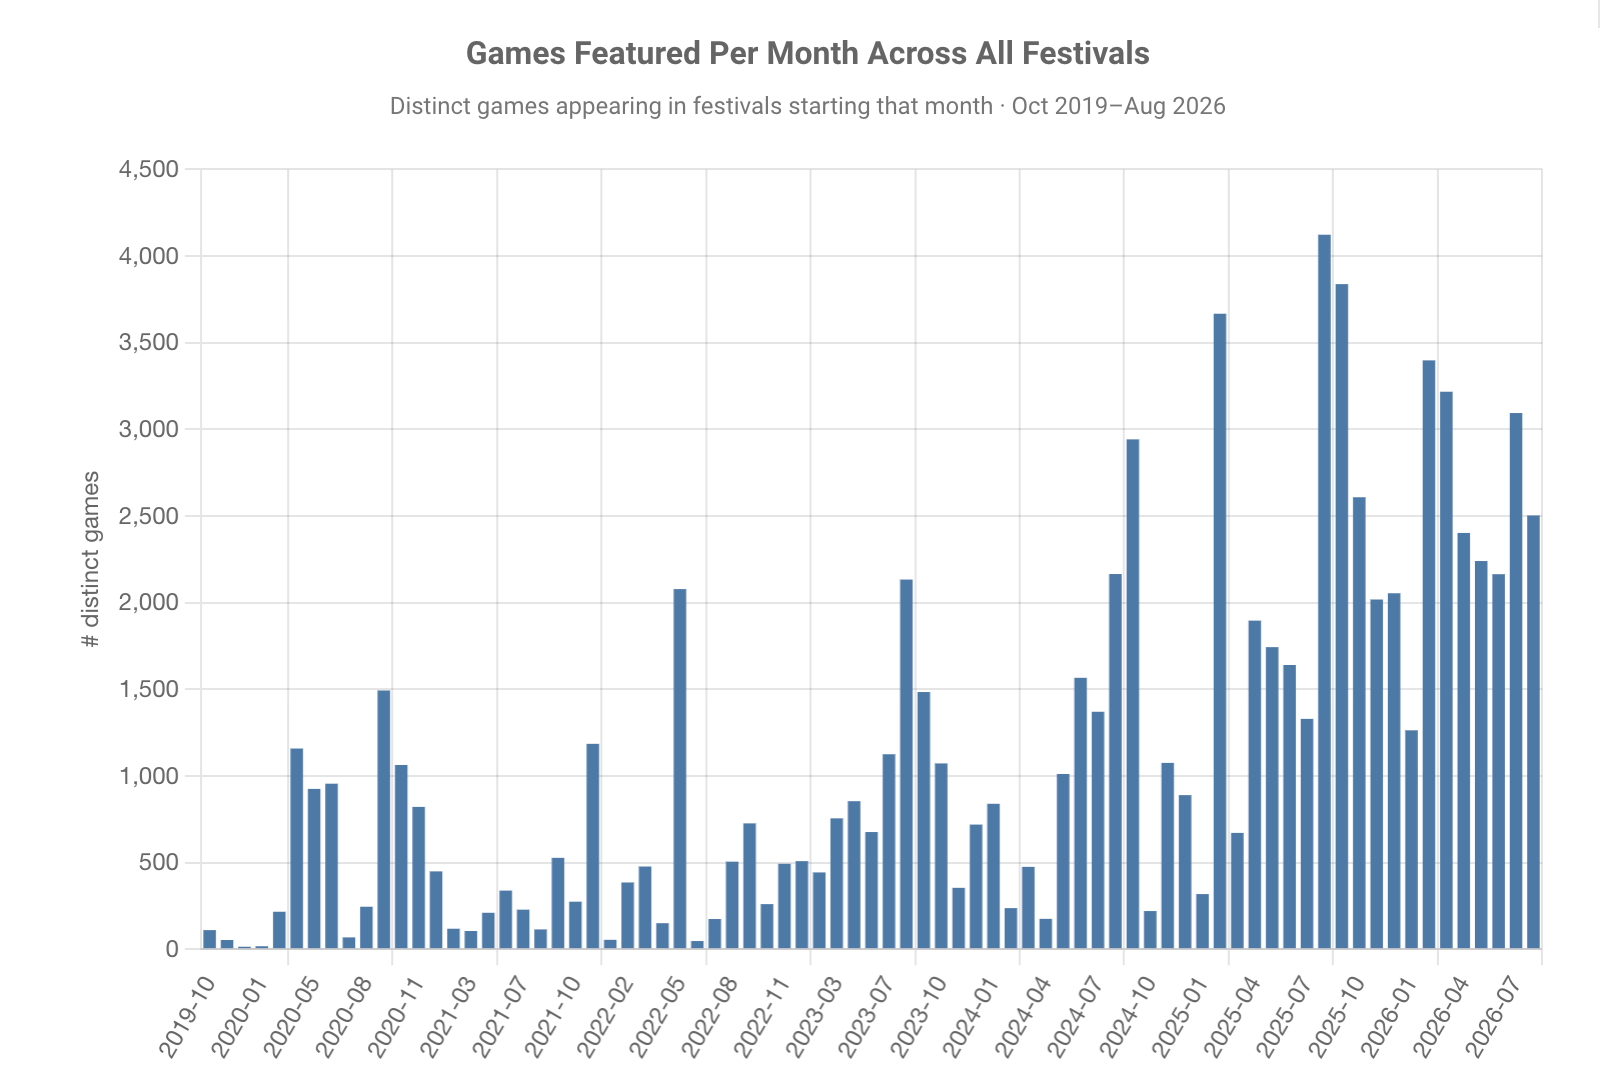
Second, there are many more festivals. Since 2020, the number of games featured in Steam festivals has grown several times over. At the 2025 peak, it exceeded 4,000 a month. The author has long suspected that festival wishlists convert to sales worse.
Third, developers better understand how important wishlists are, and collect them more actively. For example, many developers used to skip Steam Next Fest; now they participate and get more wishlists. The author believes this also leads to more wishlists with worse conversion.
Wishlists and Sales
Meanwhile, launch wishlists still predict first-month sales well. R² (log-log), the coefficient of determination, is 0.77 for 2020-2022 games and 0.72 for 2023-2025 games. The Spearman correlation is 0.89 and 0.87, respectively.
❗️A Spearman correlation of 1.0 would mean the ranking of games by wishlists fully matches the ranking by sales. R² shows how closely games sit to the trend line (at 1.0, every point is on the line).
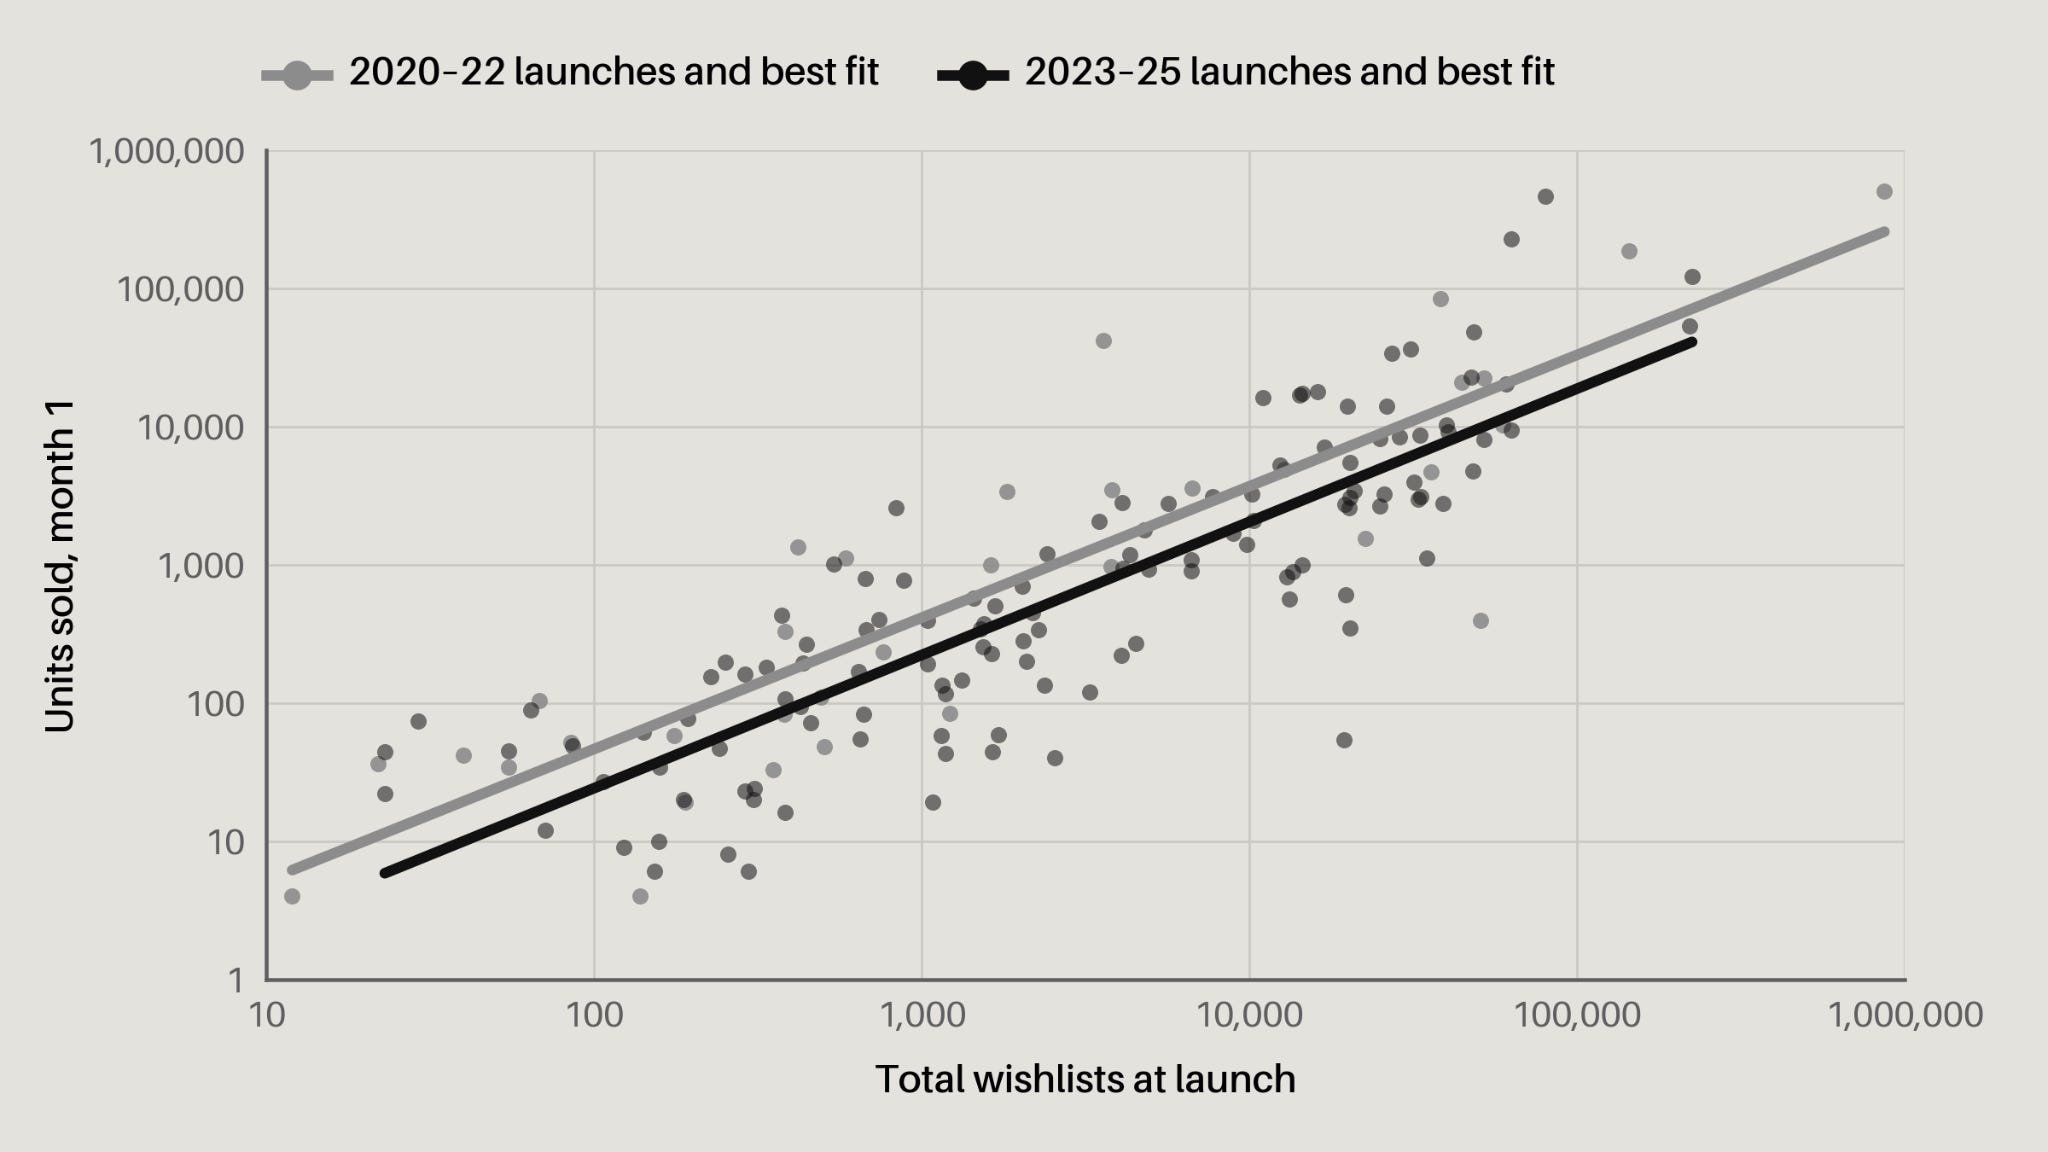
The trend lines for the two periods are almost parallel. That means sales grow with wishlists the same way in both periods. The 2023-2025 line simply sits lower: that is wishlist inflation.
Zukowski defines wishlist velocity as the number of wishlist adds in the 30 days before launch. It predicts sales no better than total wishlists: R² is 0.77 for 2020-2022 games and 0.70 for 2023-2025 games.
Across all games combined, total wishlists and adds in the last 30 days predict sales slightly better (R² of 0.75). Total wishlists alone predict sales with R² of 0.73, additions in the last 30 days with 0.72, and additions in the last 7 days with 0.68.
Zukowski believes wishlist inflation is real, and each wishlist brings fewer sales. But wishlists predict sales just as well as they did three years ago. He attributes the 0.05 difference in R² to statistical noise at this sample size.