

IGDA: Developer Satisfaction Survey 2023
Problems are still there, but the industry has become a better place to be.


The research was conducted from May 17th to October 20th, 2023. 777 people participated in it.
Demographics
Most of respondents (68%) are between the ages of 28 and 47.

Among the respondents, 63% are male, 31% are female, and the remaining 8% identify as non-binary individuals.
63% are married or in a relationship; 34% are single; 2% are divorced. 1% is missed somewhere. 27% of respondents have children.
IGDA notes that the sample had more white people and did not have enough representation of Latin Americans, African Americans, and Asian people.
47% of respondents work in the USA; 11% - in Canada; 7% - in Finland; 6% - in Germany; 5% in the UK.

44% have mental or physical disabilities. 24% indicate they have neurodiversity; 15% report having mental illnesses.
Equality, Inclusion, and Diversity at Work
85% of respondents believe that equality, diversity, and inclusion are important in the workplace, in games, and in the gaming industry overall (87%).

58% of respondents believe that the gaming industry has become more inclusive and diverse in the past 2 years.
Consider subscribing to the GameDev Reports Premium tier to support the newsletter. Get access to the list of curated articles & archive of Gaming Reports that I’ve been collecting since 2020.
However, 28% note that their companies lack EDI programs. 30% don't know.

72% of respondents note that their companies have policies against gender discrimination. 61% note that companies adhere to inclusive hiring policies. 62% say that companies have programs against sexual harassment.
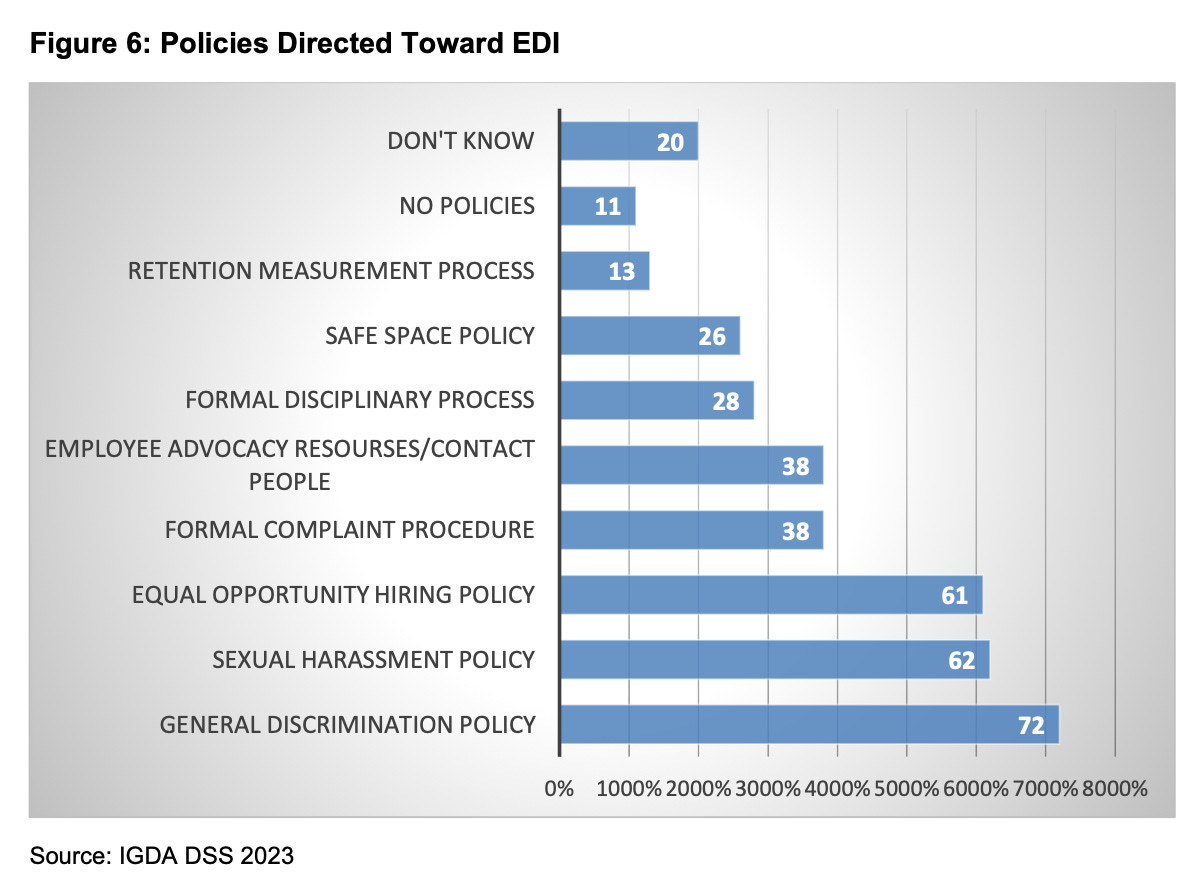
However, only 43% of respondents believe that all these policies actually work and are correctly implemented.
67% of respondents believe that there is discrimination in the gaming industry.

However, 54% of respondents have never personally experienced discrimination; 39% have never experienced it themselves and have not seen such examples in the market.

Employment
Only 4.8% of respondents noted that they are actively seeking employment. 52% were laid off; 15% voluntarily left their companies; 11% left because their contract ended; 11% were fired; 11% are self-employed without a current contract.
30% of unemployed people have been looking for work for over a year. 22% cannot find work for 3 to 6 months. Almost all (93%) are looking for work in the gaming industry.
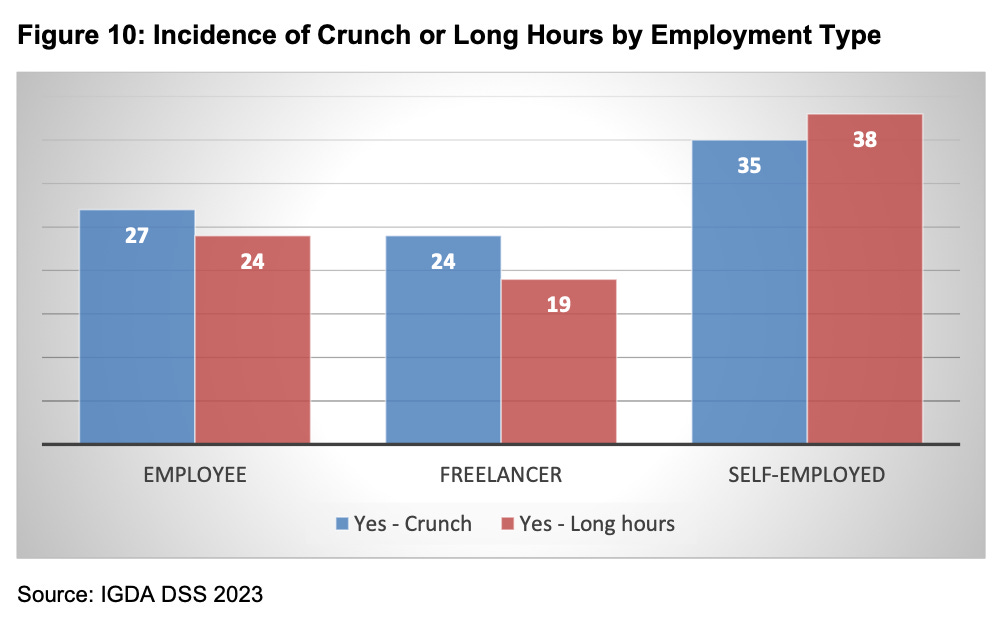
49% of employees work 40-44 hours per week. 35% work from 20 to 39 hours. However, self-employed individuals work overtime more often.

28% of employees note that they experience crunch; 25% reported that their work includes periods of long hours of overtime.
During crunches, 59% of specialists worked more than 50 hours per week. 10% had extreme overtime of 80+ hours per week.

Relationships with Employers
67% have good or excellent relationships with management. 23% described relationships as normal, and only 10% - as bad.
13% of respondents are members of a union. The percentage is higher than in 2021 (12%) and 2019 (6%). Most employees have a positive attitude towards unions.

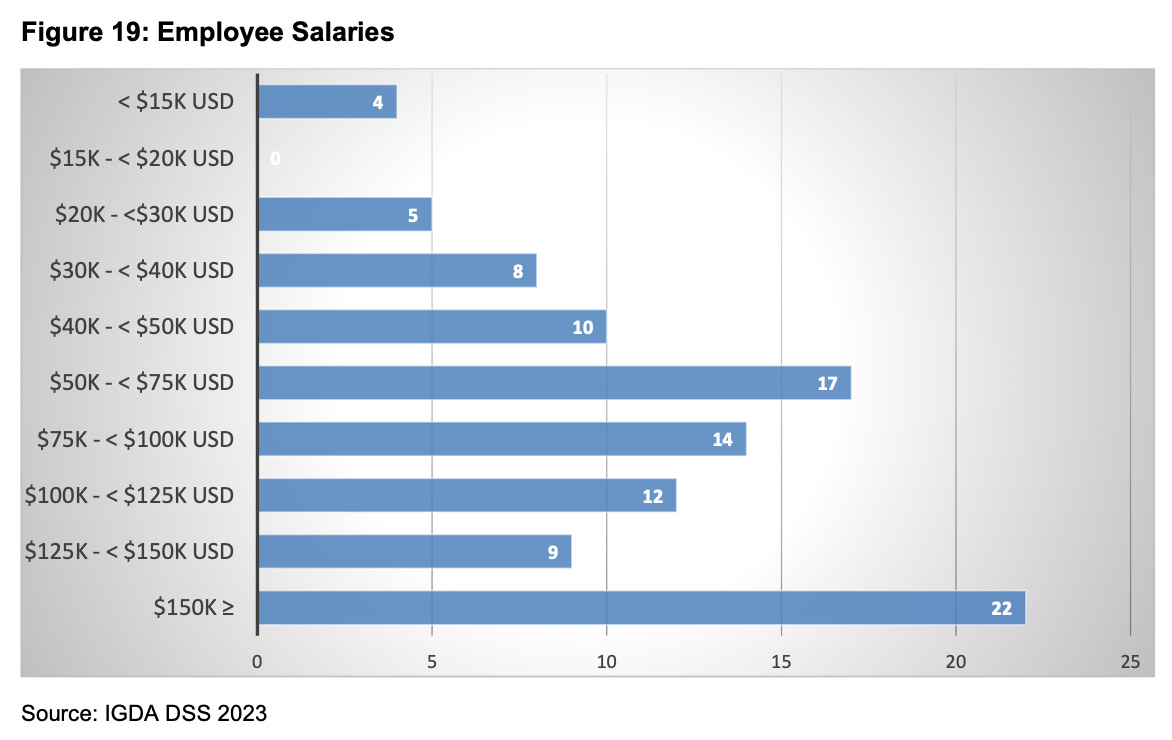
73% of full-time employees earn over $50,000 a year. However, 22% earn over $150,000 a year. Freelancers earn less on average; and self-employed individuals either earn very little (30% - less than $15,000 a year) or a lot (21% - over $150,000 a year).
80% of full-time employees note that their companies have salary increase programs.

32% of employees do not receive any overtime compensation.