

Liftoff: CPI and D7 ROAS benchmarks in Mobile Games
Some data for those who are searching for references.


The report is based on research results from January 1, 2023, to January 1, 2024. 602 billion impressions were analyzed; 49.4 billion clicks; 144 million downloads.
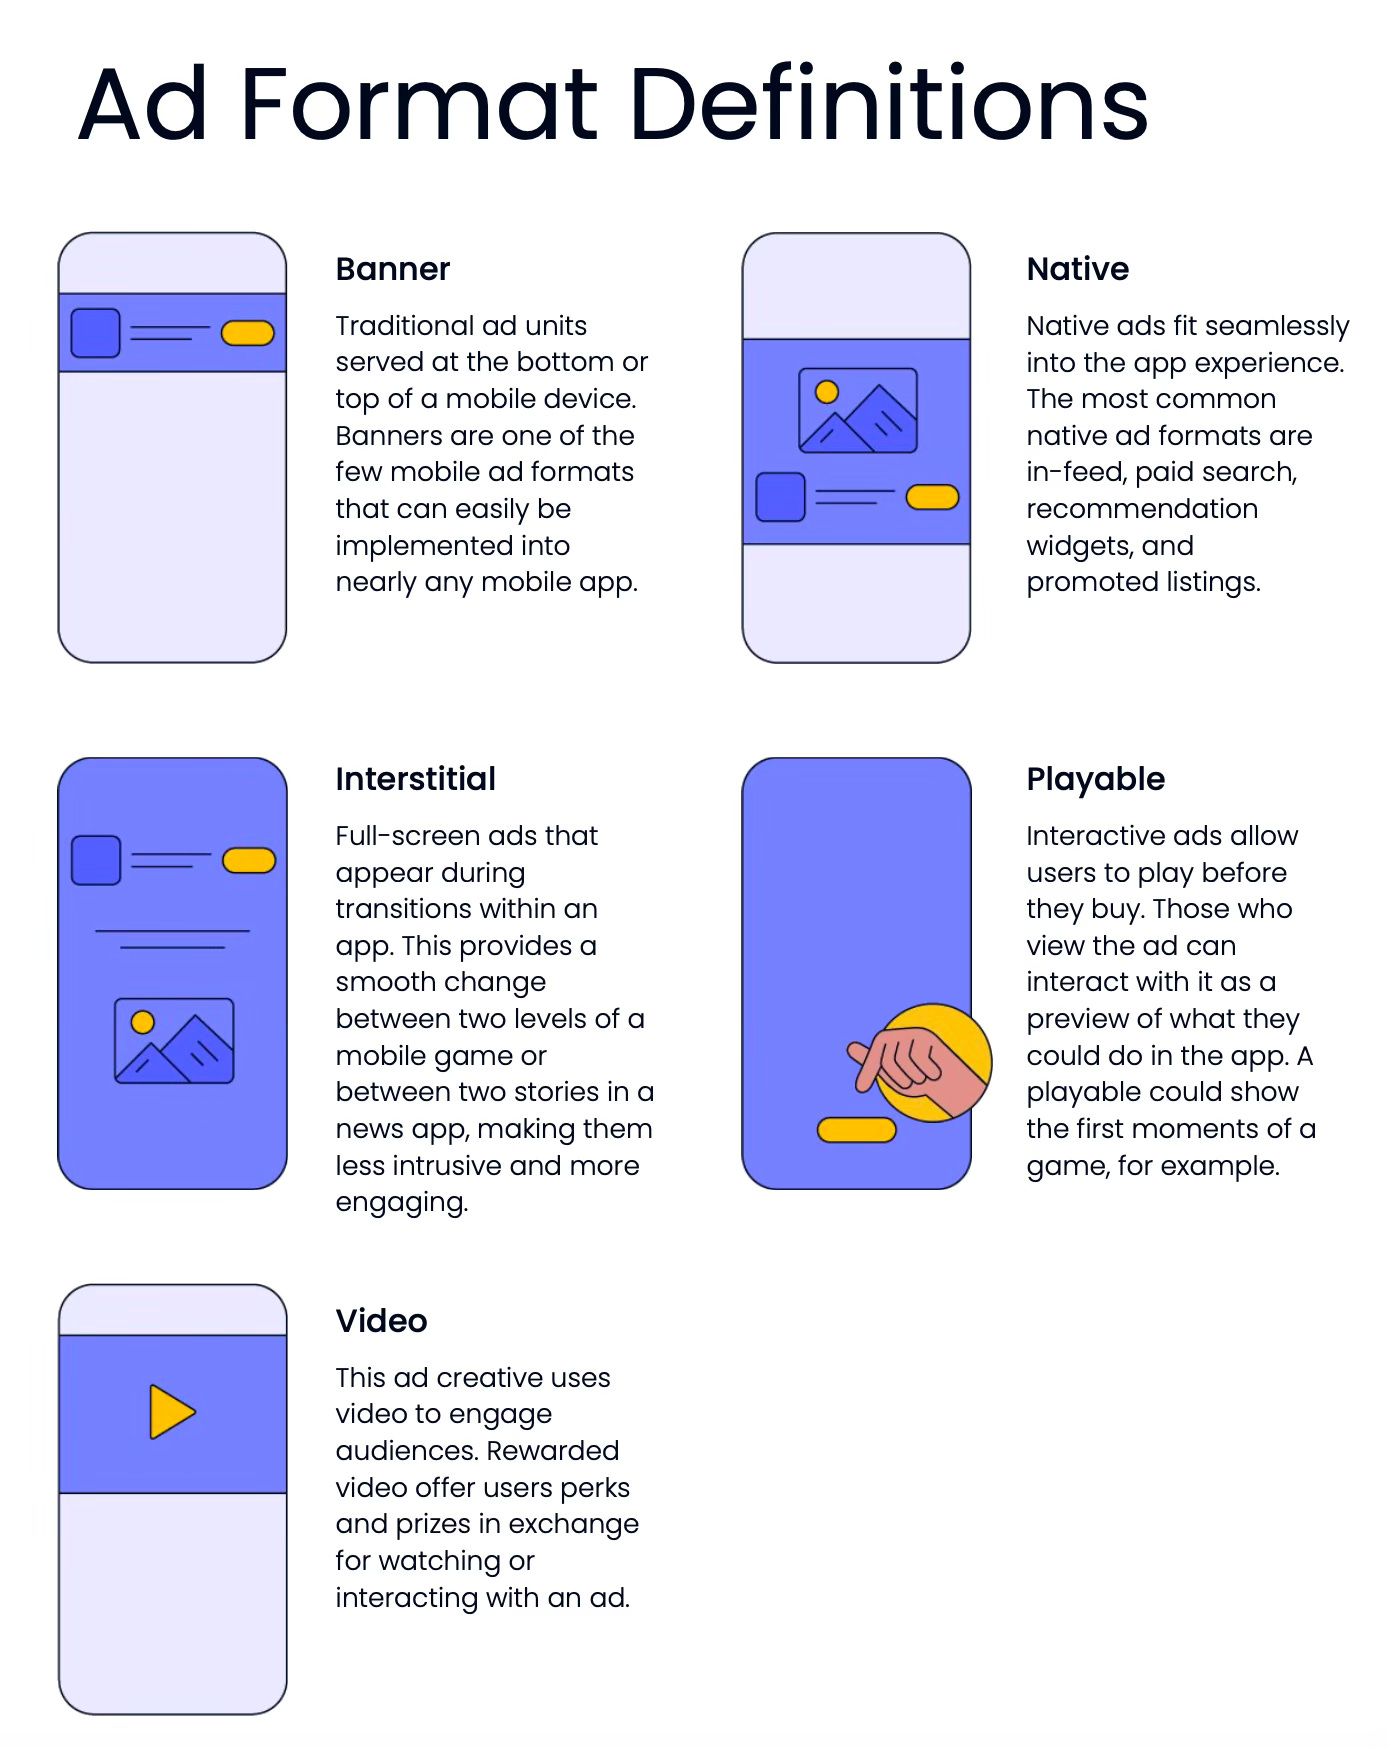
CPI - benchmarks for advertising formats in games
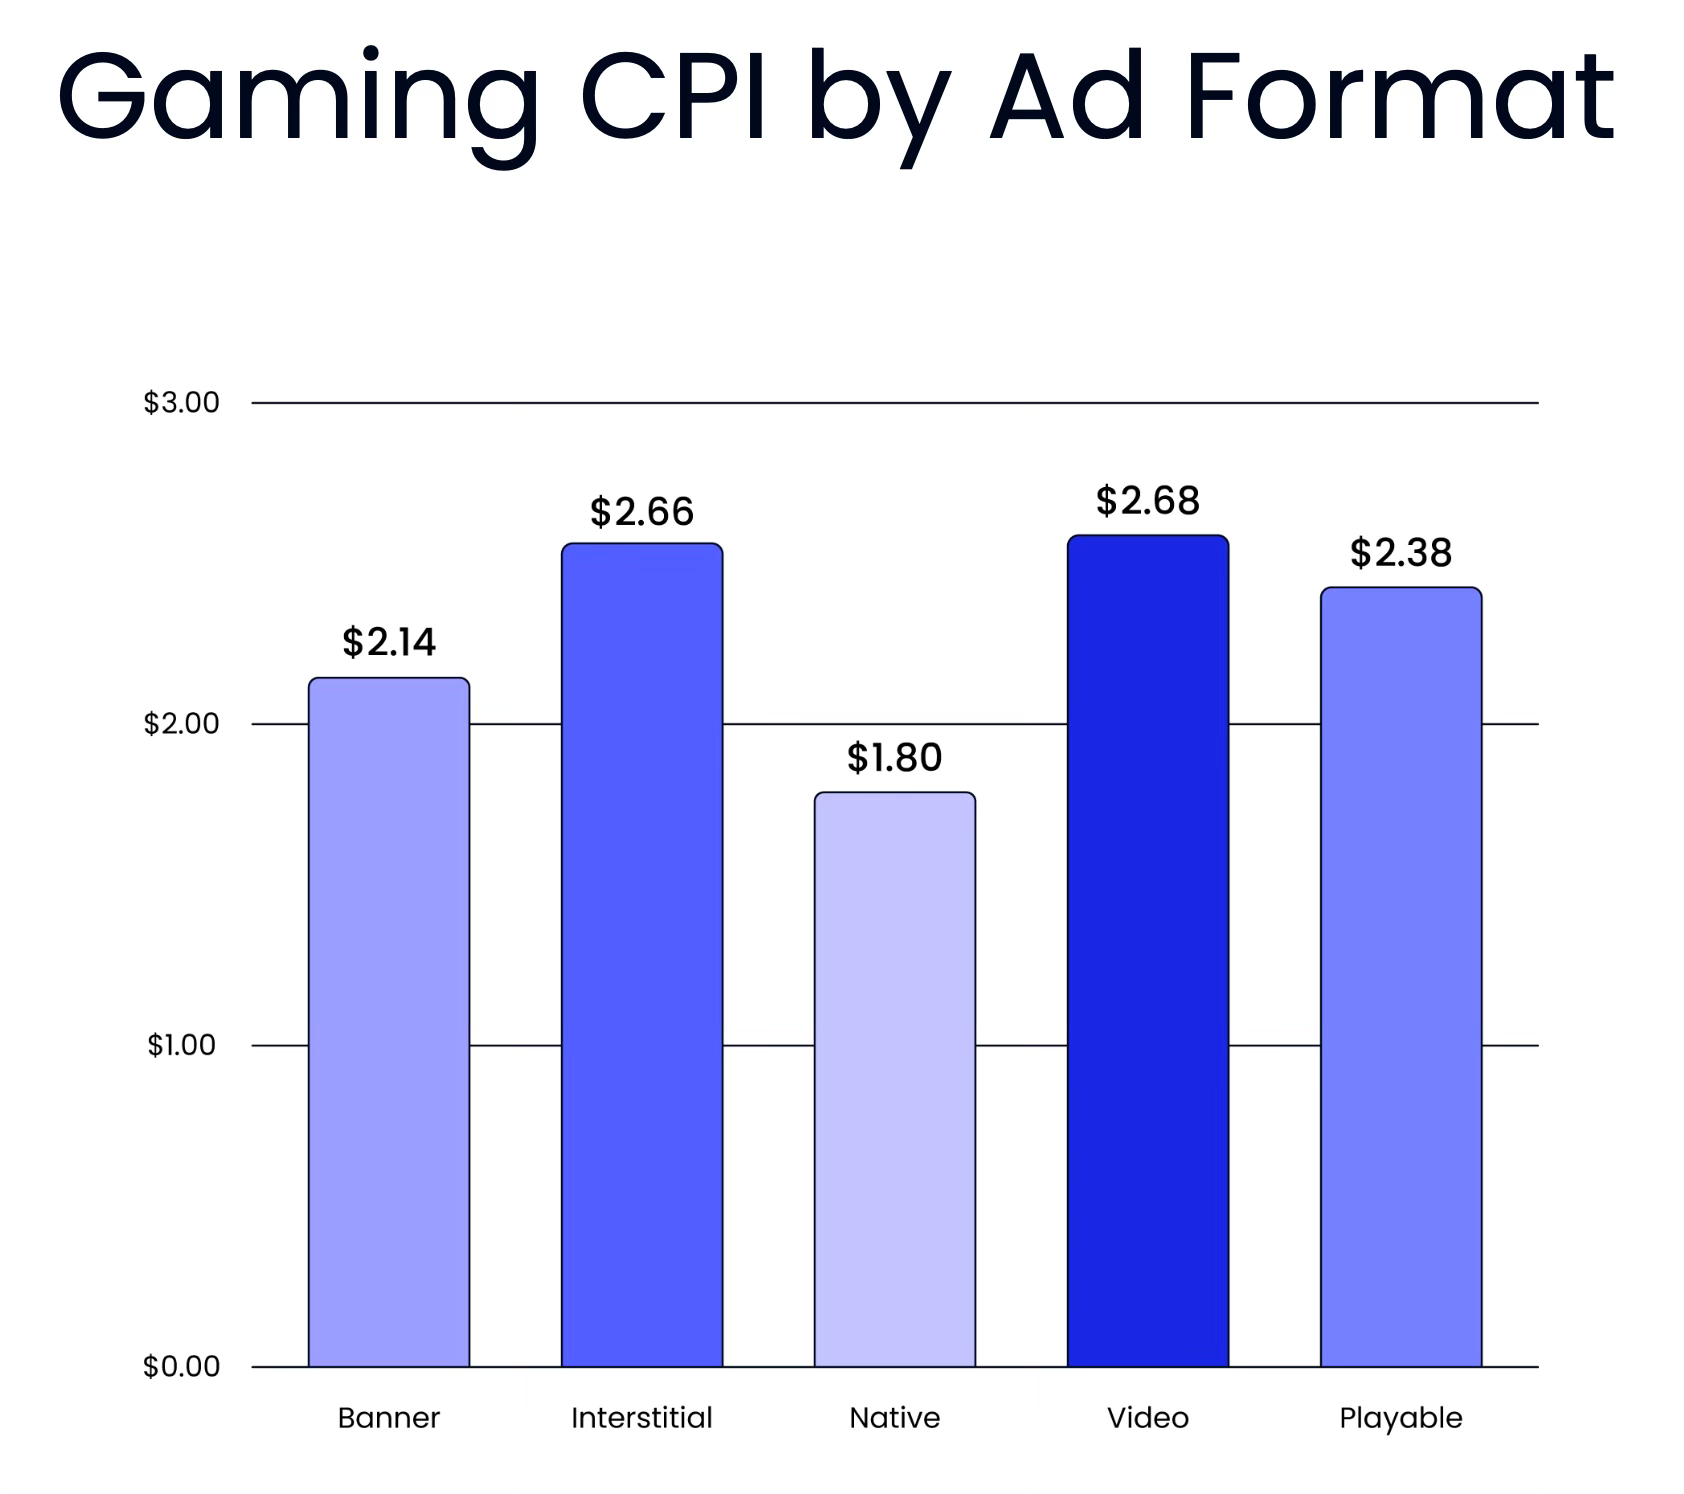
The lowest CPI is for native formats (feed integration, widgets, etc.) - $3.09 on iOS and $1.22 on Android. $1.8 on average.
GameDev Reports Newsletter offers promotion opportunities to gaming companies. Reach out to learn more.
Banners are second ($2.14 on average - $3.26 on iOS and $0.88 on Android); Playable format is more expensive ($2.38 on average - $5.76 on iOS and $0.6 on Android).
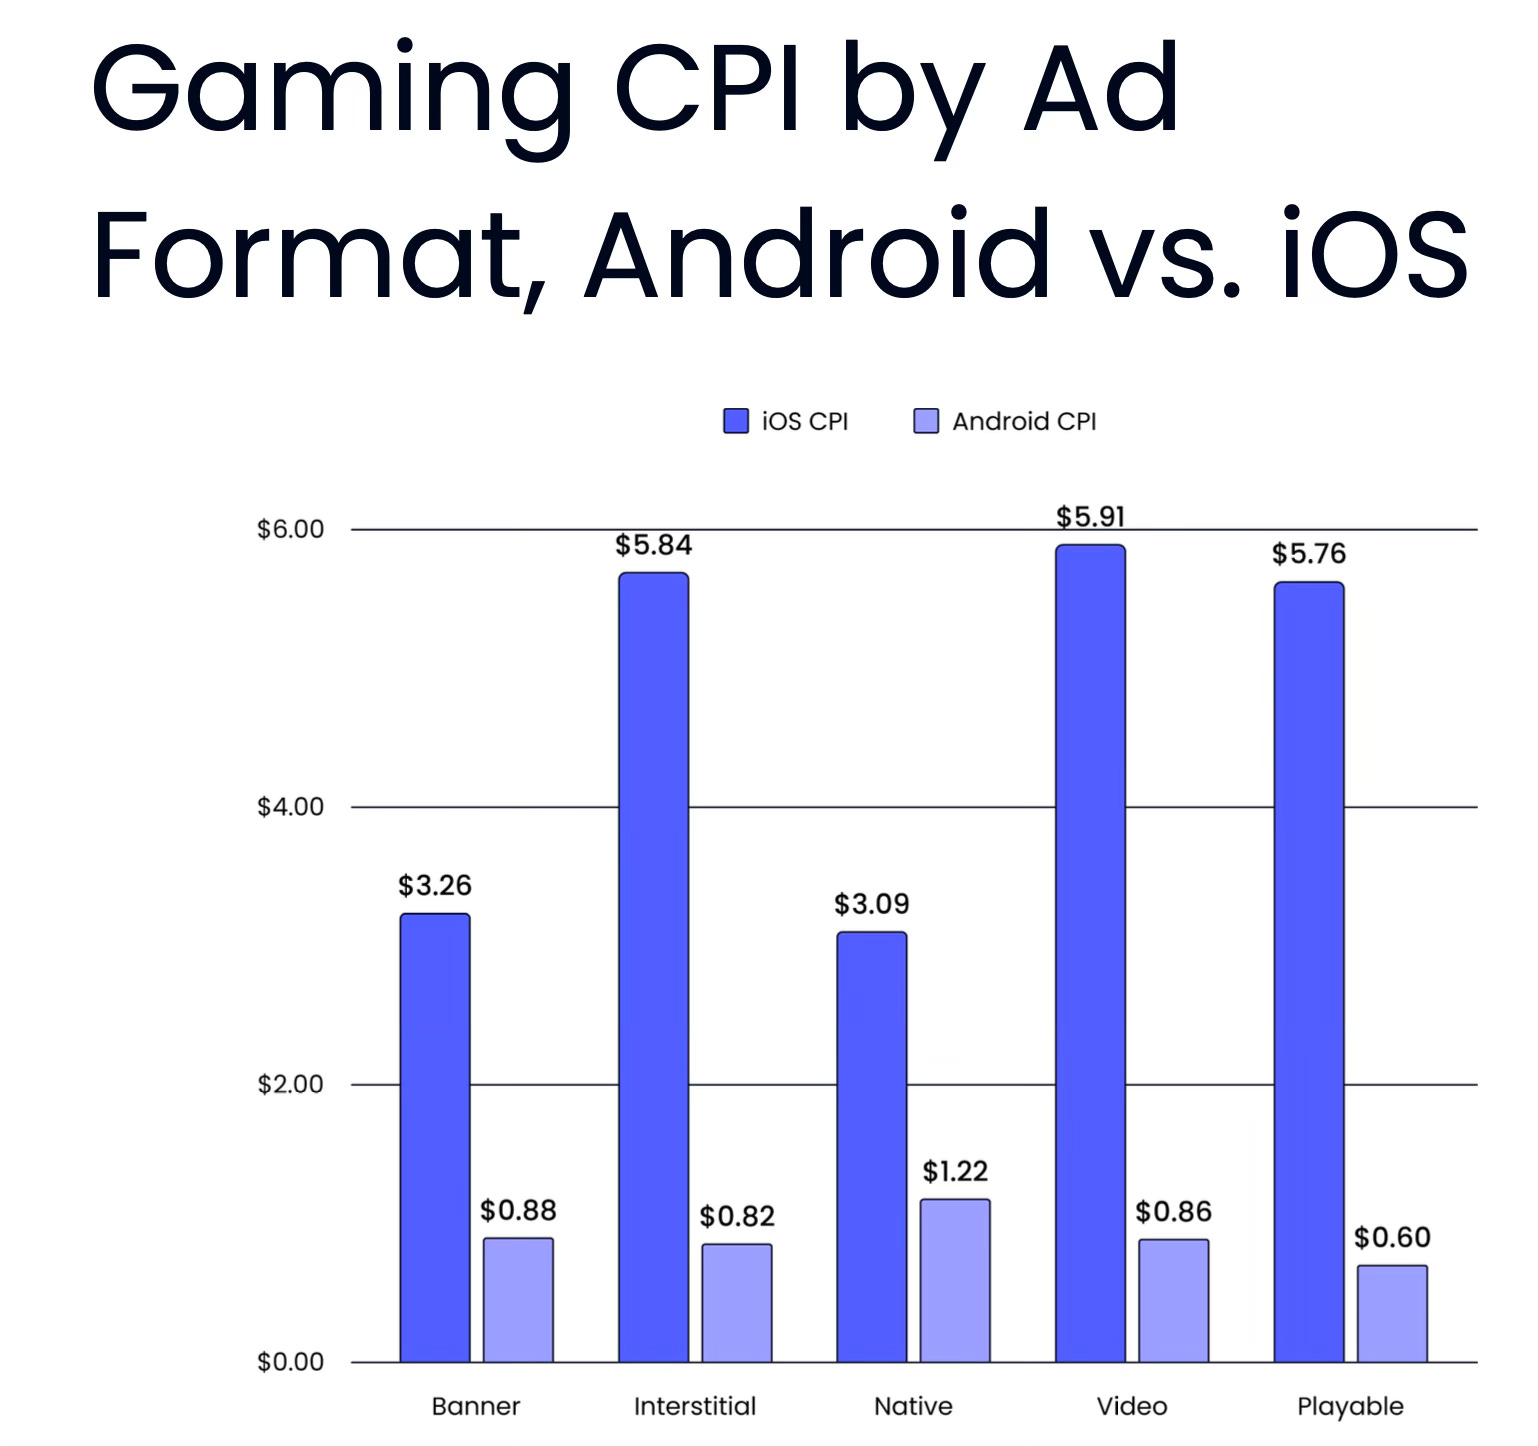
The most expensive advertising formats on average are Interstitial ($2.66 on average - $5.84 on iOS and $0.82 on Android) and video ($2.68 on average - $5.91 on iOS and $0.86 on Android).
Conversion from impression to install

The worst conversion is for banners. Liftoff took it as the baseline.
Results for native advertising formats are 1.6 times better.
There is a significant difference with video ads (conversion is 23 times better than banners); Playable ads (conversion is 27 times better) and Interstitial (conversion is 30 times better).
Day 7 ROAS - benchmarks in games

The worst D7 ROAS results are for Playable ads (6.81%); Interstitial format (8.14%) and video ads (8.29%).
The best results are for banners (18.2%) and native advertising (20.26%).
❗️Liftoff notes that the situation regarding D7 ROAS can vary dramatically depending on the genre, audience, spending level, and many other factors. This is an average figure overall.