Moloco: Mobile Games in 2025
Moloco highlighted platform-level performance and general trends. Some of the numbers are exclusive and vary from the general industry numbers!


Sample: 100 top-grossing publishers, accounting for about 50% of global IAP revenue. The company collected data over 24 months, tracked 4 billion installs, 65 million purchase events, and $8 billion in IAP revenue.
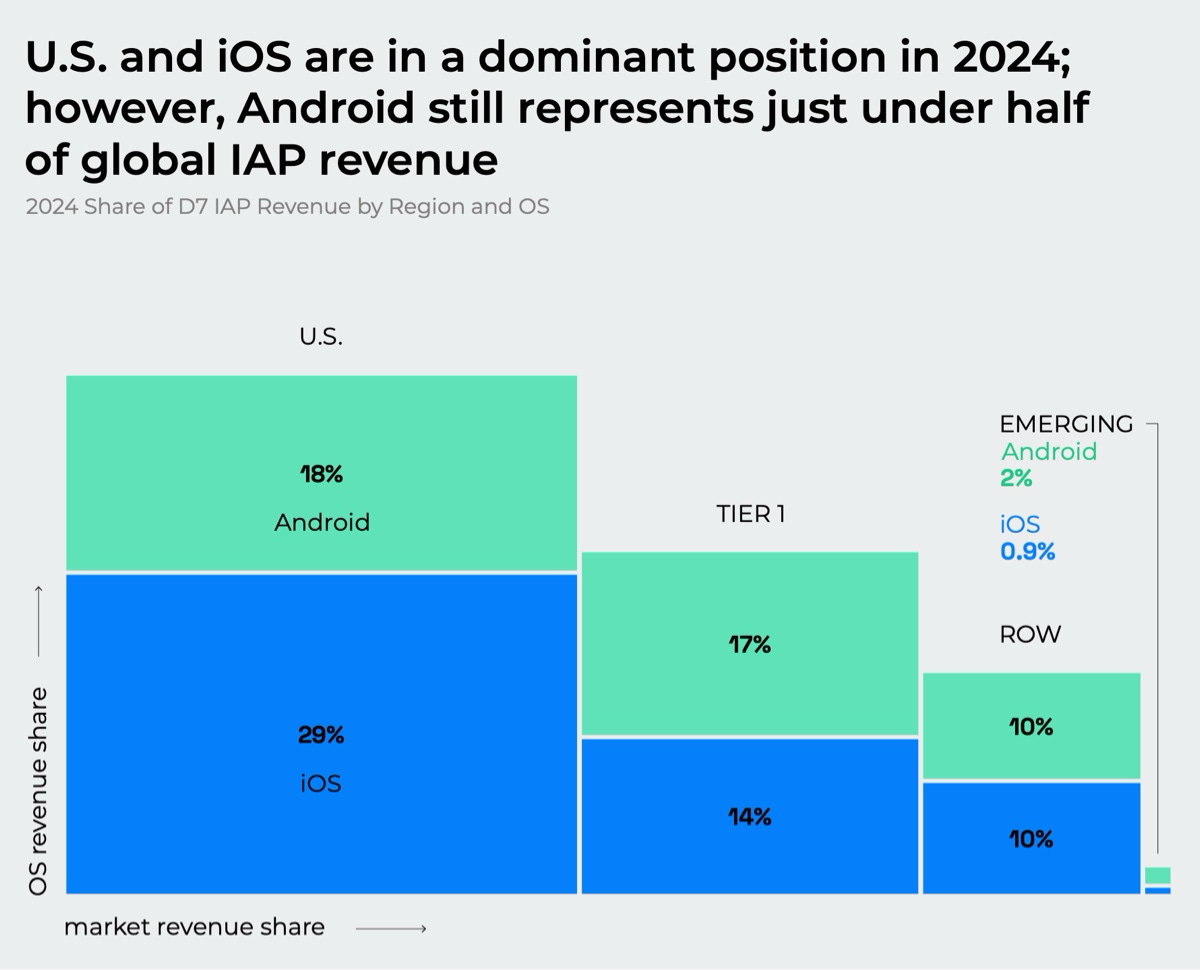
The US accounts for 45% of global mobile IAP revenue. In Tier-1, Moloco included countries with a high number of payers and high ARPPU (Japan, South Korea, Germany, etc.), making up 32% of the global IAP market. Emerging markets, with high downloads but low payer counts and ARPPU (India, Brazil, Mexico), account for 3%. Finally, the Rest of World category makes up about 19% of the volume.
Mobile Market Overview
Moloco data is based on the top-100 gaming advertisers on Moloco. Companies not using the channel are excluded.
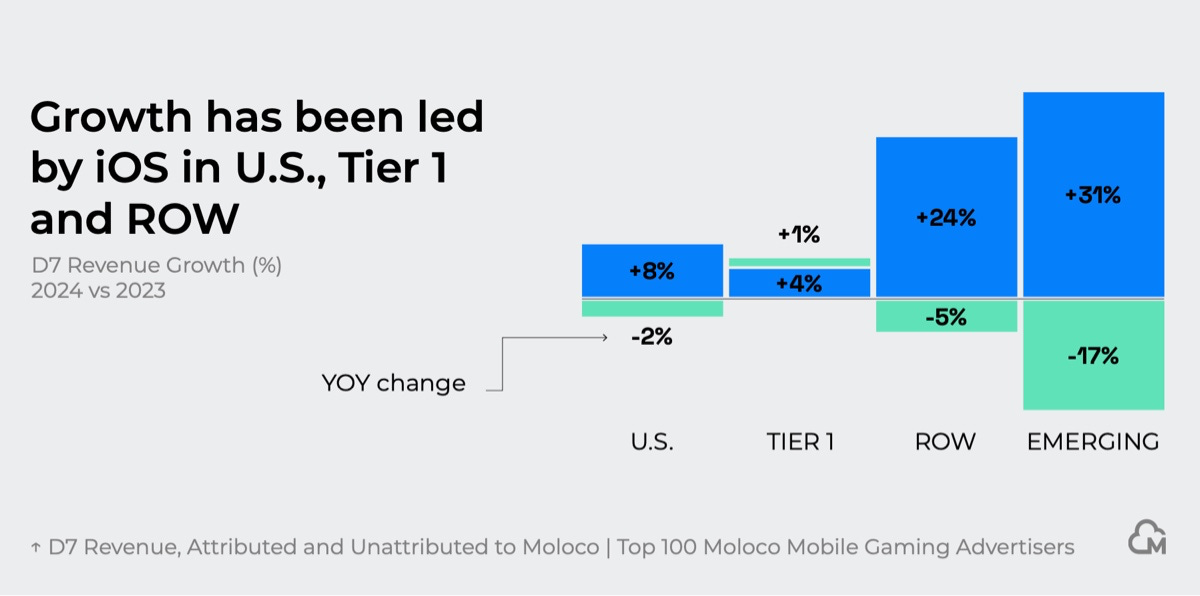
iOS downloads of the top-100 gaming companies spending on Moloco grew by 6% YoY. The strongest growth was in emerging markets (+26%). RoW countries grew by 7% YoY, and the US by 5% YoY. Tier-1 markets showed the weakest dynamics (+0.2% YoY). These numbers differ from overall industry download trends.
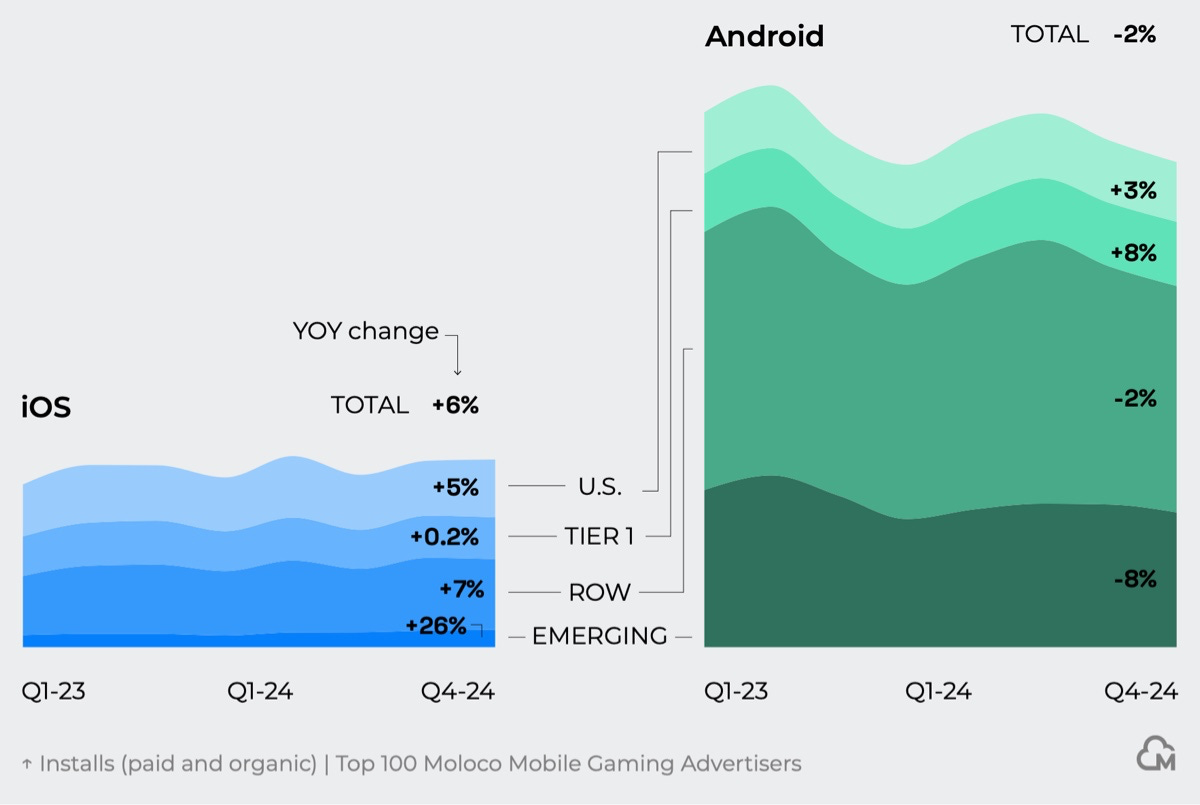
On Android, downloads dropped by 2% overall, mostly due to emerging markets (-8% YoY). Tier-1 countries grew by 8%, and the US by 3%.
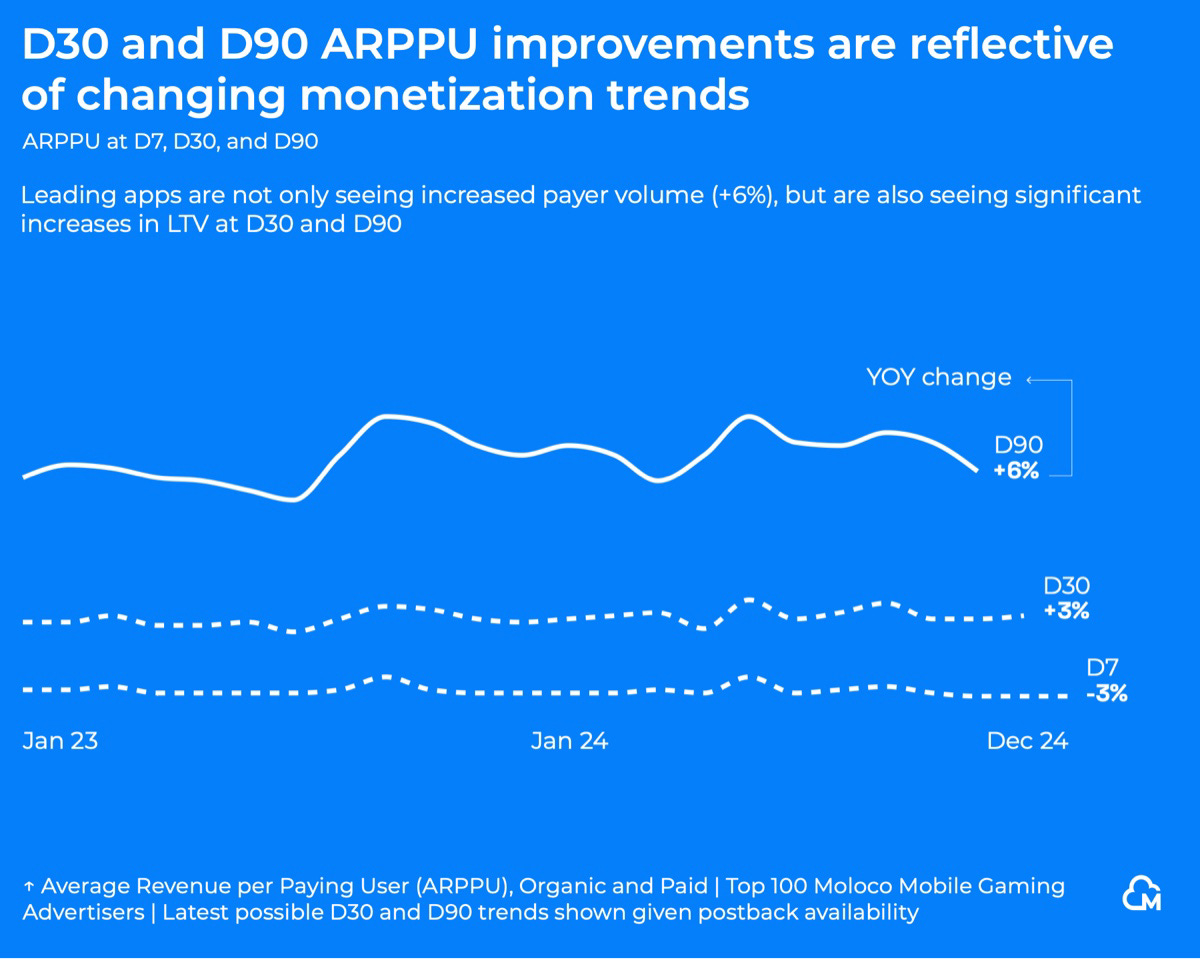
D7 ARPPU fell 3% YoY in 2024. But D30 ARPPU rose 3% YoY, while D90 ARPPU jumped 6%.
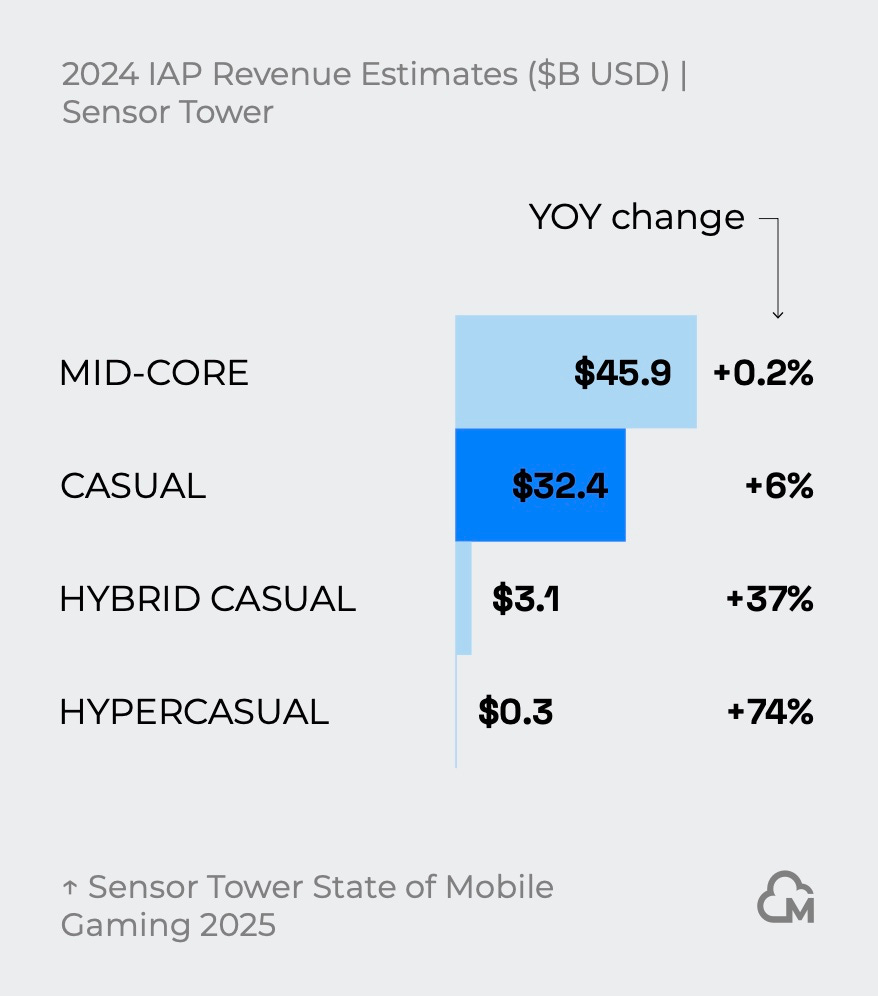
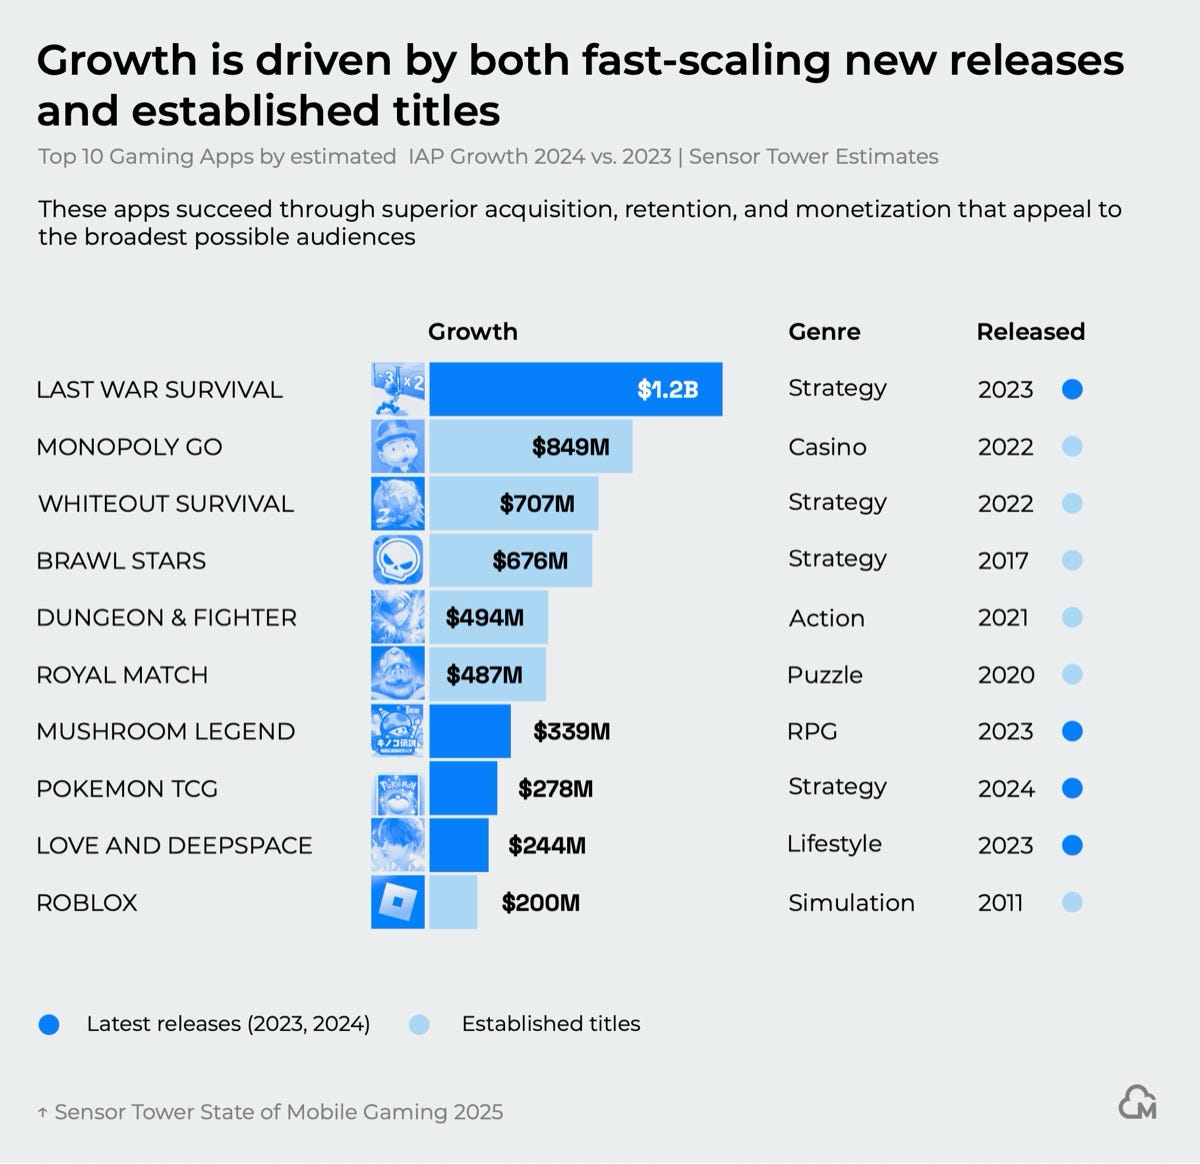
According to Sensor Tower 2024, midcore games remain the largest IAP segment ($45.9B revenue, +0.2% YoY). Casual games grew strongly ($32.4B, +6%), while hybrid-casual showed explosive growth ($3.1B, +37% YoY).
The strongest revenue growth in 2024 came both from new launches (Last War Survival, Mushroom Legend, Pokemon TCG, Love and Deepspace) and established hits (Monopoly Go, Whiteout Survival, Brawl Stars, Dungeon & Fighter, Royal Match, Roblox).
Paying User Behavior
The number of paying iOS users grew by 13% in 2024, surpassing Android (which saw a slight +0.3% increase YoY).
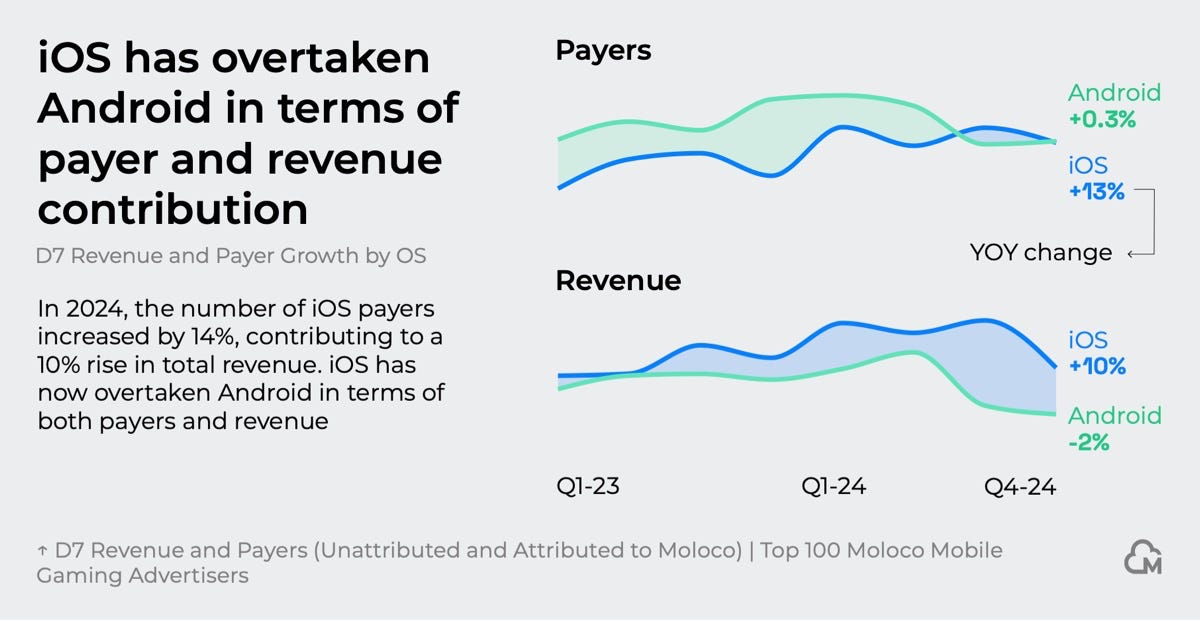
iOS growth was driven mainly by the US (+11% YoY) and RoW countries (+19% YoY). Emerging markets grew 39% in payers, but their revenue share remains small.
In revenue, iOS has long outperformed Android. In 2024, Apple’s platform grew by 10%, while Android slipped 2%.
User Acquisition
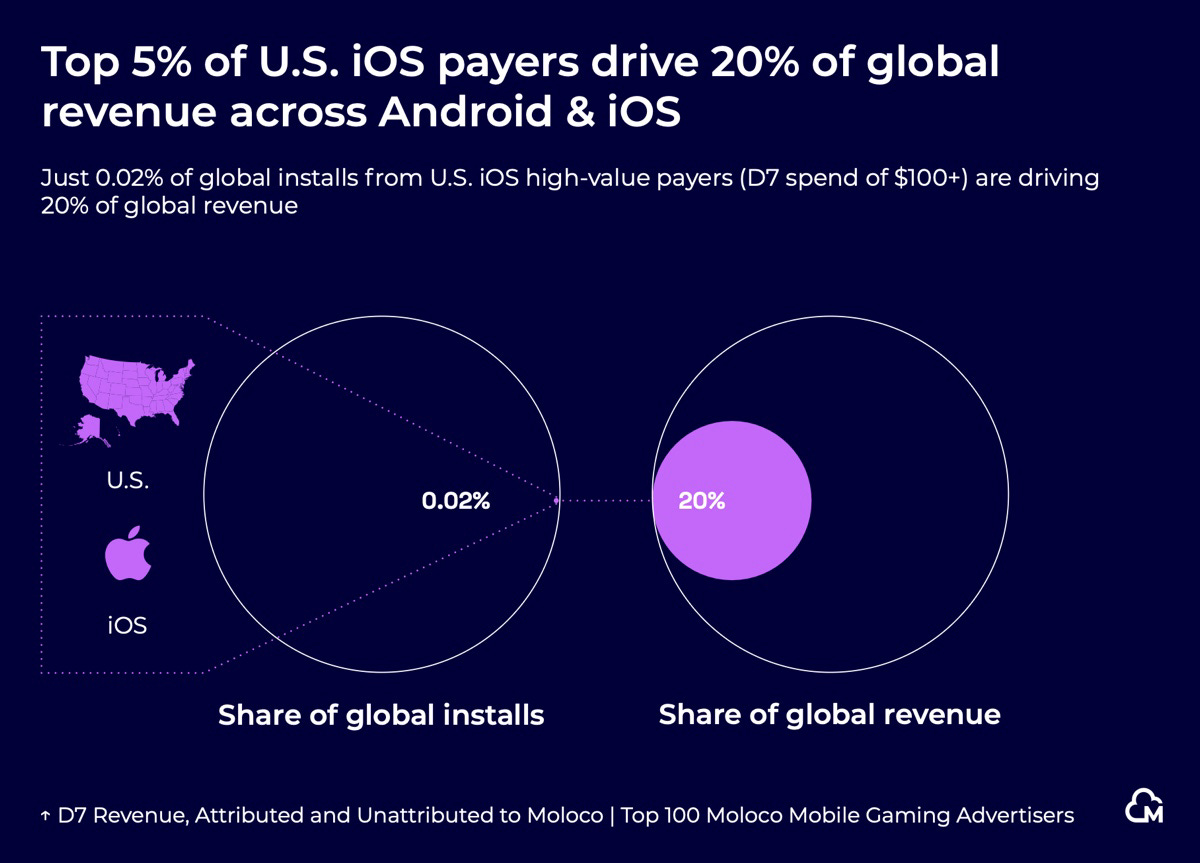
The top 5% of iOS users in the US generate 20% of the entire gaming IAP market. They represent just 0.02% of total installs in the country. These users typically spend over $100 by D7.
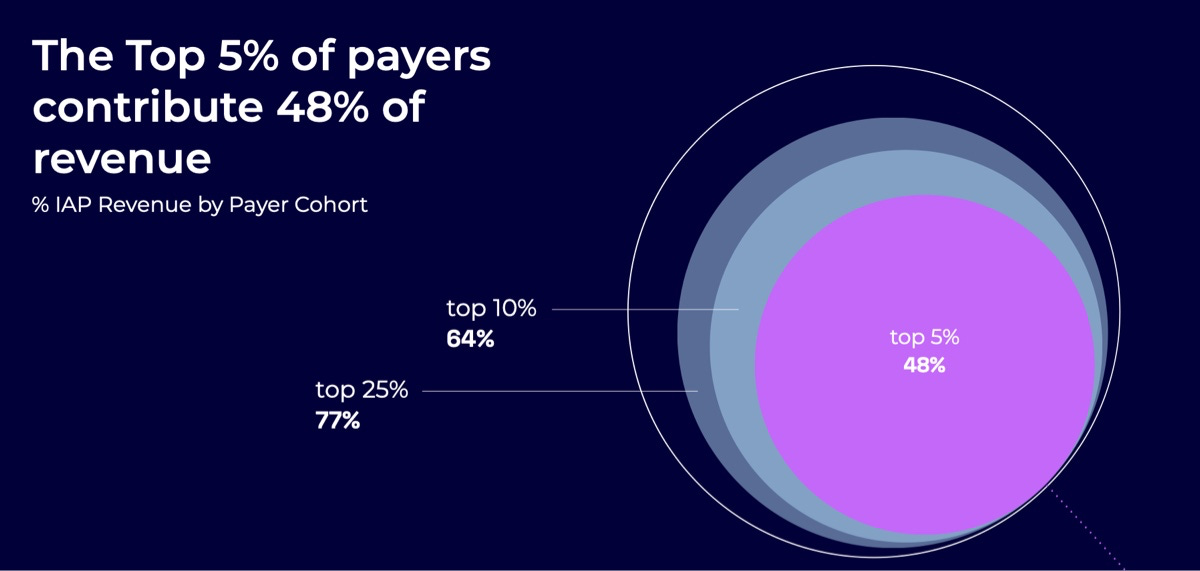
Globally, the top 5% of players generate 48% of total IAP revenue. The top 10% account for 64%, and the top 25% for 77%.
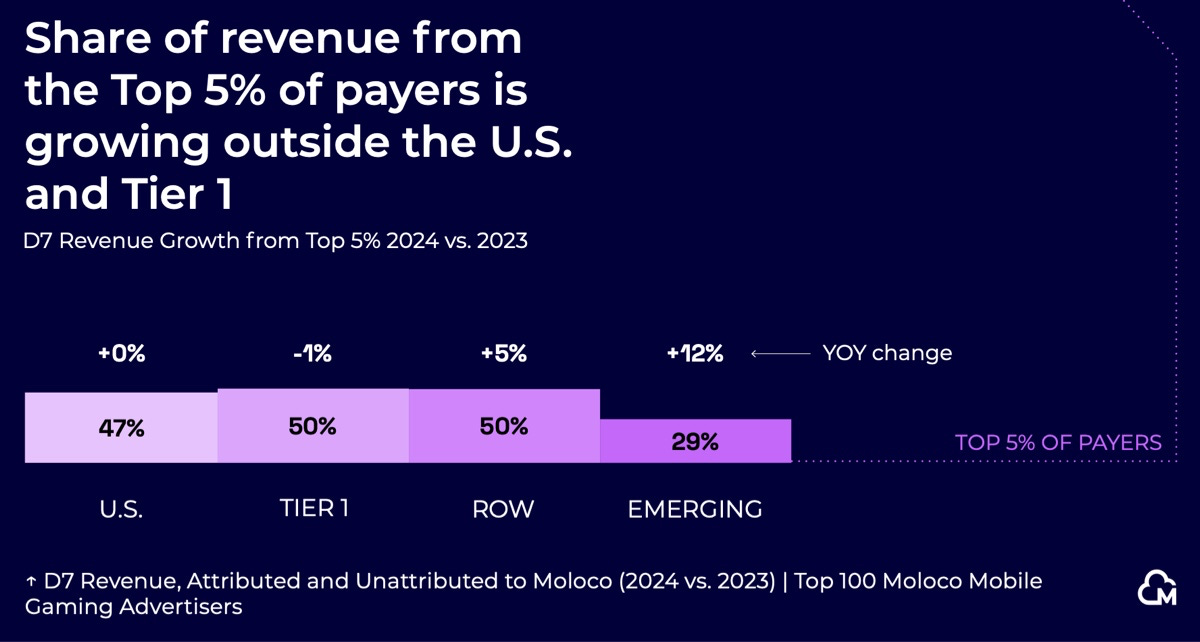
The share of “whales” in global revenue is growing, especially in emerging markets (+12% YoY) and RoW regions (+5% YoY).
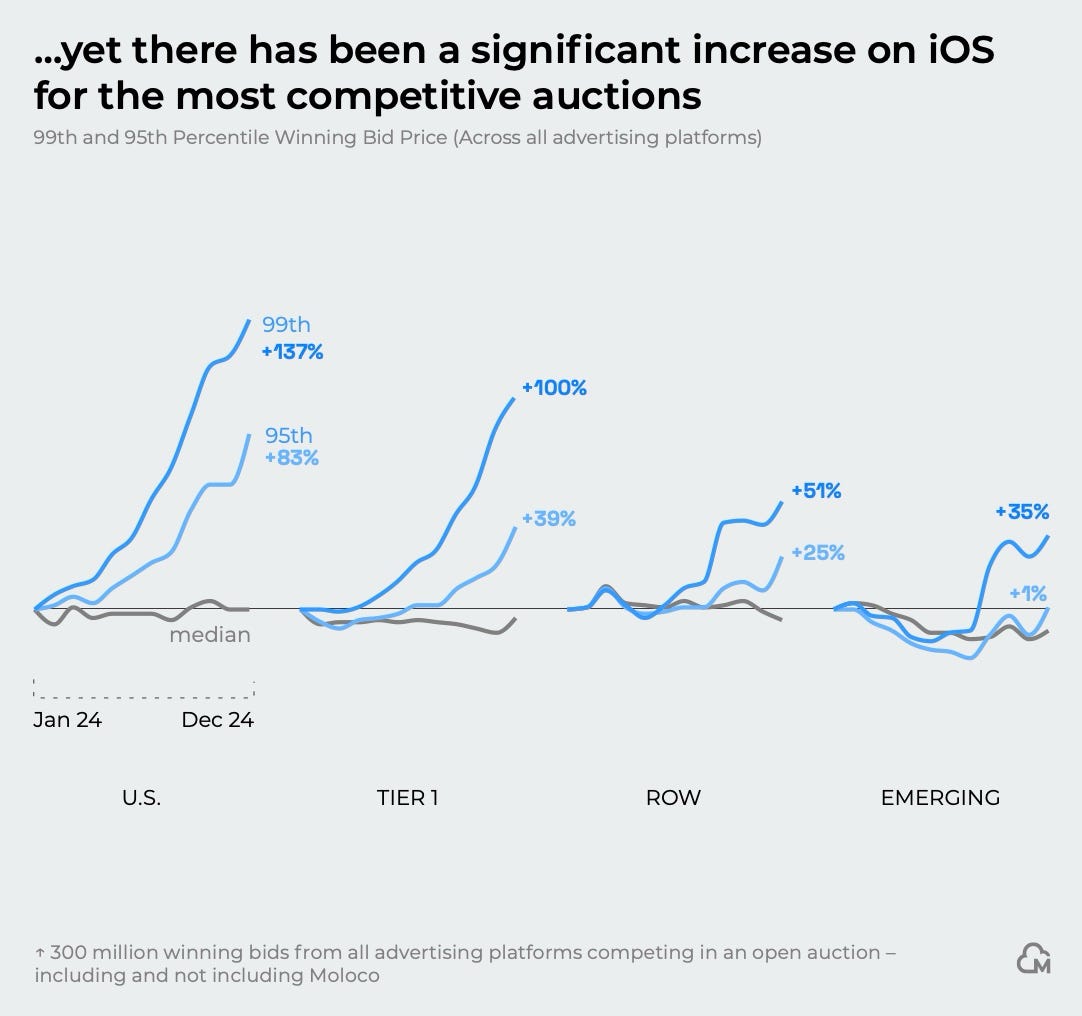
Auction competition on Android rose sharply in 2024. Median winning bids in Tier-1 increased 32%, and as much as 47% in RoW regions.
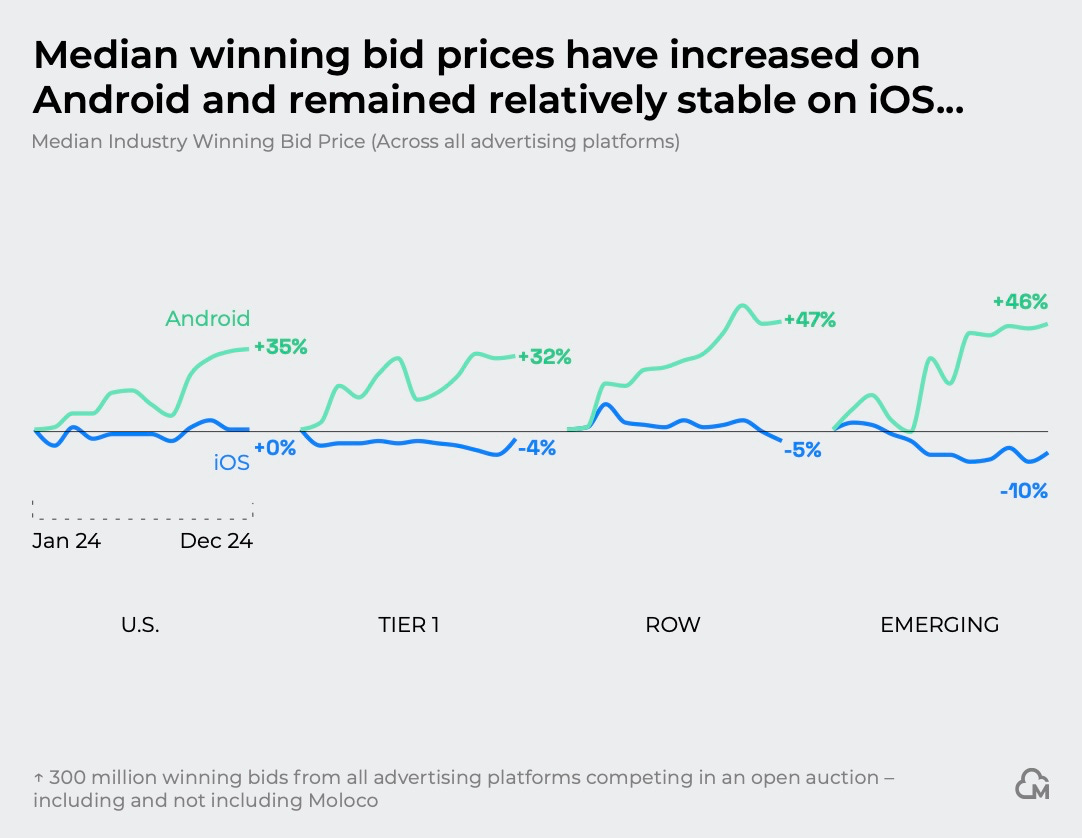
On iOS, there was slight cooling overall, but competition for top-paying users in the US (the top 5%) rose 80–140%.
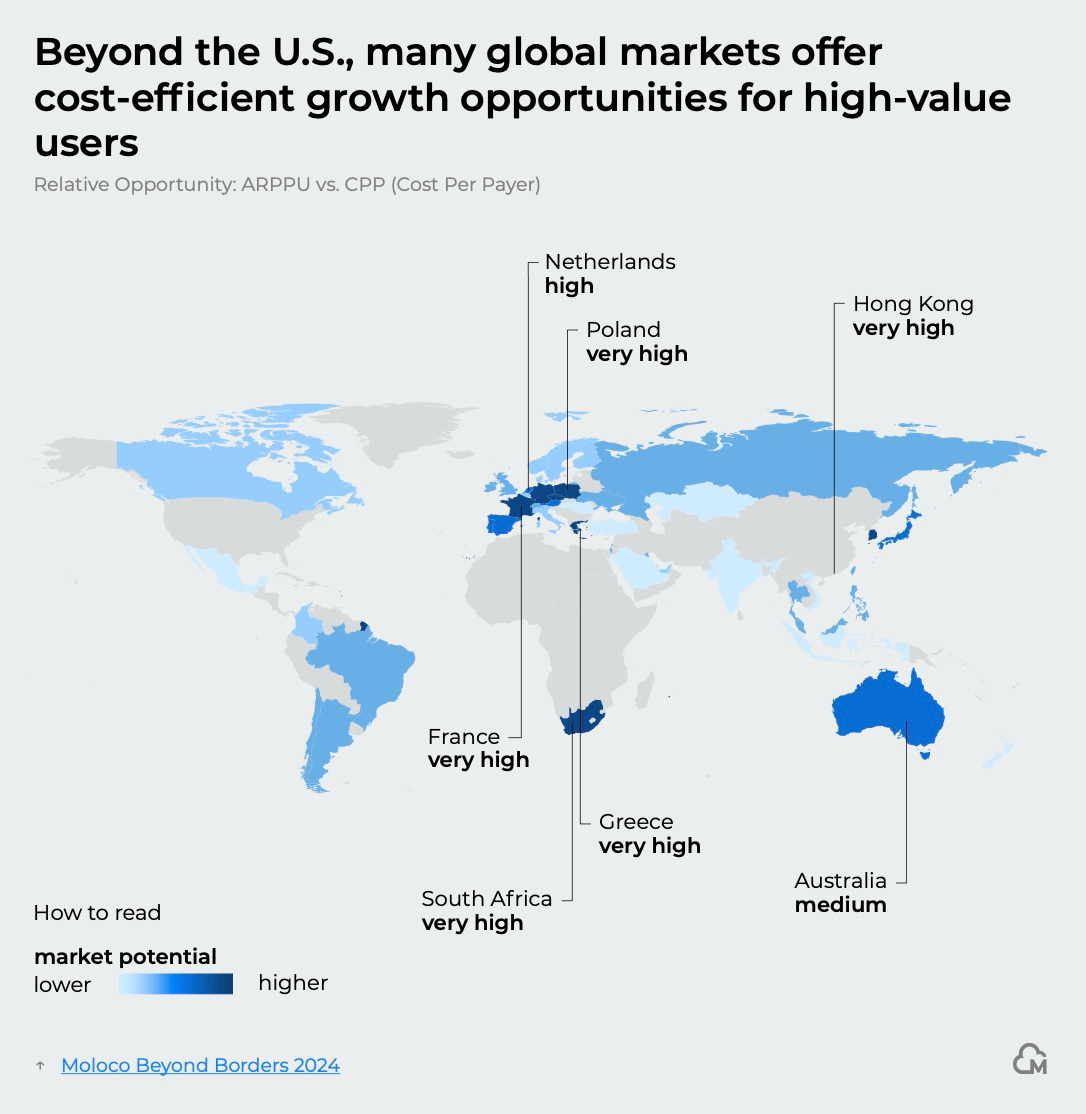
Moloco notes that with rising competition, many companies are shifting budgets to other regions. Poland, France, Greece, South Africa, and Hong Kong are highlighted as high-potential markets, based on ARPPU-to-CPP ratios (Cost Per Payer).
Marketing Strategies of Top Performers
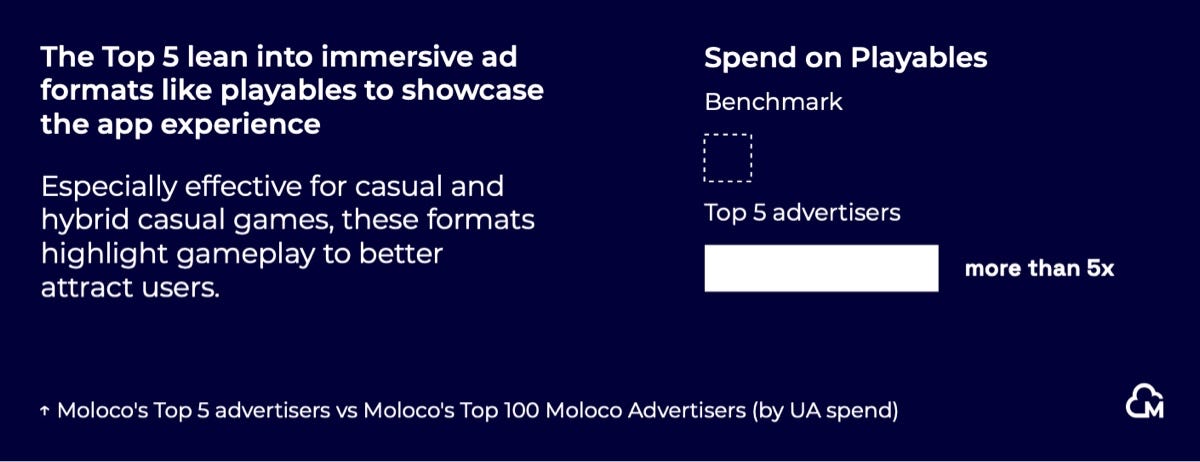
Moloco analyzed the approach of the top-5 advertisers on the platform out of 100.
These advertisers achieve higher D7 retention compared to others (by as much as 10–20%). Their users spend more (+22%) and complete more repeat purchases (+10%).
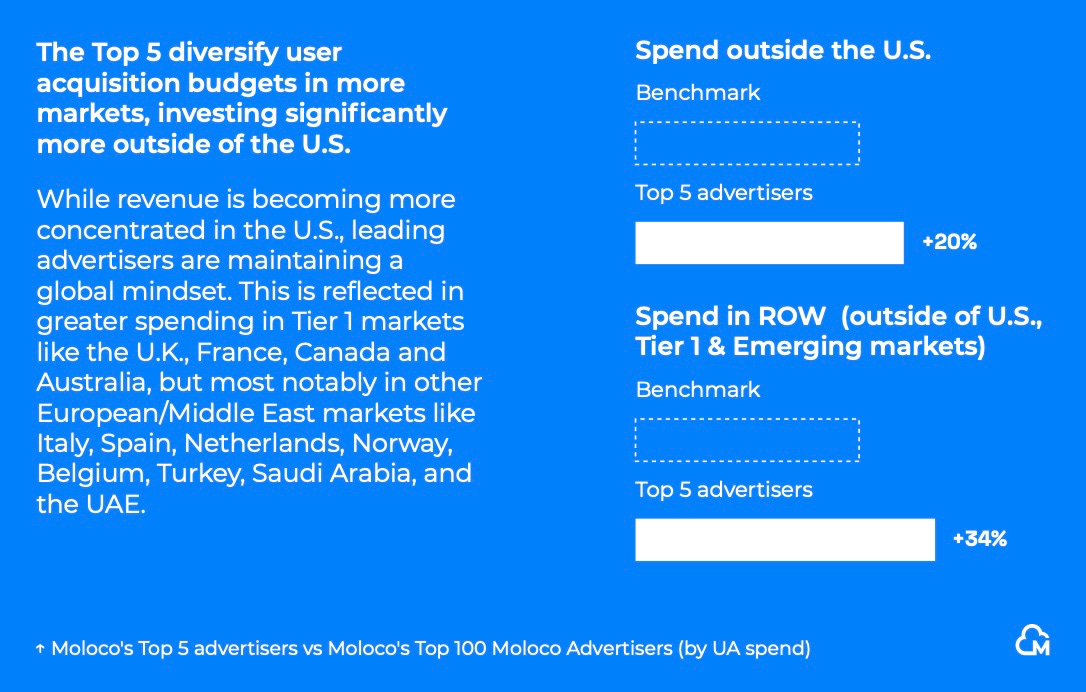
The top-5 invest more outside the US (+20%) and 34% more in RoW countries.
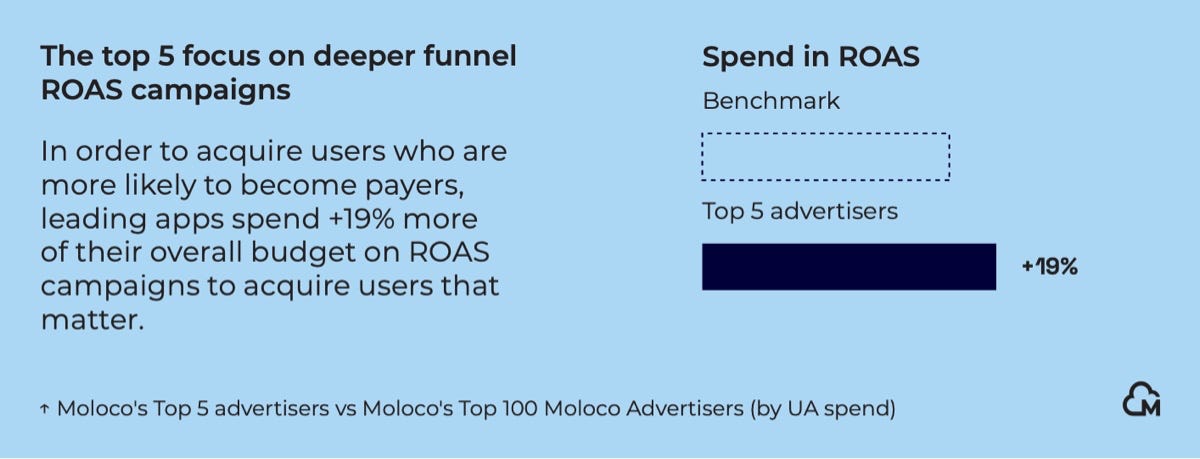
They spend 19% more on ROAS-optimized campaigns.
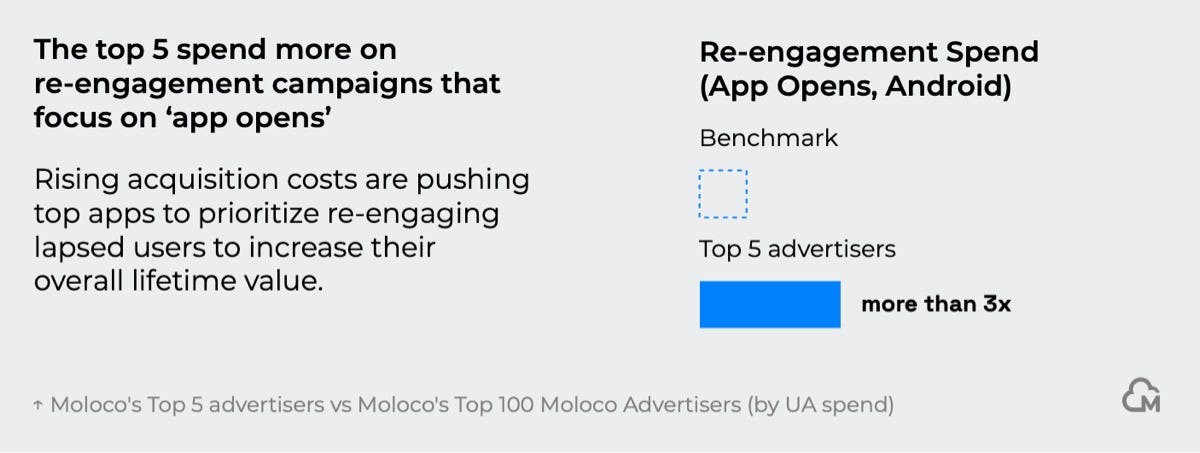
They are 3x more active in re-engagement campaigns, focusing on relaunching their games.
They spend over 5x more on campaigns with Playable creatives.