Newzoo: Audience Reaction to IP in Games
An interesting study that uncovers different market attitudes towards the IP.

The company analyzed 36 markets and 42 popular IPs while preparing the report.
The strength of IP has a significant impact in China, Southeast Asian countries, India, and Brazil. More than 70% of respondents in these countries noted that they would be more likely to play a game based on a well-known IP.

In contrast, in Western European countries (Belgium, the Netherlands), Northern Europe (Finland, Sweden), and Japan, the influence of IP—according to the audience survey—is almost half as strong.
❗️That’s interesting, because Japanese charts are full of IP-based games.
"Universality" and recognizability of IP are important factors. For example, the leader in this matter is Disney. In second place, with a slight lag, is Dragon Ball.

❗️I can hardly imagine that 30% of Americans do not know DC Universe characters. Let’s leave that on Newzoo’s conscience.
There is a noticeable correlation between the region where content is produced and its popularity. American IPs are more popular in North America and Europe, while Japanese IPs are more popular in Japan and Southeast Asian countries.

Newzoo, for example, notes the popularity of La Casa De Papel in Latin America. And despite the fact that the series was produced in Spain, it became a cultural phenomenon in Spanish- and Portuguese-speaking LATAM countries, largely thanks to familiar cultural references and language.
Consider subscribing to the GameDev Reports Premium tier to support the newsletter. Get access to the list of curated articles & archive of Gaming Reports that I’ve been collecting since 2020.
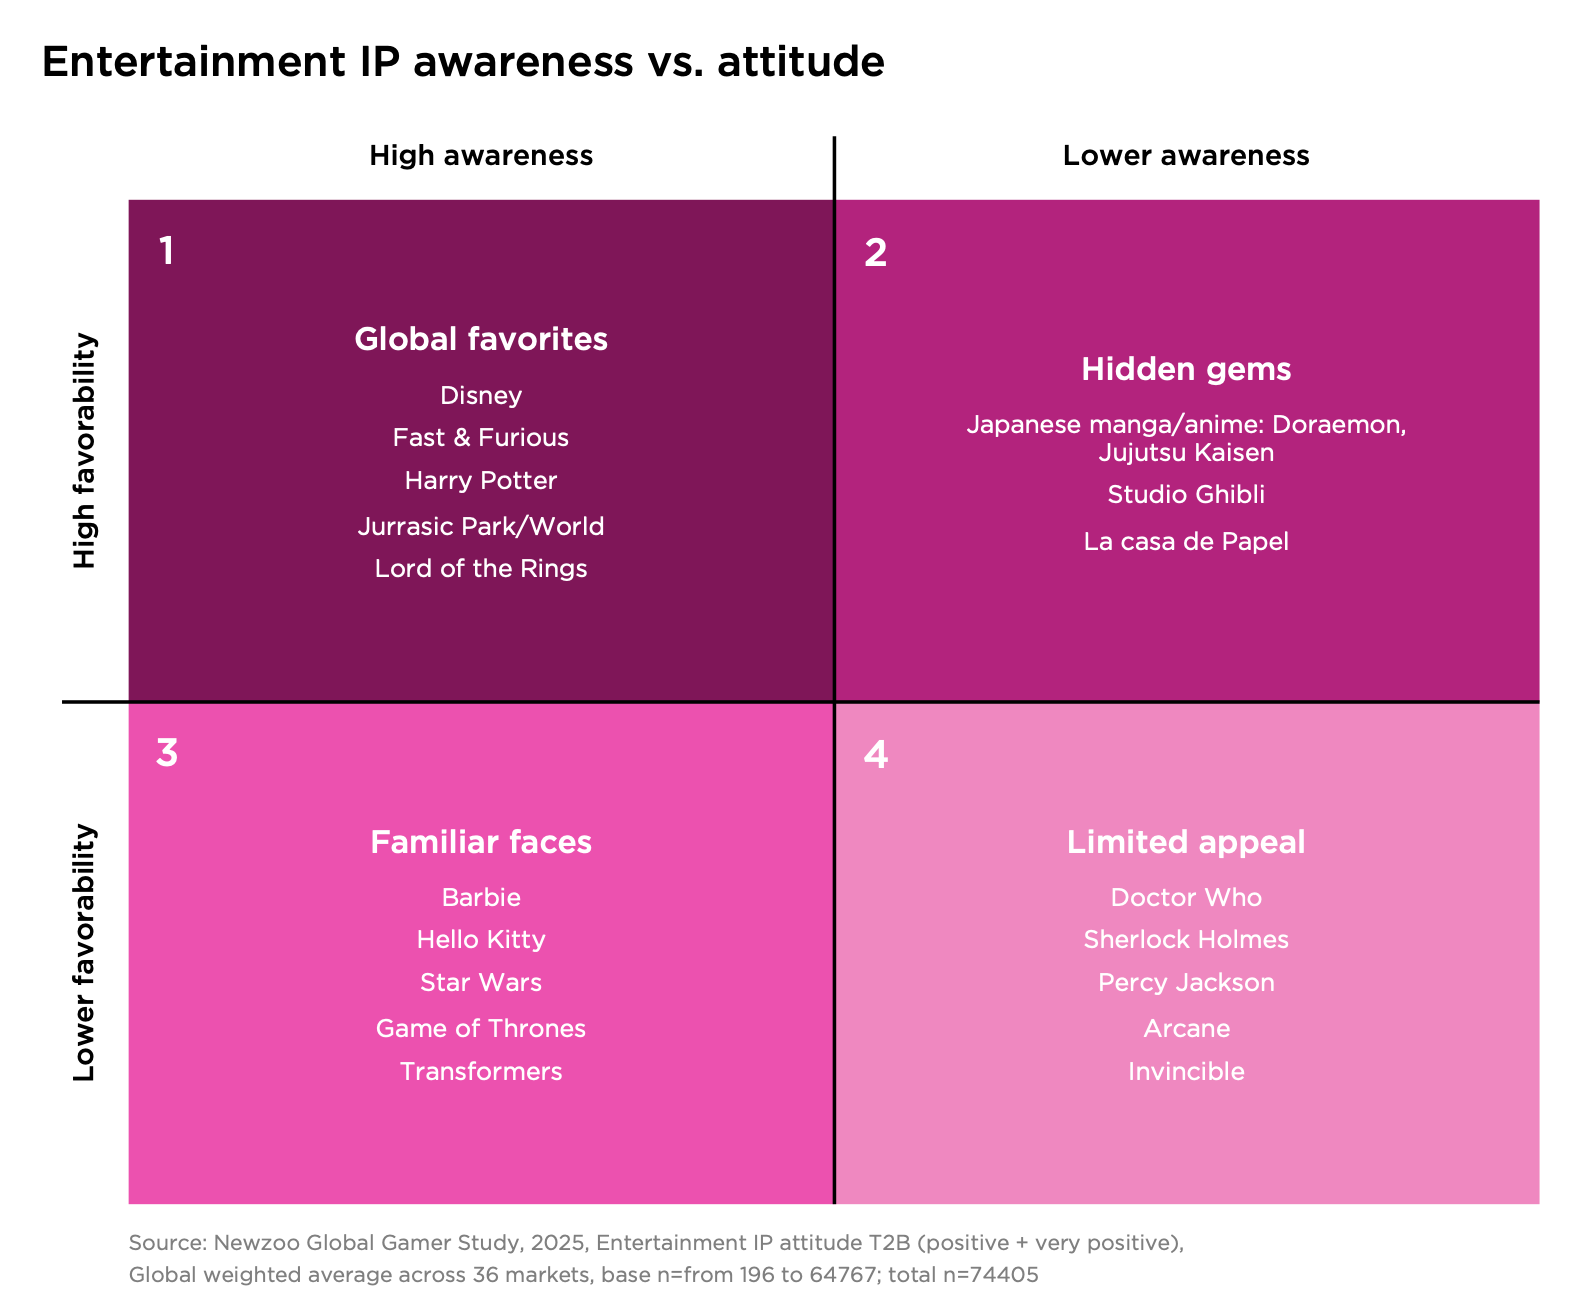
Shrek, Harry Potter, Disney cartoons, and Doraemon lead the list of user favorites worldwide.

Meanwhile, Hello Kitty, Yu-Gi-Oh!, Naruto, and Barbie are on the "least favorite" list. It’s important to note that users do not have a negative attitude toward these franchises—just fewer people reported a positive attitude toward them.
Newzoo has prepared a map of IPs that can be used when searching for project collaborations. In quadrant 1 are projects loved by the audience with a large reach. In quadrant 2, audience favorites with a smaller reach. In quadrant 3 - IPs with a large reach but a low positive audience response. In quadrant 4, IPs with low reach and low positive audience response.