Sensor Tower & Adjust: Trends of the Japanese Mobile Market in 2024
RPGs are big, but action games and puzzles are the best when it comes to growth.
Overview of the Japanese Market
In 2023, more than 73% of Japan’s population used smartphones, and internet penetration reached 93%.
The total spending by Japanese users on mobile applications amounted to $179 billion, with only China and the USA ahead.
In Q1’24, 8 out of the top 10 apps by revenue were games. The only non-gaming apps in the top 10 were piccoma (a manga app - ranked 1st) and LINE (a messaging app - ranked 4th).
ATT opt-in rates in Japan have been growing year by year. The highest rate in Q1’24 was for games at 30%, the same as the previous year.
Overall app downloads declined in 2023 but saw a 3% increase at the beginning of 2024 (Q1’24 compared to Q4’23).
Revenue-wise, the market has plateaued, though there was a 3.5% increase in Q1’24 compared to the previous quarter.
Japanese Mobile Market
Revenue in the Japanese mobile market has been relatively flat since the start of 2023. However, there was a 2.23% increase in Q1’24 compared to the previous quarter.
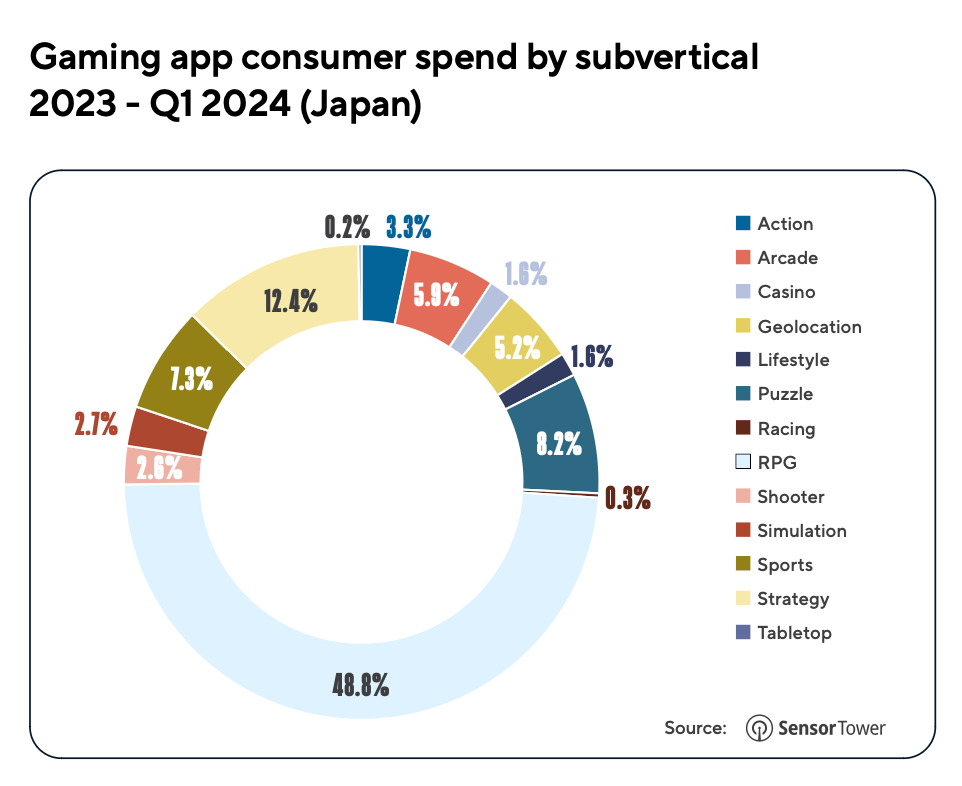
RPGs accounted for 48.8% of total market revenue, followed by strategy games (12.4%) and puzzle games (8.2%).
Action games saw the highest revenue growth in Q1’24 with a 21.6% increase. Puzzle games also grew significantly by 13.8%.
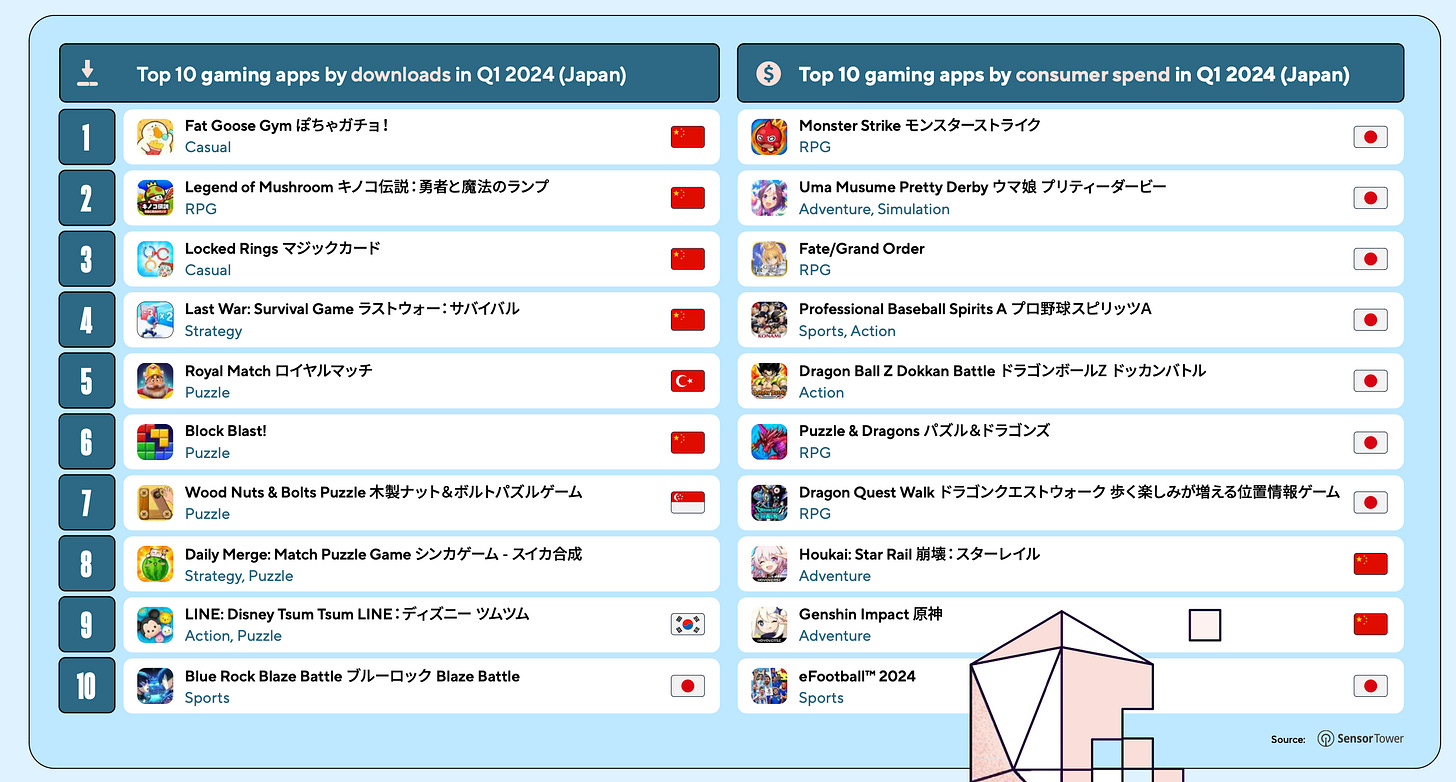
Monster Strike, Uma Musume Pretty Derby, and Fate/Grand Order topped the revenue charts in Q1’24.
Fat Goose Gym, Legend of Mushroom, and Locked Rings led in downloads in Q1’24.
The gaming audience in Japan is predominantly male (63.6%). In certain genres (e.g., sports games), the male audience reaches 91.8%, while in arcade games, the majority are female (58.9%).
The largest segment of Japanese mobile gamers (35.5%) is aged 25-34, making it the most active demographic.
Downloads and Sessions in the Japanese Mobile Market
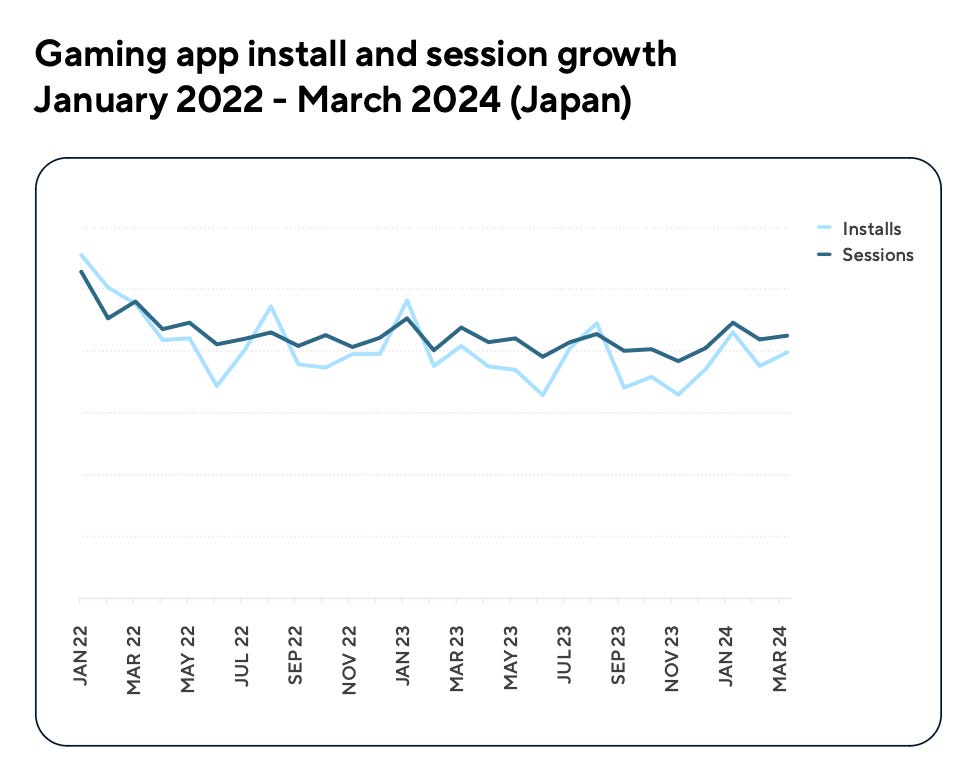
Game downloads in Japan began to decline in early 2022, with the drop stabilizing by 2023. In Q1’24, according to Adjust, downloads increased by 18% compared to Q4’23. The number of sessions also increased by 1% over the same period.
Comparing Q1’24 to the average figures for 2023, downloads rose by 7% and sessions by 6%. Globally, downloads fell by 1% while sessions increased by 4%; in the US, downloads decreased by 2% while sessions grew by 10%.
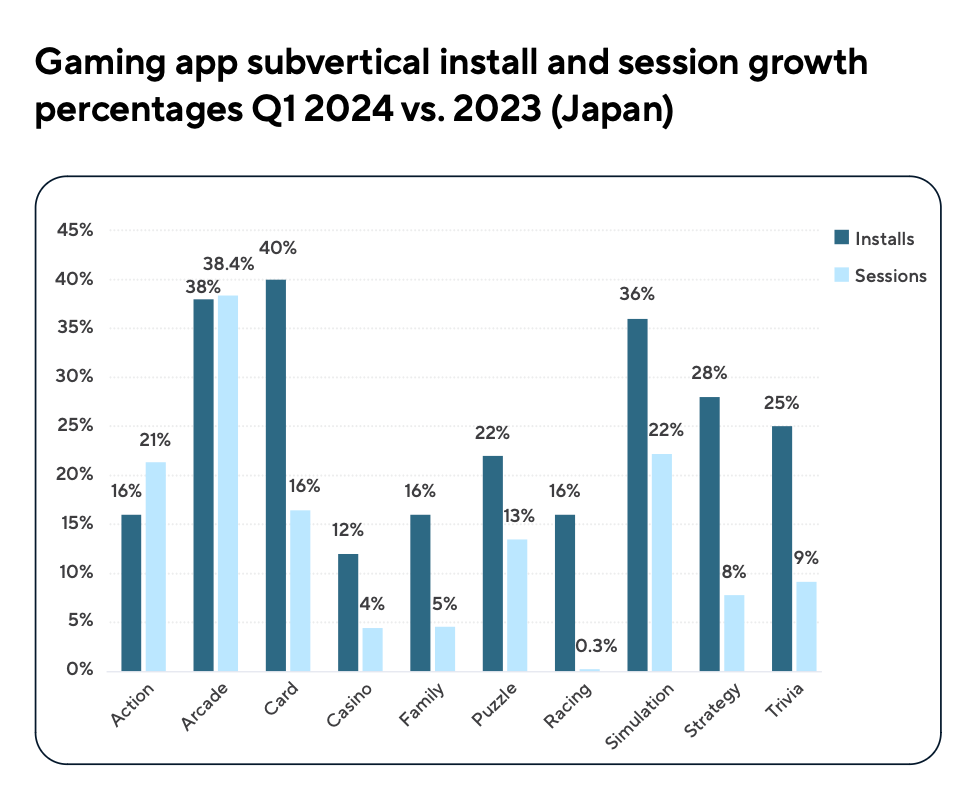
The growth leaders in Q1’24 were arcade games (sessions up by 38.4%, downloads by 38%), card games (downloads up by 40%, sessions by 16%), and simulation games (downloads up by 36%, sessions by 22%), compared to the average values of 2023.
Since the beginning of 2023, the highest percentage of installations has been for puzzle games (16%), RPGs (11%), and action games (11%). In terms of sessions, puzzles lead (23%), followed by RPGs (16%) and sports projects (11%).
Consider subscribing to the GameDev Reports Premium tier to support the newsletter. Get access to the list of curated articles & archive of Gaming Reports that I’ve been collecting since 2020.
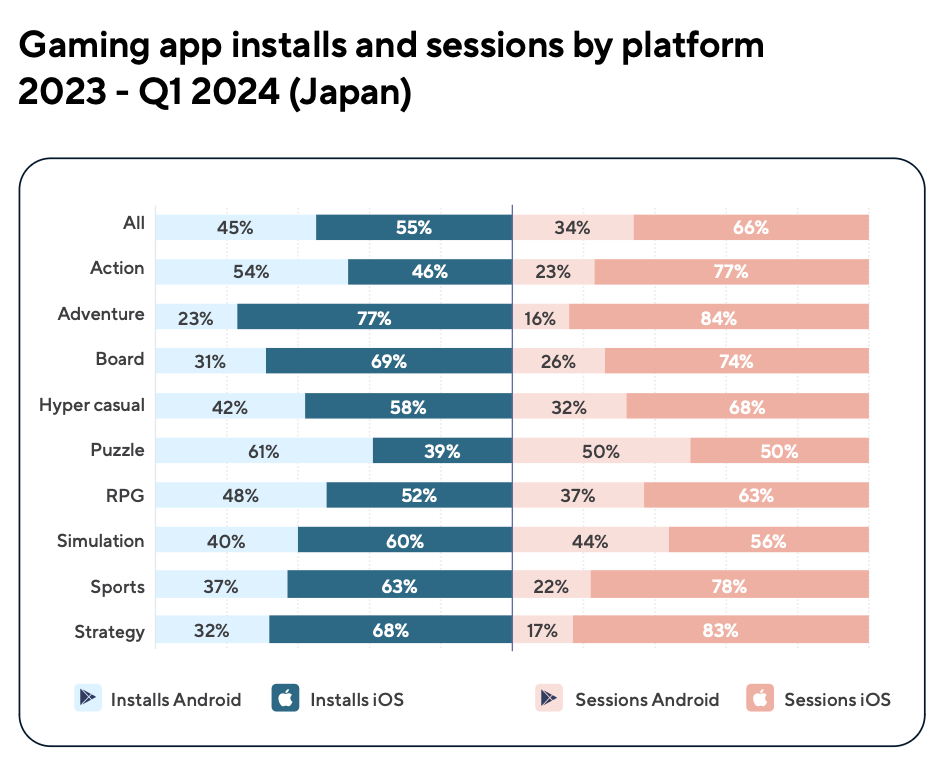
Overall, game app downloads in Japan are balanced between devices, with 55% on iOS and 45% on Android. Some genres, such as adventure games, are dominated by iOS (77%).
In terms of session share, iOS leads, accounting for 66% of the total volume. The average session length increased from 26.37 minutes in 2022 to 27.37 minutes in Q1’24.
The ratio of paid to organic traffic in Japan increased in Q1’24. The average for 2023 was 1.82, rising to 2.31 in Q1’24, indicating an increase in paid traffic. Spending grew the most on hyper-casual projects, board games, and the simulation genre.
The number of advertising partners remained stable, slightly decreasing from an average of 10.9 in 2023 to 10.8 in Q1’24. This suggests companies prefer to spend more on established channels.
Japanese Market Benchmarks - Retention, ARPMAU, eCPI, and more
In 2023, the average D1 Retention was 28%; by day 7, it is dropping to 14%. In Q1’24, the average D1 Retention was 27%, and D7 Retention was 13%. The weakest metric was for hyper-casual games (D1 Retention - 25%; D30 Retention - 5%). RPGs (32%) and simulation games (31%) had the strongest 1-day retention.
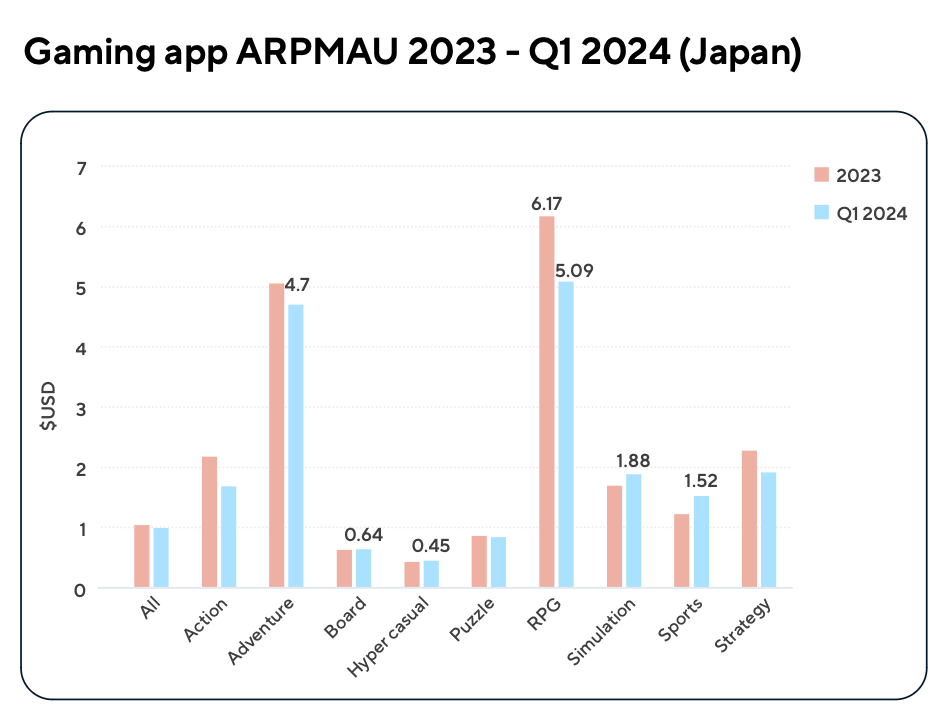
ARPMAU (average revenue per monthly active user) fell from $1.04 in 2023 to $0.99 in Q1’24. RPGs had the highest ARPMAU - $6.17 in 2023 and $5.09 in Q1’24; adventure games followed with $5.06 in 2023 and $4.7 in Q1’24. Hyper-casual games had the lowest ARPMAU - $0.43 in 2023 and $0.45 in Q1’24.
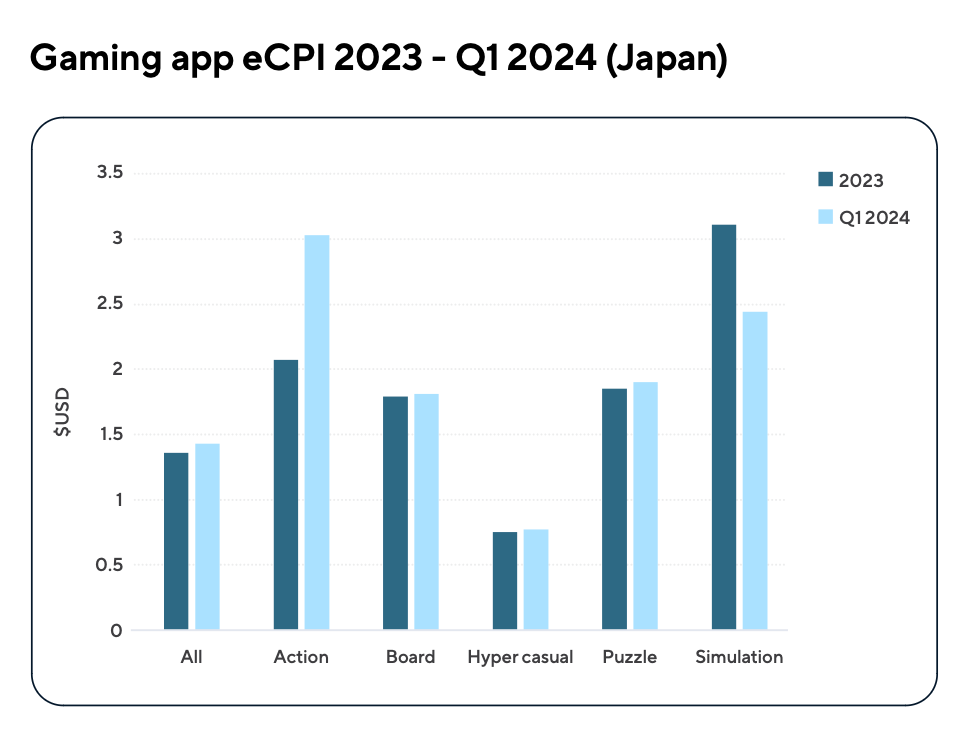
eCPI (effective cost per install) in Japan increased from an average of $1.36 in 2023 to $1.43 in Q1’24. The most significant growth was in action games ($2.07 in 2023 vs. $3.03 in Q1’24). However, eCPI in simulation games decreased from $3.11 in 2023 to $2.44 in Q1’24.
The highest first-month cumulative LTV was for RPGs ($2.32) and adventure games ($1.9). The first-day LTV for hyper-casual games was comparable to that of RPGs in Japan.
PC and Console Market
Adjust and Sensor Tower report that Japanese youth prefer consoles (72%). Mobile devices follow in popularity (64%), with PCs at 15%.
Companies note that given the high competitiveness of the mobile market, expanding to new platforms could bring additional revenue sources.


