


❗️All revenue figures are gross. Subscriptions and in-app purchases are included. Sensor Tower data excludes alternative Android stores, as well as ad revenue and payments outside of platforms (D2C).
Mobile Market in Q1’26
IAP revenue continues to grow. In Q1’26, total across all apps reached $43.5 billion, up 9.3% versus Q1’25.
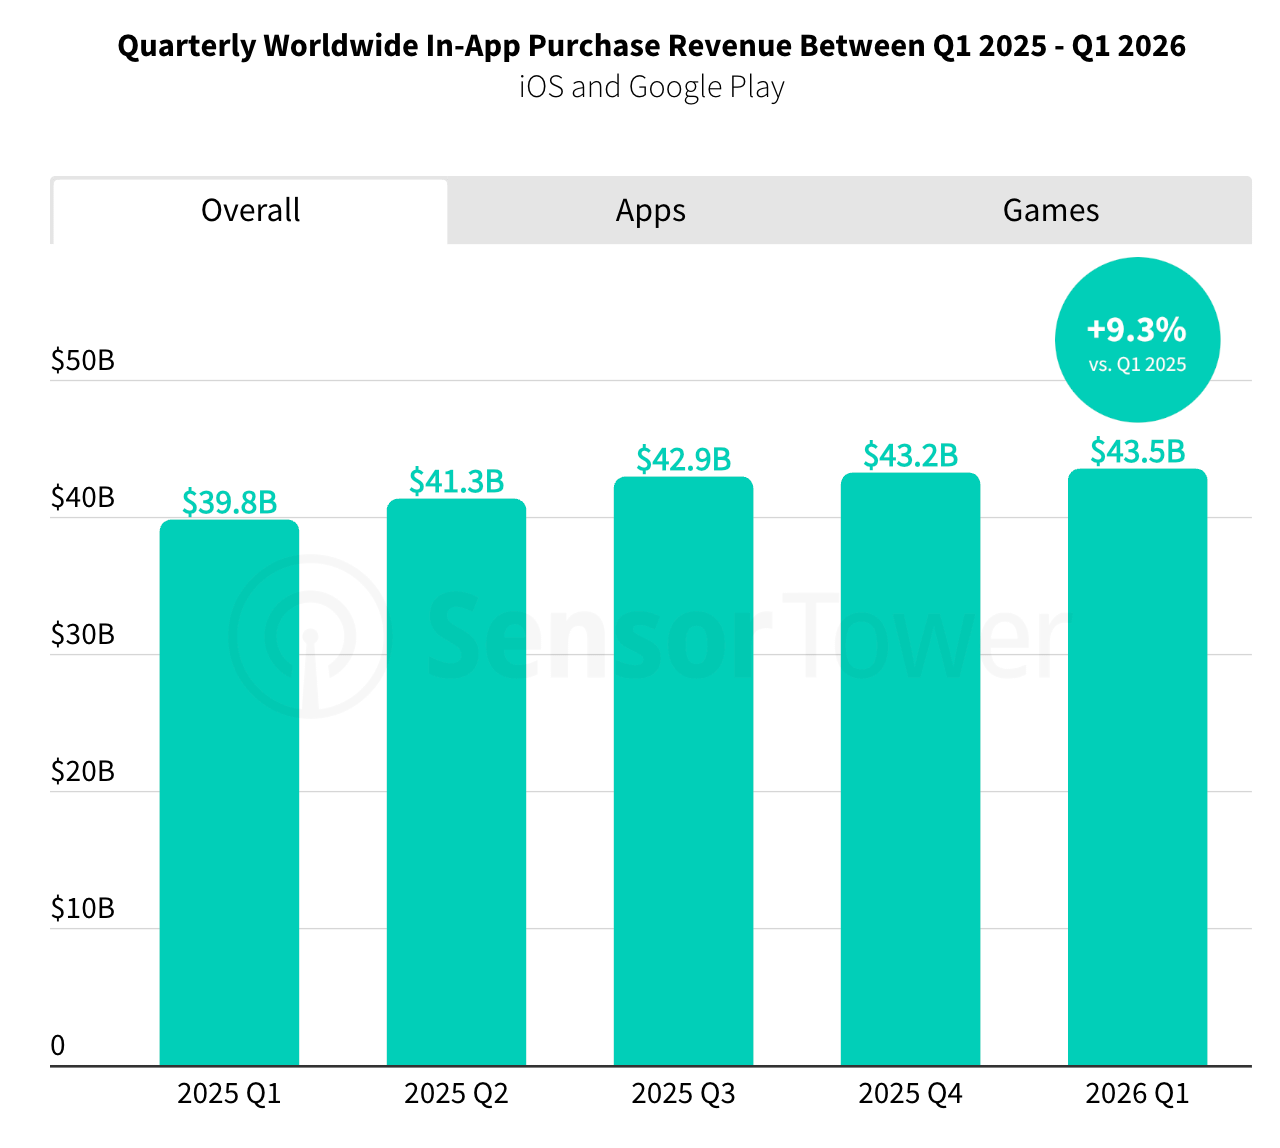
All of that growth, however, is coming from apps. In Q1’26, apps generated $23.1 billion (+17.9% YoY), while games brought in $20.4 billion (+0.5% YoY).


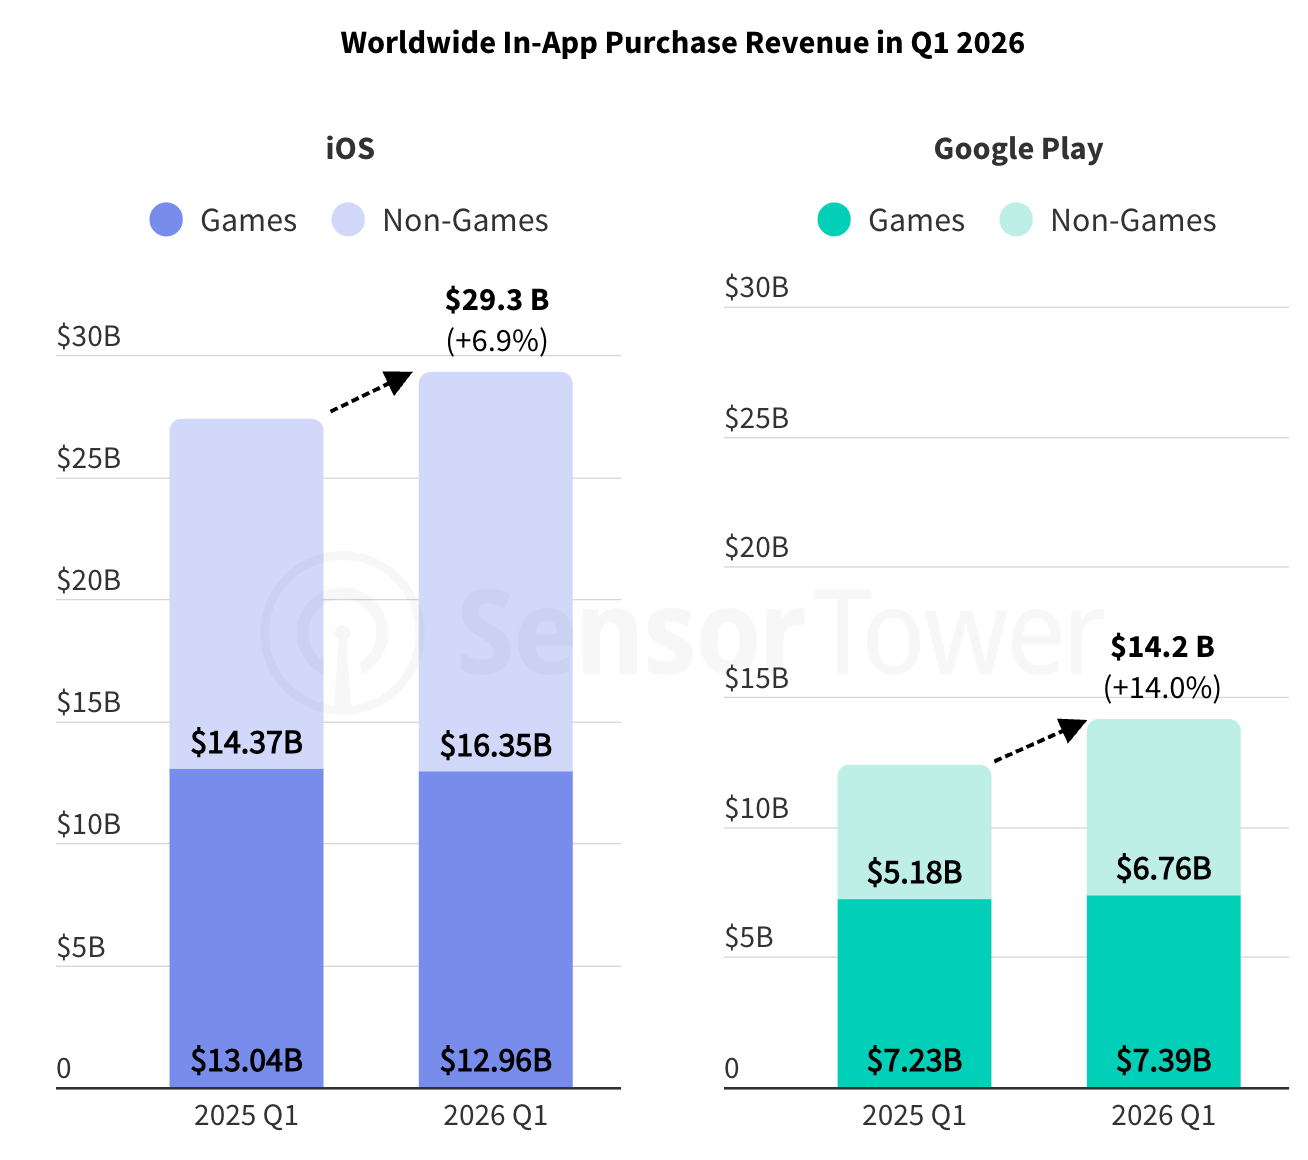
Google Play revenue is growing faster (+14% YoY) than iOS (+6.9% YoY). The picture is different for games specifically: iOS game revenue is falling YoY, while Google Play game revenue is edging up slightly.
A word from our sponsor

Still paying for impressions and clicks that never convert? Advertise your PC game with PWN Games! With our CPA model, you only pay when a player installs, engages, or pays. 250+ PC games promoted, 42M+ players acquired, 10 years in the business. Trusted by top PC game publishers worldwide.
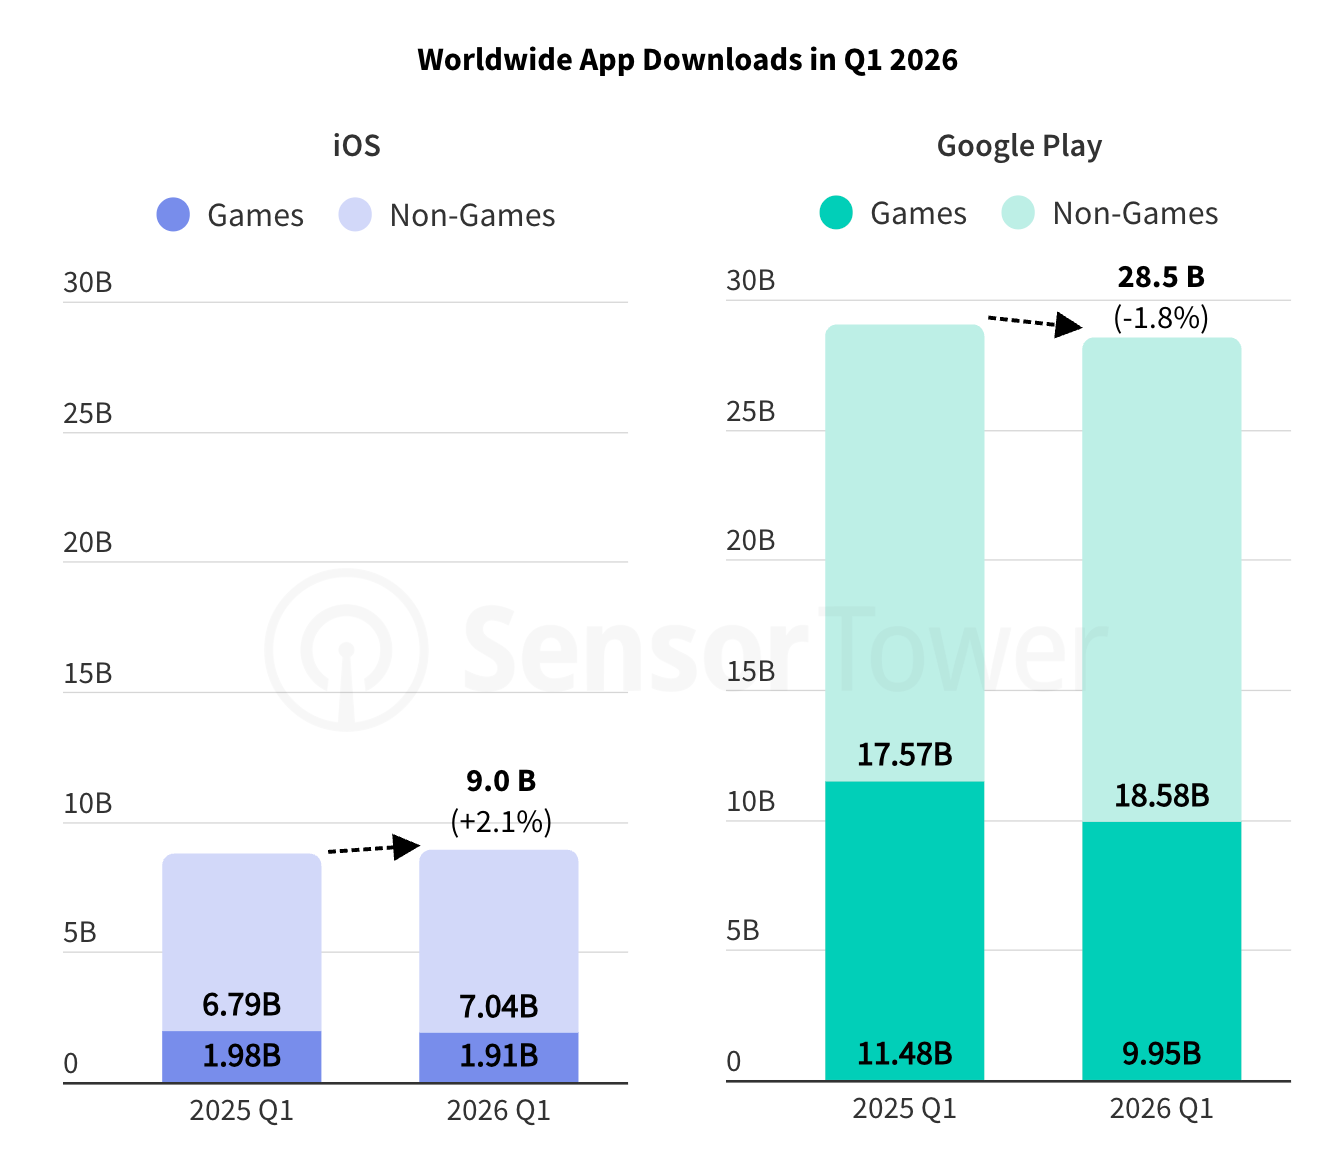
Downloads in Q1’26 fell 0.8% YoY to 37.5 billion.
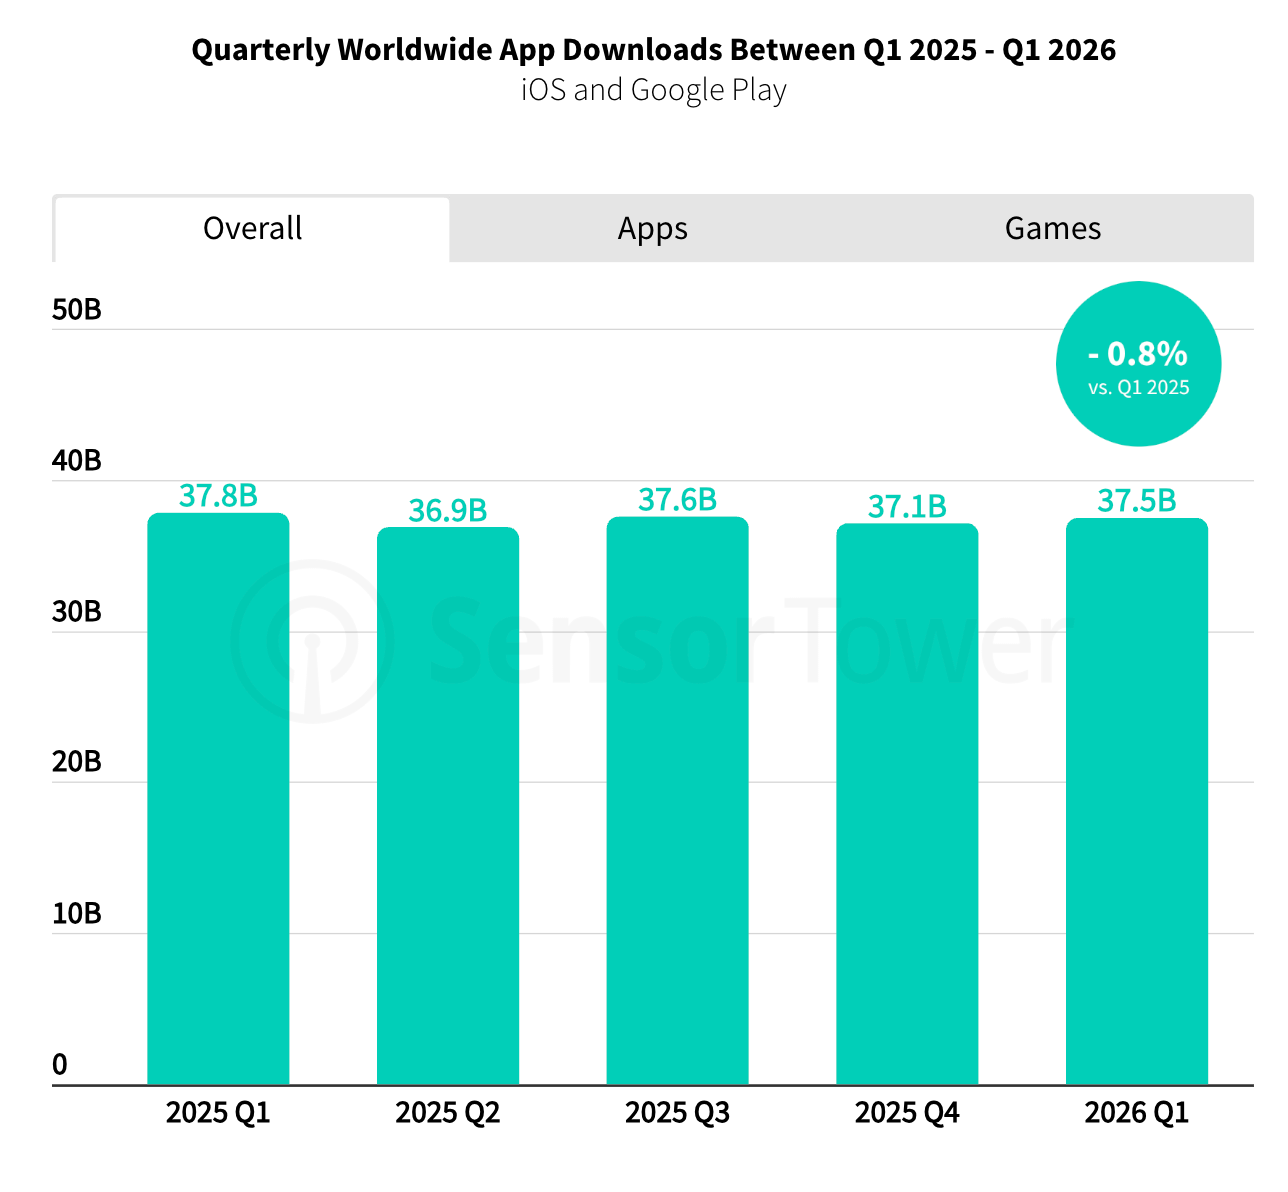
Apps grew 4.9% in Q1’26 (25.6 billion installs), but could not offset the 11.9% YoY decline in game installs (11.9 billion).


Google Play declined by 1.5B downloads. The drop on iOS was far more modest in absolute numbers.
Key Mobile Markets
The US gaming market grew 3% YoY. However, Sensor Tower analysts note that Q1’26 is the second consecutive quarter of declining US revenue, the first time this has happened since Q3-Q4 2020.
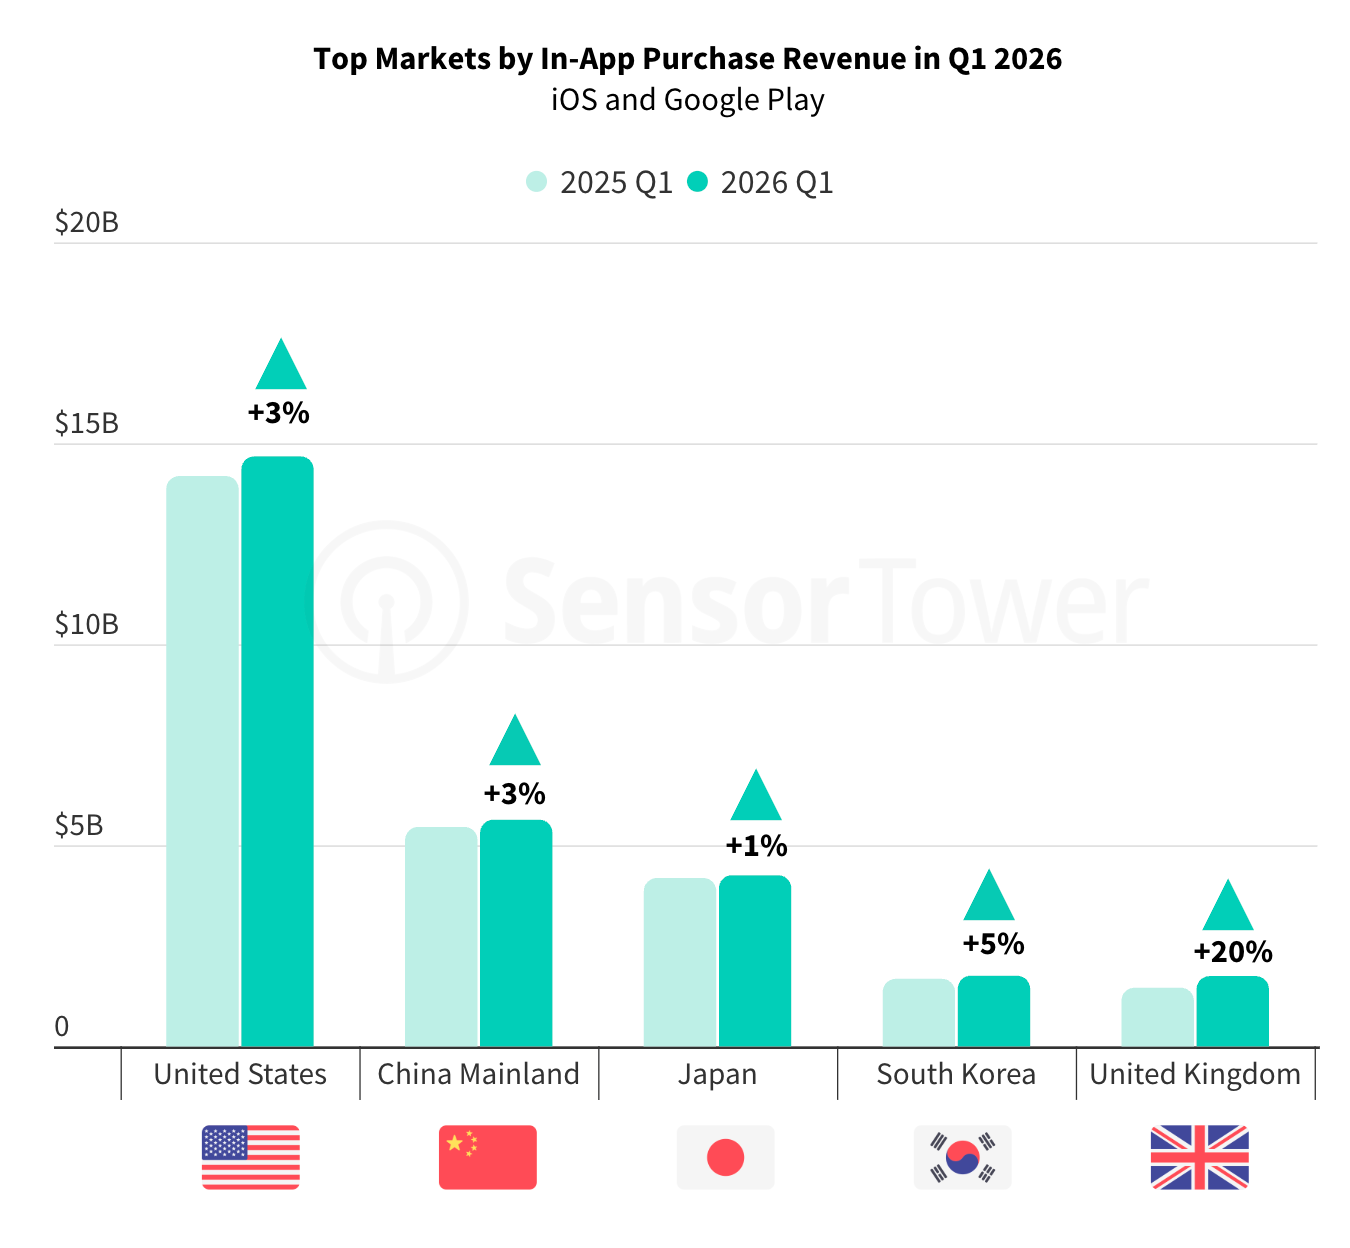
European markets are seeing solid growth (not visible on the chart), with UK revenue up 20% YoY in particular.
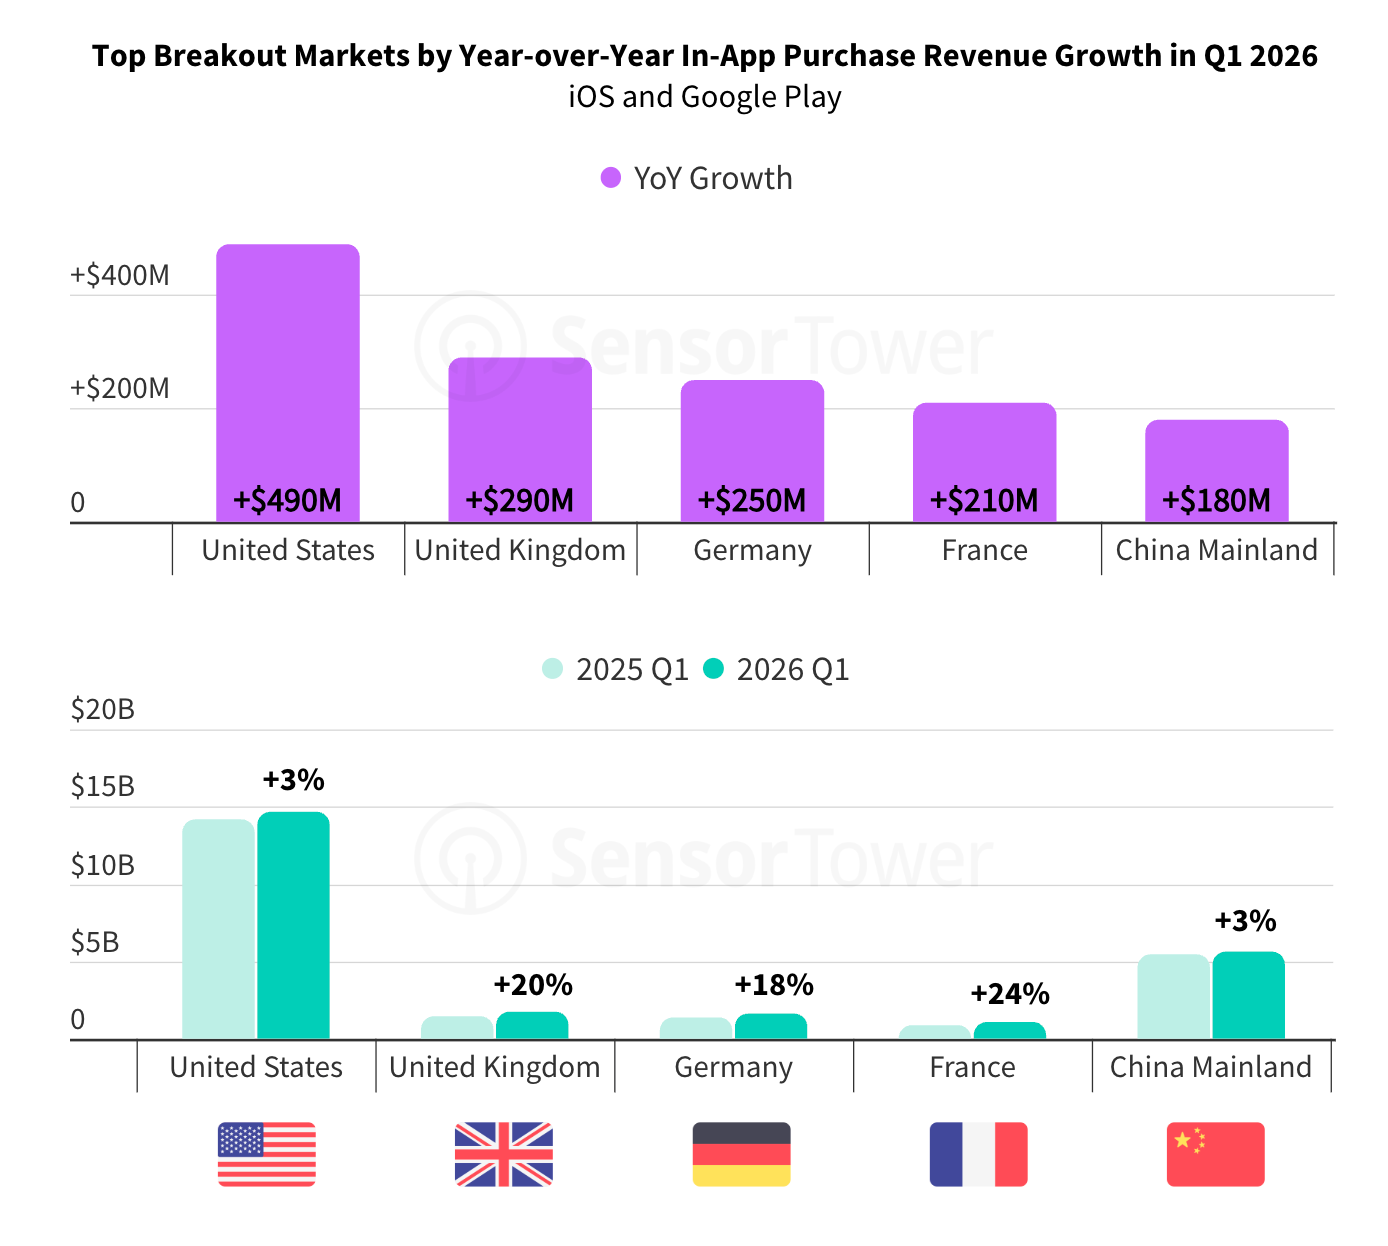
That said, given the size of the US market, a 3% gain there outweighs a 20% gain in the UK in absolute terms. The US is not a market to write off.
❗️China numbers are covering iOS only because Sensor Tower doesn’t count local Android app stores.
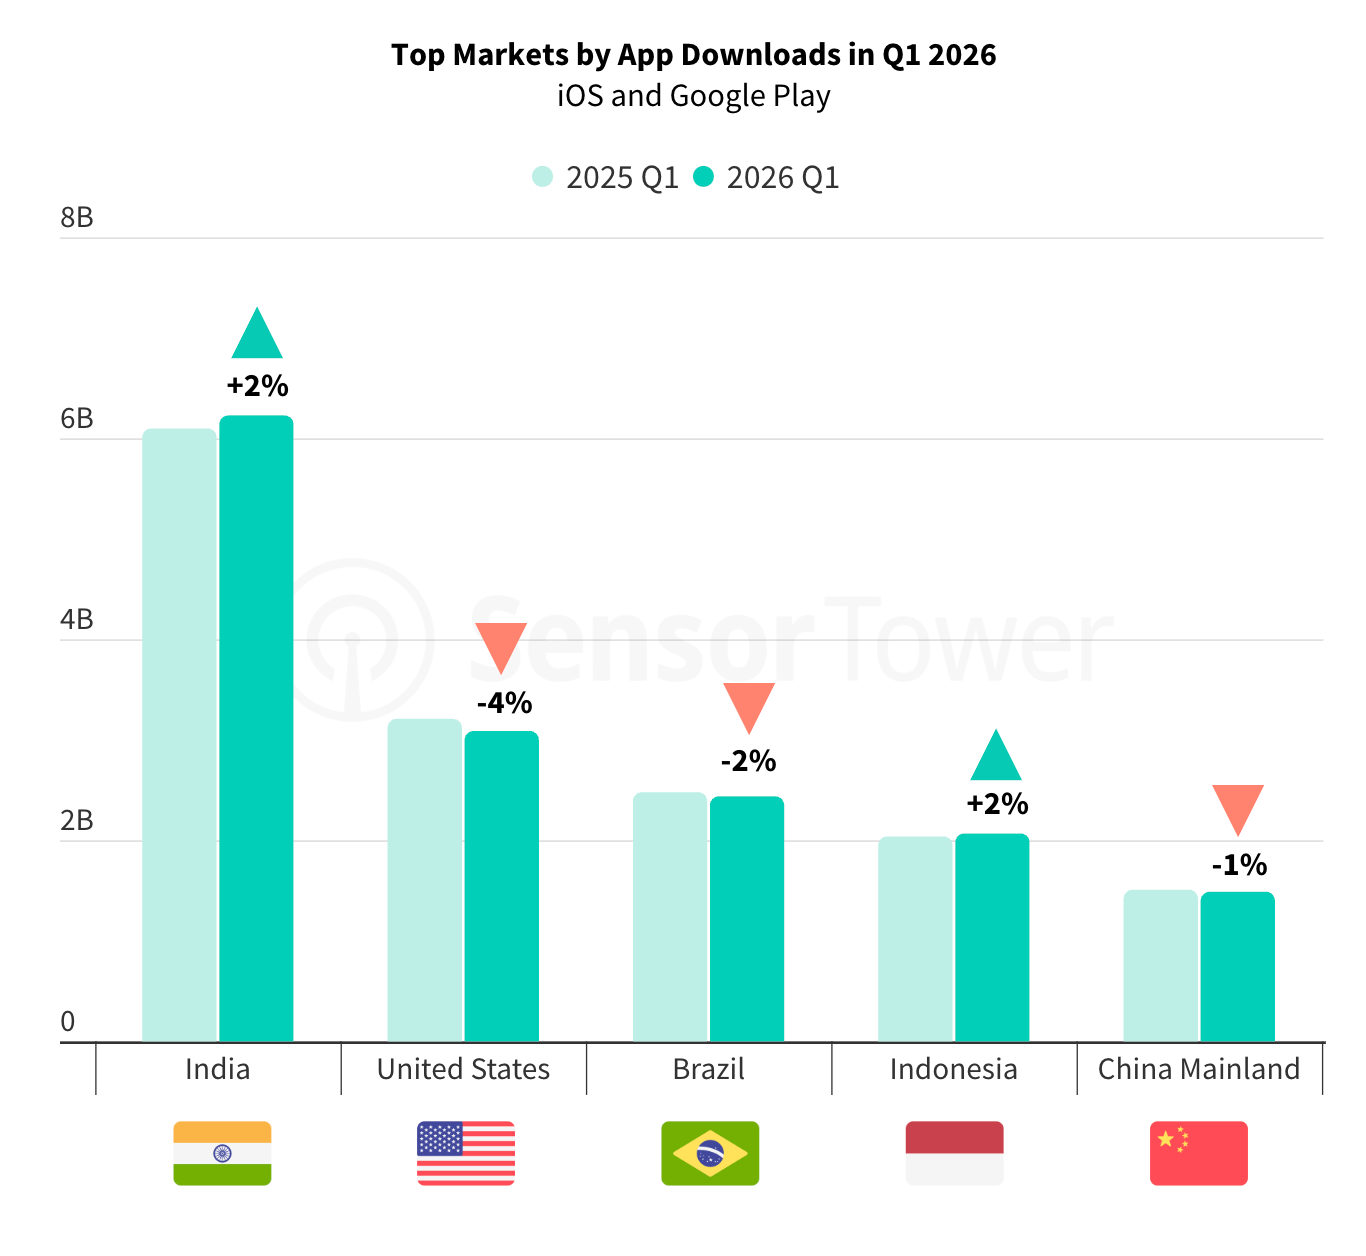
India, the US, and Brazil lead downloads in Q1’26. Only India and Indonesia posted growth, and by just a couple of percentage points.
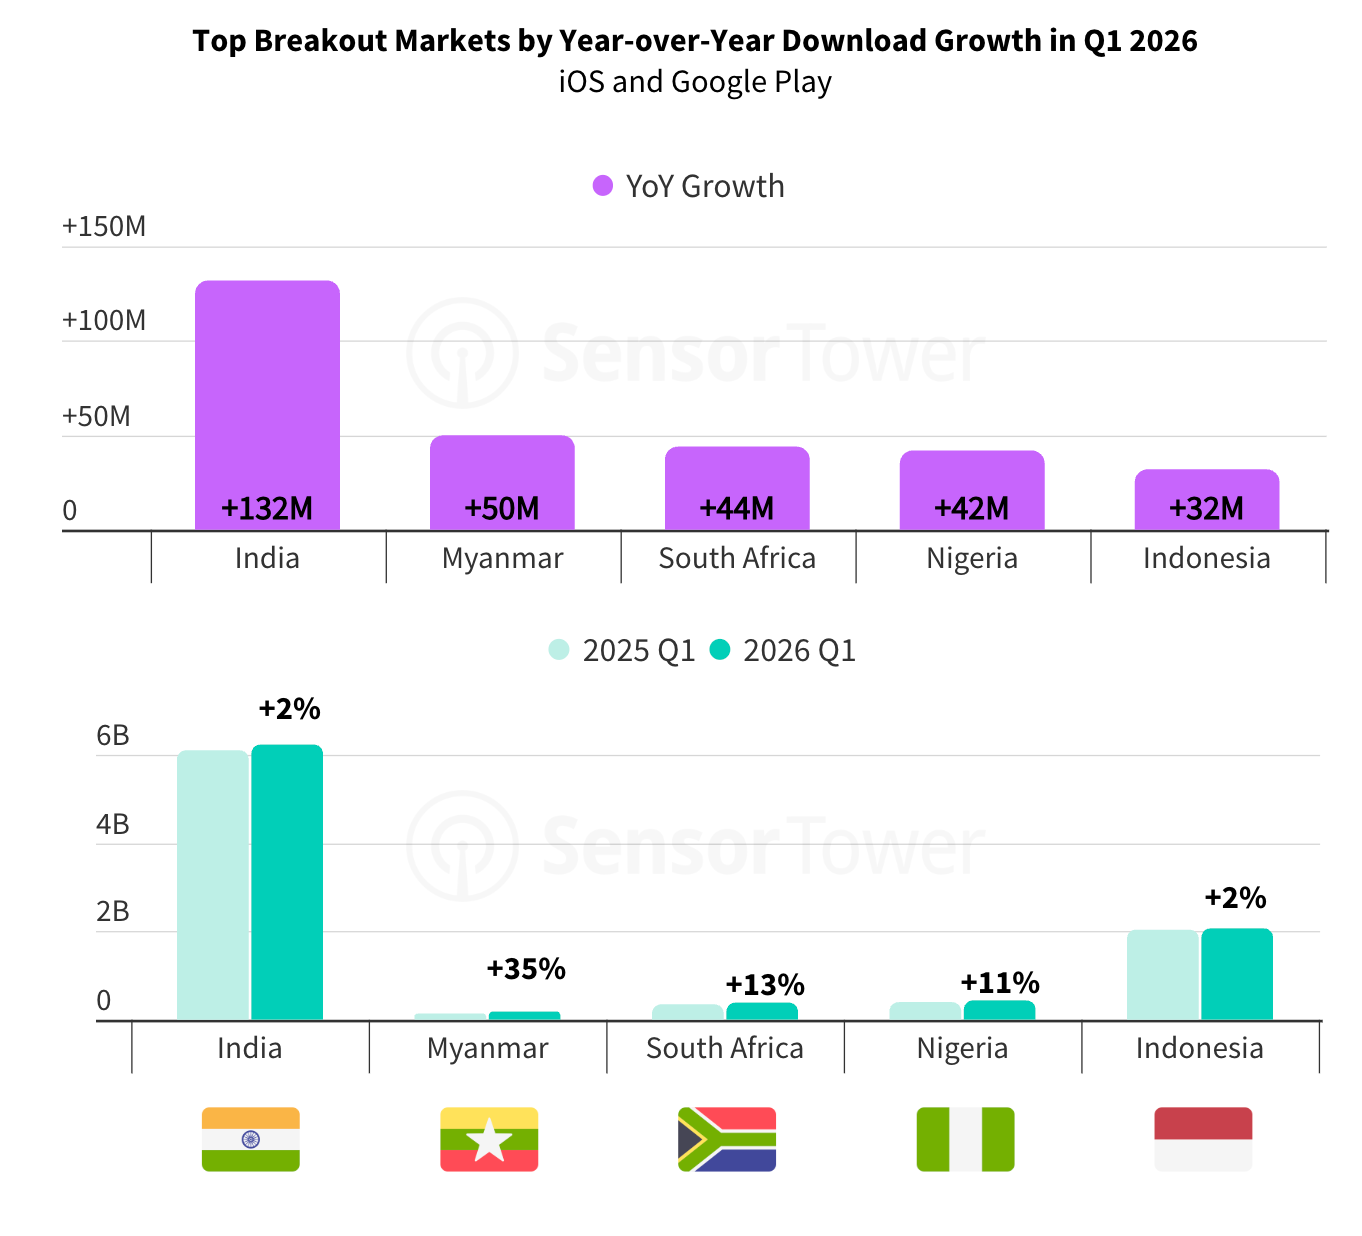
African countries are posting strong download growth. Worth noting that these figures cover all apps, not games only.
Key Categories in Q1 2026: Game Genres and Non-Gaming Apps
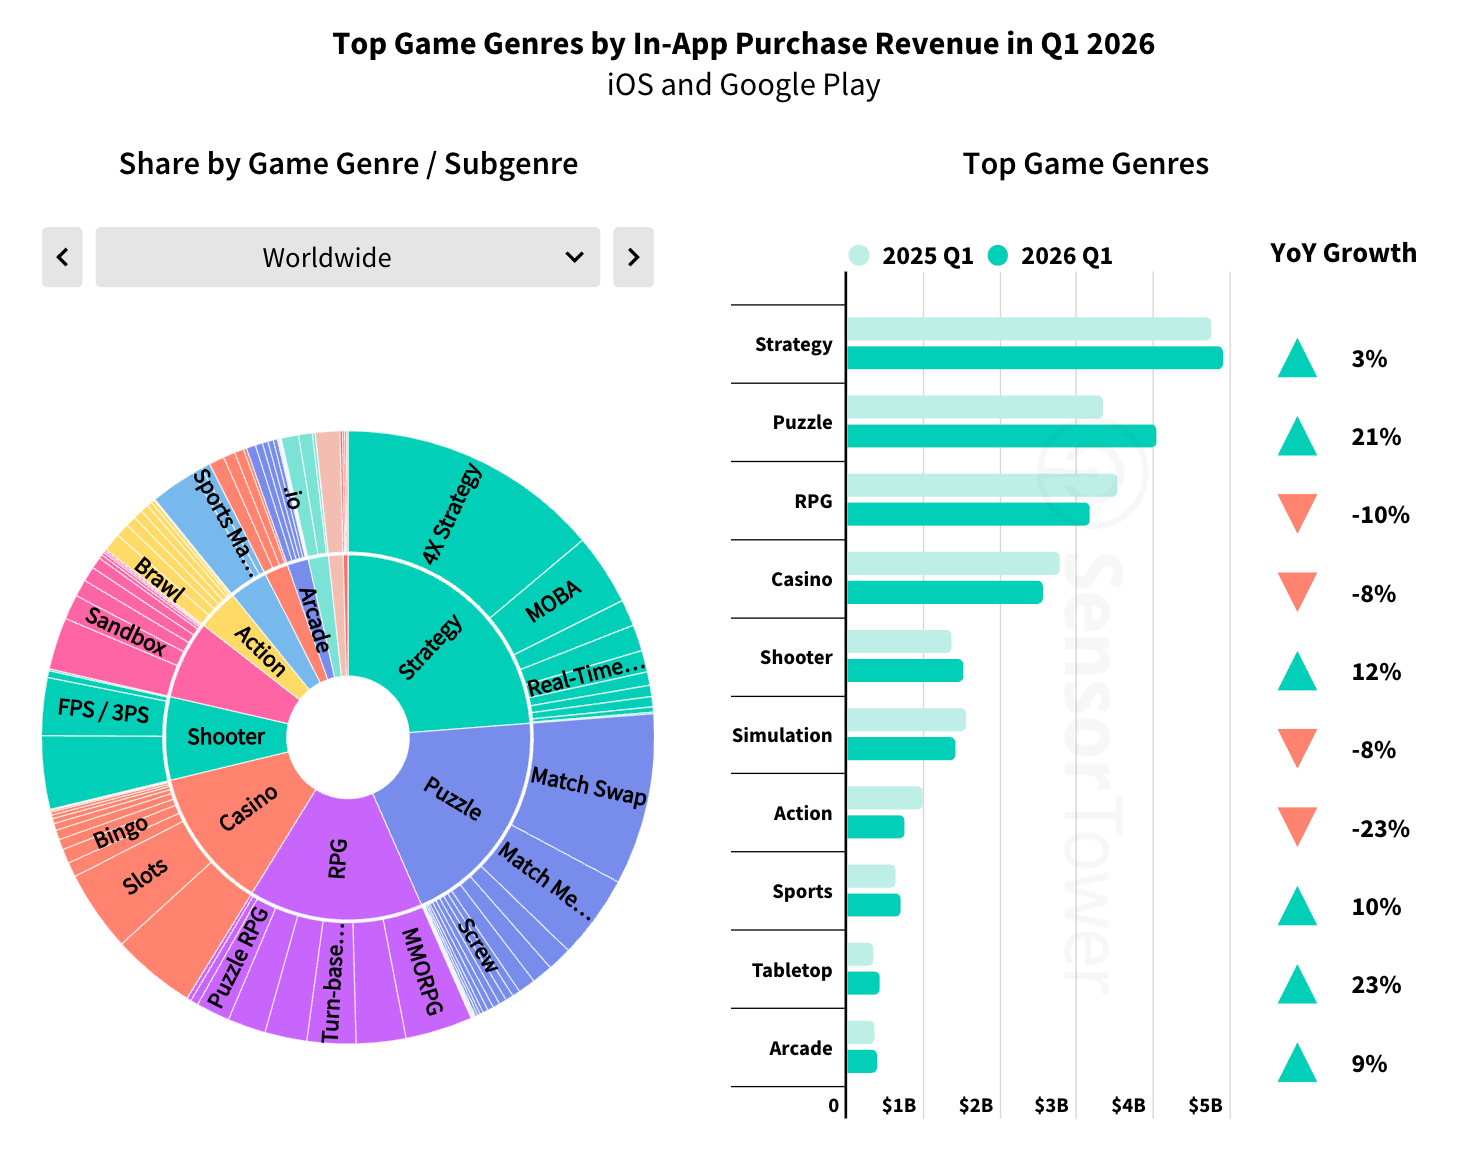
The strongest revenue growth in Q1’26 came from board games (+23% YoY), puzzles (+21% YoY, also one of the largest categories by revenue), and shooters (+12% YoY).
Puzzle growth was driven by Gossip Harbor, Tasty Travels, and Pixel Flow.
Action, RPG, and casino continue to decline in revenue.
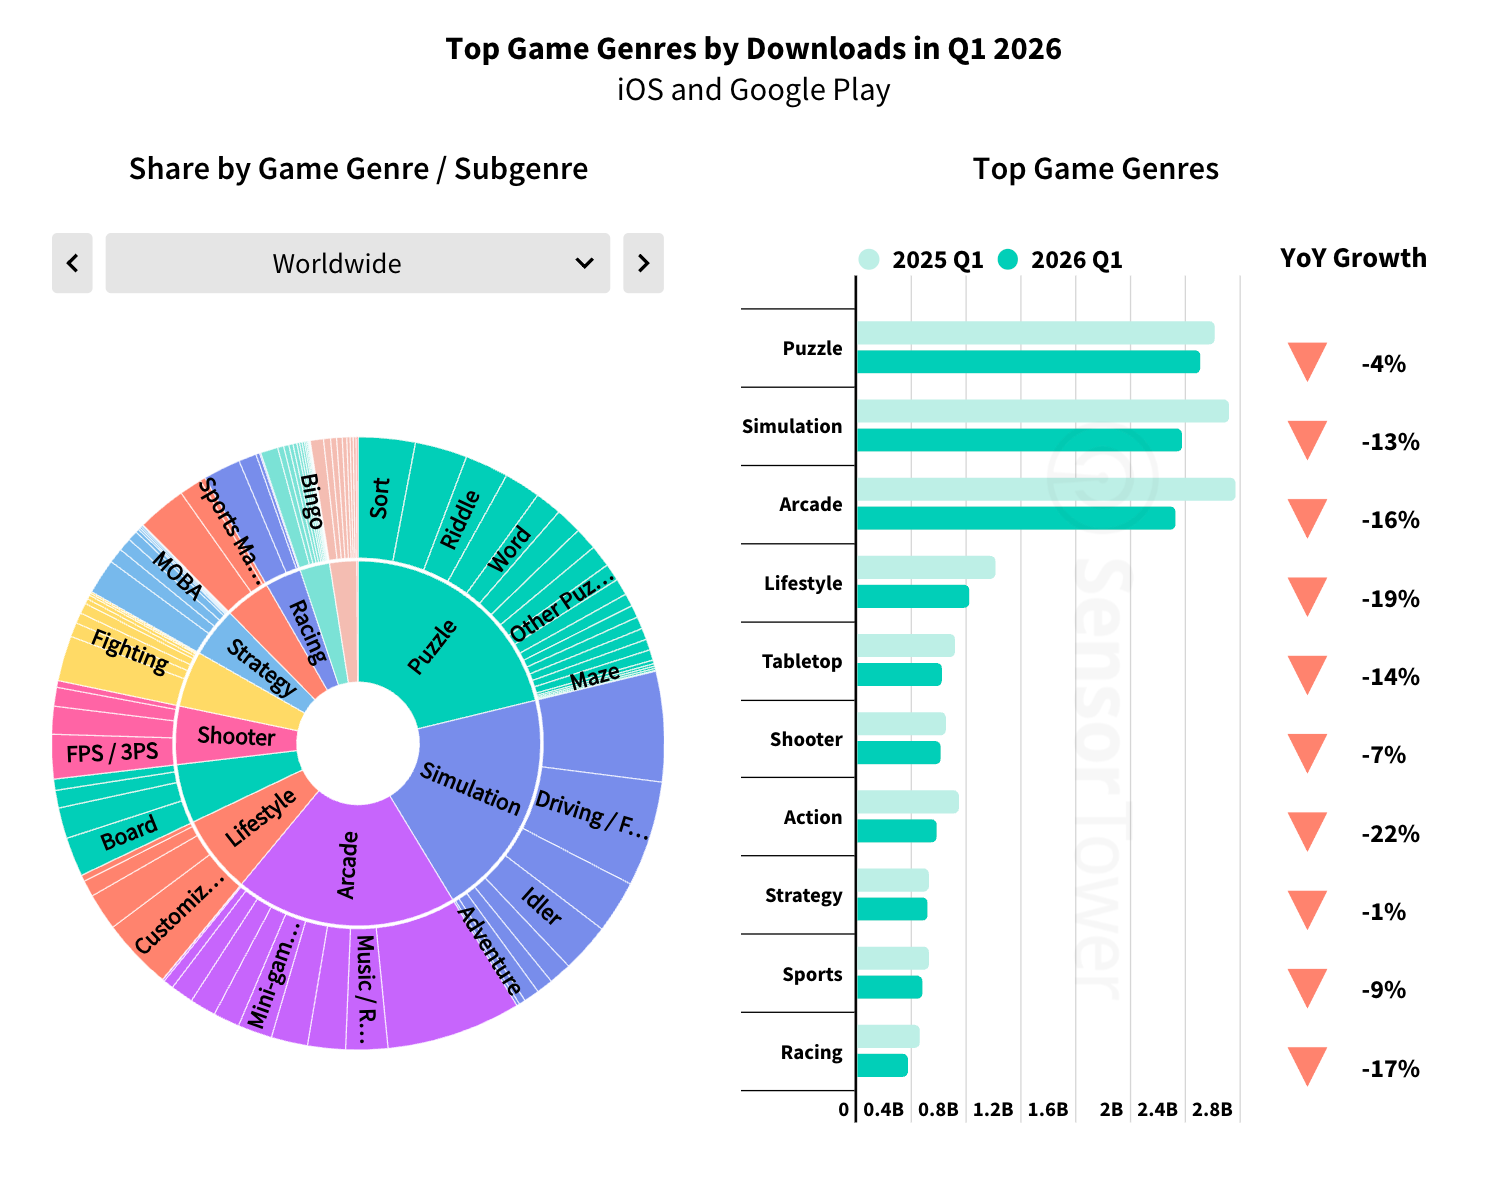
The picture of downloads charts is bleak across the board. Everything is falling. Strategy and puzzles are holding up better than others.
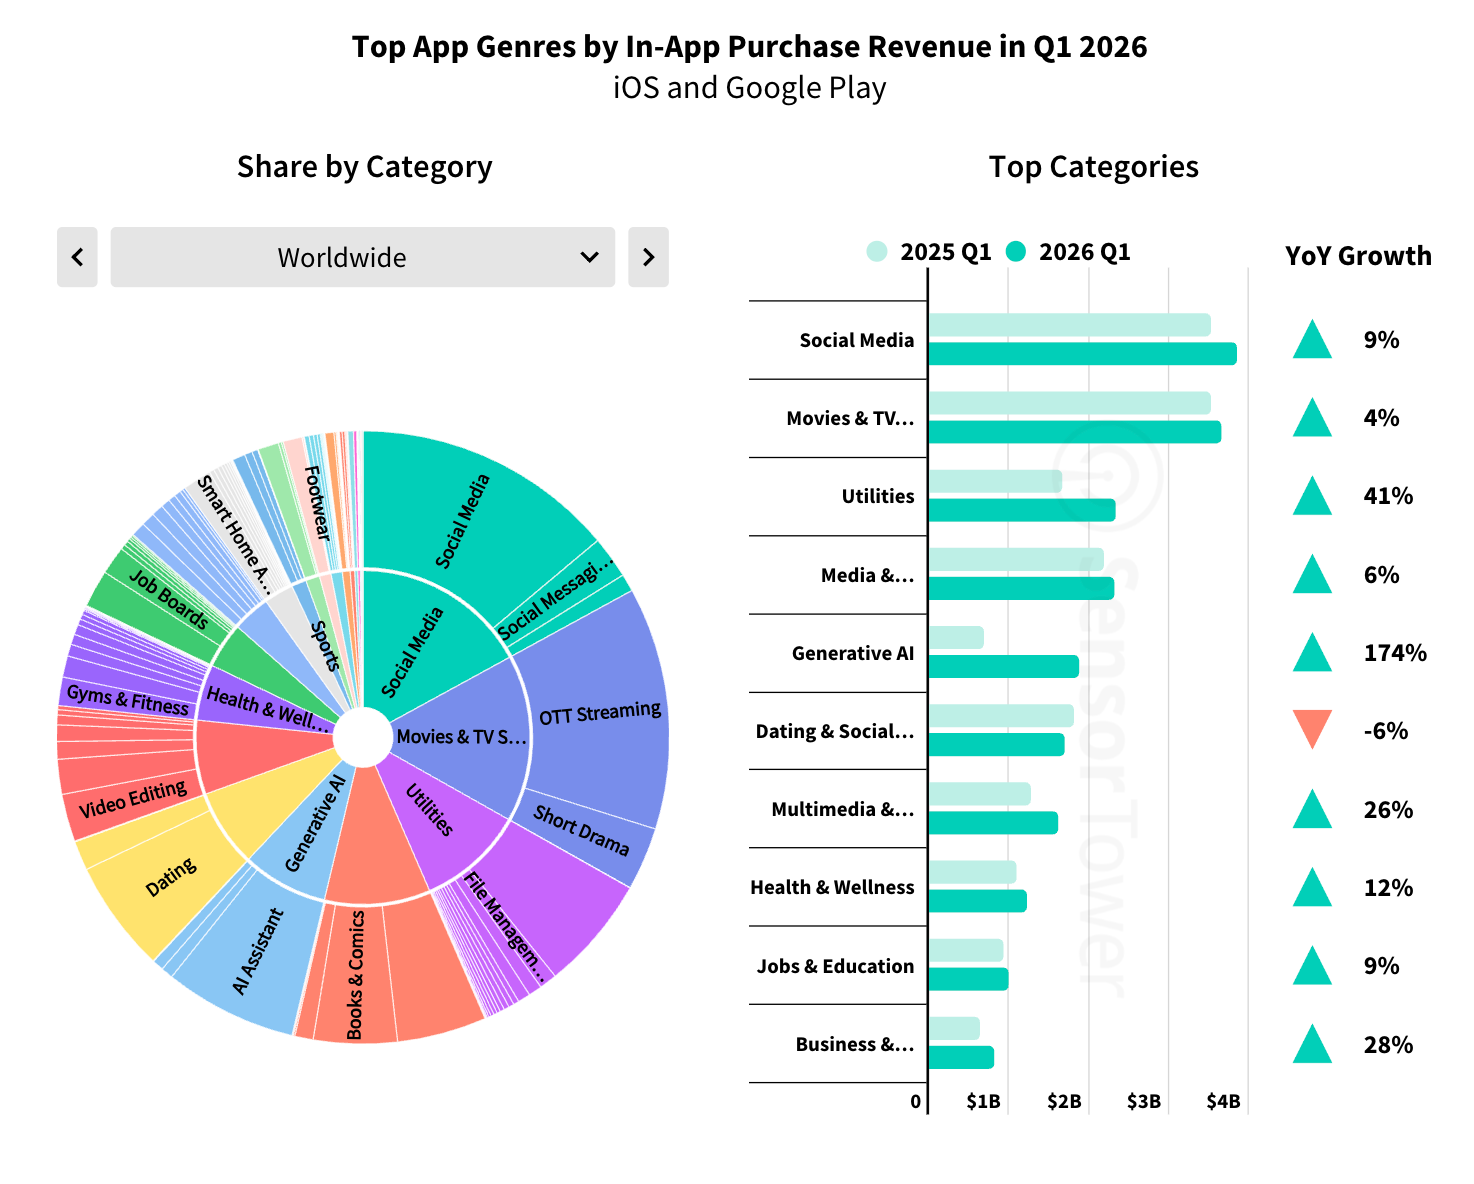
Generative AI apps are posting strong growth, with revenue up 174% year over year.
The segment also leads in downloads, though by a smaller margin. Video streaming apps are close behind.
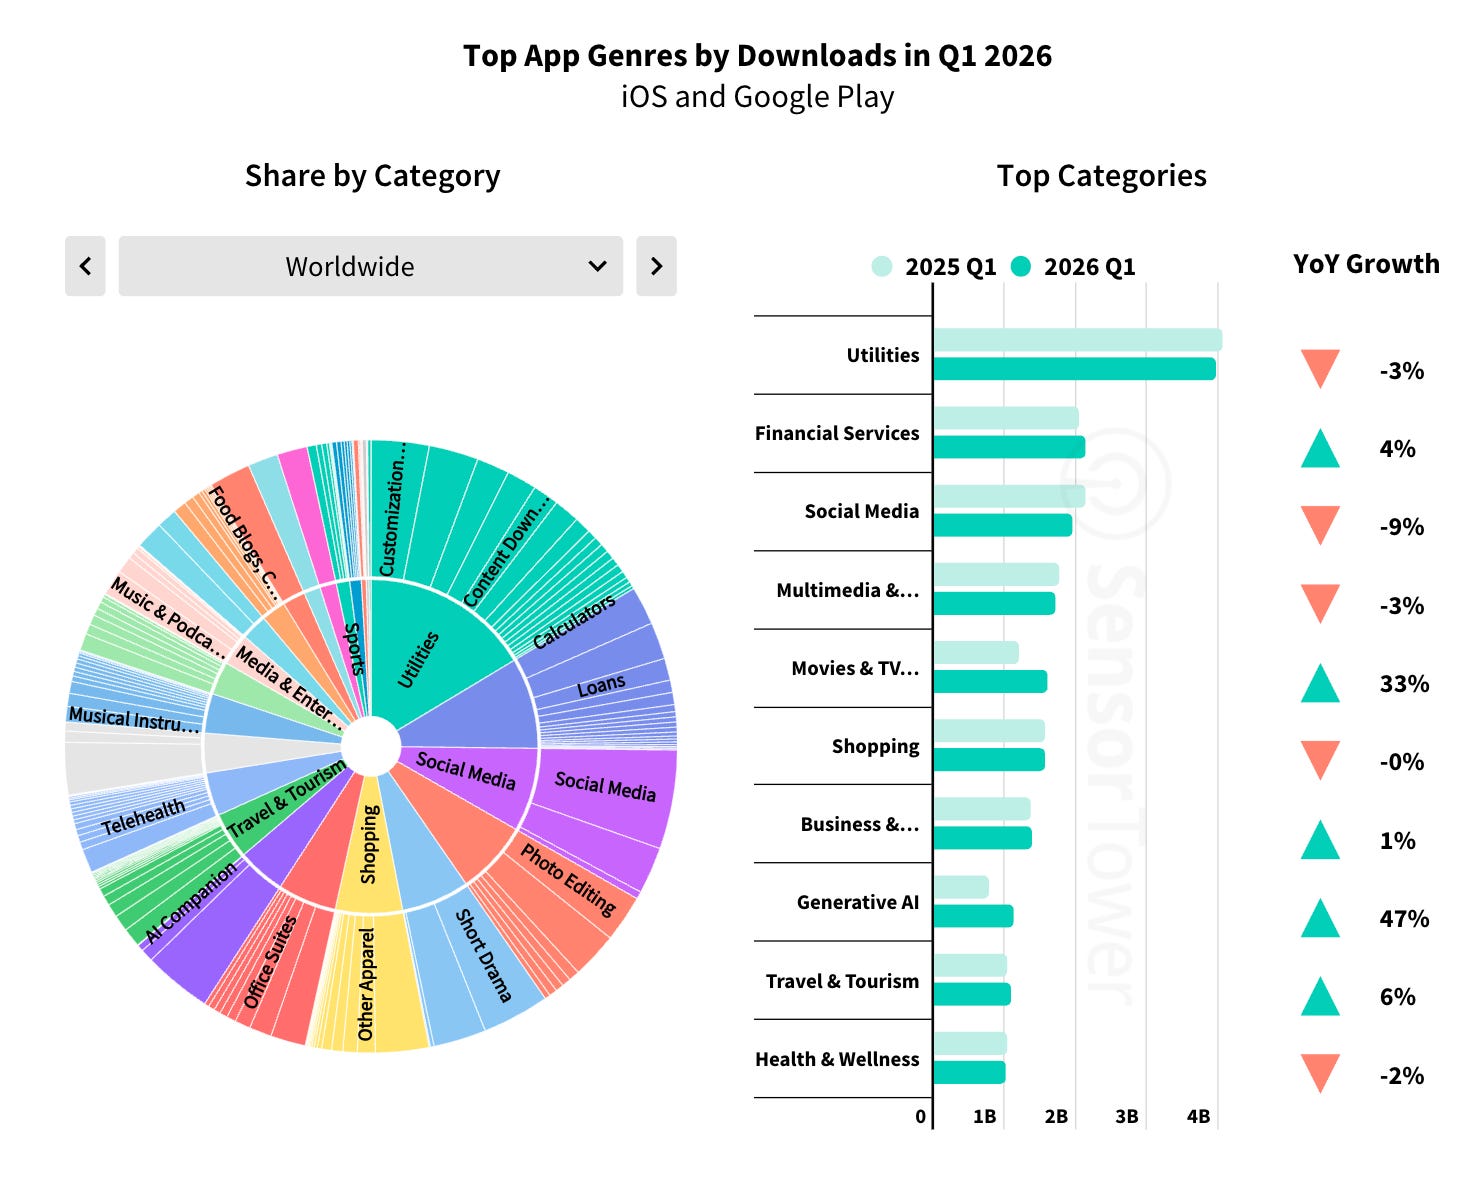
Sensor Tower highlights that the slowdown in AI app download growth may reflect a growing share of users who have already downloaded such apps.
A word from our sponsor
Still paying for impressions and clicks that never convert? Advertise your PC game with PWN Games! With our CPA model, you only pay when a player installs, engages, or pays. 250+ PC games promoted, 42M+ players acquired, 10 years in the business. Trusted by top PC game publishers worldwide.
Top Games in Q1 2026
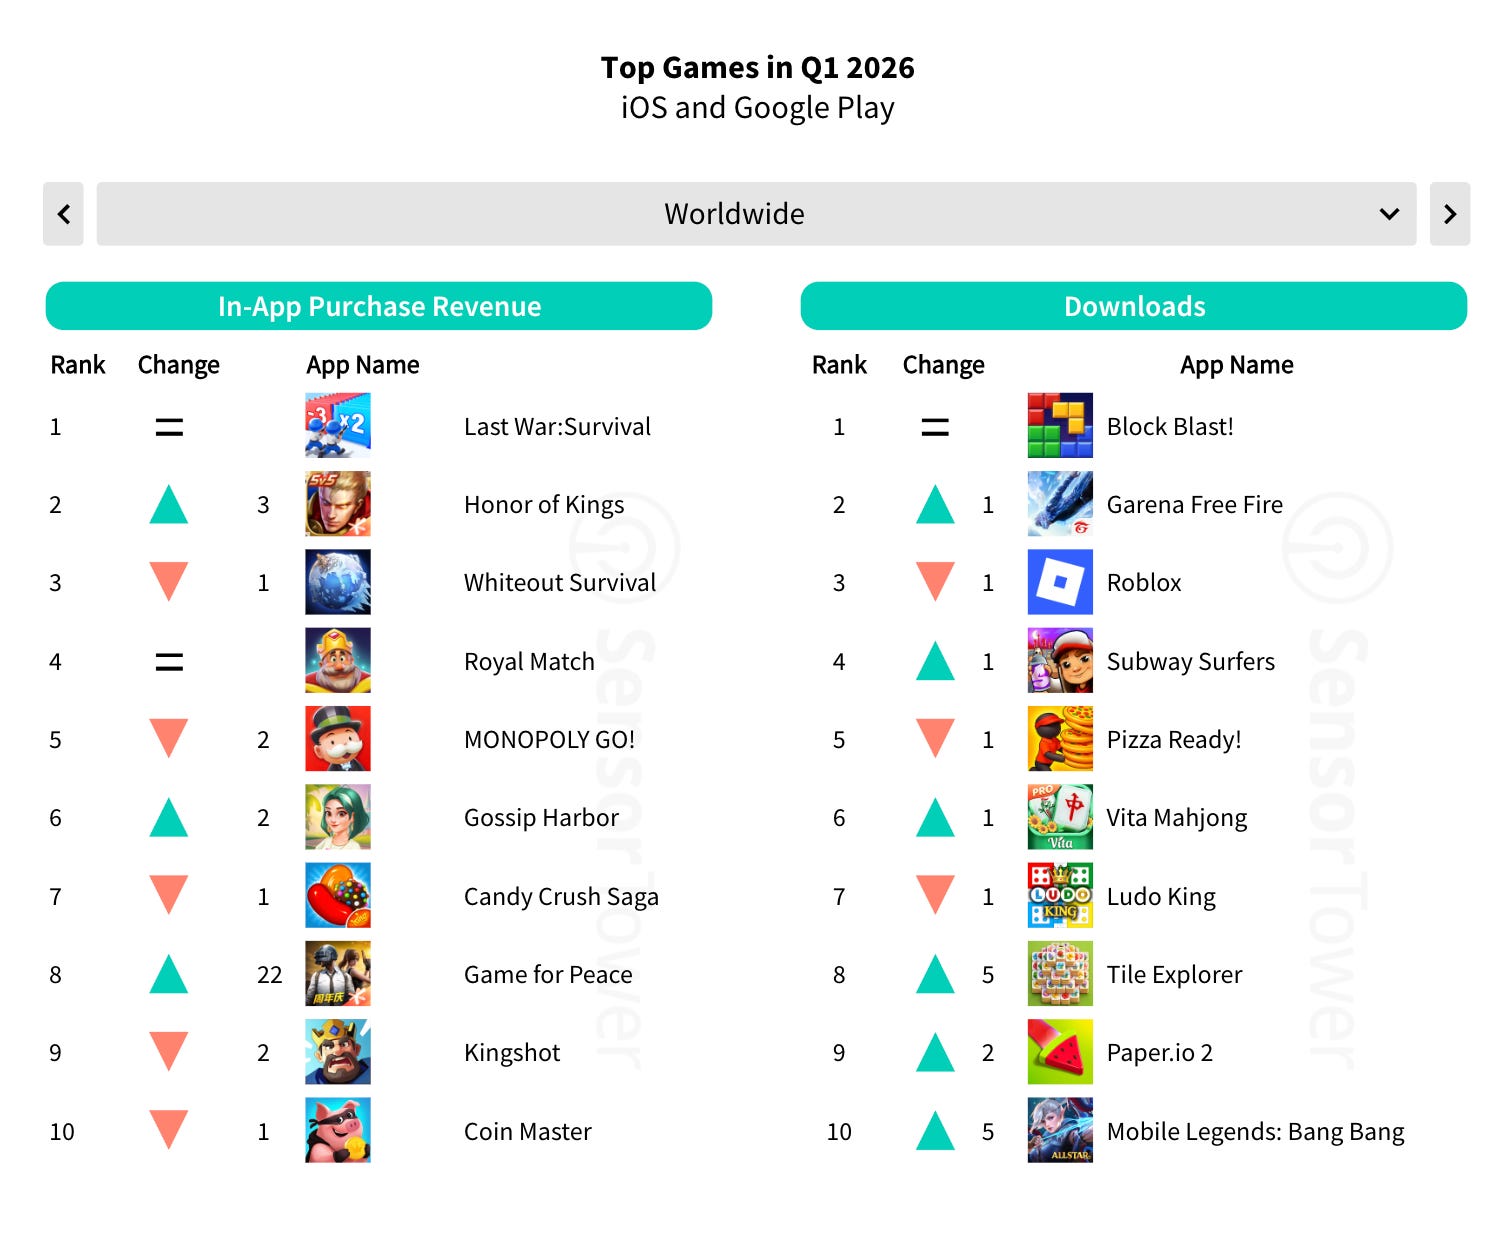
Last War: Survival, Honor of Kings, and Whiteout Survival led Q1 2026 by revenue. The only new entrant in the top 10 was Game for Peace (the Chinese version of PUBG).
The top two titles by revenue each exceeded $500 million for the quarter.
Block Blast! continues to hold the top spot in downloads, marking its second consecutive quarter at number one.
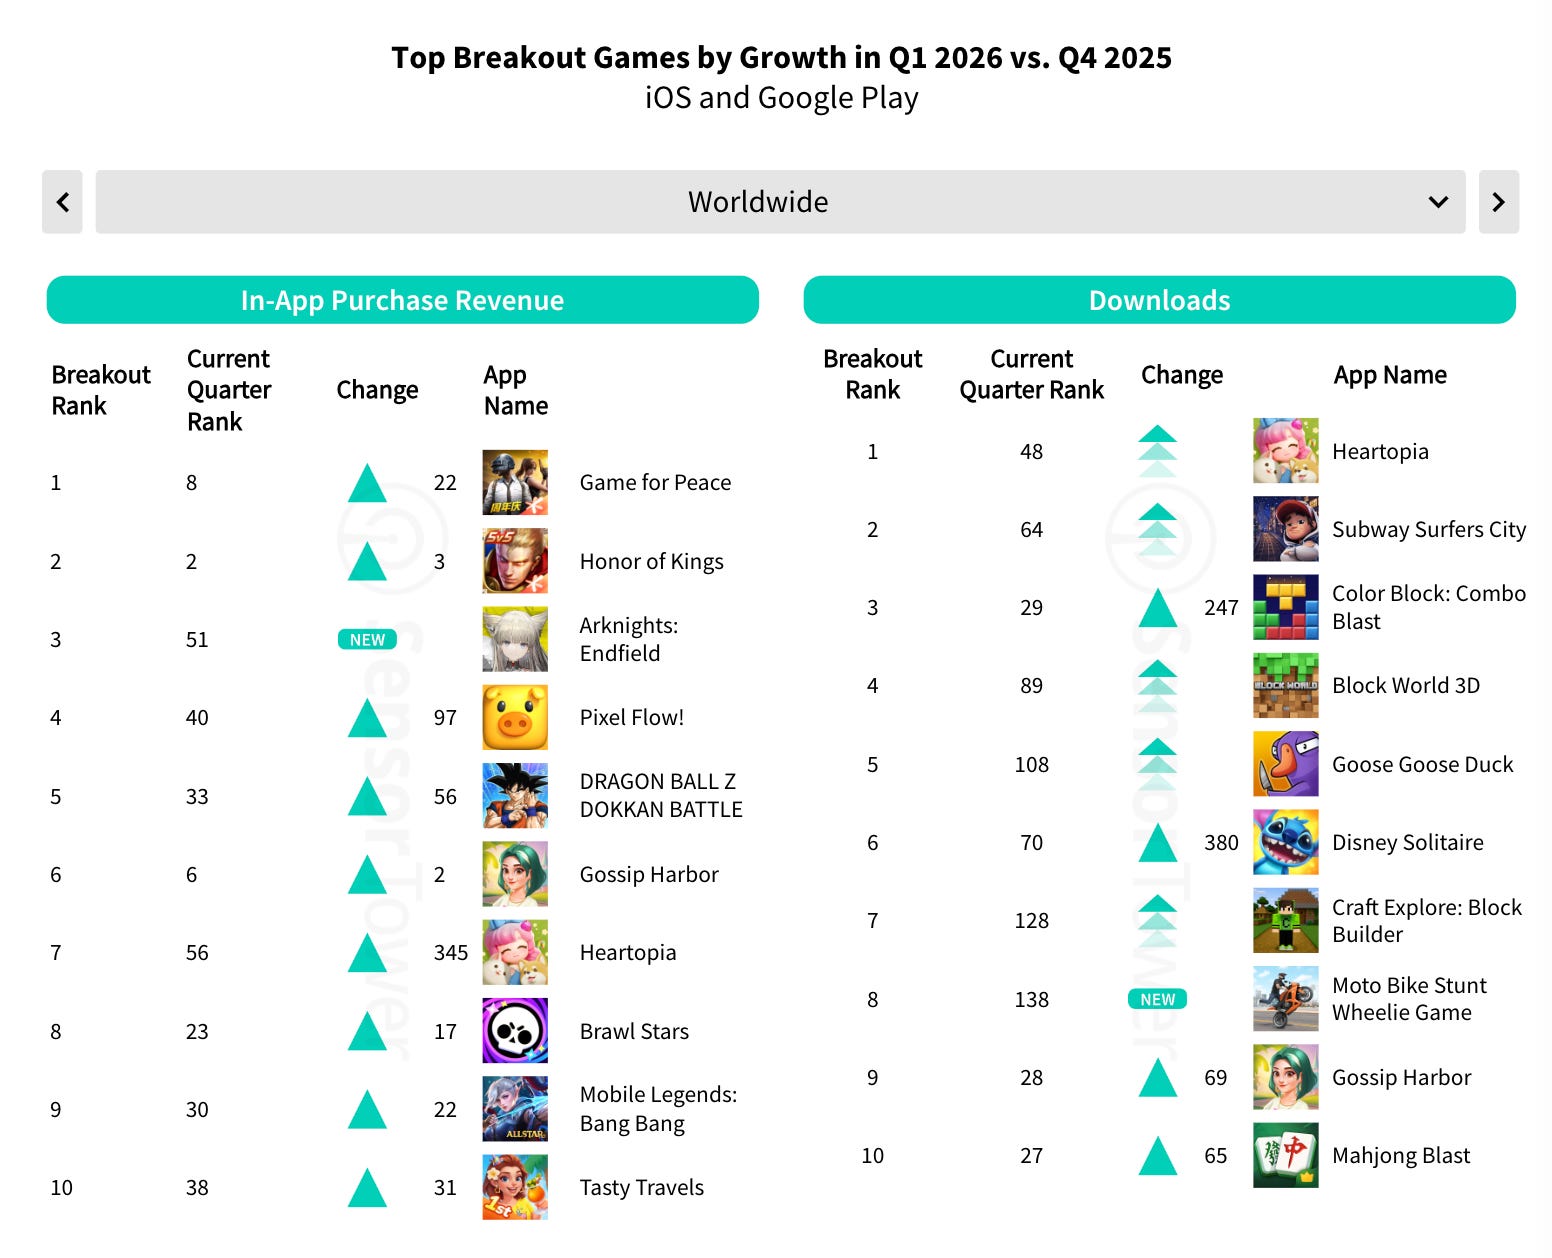
Among the top revenue growth leaders in Q1’26, 7 are Chinese companies. The exceptions: Pixel Flow (Turkey), Dragon Ball Z Dokkan Battle (Japan), and Brawl Stars (Finland).
In download growth, the leaders are Heartopia (which also appeared in the revenue growth chart), Subway Surfers City, and Color Block: Combo Blast (this is NOT Block Blast! and is listed under a different publisher).
Digital Marketing Trends in Q1’26
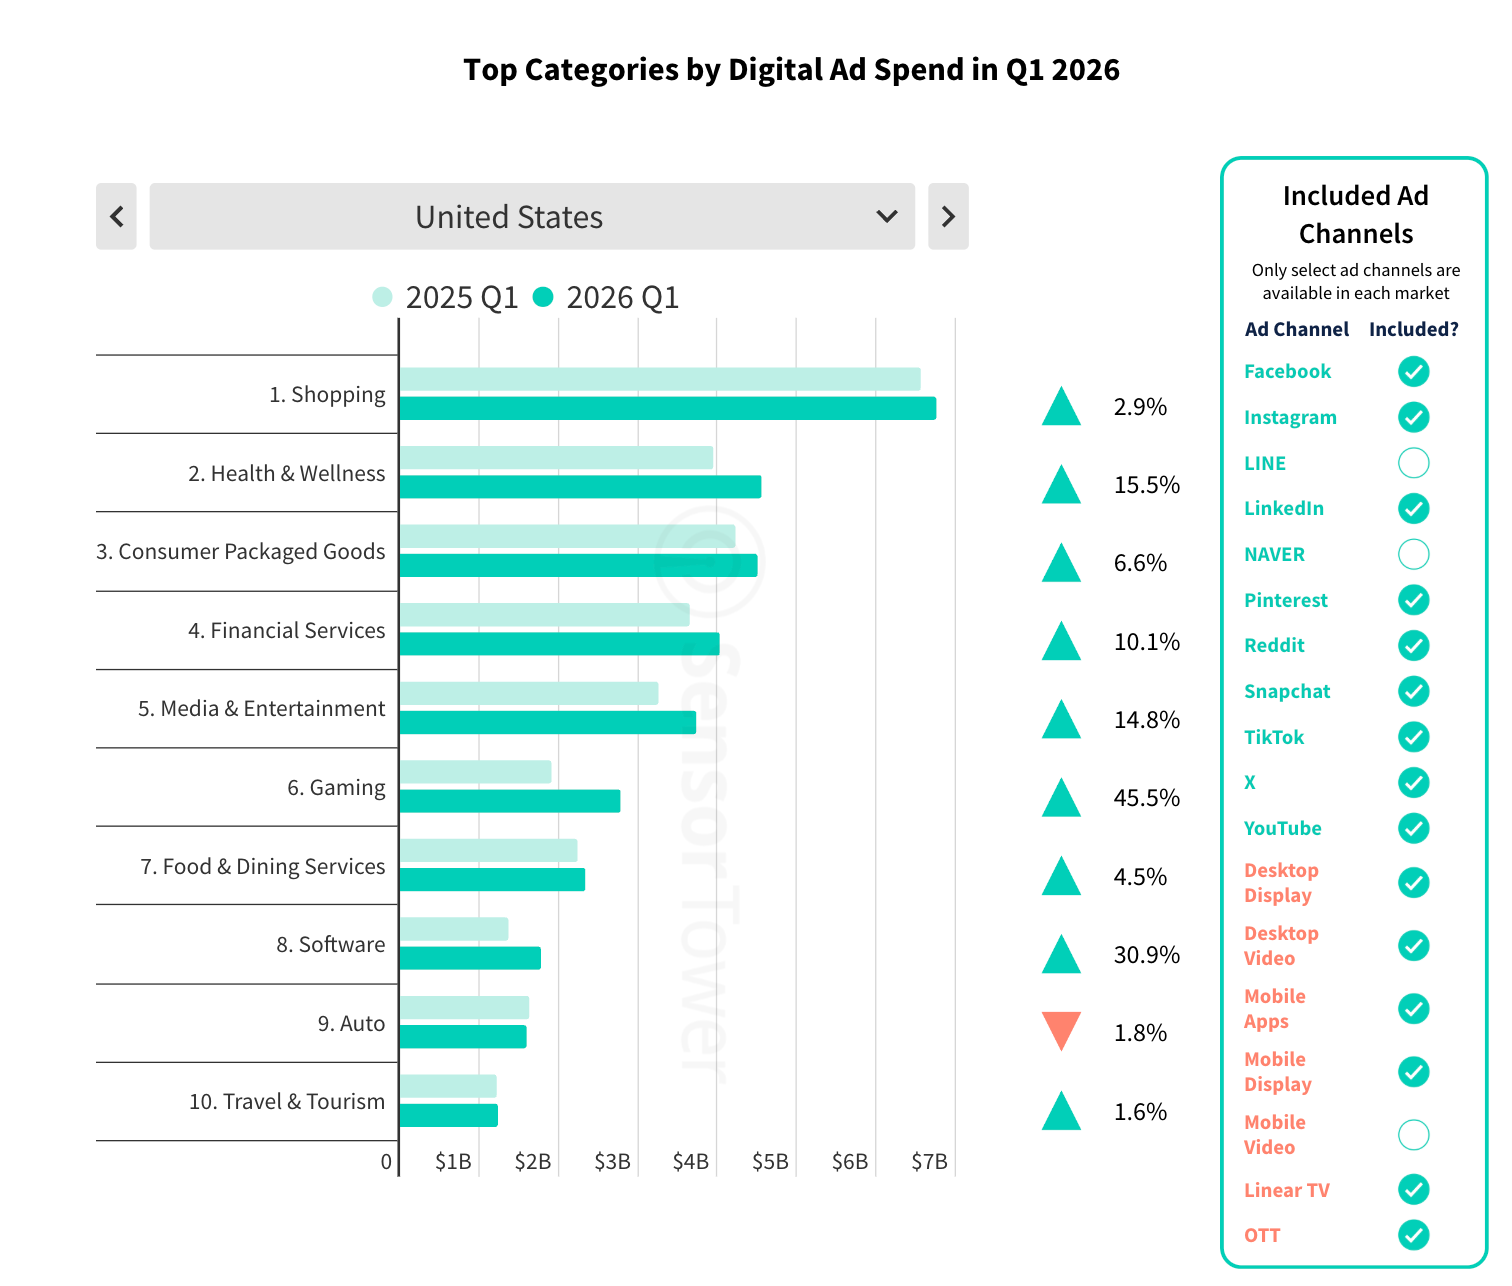
Digital marketing spend in the US in Q1’26 reached $48 billion, up 15.4% versus Q1’25.
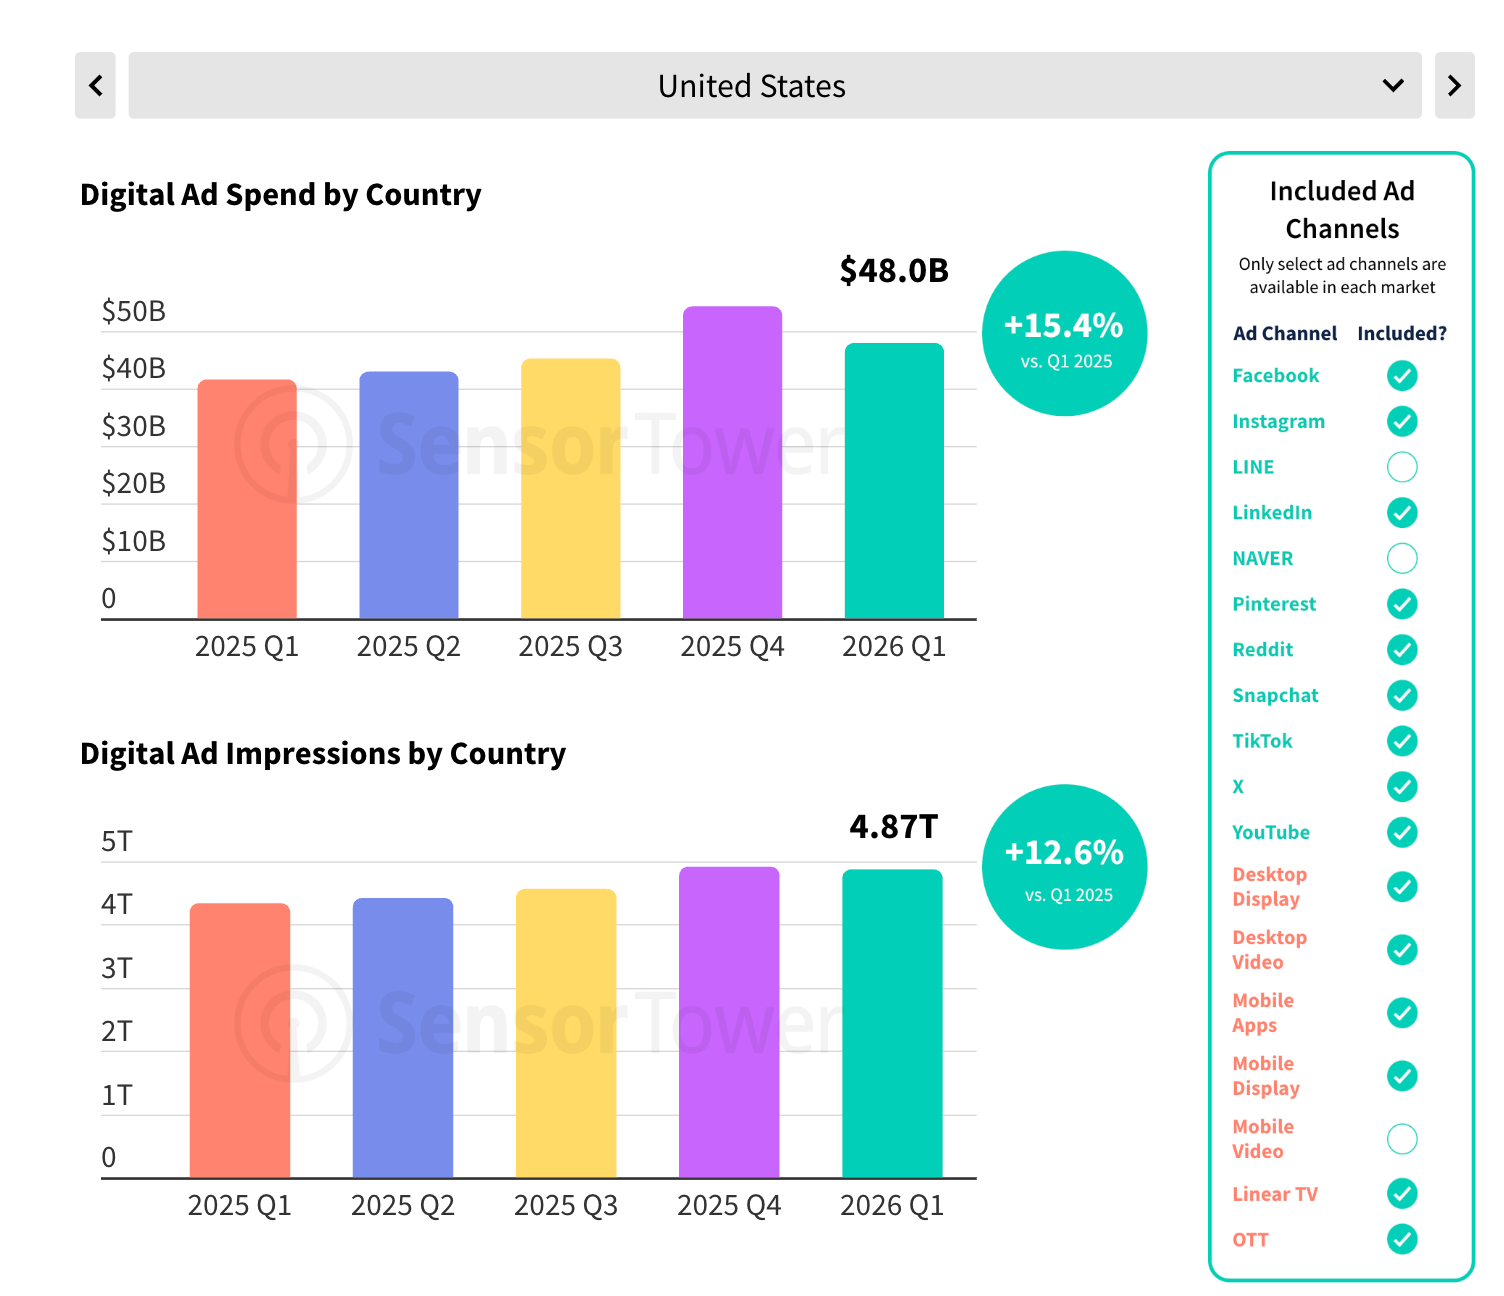
Games rank 6th by marketing spend. US advertisers' spending on games grew 45.5% YoY.
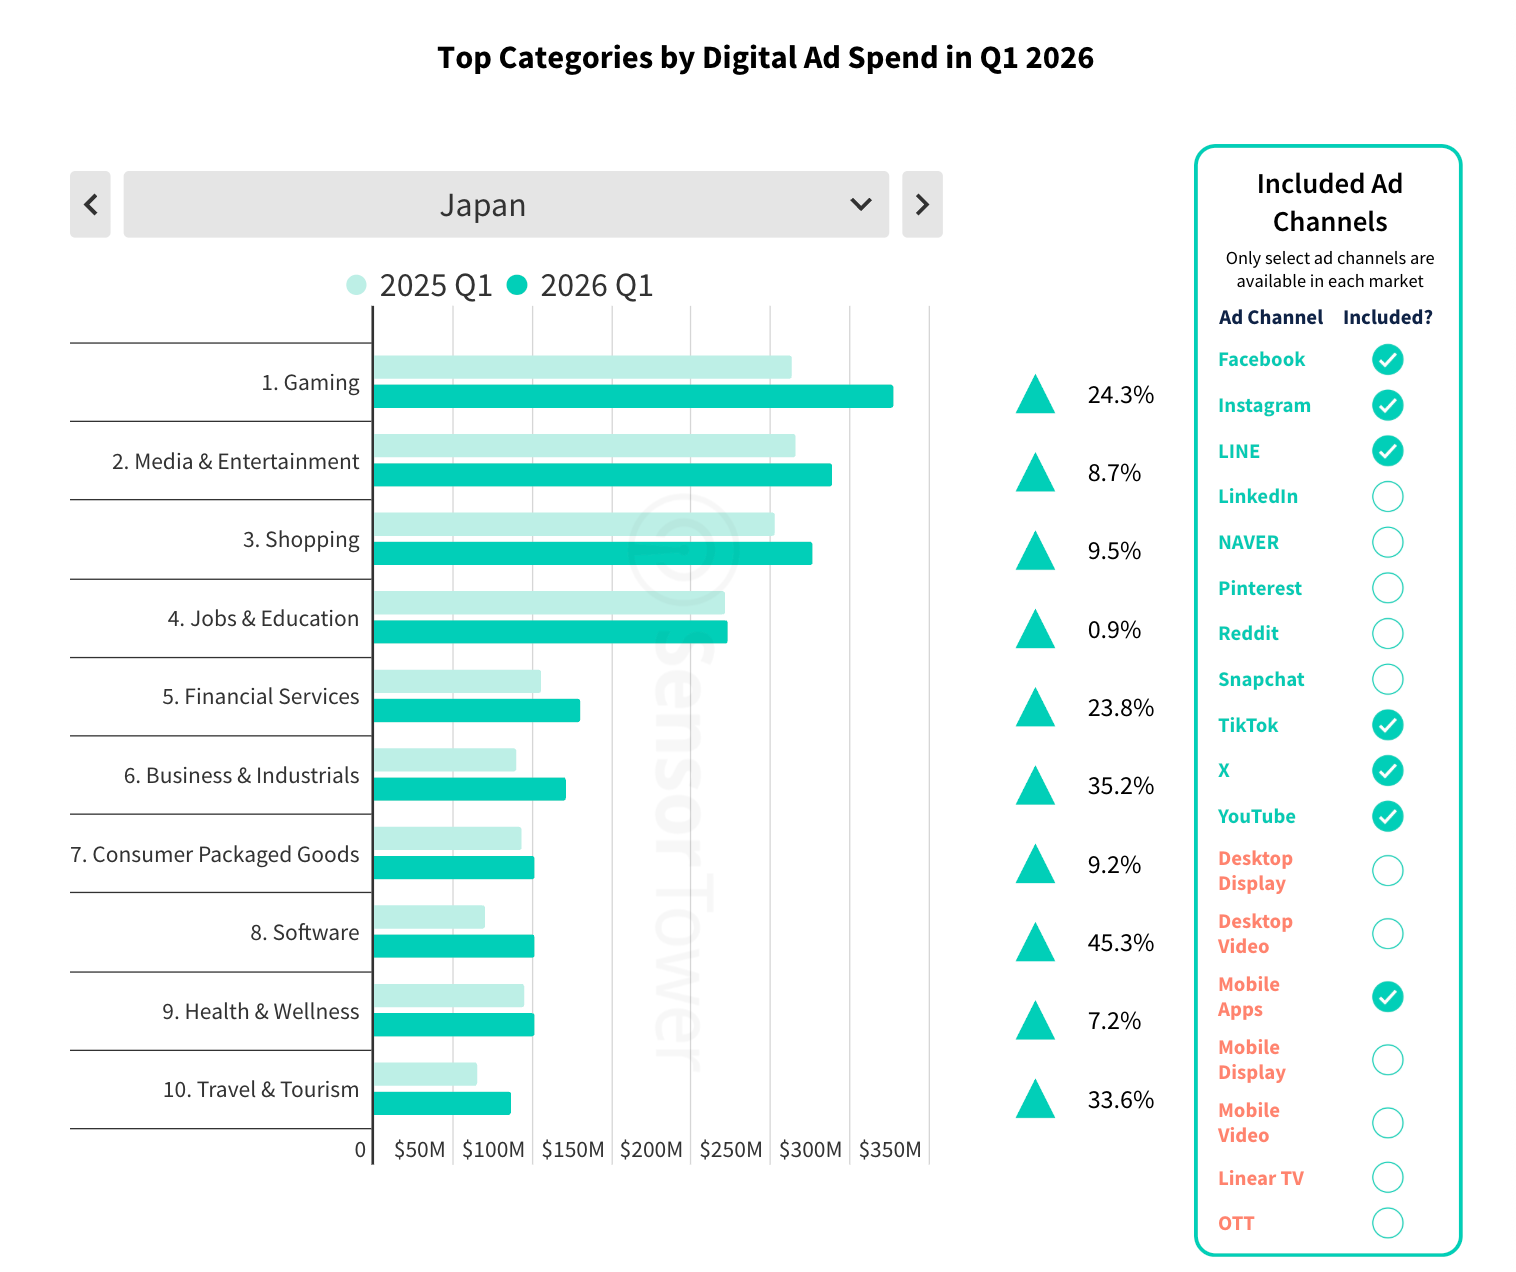
The picture varies by country. In Japan, for example, games rank first in digital marketing spend and are also growing strongly (+24.3% YoY).
In Turkey, games rank third but are growing 84.2% YoY.
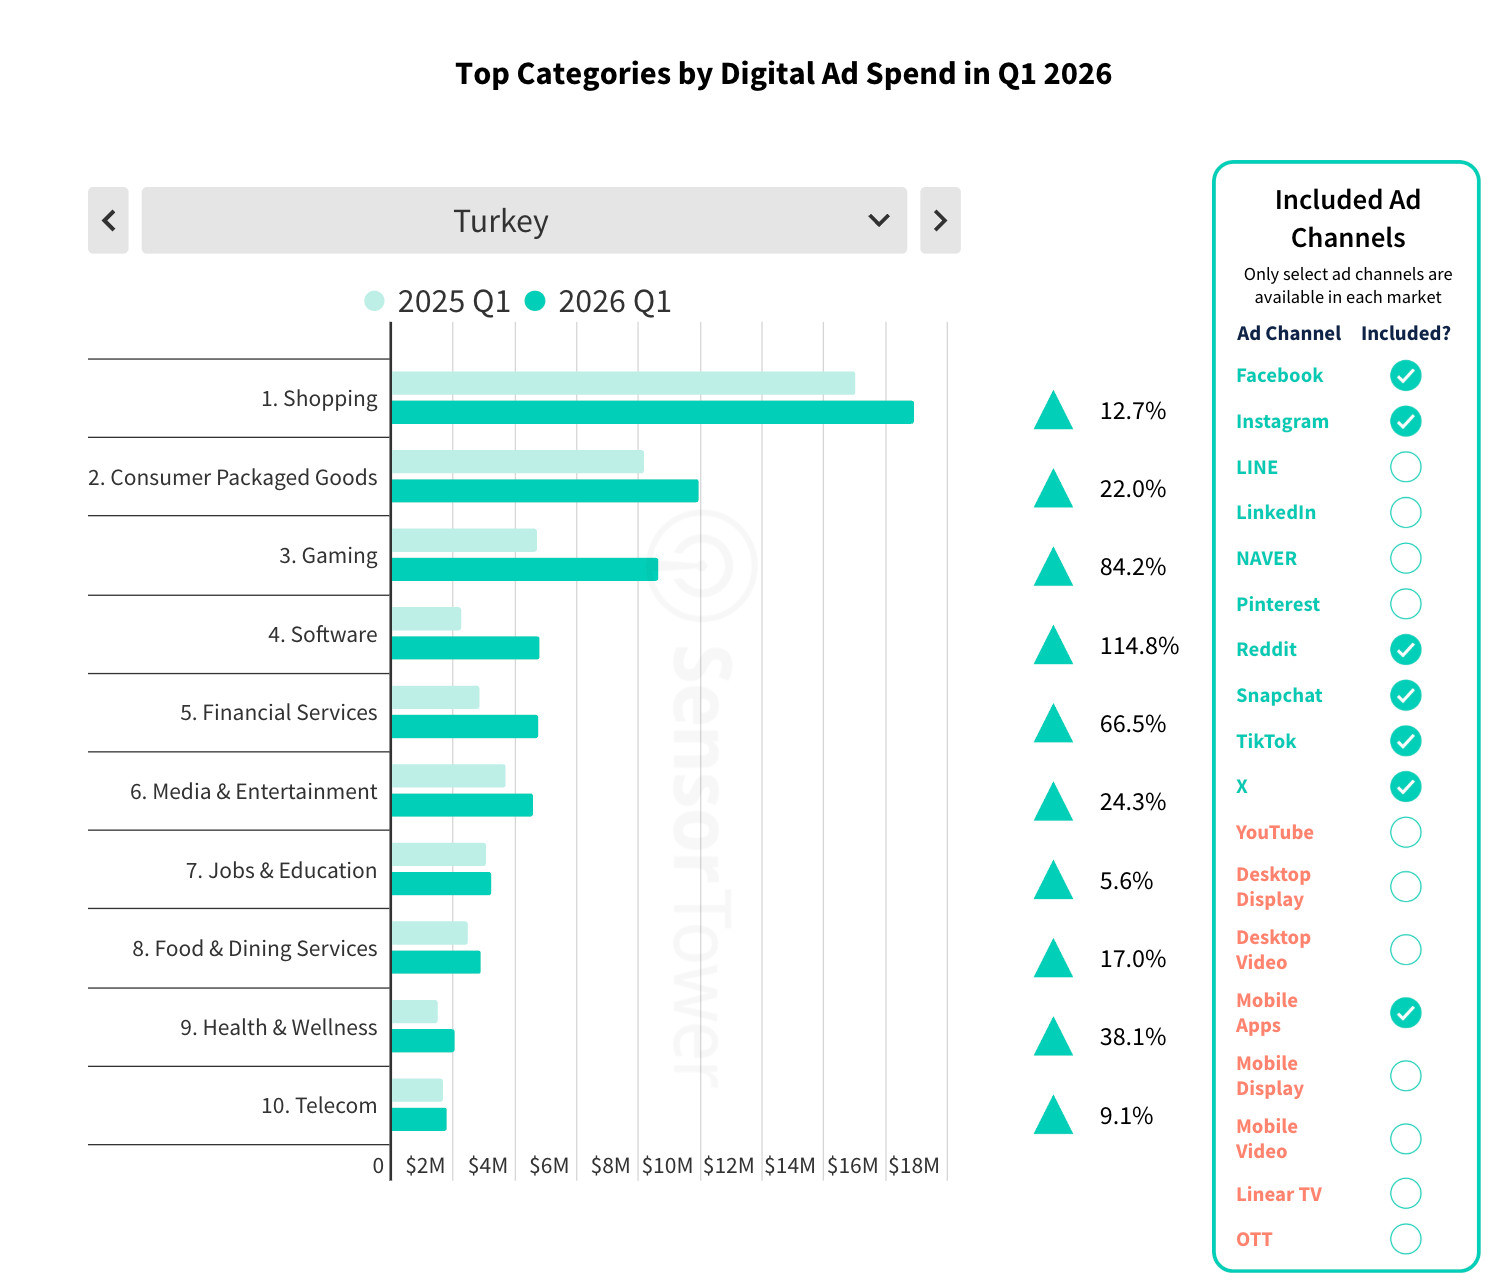
Broadly, digital marketing spend on games in Q1’26 was significantly up year-over-year in almost every country.