

Singular: Mobile Market Trends in Q2'24
Digesting the game-related data from the report.


ATT Opt-in Rates
The number of users in the mobile market in Q2'24 who consented to the use of their personal data dropped to 13.85%. In the previous quarter, this figure was 18.9%.
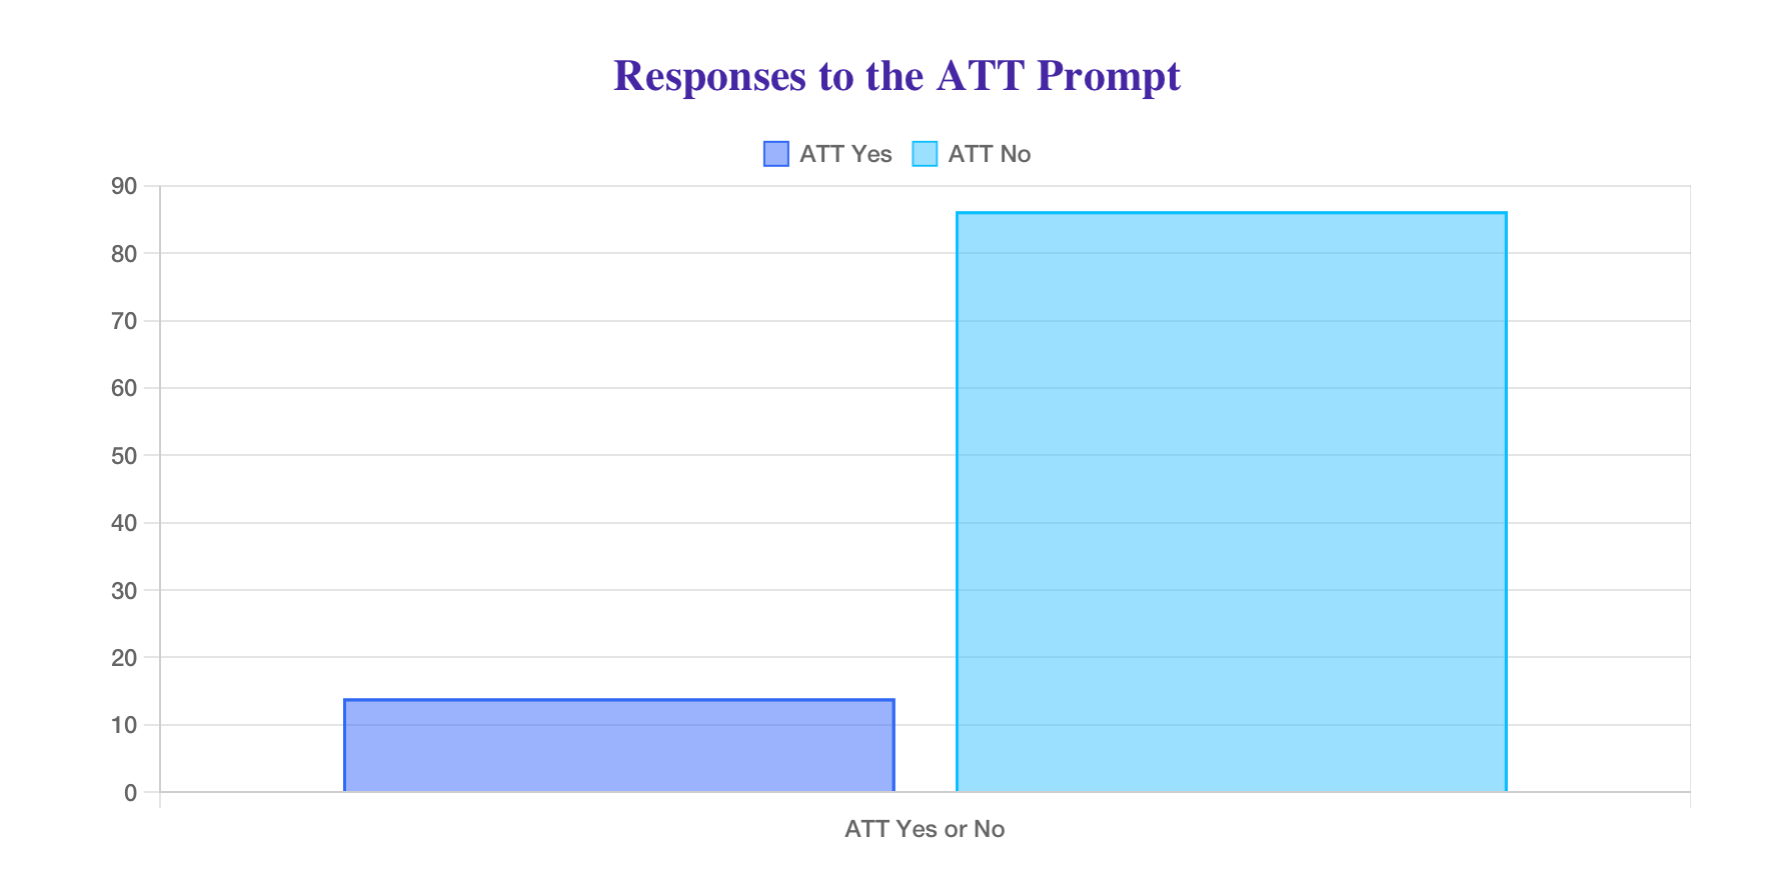
The situation is better in games, where 18.58% of players agree to share their user data.

The best ATT opt-in rates are seen in music games (34.88%), adventure games (24.47%), and card games (23.92%). The lowest rates are in casino games (7.63%), trivia games (8.85%), and puzzles (11.92%).

CPI Benchmarks
Games on iOS:
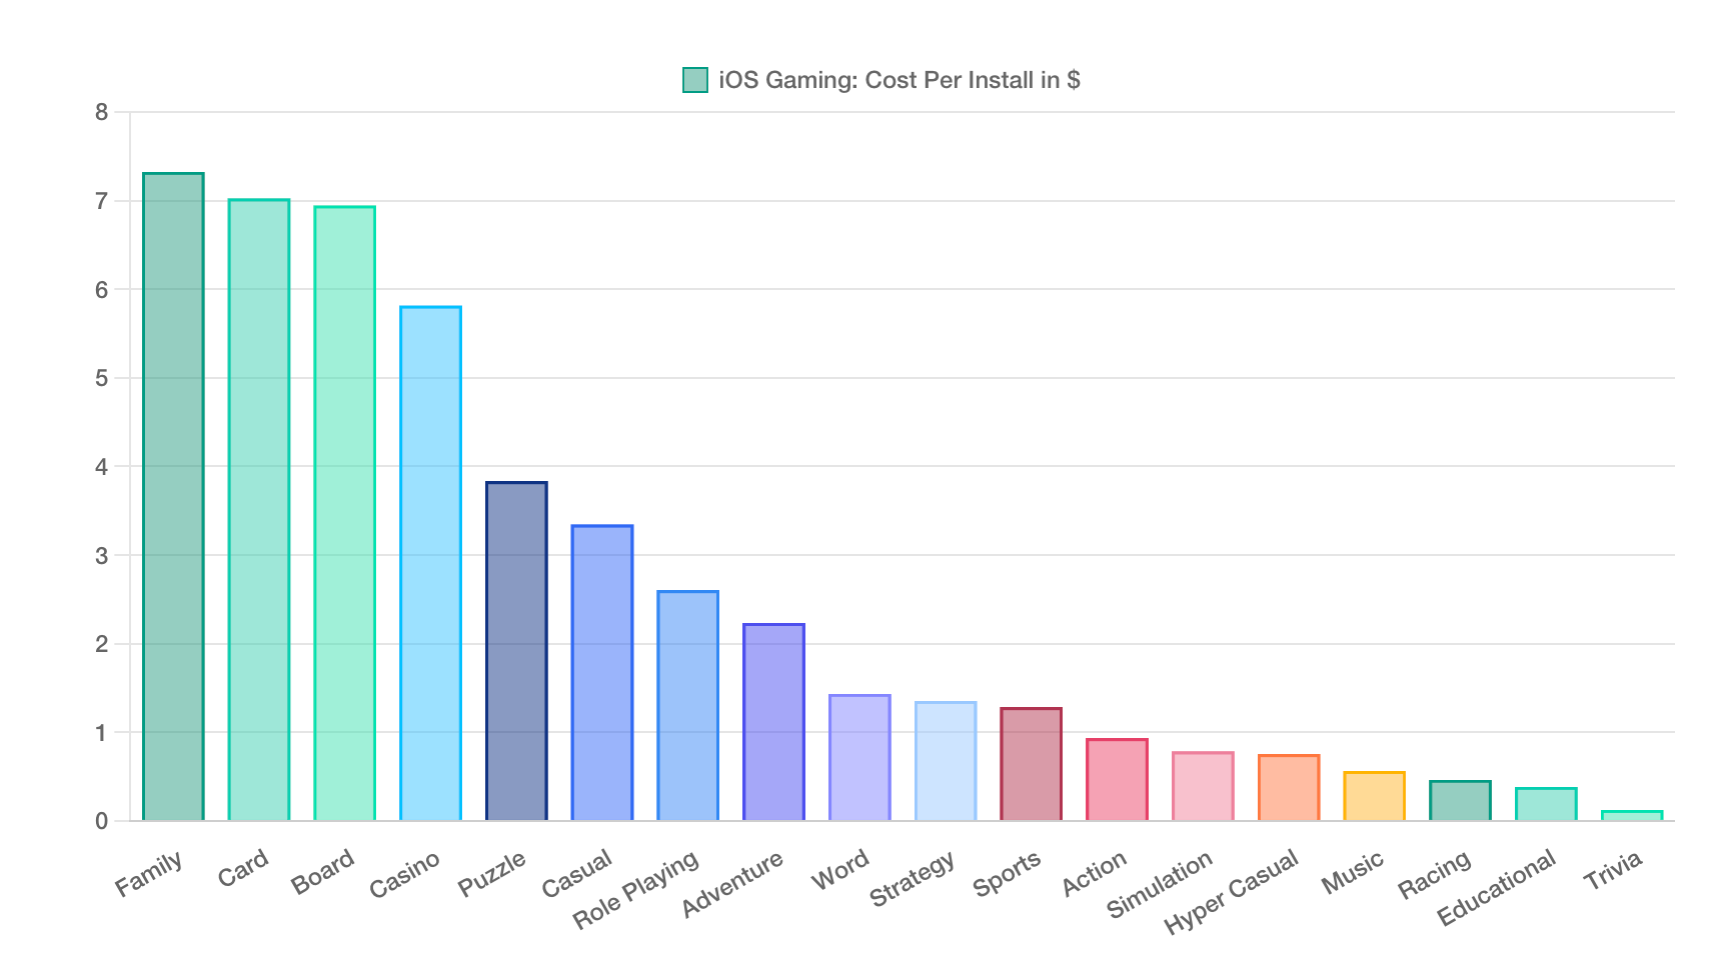
CPI (Cost Per Install) - $2.9 (an increase of $0.16 QoQ)
CTR (Click-Through Rate) - 4.27% (an increase of 0.19 percentage points QoQ)
IPM (Installs Per Mile) - 0.78 (a decrease of 0.02 QoQ)
❗️IPM - Installs Per Mile, the number of installs per 1,000 impressions. The higher this metric, the better.
The most expensive CPI on iOS is seen in family games ($7.32), card games ($7.02), and board games ($6.94).
The cheapest CPI is in trivia games ($0.12), educational games ($0.38), and racing games ($0.46).
Games on Android:

CPI - $0.67 (a decrease of $0.07 QoQ)
CTR - 2.43% (an increase of 0.64 percentage points QoQ)
IPM - 4.58 (an increase of 0.29 QoQ)
Consider subscribing to the GameDev Reports Premium tier to support the newsletter. Get access to the list of curated articles & archive of Gaming Reports that I’ve been collecting since 2020.
The most expensive CPI on Android is in casino games ($5.36), card games ($3.58), and board games ($2.3).
The lowest CPI is in racing games ($0.05), trivia games ($0.1), and hyper-casual projects ($0.12).
Downloads - Genre Trends
iOS

Casual games on iOS accounted for 18% of all downloads in Q2'24 (up from 13% last quarter).
Casual games lead in the share of installs (18.3%), followed by hyper-casual projects (15.49%) and the simulation genre (11.28%).
Android

Casual games ranked first in downloads in Q2'24 (25.04%); second place went to hyper-casual projects (24.45%); third place to action games (8.81%).
Singular notes that the share of hyper-casual games in downloads has decreased. In Q4'23, they accounted for 36% of all installs, in Q1'24 - 21%, and in Q2'24 - 24%. Meanwhile, casual games are growing in downloads.
Key Marketing Metrics for Games
In Q2'24, CTR in games increased, while it decreased in non-gaming apps. The leaders in CTR on Android are racing games (8.71%), educational games (7.75%), and hyper-casual projects (6.7%). On iOS - puzzles (9.2%), hyper-casual games (6.54%), and casual projects (5.27%).


IPM in games on Android is highest in racing games (26.71), educational games (24.17), and trivia games (13.56). On iOS, it's highest in educational games (12), trivia projects (8.7), and hyper-casual projects (4.5).


Advertising Spend

In Q2'24, iOS accounted for 38.74% of all ad spend (down from 39.97% in Q1'24); Android accounted for 37.91% (up from 36.36% in Q1'24); and Web accounted for 23.36% (a slight decrease from 23.43% in Q1'24).


According to Singular, 52.84% of traffic in Q2'24 was organic; 47.16% was paid. On Android, there is more organic traffic (58.3%); on iOS, there is less (43.5%).