

SocialPeta & Tenjin: Mobile Marketing in H1'24
Advertising activity cooled off a little compared to the previous year.


Market Trends
In the first half of 2024, the number of advertisers in the mobile market increased by 33.7% to 56.6 thousand. The average number of creatives per advertiser decreased by 22.8% to 105.

The mobile gaming market is in decline when it comes to marketing activity. The percentage of advertisers with new creatives in the first half of 2024 dropped by 5.8% to 65.1%. However, the share of new creatives per month increased by 2.4% to 51.4%.

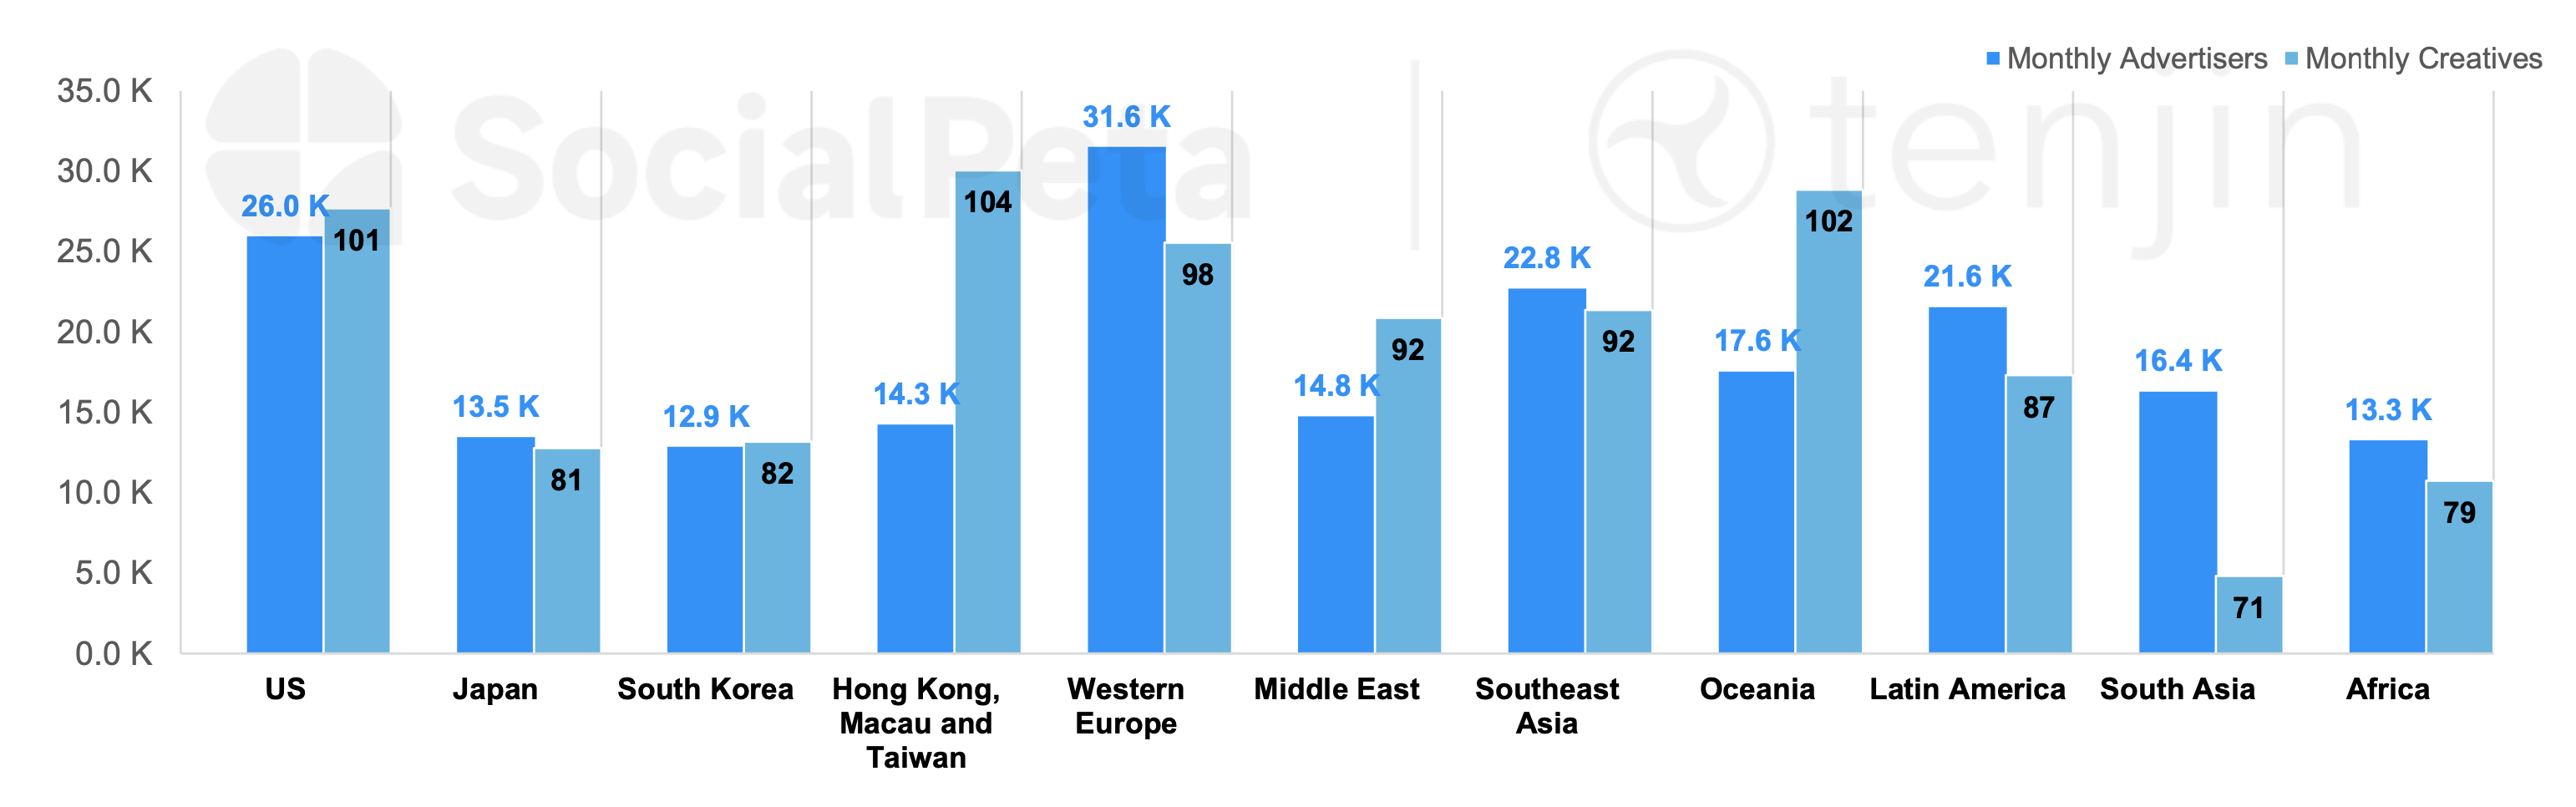
The highest number of gaming advertisers is in Western Europe (31.6 thousand), the USA (26 thousand), and Southeast Asia (22.8 thousand). The highest number of creatives per advertiser is in the markets of Hong Kong, Macau, and Taiwan (104), Oceania (102), and the USA (101).
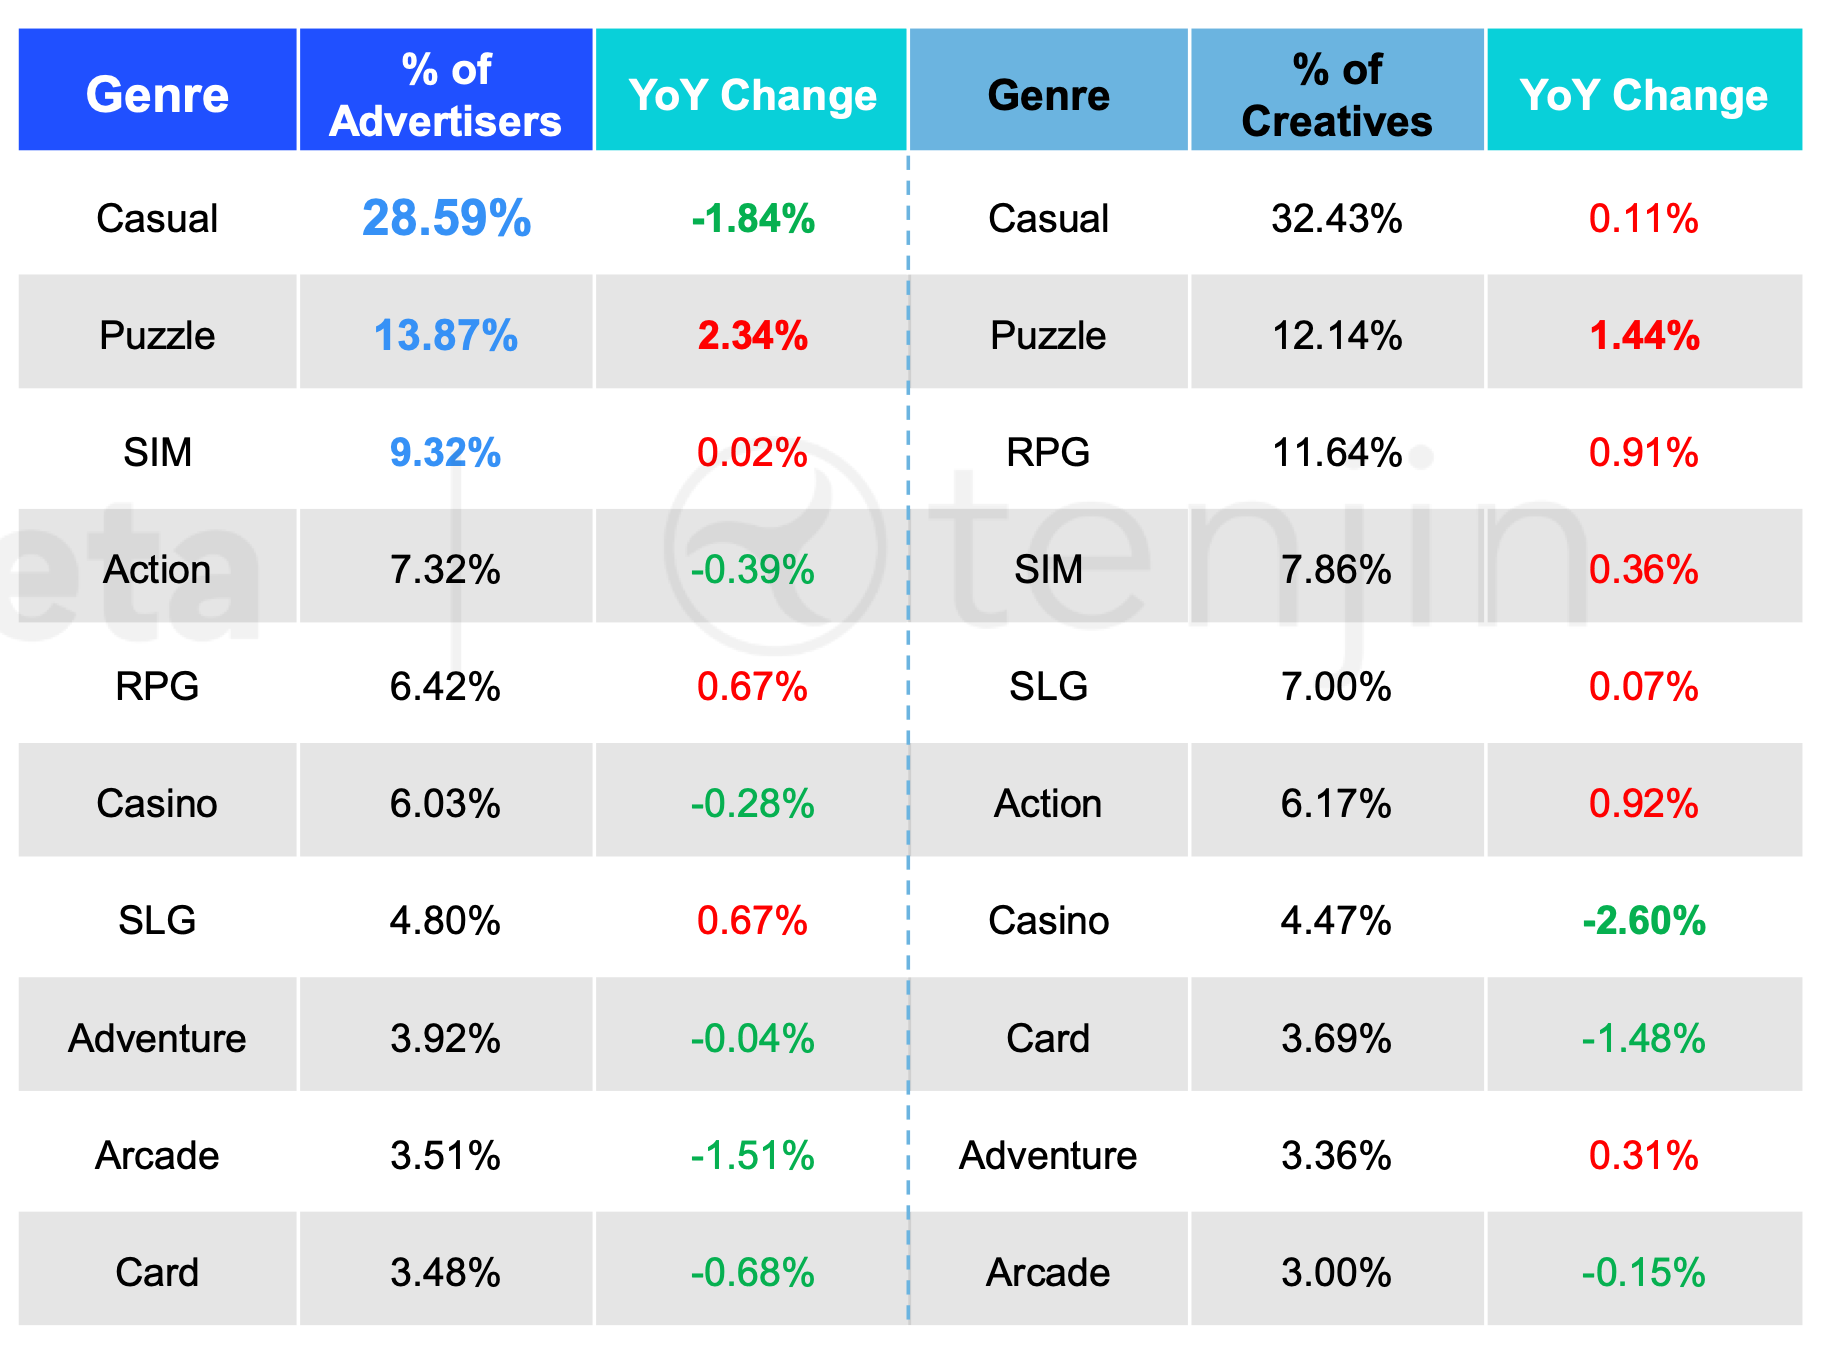
The largest number of advertisers is in casual games (28.59% of the total), puzzles (13.87%), and simulation games (9.32%). In terms of the share of creatives, casual games lead (32.43% of the total), followed by puzzles (12.14%) and RPGs (11.64%).
71.4% of all advertisers are on Android; 28.6% are on iOS. However, in some genres, iOS either surpasses or is equal to Android, such as adventure games (53% of advertisers are on iOS), sports games (49.5%), and card games (47.5%).

77.8% of creatives in the first half of 2024 were videos. 18.8% were images. Despite the growth in the share of video, views of static ads actually increased in the first half of 2024.

❗️SocialPeta is connecting the increased impressions of image creatives with AI-generated creatives.
Advertising Leaders


The most creatives in H1'24 on Android came from Jewel Abyss, Tycoon Casino Vegas Slot Games, and Block Blast!. On iOS, the leaders were MONOPOLY GO!, Legend of Mushroom, and Hero Clash Battle (マジックカード).
Consider subscribing to the GameDev Reports Premium tier to support the newsletter. Get access to the list of curated articles & archive of Gaming Reports that I’ve been collecting since 2020.

Rollic Games, Bingchuan Network, and Yotta Games were the most effective companies in the advertising market, producing the most creatives. Among the top 20, there were 10 companies from China, 2 from the USA, 2 from France, 2 from Cyprus, and one each from Turkey, Singapore, Israel, and Switzerland.
Marketing Spend Trends
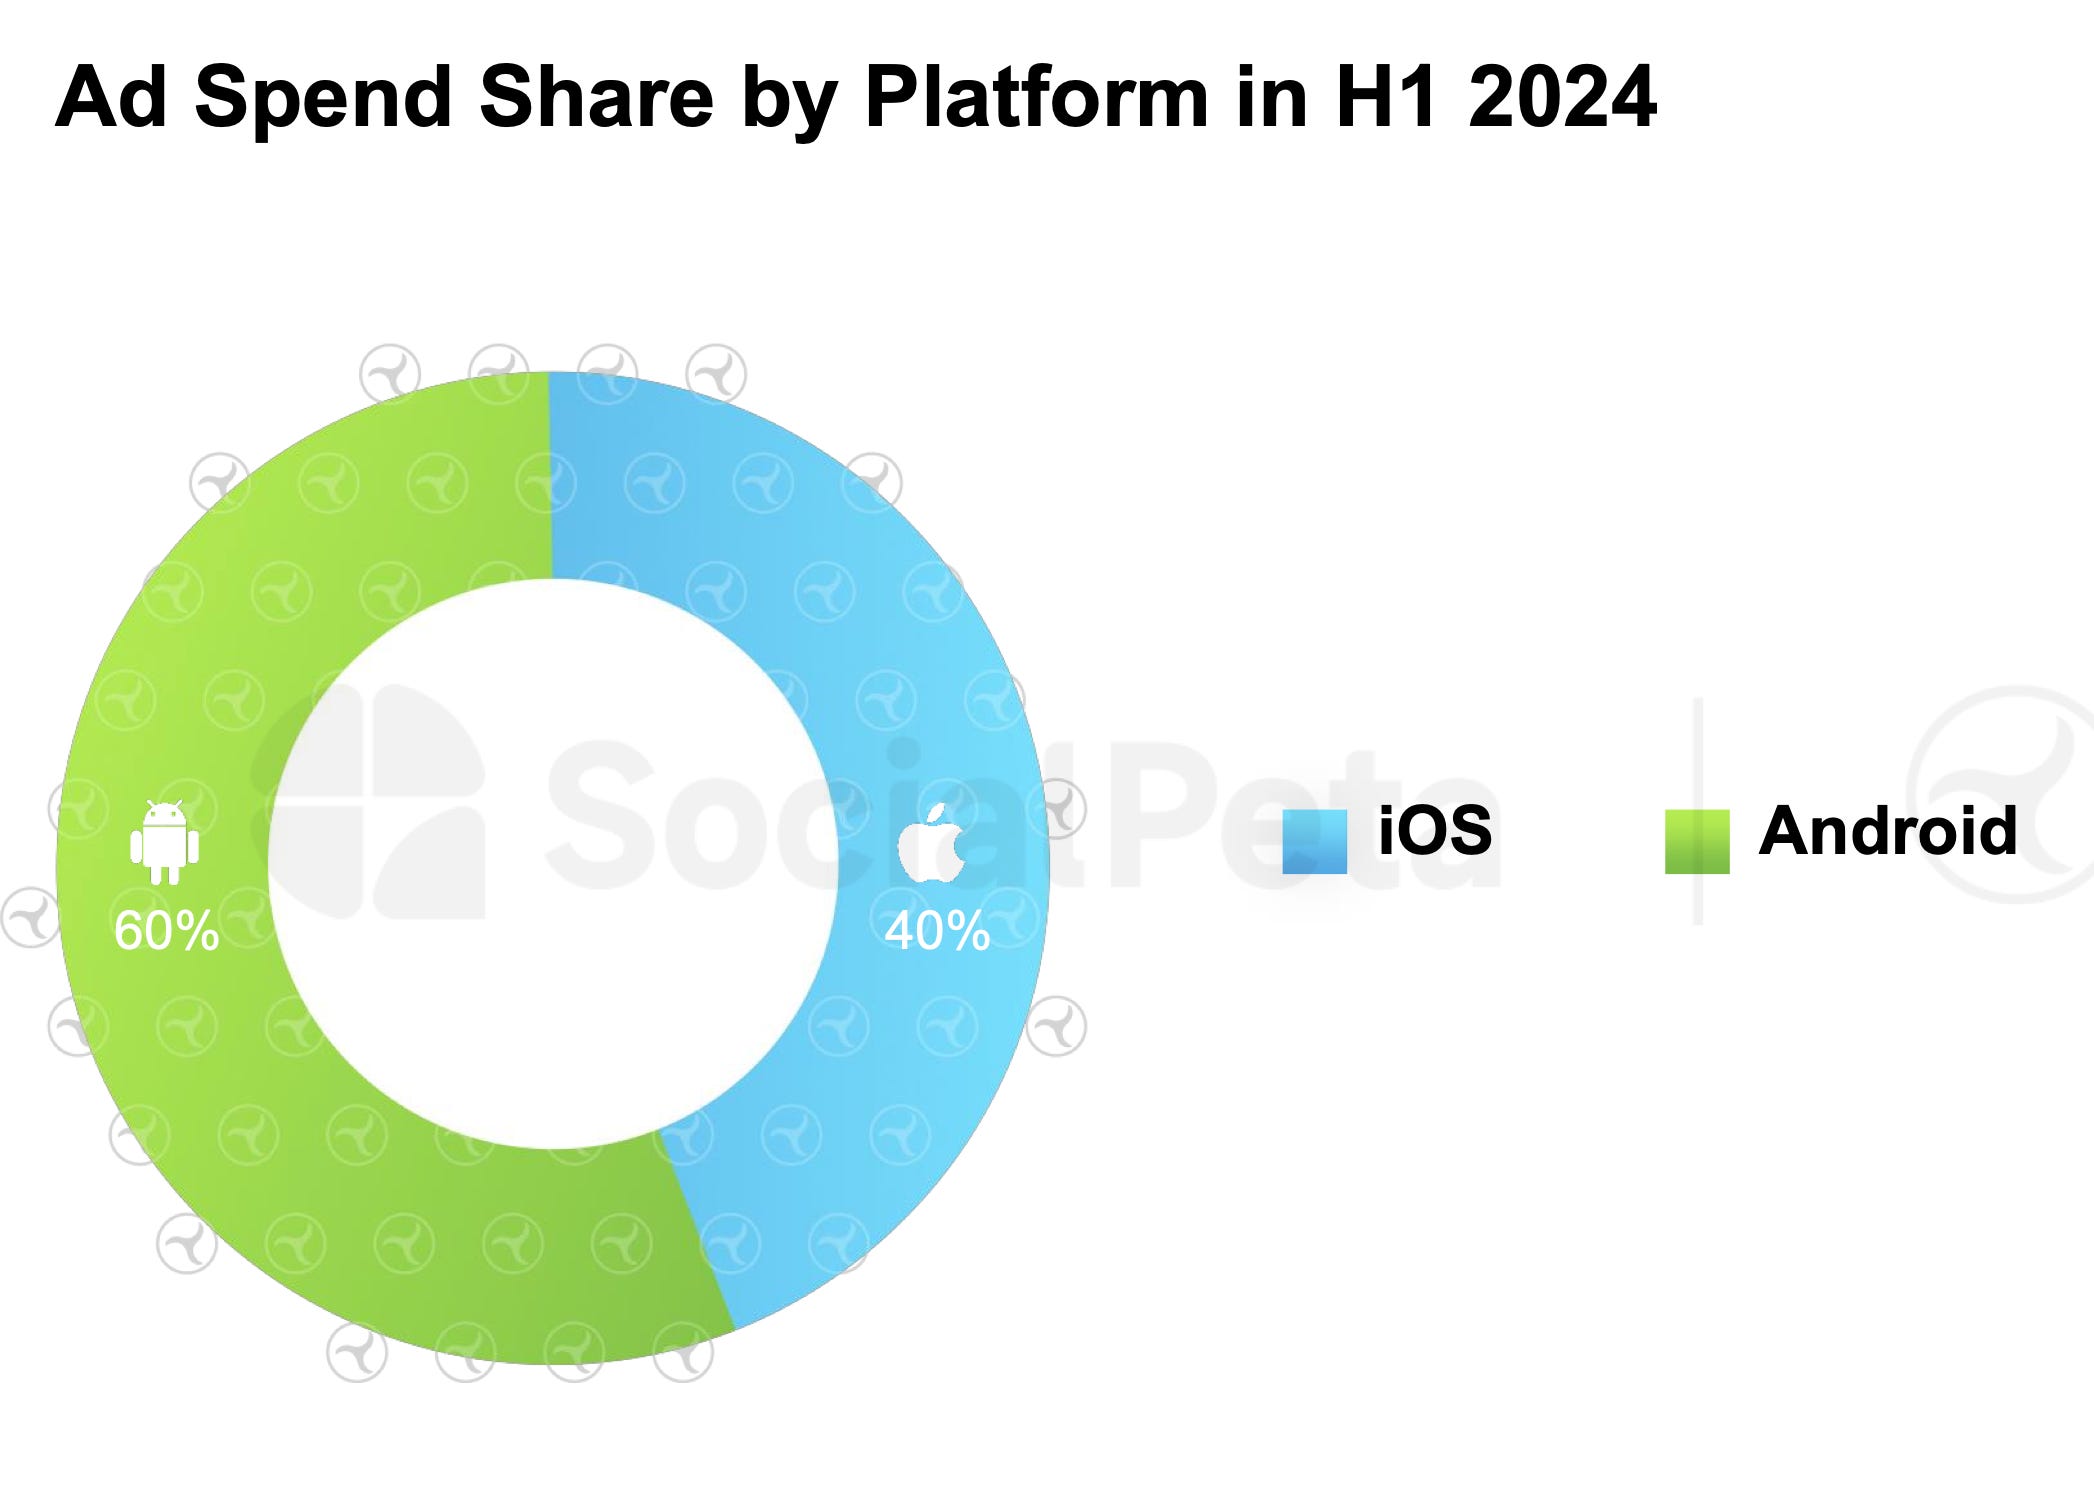
According to Tenjin, 60% of budgets in H1'24 went to Android, and 40% to iOS.


The USA, Brazil, and Japan were the leaders in spending on Android. On iOS, the leaders were the USA, Japan, and the UK.


Google Ads, AppLovin, and Mintegral were the leaders in spending on Android. On iOS, the same leaders were present, but in a slightly different order: AppLovin, Google Ads, and Mintegral.
Interesting Marketing Trends in H1'24

SocialPeta and Adjust note that the approach to marketing differs between East and West. In the East, there is more investment in advertising before the project launch, while in the West, the focus shifts toward a calmer launch with subsequent support.

The number of AI-generated creatives is growing significantly, especially among RPG and strategy games. In H2'23, the share of AI-generated creatives in strategy games on Android was 25%; by H1'24, this percentage had risen to 44%.