SocialPeta: Mobile Gaming Marketing Market in H1 2022
The company released an extensive book that every game professional should check.
The company released the report on 191 pages, which analyzed 1.2B creatives in 72 countries in more than 90 channels.
The number of creatives in H1 2022 decreased by 27.83% YoY. The number of advertisers also dropped by 2%.
Advertisers paid more attention to the T2 and T3 markets - all of them are growing.
The majority of advertisers (26.03%) are working in the casual gaming space. The competition is growing, in H1 2022 the number of advertisers increased by 4.7%.
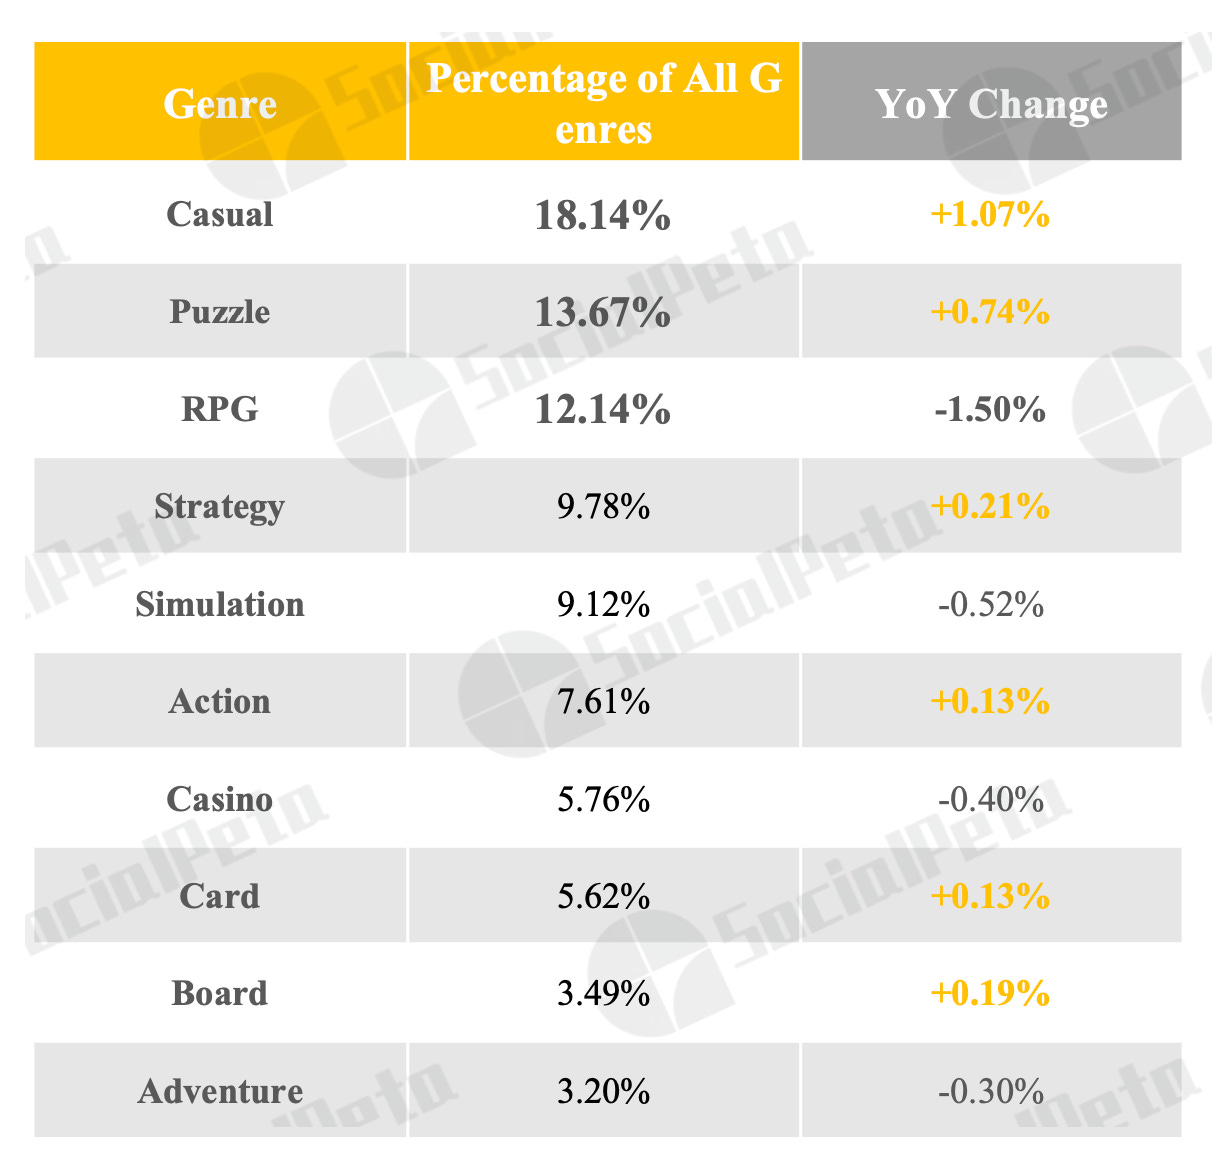
A lot of creatives are created for casual games (18.14% of the overall amount), puzzles (13.67%), and RPGs (12.14%).
86% of creatives are videos.
Android in H1 2022 was responsible for about 70% of all creatives and advertisers.
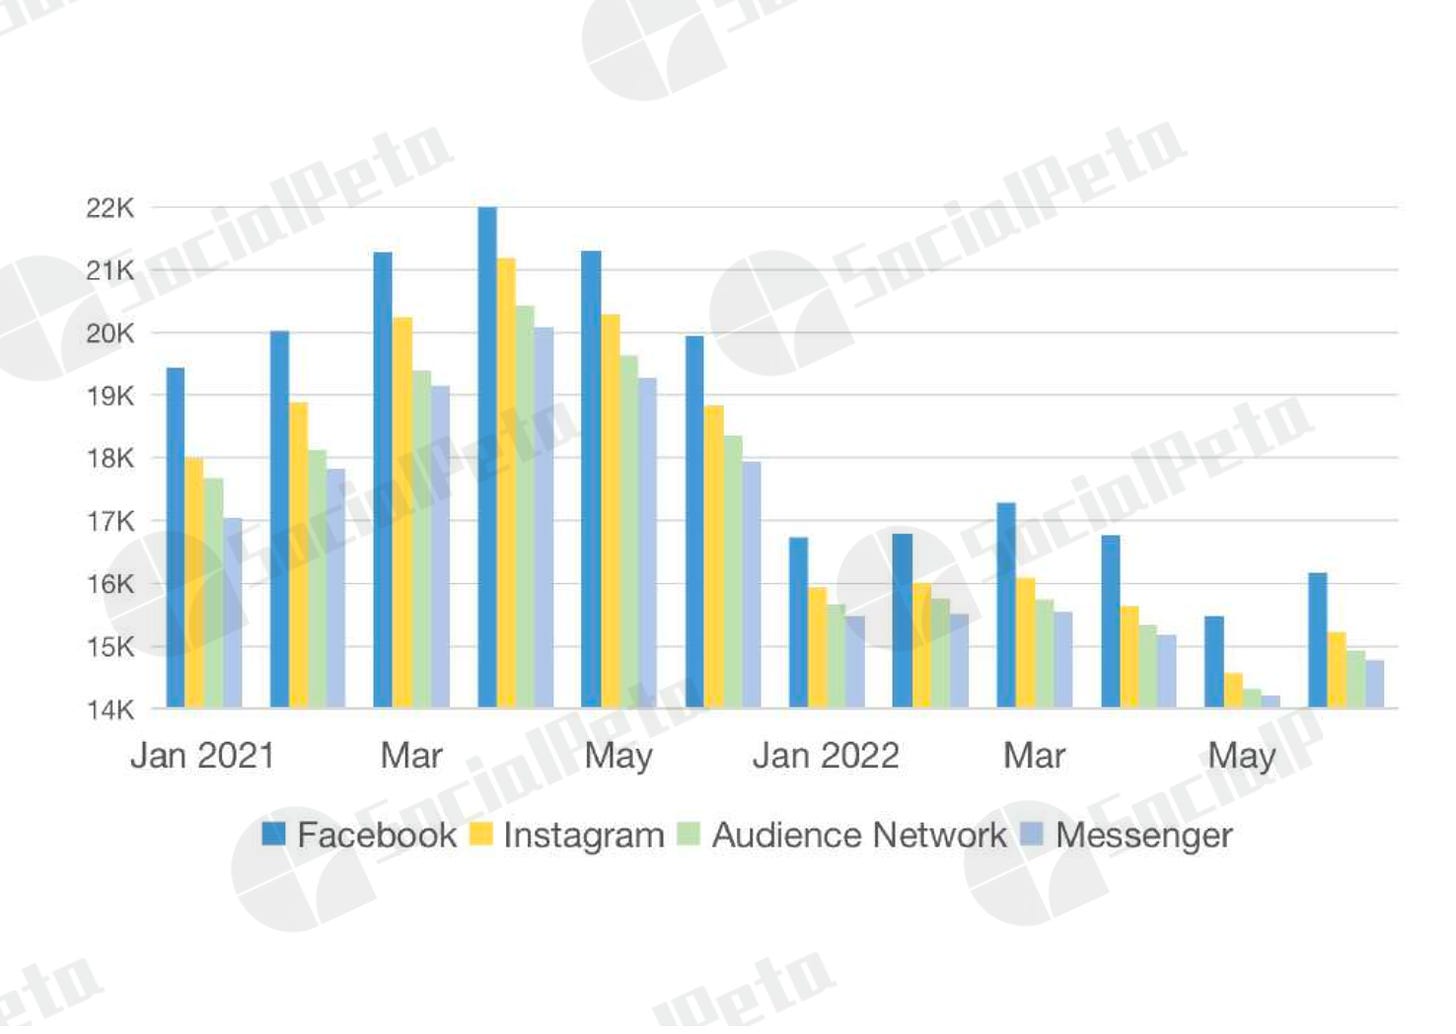
The number of advertisers in H1 2022 on Meta platforms (Facebook, Instagram, Audience Network, Messenger) experienced a serious decline.
The average CPM in gaming ads is $19.31 in H1 2022. The average CPC - is $2.57. The average creatives CTR - is 1.48%.
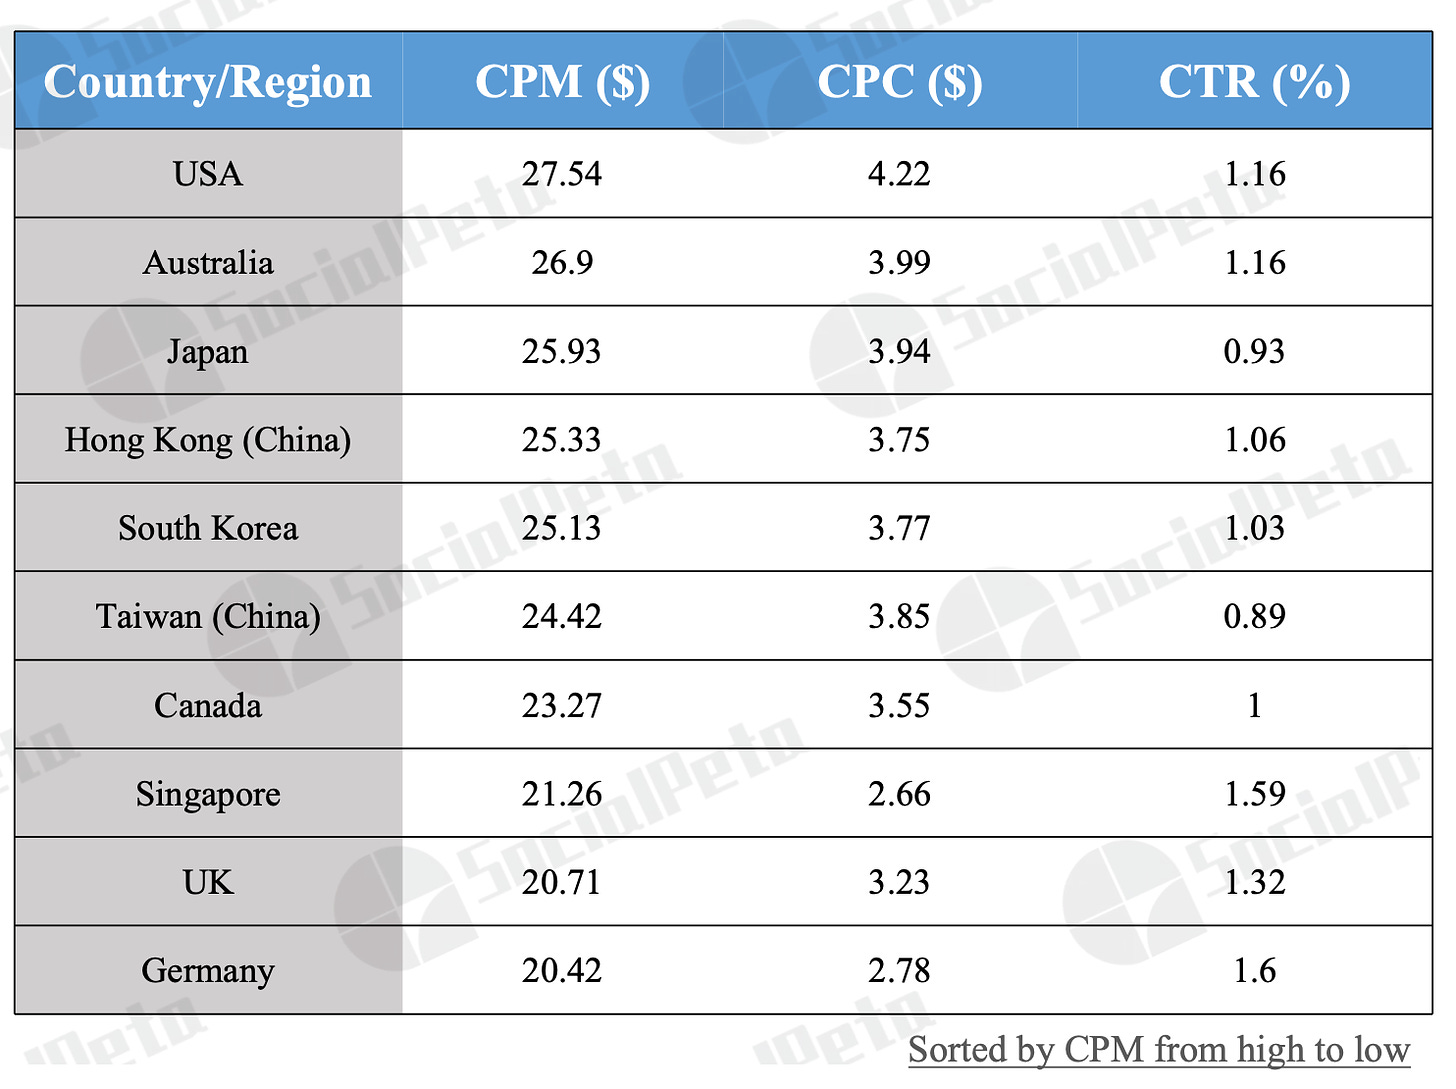
The most expensive traffic is in the US (CPM - $27.54). The most expensive platform is iOS (CPM - $20.08). The most expensive genre is a strategy (CPM - $21.58). Women cost more than a man (CPM - $20.5 versus $18.11).
Countries with the most expensive CPI are South Korea ($13.9), Japan ($12.69), and Hong Kong ($11.66).
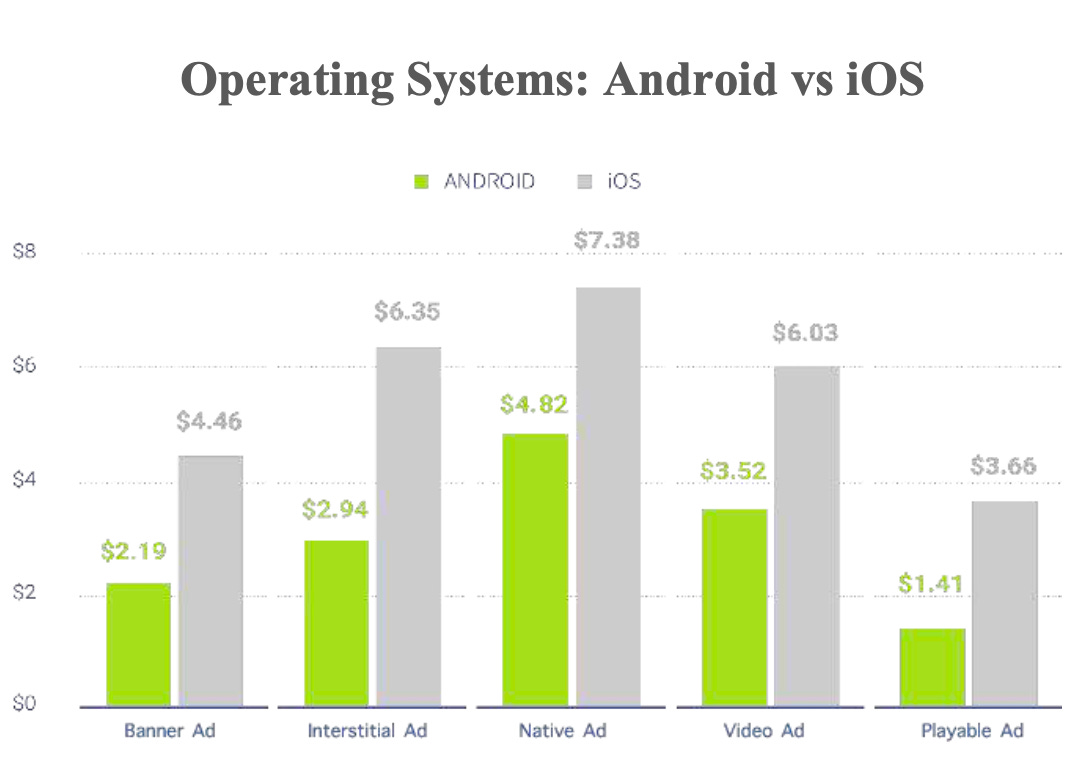
Playable Ads are the most effective from the CPI standpoint ad format. The average CPI in H1 2022 on Android was $1.41 and on iOS - $3.66.
In 2021 CPI of video ads increased from $3.44 to $6.09.
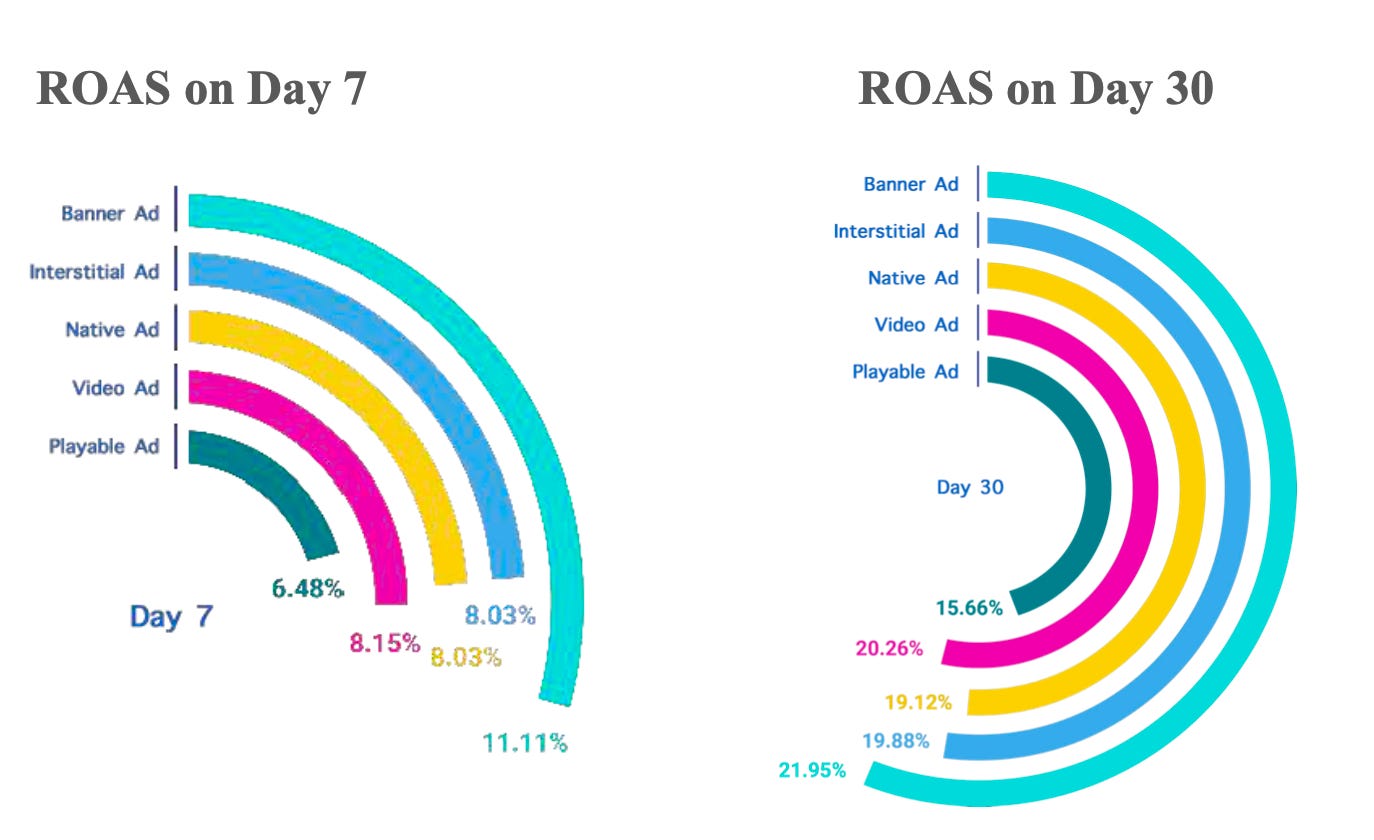
Banner ads have the second cheapest CPI, but the highest ROAS (11.11% - D7 and 21.95% - D30). Native ads (CPI - $5.22) are more expensive than Interstitial ads ($4.67), but they have almost similar ROAS D7 and ROAS D30. Playable Ad has the lowest CPI, but also the lowest ROAS.


