Tenjin: Ad Monetization in Mobile Games in Q2'24
Android is increasing its share in the ads revenue pie compared to the Q1'24.
The data for the report was collected by Tenjin and Clever Ads Solutions.
General data
63% of ad revenue recorded in Q2'24 came from Android. In Q1’24 it had 59%.
Ad revenue on iOS in the US accounted for 55% of the total volume.
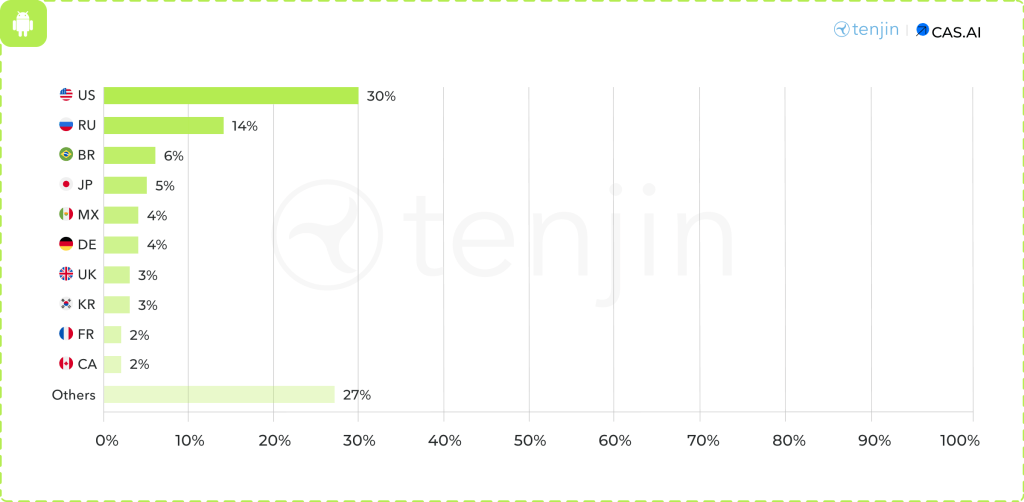
Countries outside the top 10 on Android generate 29% of total ad traffic.
Japan, the US, and Australia are leaders in eCPM across different formats on iOS.
The US is the clear leader in eCPM on Android across all formats.
iOS Numbers
The US (52%), Japan (10%), and Russia (8%) were the leaders in ad revenue on iOS in Q2'24.
Looking at ad networks, 35% of ad traffic comes from AppLovin; 17% from Mintegral; 16% from Google Admob; 12% from Unity Ads; and 8% from ironSource. Other networks make up the remaining volume.
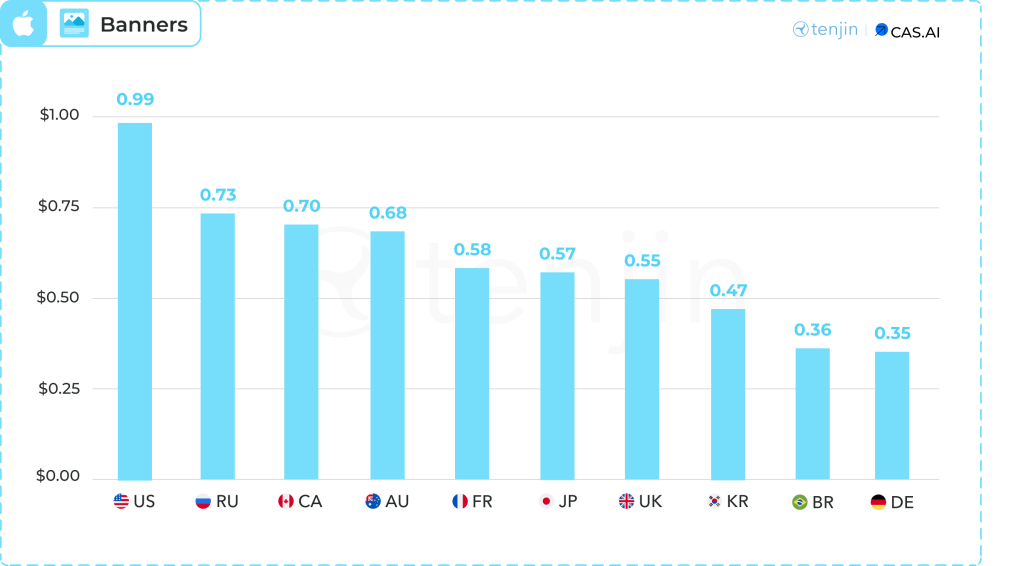
The average eCPM for banners in Q2'24 was $0.99 in the US, $0.73 in Russia, and $0.70 in Canada.
The leaders in average cost for Interstitial Ads were the US ($23.17), South Korea ($17.8), and Australia ($16.54).
The average eCPM for Rewarded Ads in the US was $24.39; in South Korea, $20.94; and in Australia, $19.91.
Consider subscribing to the GameDev Reports Premium tier to support the newsletter. Get access to the list of curated articles & archive of Gaming Reports that I’ve been collecting since 2020.
Android Numbers
The US (30%), Russia (14%), and Brazil (6%) were the leaders in ad revenue on Android in Q2'24.
Google Admob leads on Android with 26%. It is followed by AppLovin (17%), Mintegral (16%), Unity Ads (13%), and Liftoff (5%).
The average eCPM for banners in Q2'24 was $2 in Canada, $1.18 in the US, and $0.86 in Japan.
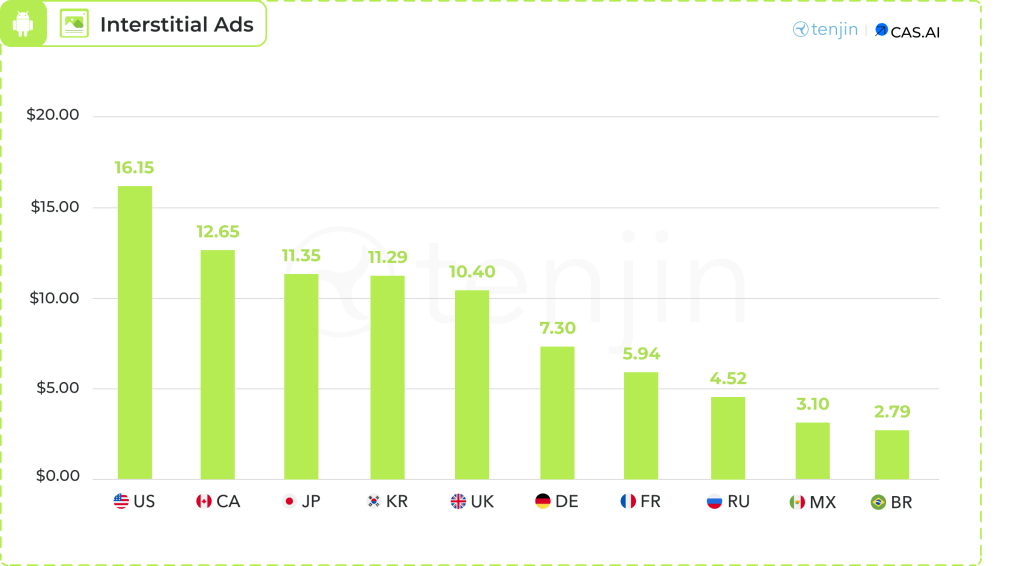
The leaders in average eCPM for Interstitial Ads were the US ($16.15), Canada ($12.65), and Japan ($11.35).
The average eCPM for Rewarded Ads in the US was $30.25; in Canada, $23.13; and in South Korea, $22.01.


