

Tenjin & GameAnalytics: Hypercasual Games benchmarks in Q4 2022
CPIs hit an all-time high.

Companies were collecting the data from 01.10.2022 to 31.12.2022. Only countries with more than $1M spend during this period were included in the CPI report.
Marketing
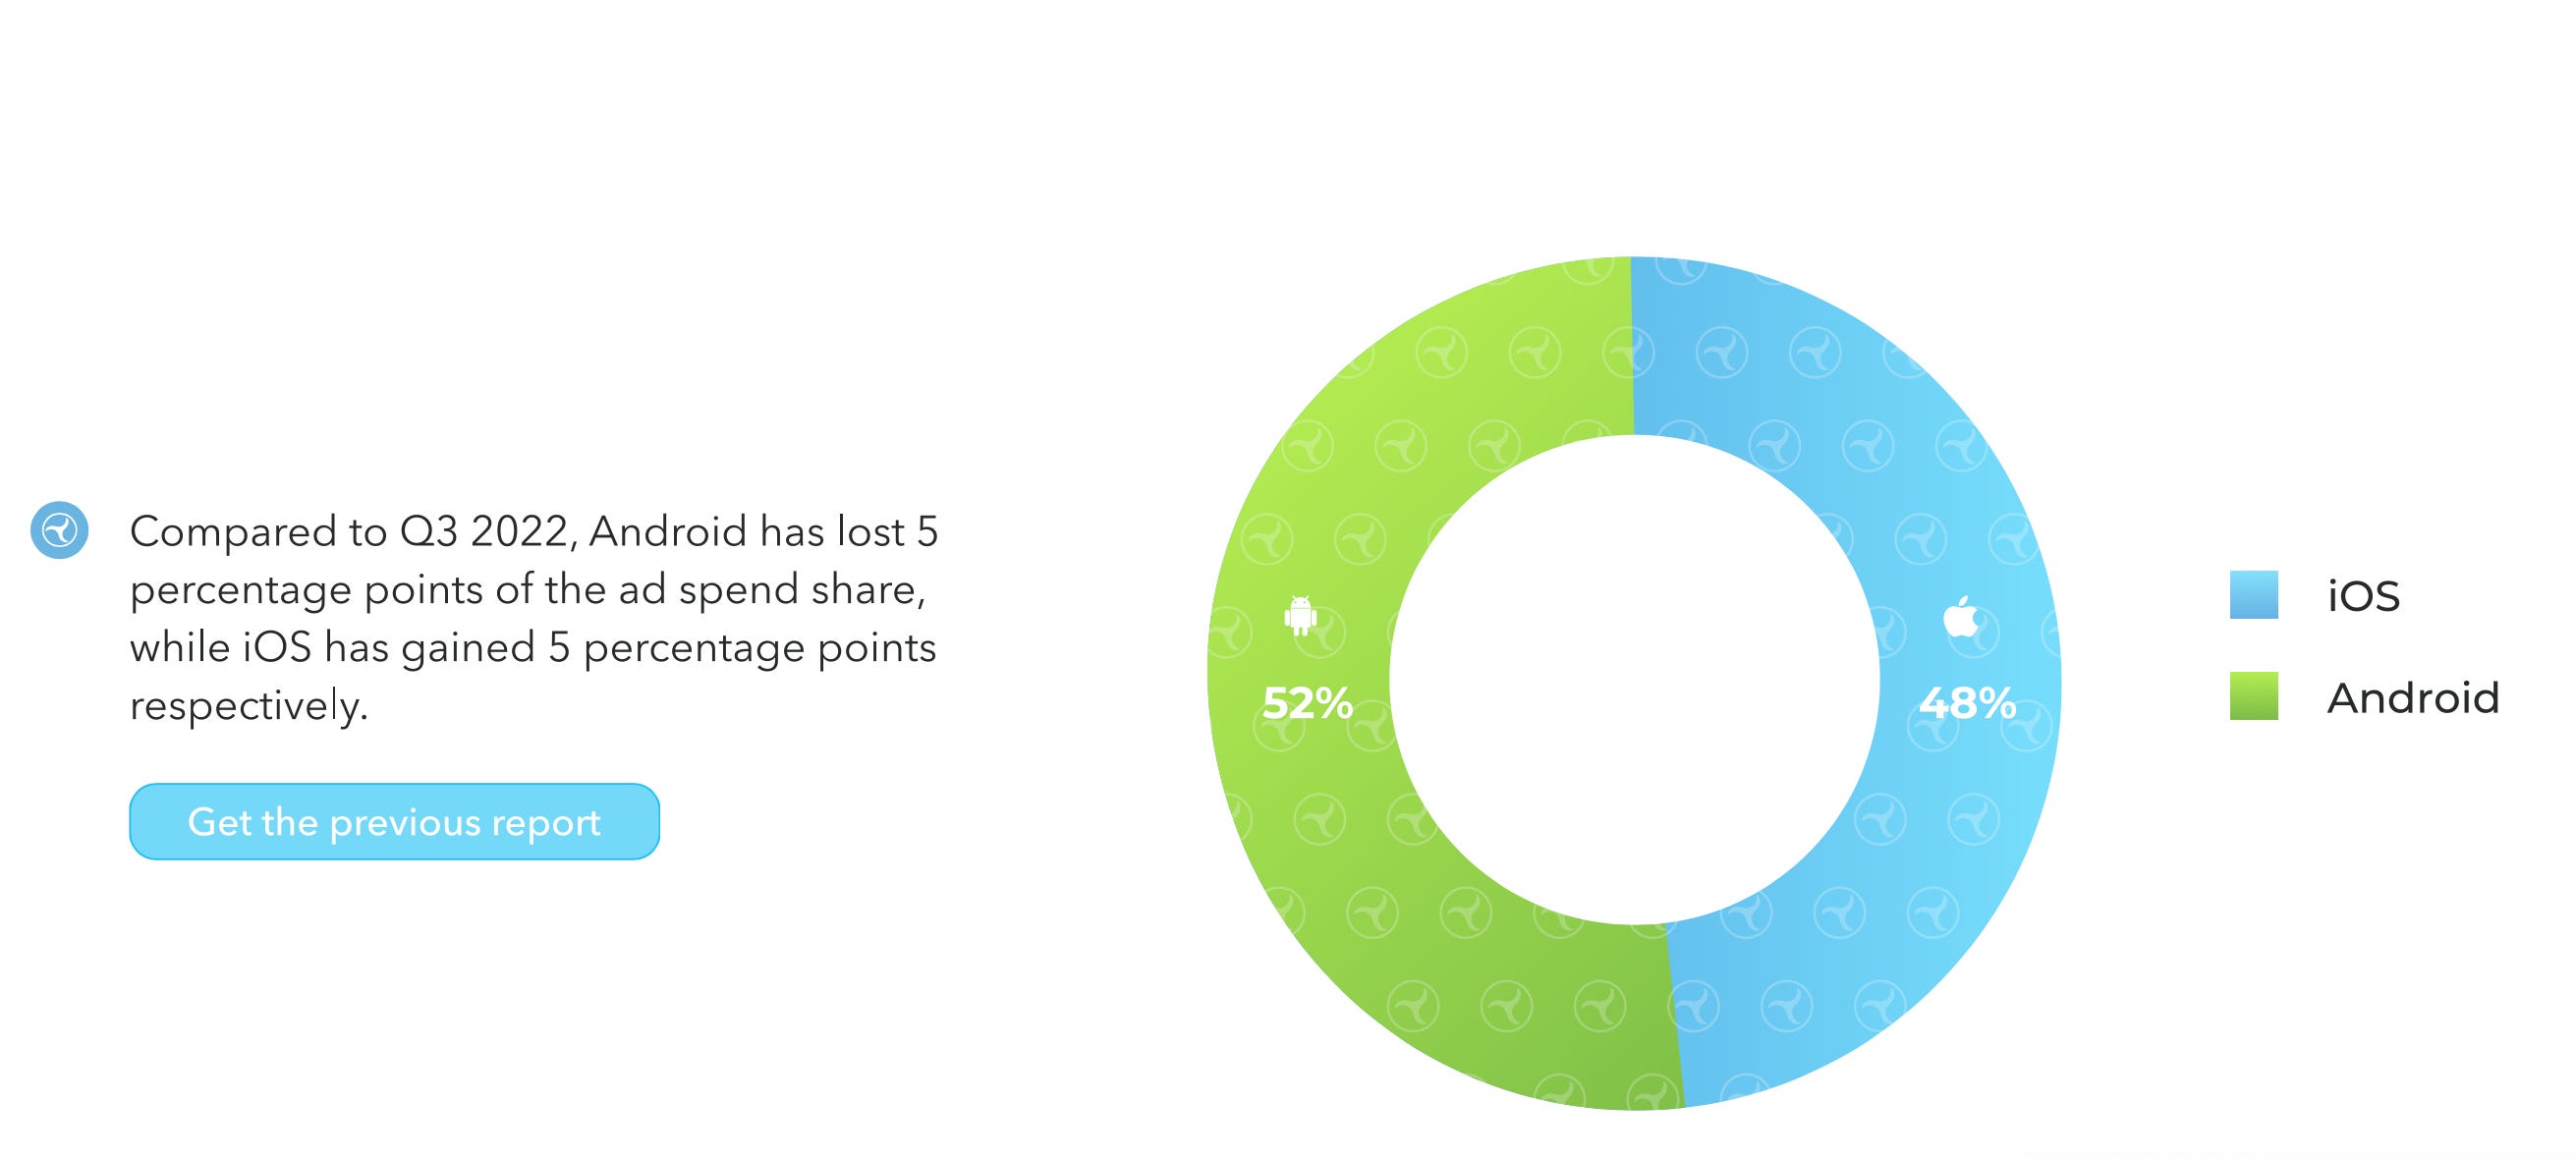
Share of marketing spending on iOS in Q4 2022 increased by 5% compared to the previous quarter. iOS in Q4 2022 was responsible for 48% of all spending and Android for the remaining 52%.
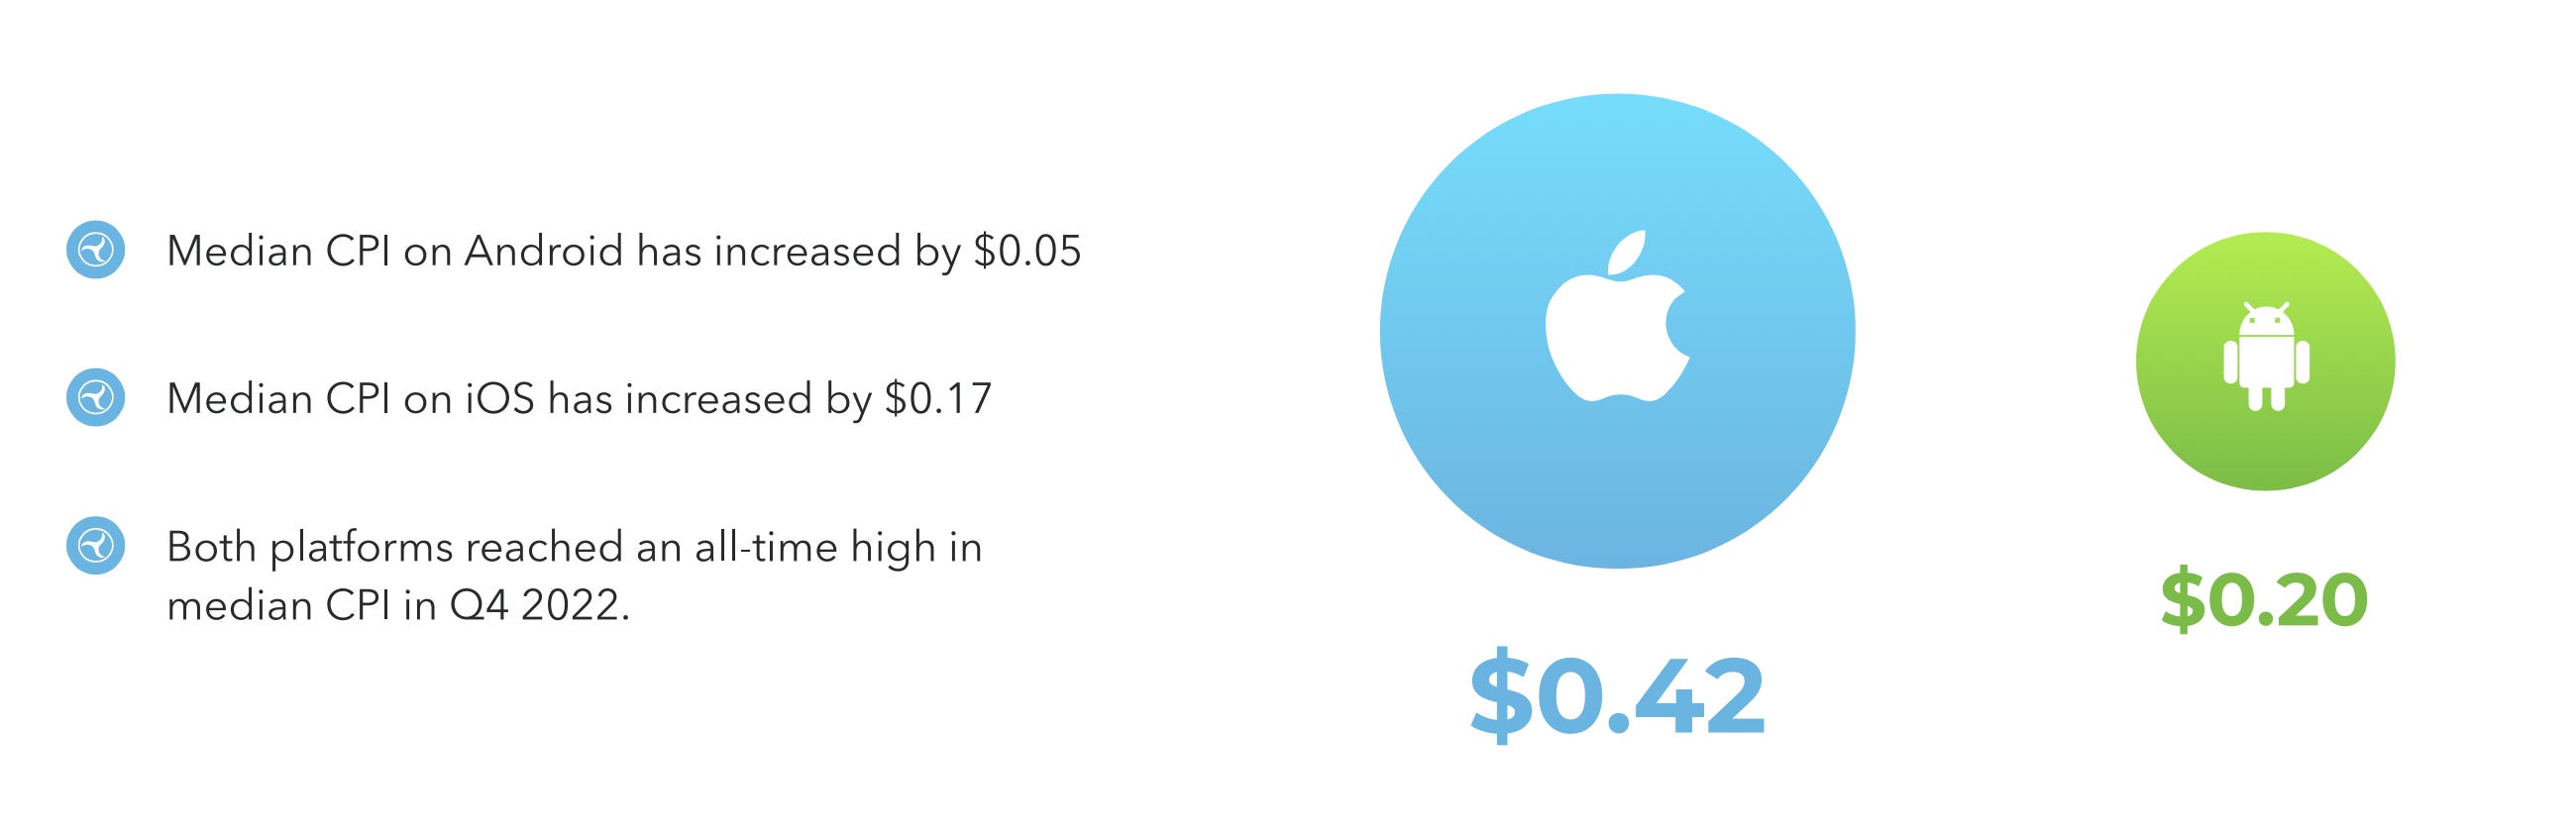
Median CPI on iOS reached $0.42, on Android - $0,2. It’s an all-time high.
The US (CPI - $0.58), Brazil (CPI - $0.07), Japan (CPI - $0.45), South Korea (CPI - $0.33), and the UK (CPI - $0.3) are the top-5 countries by marketing spend on Android.

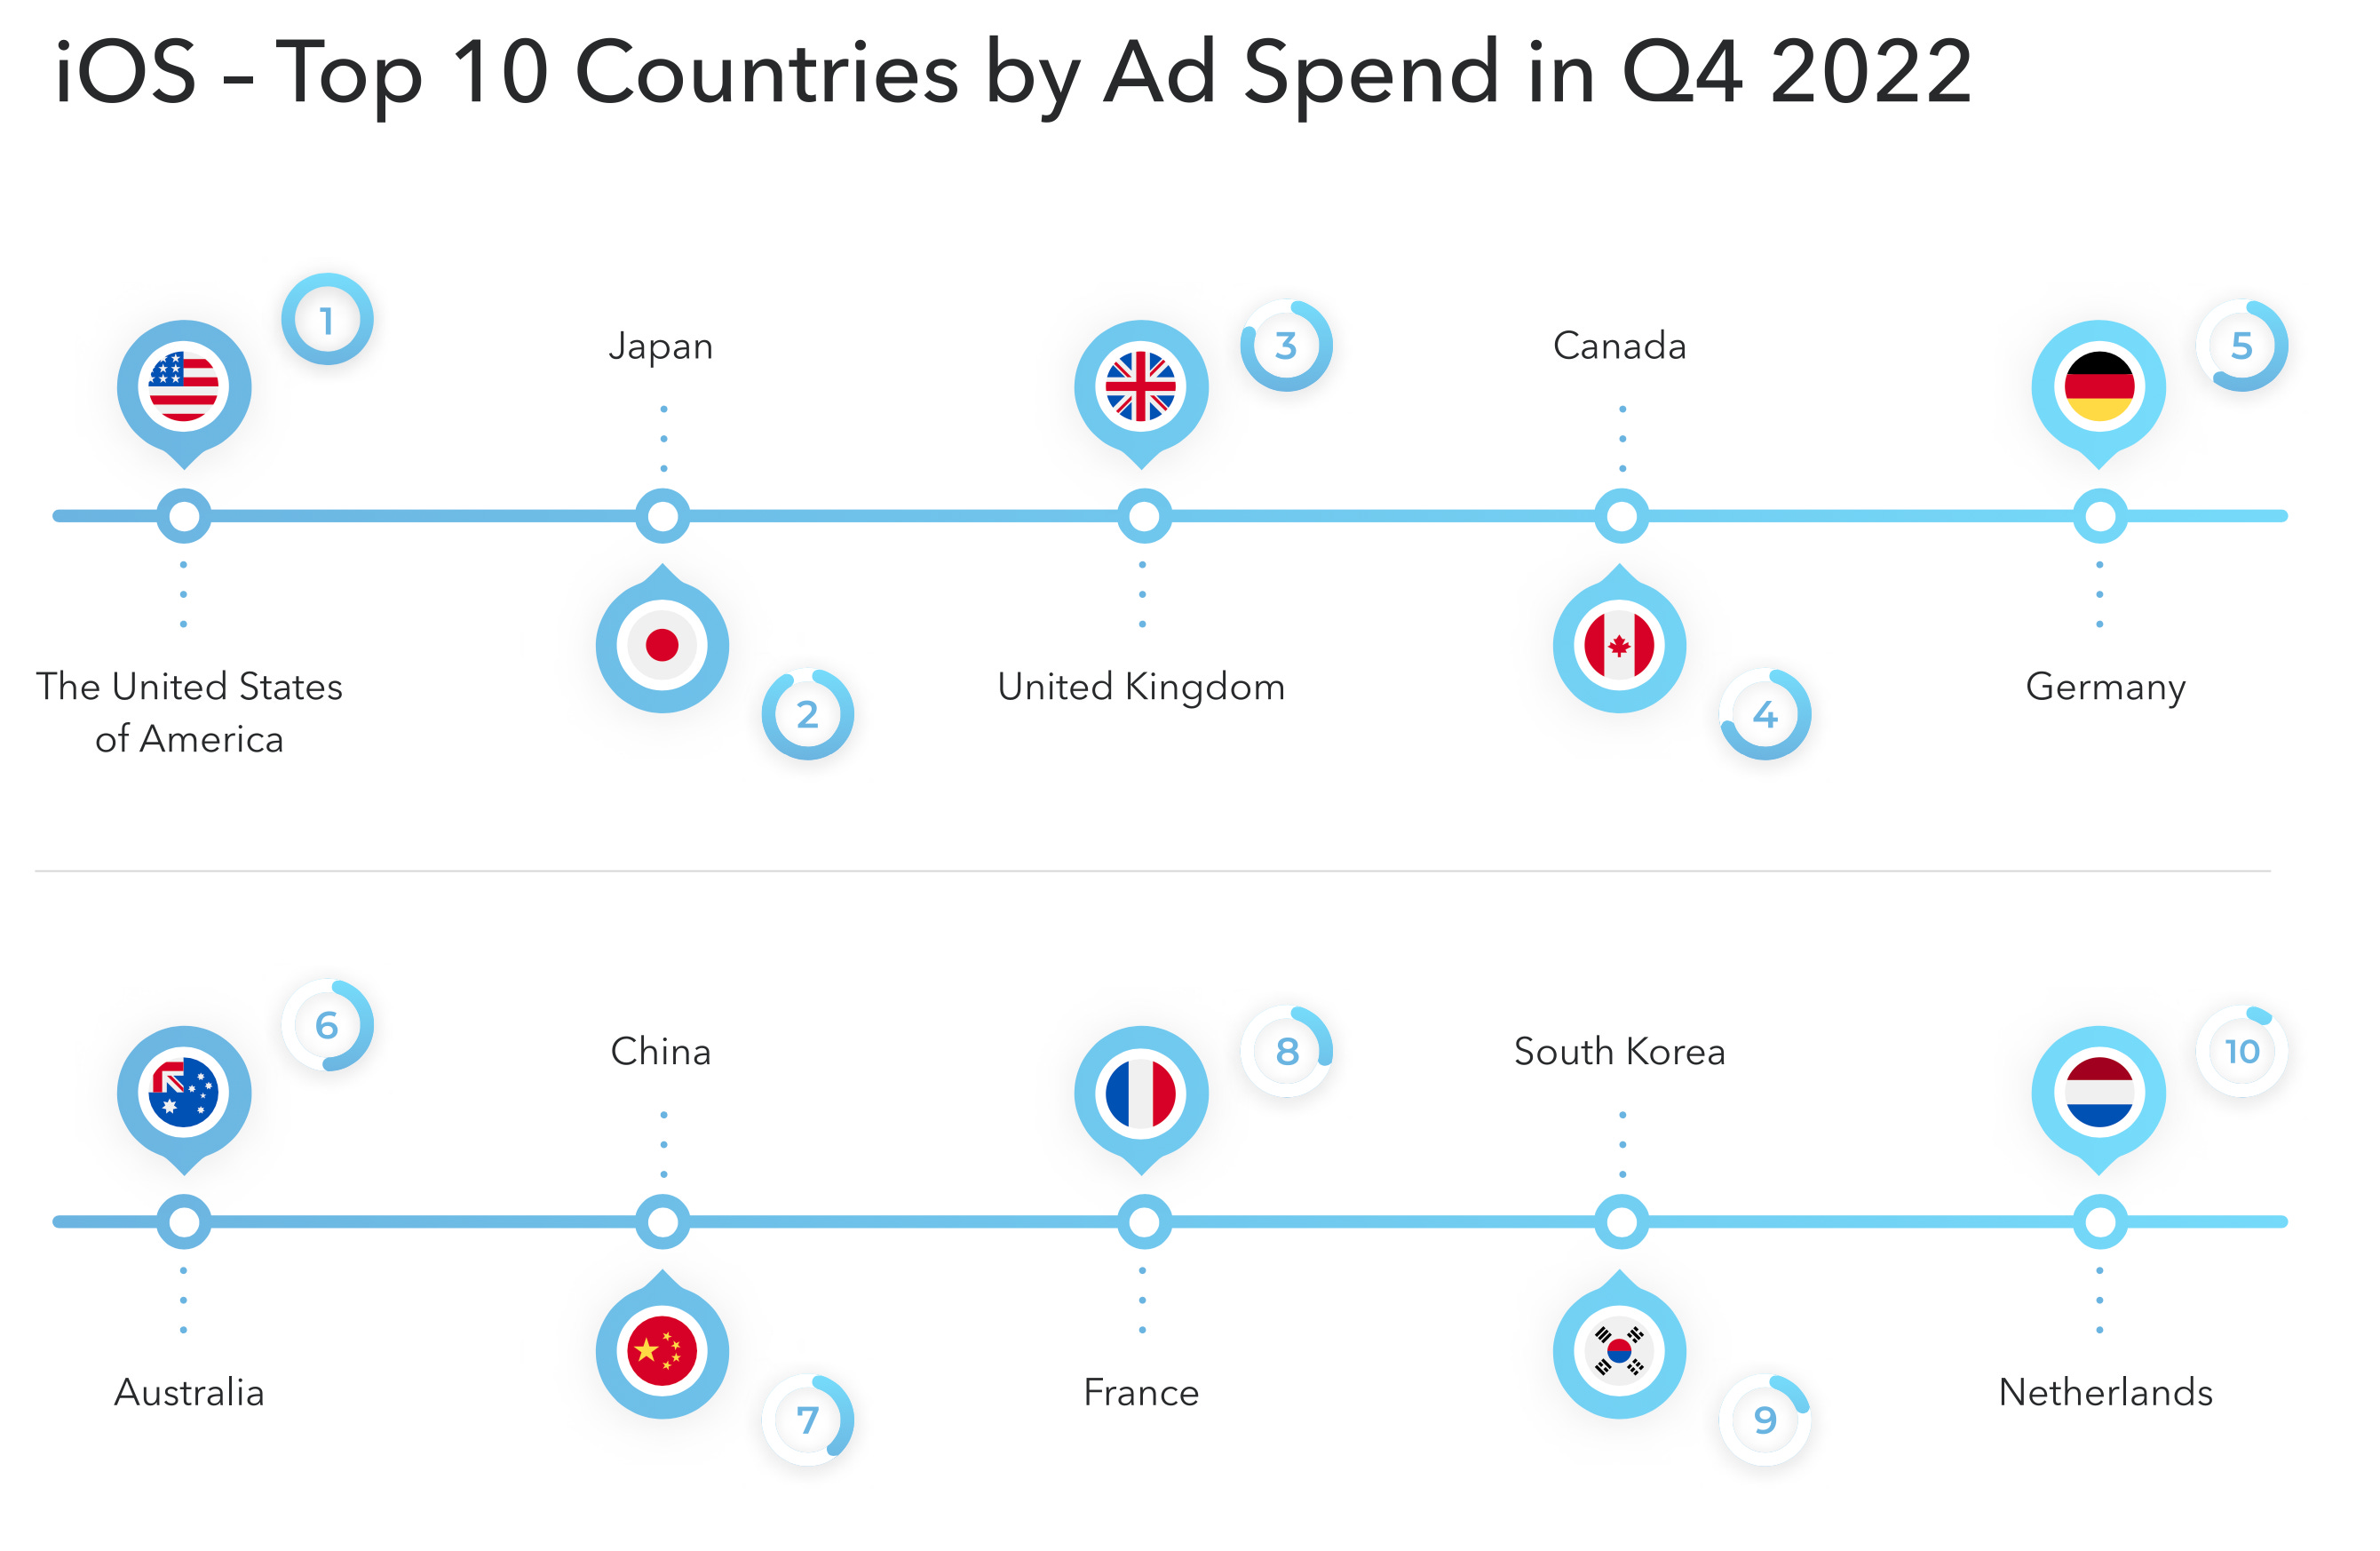
The US (CPI - $0.65), Japan (CPI - $0.61), the UK (CPI - $0.39), Canada (CPI - $0.49), and France (CPI - $0.33) are leaders on iOS by marketing spend.
AppLovin, Google Ads, Mintegral, Meta & ironSource are Android's most popular ad networks. The lowest median CPI has Mintegral ($0.12), highest - Snapchat ($0.6).

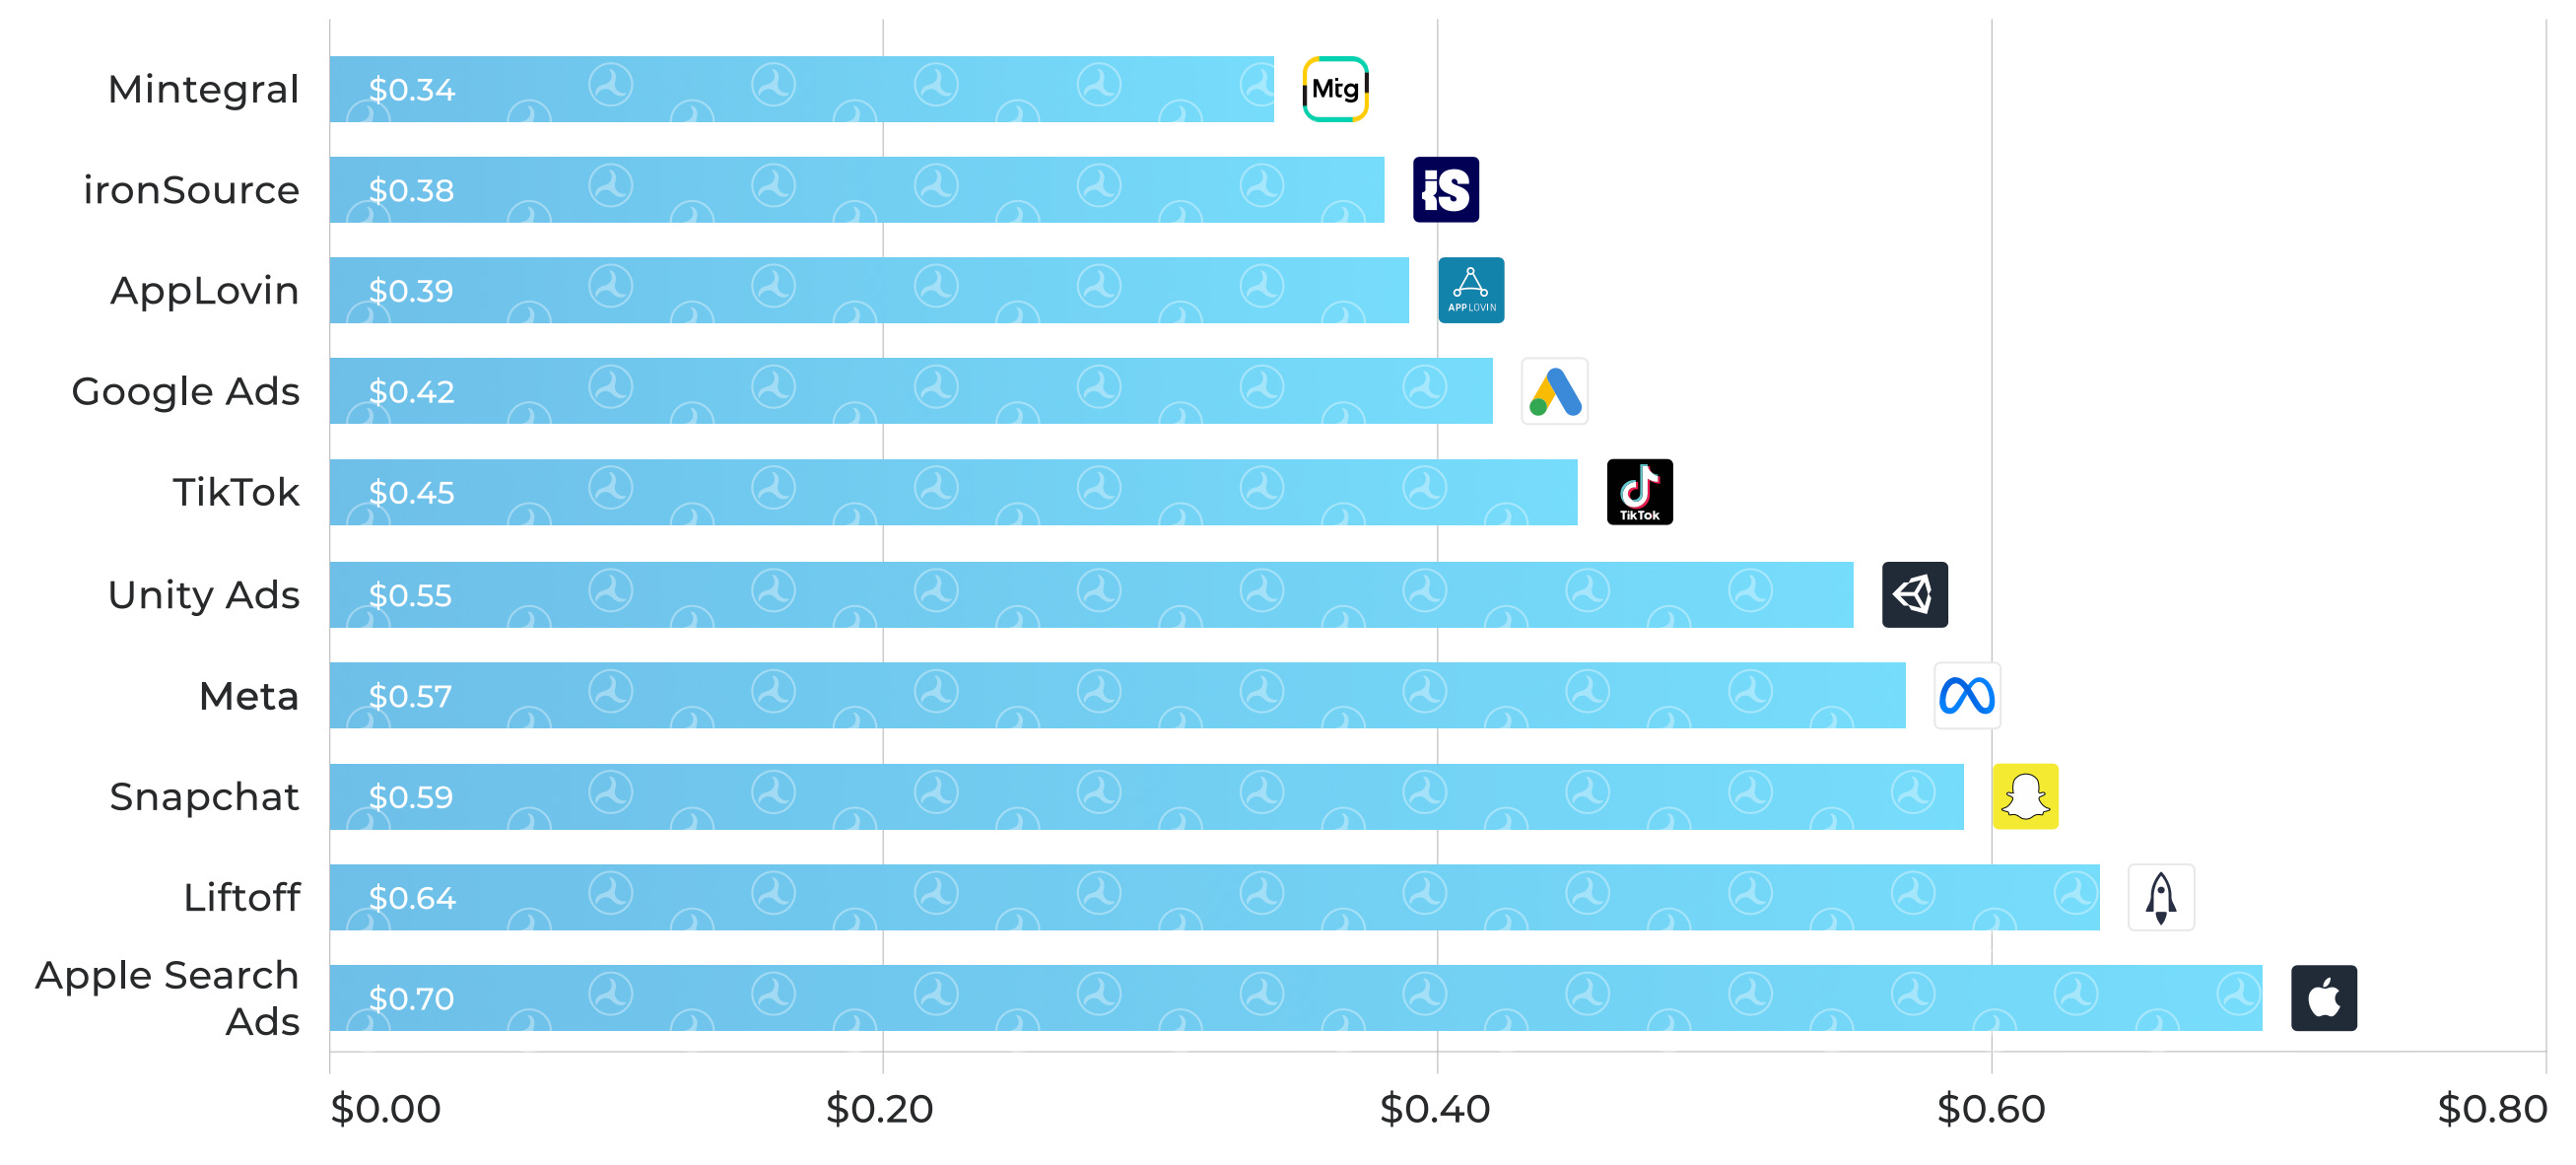
AppLovin, Mintegral, ironSource, TikTok, and Google Ads are the iOS most popular ad networks. Mintegral as on Android has the lowest median CPI ($0.34); while Apple Search Ads has the highest ($0.7).
Product metrics
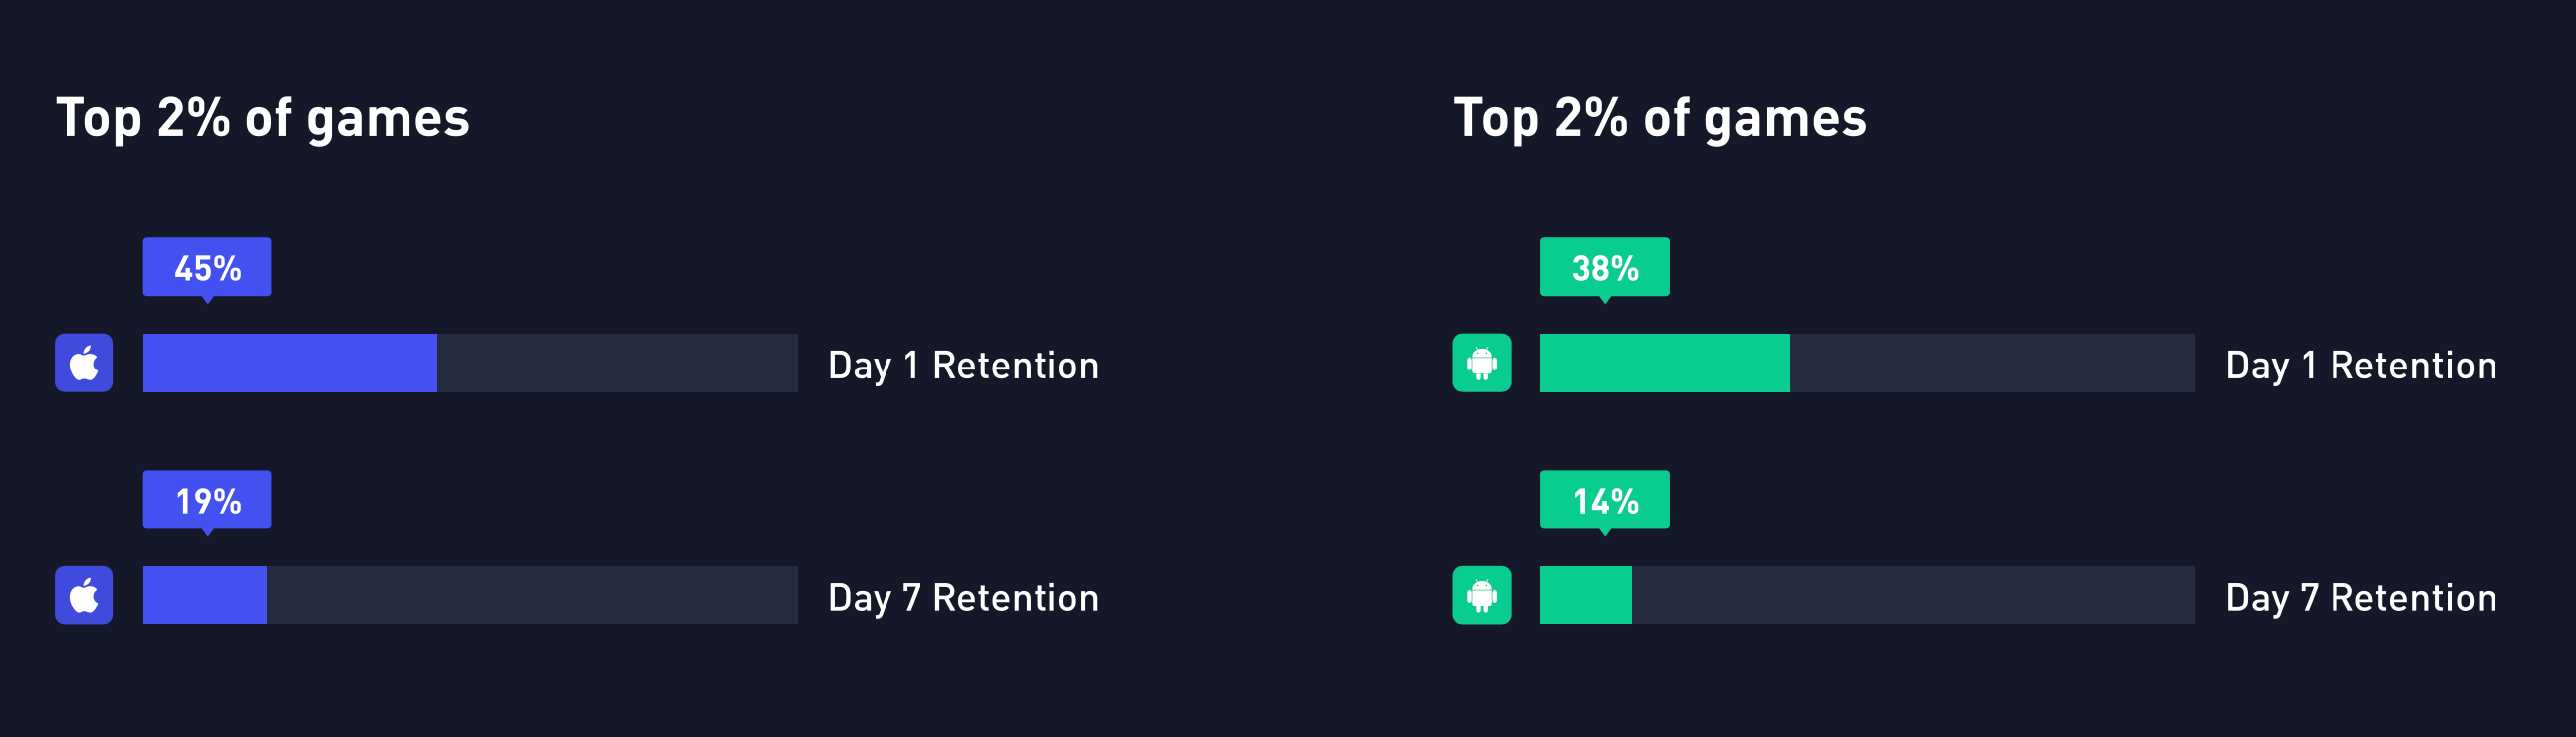
An average D1 Retention of the top-2% of hypercasual games in Q4 2022 was 45% on iOS and 38% on Android. An average D7 Retention on iOS was 19% and 14% on Android.
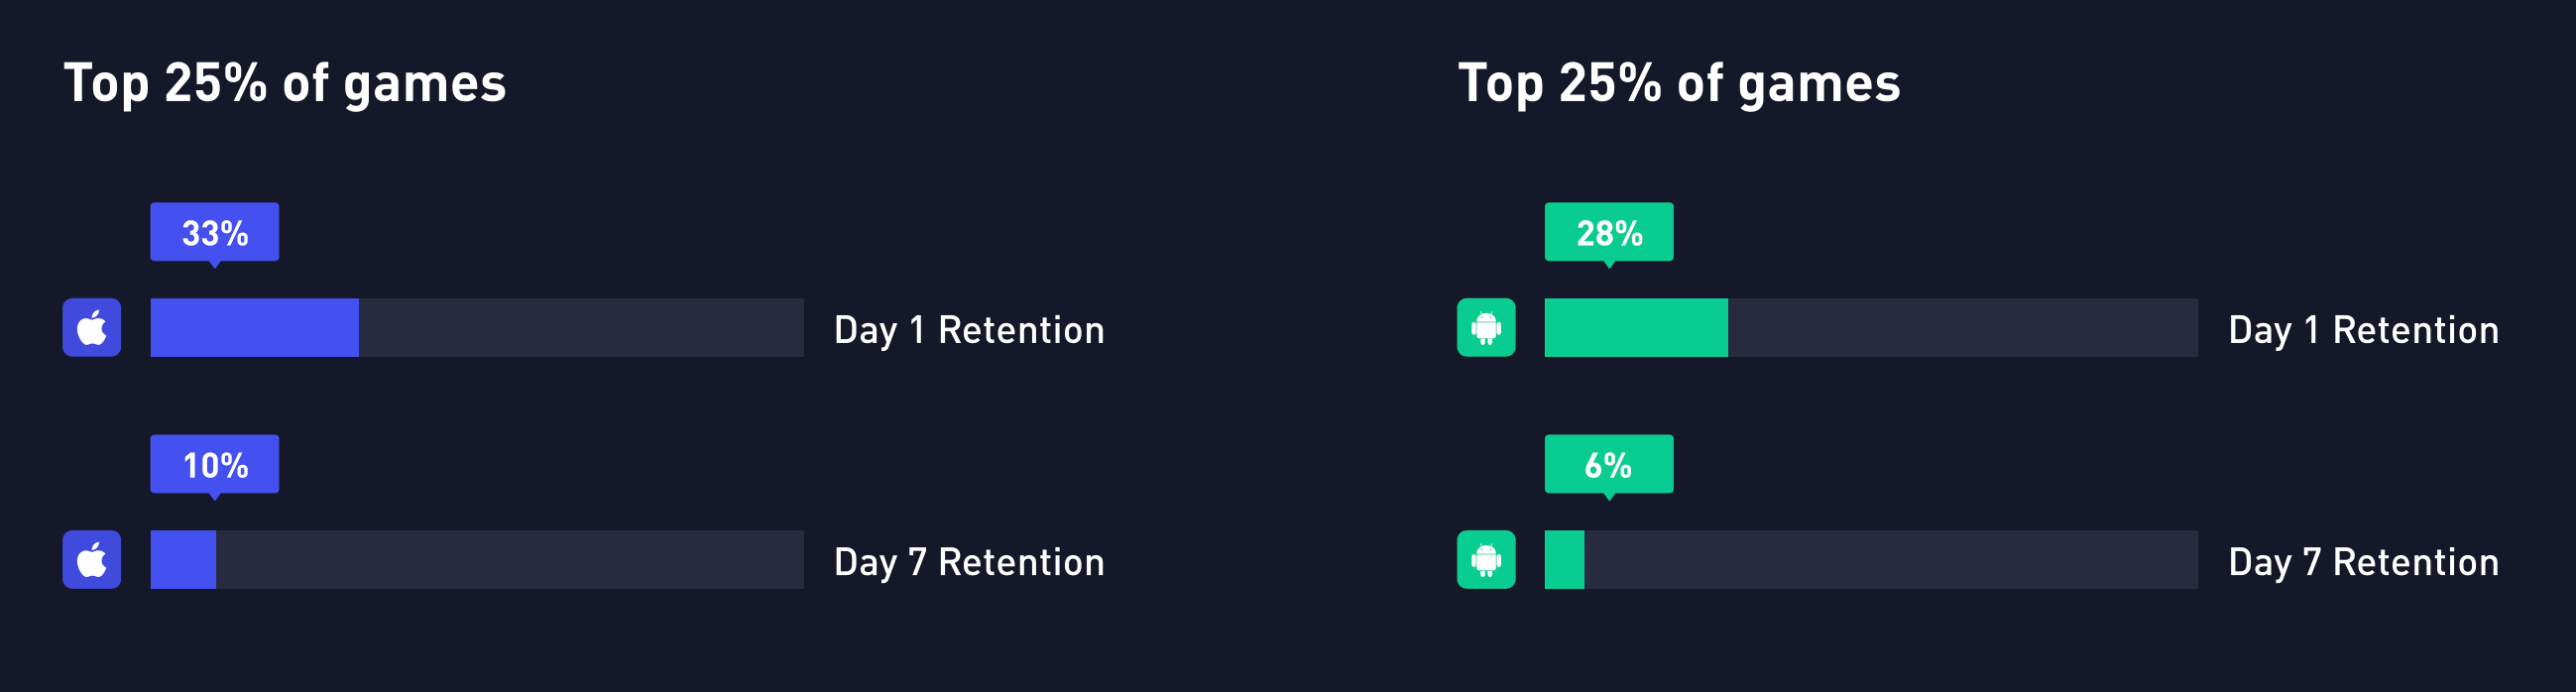
Among the top-25% of games, an average D1 Retention on iOS was 33%; on Android - 28%. D7 Retention on iOS - 10%; on Android - 6%.
Median D1 Retention across all hypercasual games in Q4 2022 on iOS was 24%; on Android - 23%. Median D7 Retention on iOS was 7% with only 4% on Android.
