Unity: Mobile User Acquisition and Monetization trends in 2024
A lot of data from the industry leader with a special focus on offerwalls.
Data was collected from ironSource, Unity Ads, and Tapjoy.
Trend 1: Advertisers are diversifying their UA campaign optimization
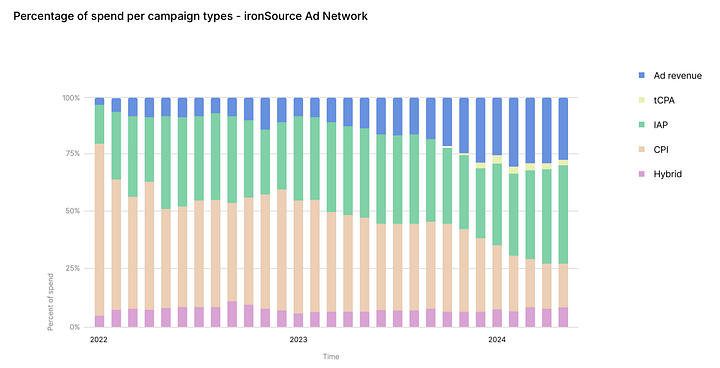

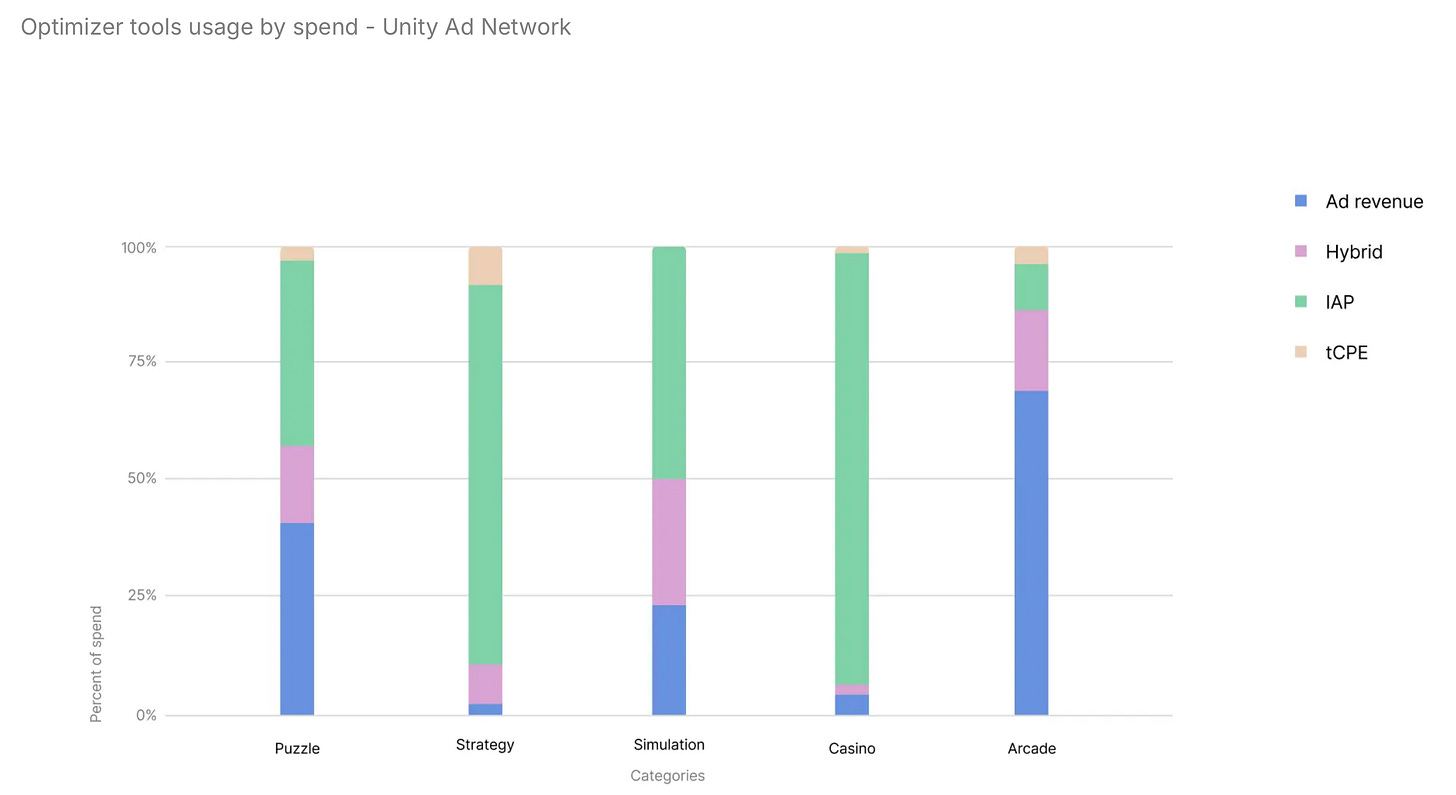
Over the past two years, advertisers have increased their spending on campaigns optimized for ad revenue, IAP (in-app purchases), and hybrid ROAS (return on ad spend). There's also a rise in campaigns with tCPA (target cost per action) and tCPE (target cost per event), while interest in CPI (cost per install) campaigns is declining.
When looking at D7 ROAS (7-day return on ad spend) targets, leaders in spending still primarily optimize for ad revenue, but optimization for IAP + ad revenue is gaining popularity.
In the top 5 game genres across countries, the mix of optimizations varies greatly. For example, puzzle games equally use optimizations for ad revenue and IAP, while IAP optimization dominates in casino games.
Regarding event optimization, according to ironSource data, the most popular options include level completion, free trial registration, making an IAP, or watching a certain number of ads.
❗️Unity advises selecting an action performed by the top 5-20% of high-LTV users during their first seven days in the game. However, the company notes that the more complex the action, the lower the conversion rate, and the longer the campaign will take to learn.
Benchmarks for IPM (installs per mille) by genre: Arcade (24 IPM), Simulation (14.9 IPM), Action (10.9 IPM), Puzzle (10.3 IPM), Strategy (7.1 IPM).
Trend 2: It’s difficult to convert users into payers
On average, only 1.83% of users make an IAP. However, 26.5% of users who made a purchase once will make at least one more purchase within 30 days. Another 1.37% will do so within 60 days, and 0.46% within 90 days.
❗️Unity recommends adapting offers to the user’s stage in the game.
In-game currency sells well at all stages of the user’s lifecycle, with limited-time offers and bundles being particularly effective.
Games with high IAP revenue also see higher views of Rewarded Video ads.
Trend 3: More users are watching ads
User interaction with ads increased by 3.2% in 2023, with Tier 1 and Tier 2 countries leading the growth. This is likely due to worsening economic conditions, prompting users to seek other ways to gain in-game bonuses.
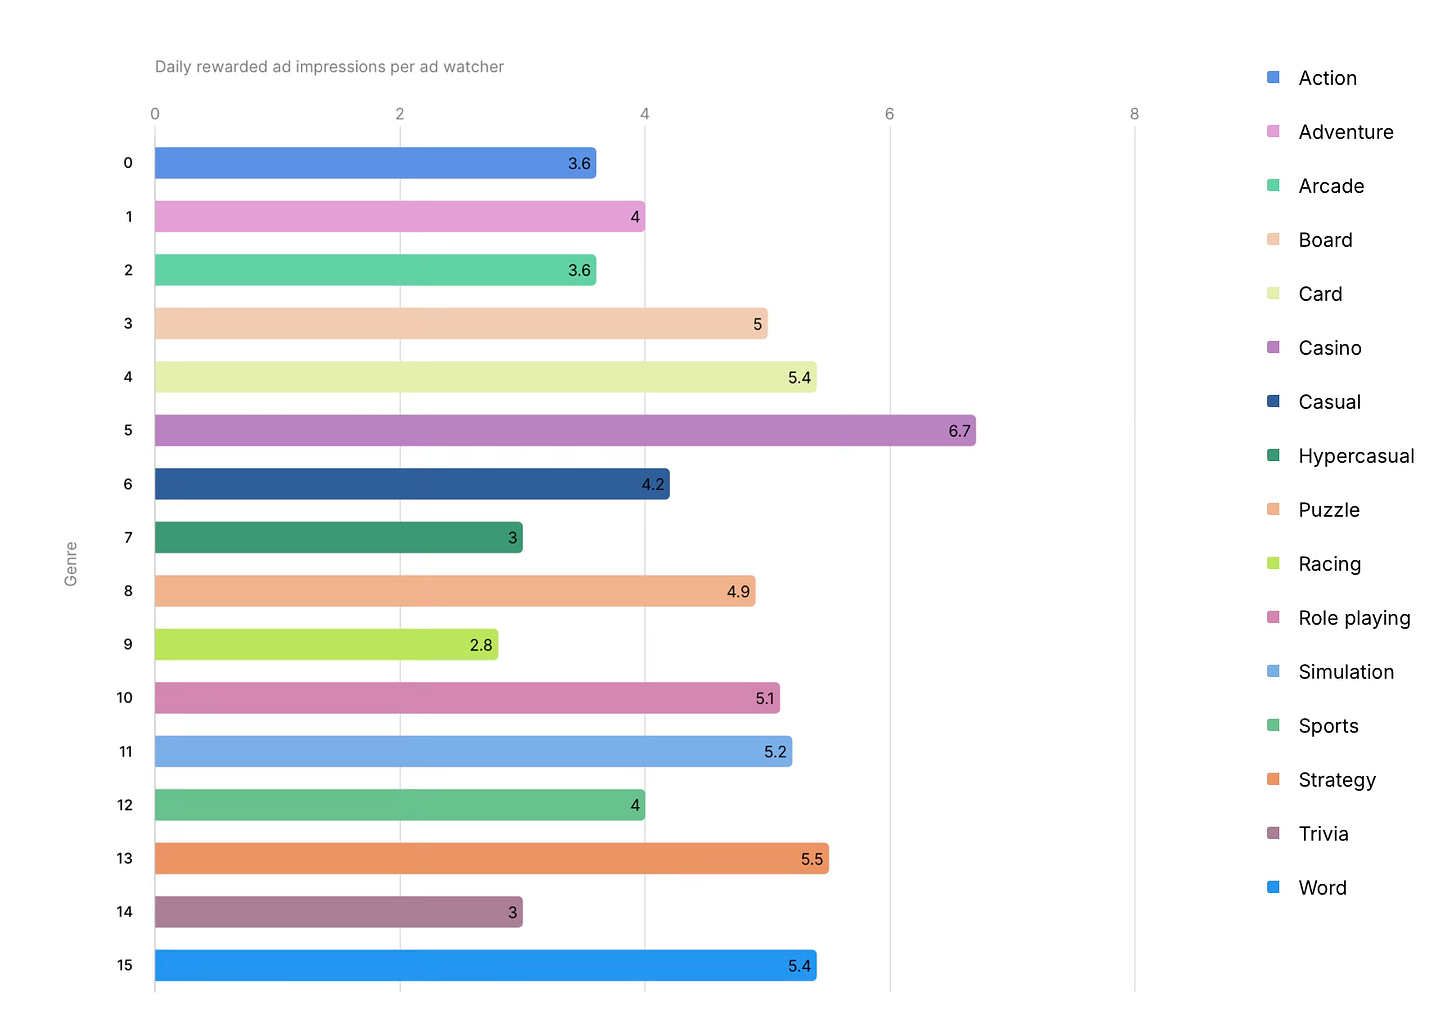
Rewarded Video ads are most popular in RPGs, casual, and word games.
The most ad views are seen in casino, strategy, and word games.
The right placement of Rewarded Ads increases views. Offering ads when the user runs out of resources results in a 38.1% conversion rate, while the conversion rate for ad views between levels is 23.8%.
Consider subscribing to the GameDev Reports Premium tier to support the newsletter. Get access to the list of curated articles & archive of Gaming Reports that I’ve been collecting since 2020.
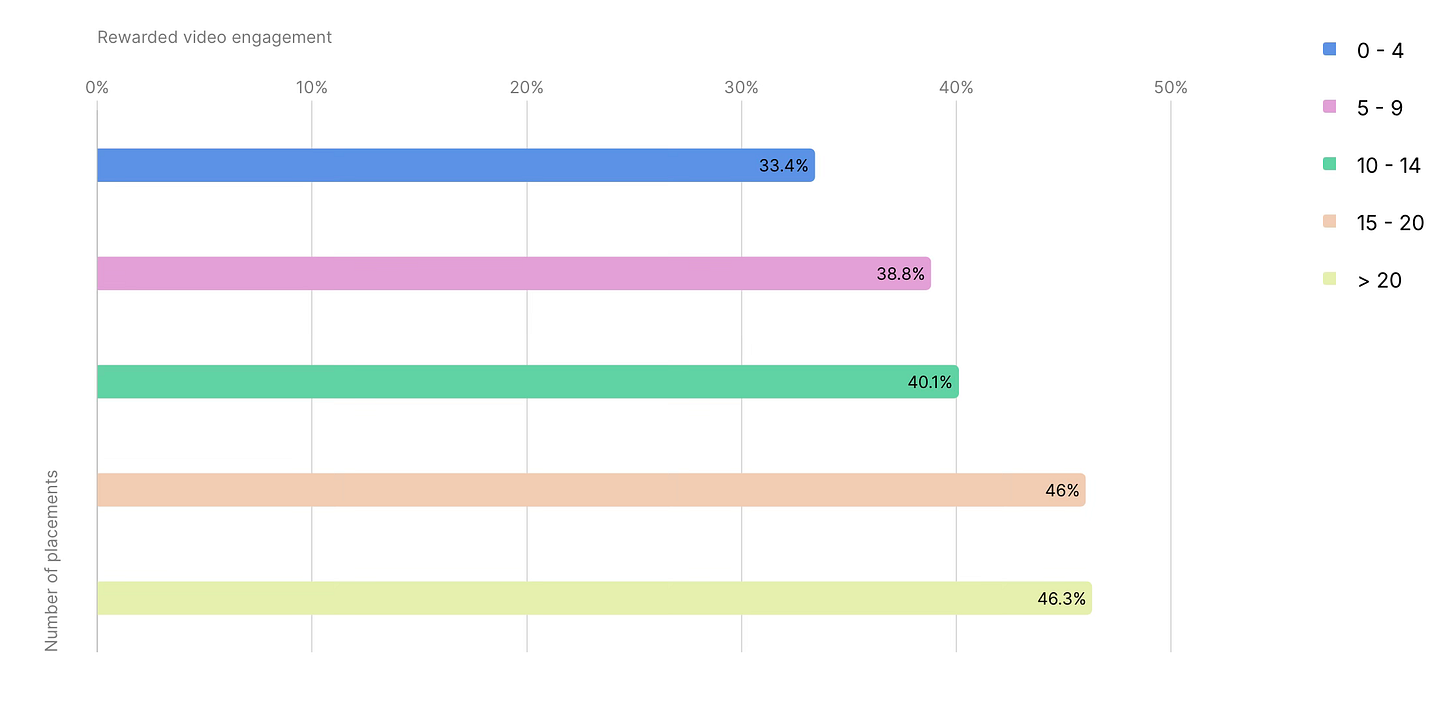
There’s a direct correlation between the number of Rewarded Ad placements and conversion rates. However, after 15-20 placements, conversion growth almost stops.
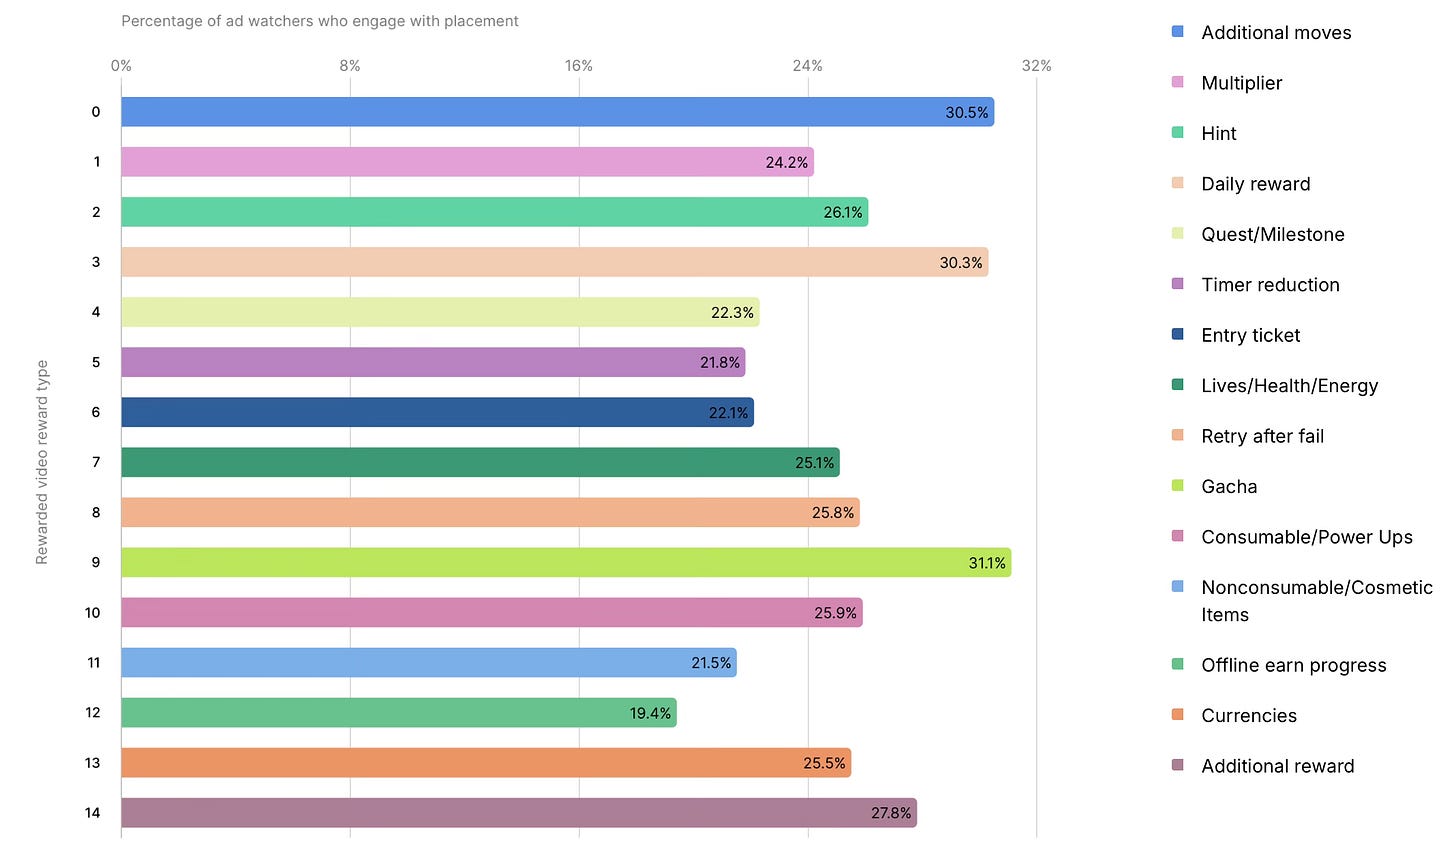
Gacha (31.1% conversion), extra moves (30.5%), and daily rewards (30.3%) are the top motivators for watching Rewarded Ads.
Trend 4: Offerwalls can attract highly motivated users
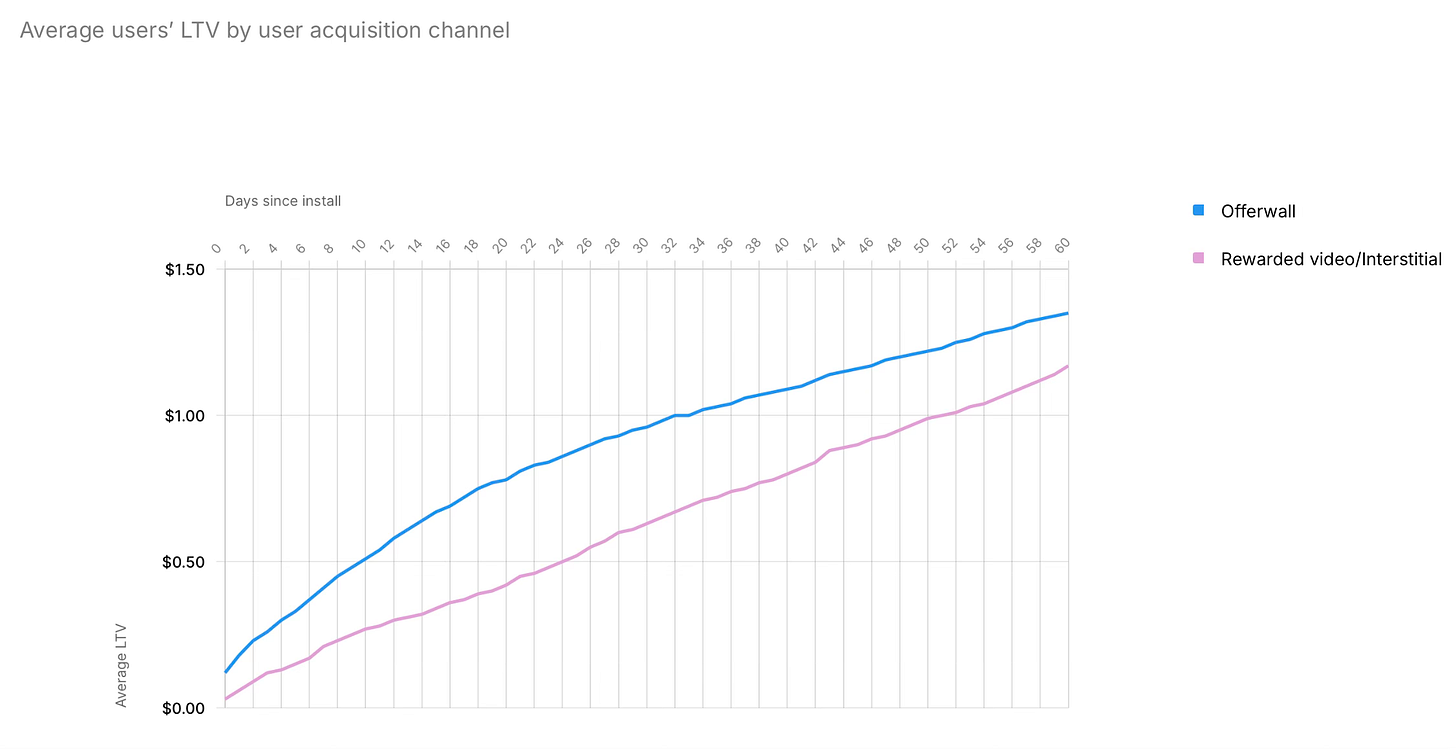
Users who come through offerwalls tend to have a higher LTV than those who come after watching other types of ads. The difference on the day of installation is 299%, decreasing to 16% by day 60.
❗️In the long run, users' motivation might not be as high.
Retention rates for users acquired through offerwalls are generally higher than for users who came through Rewarded Video or interstitial ads. The D7 difference is 71.7%, but it decreases to 12% by D30.


MR-CPE (Multiple Reward Cost Per Engagement) campaigns are some of the best in terms of results. In 24.2% of these campaigns, there are 3 to 6 steps; 37.3% have 7 to 10 steps; and 23.2% have 11 to 14 steps.
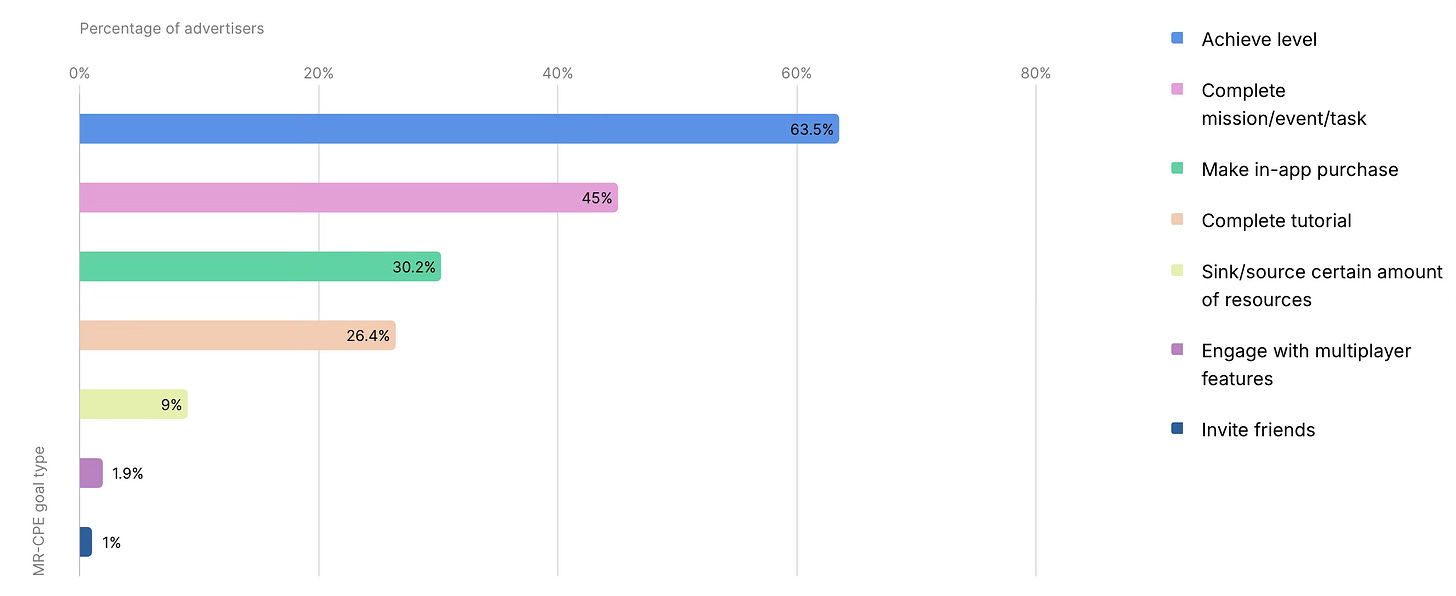
MR-CPE campaigns allow setting time limits. 63.5% of advertisers tie level completion to a time limit, 45% tie certain tasks, 30.2% tie IAP completion, and 26.4% tie tutorial completion to time limits.
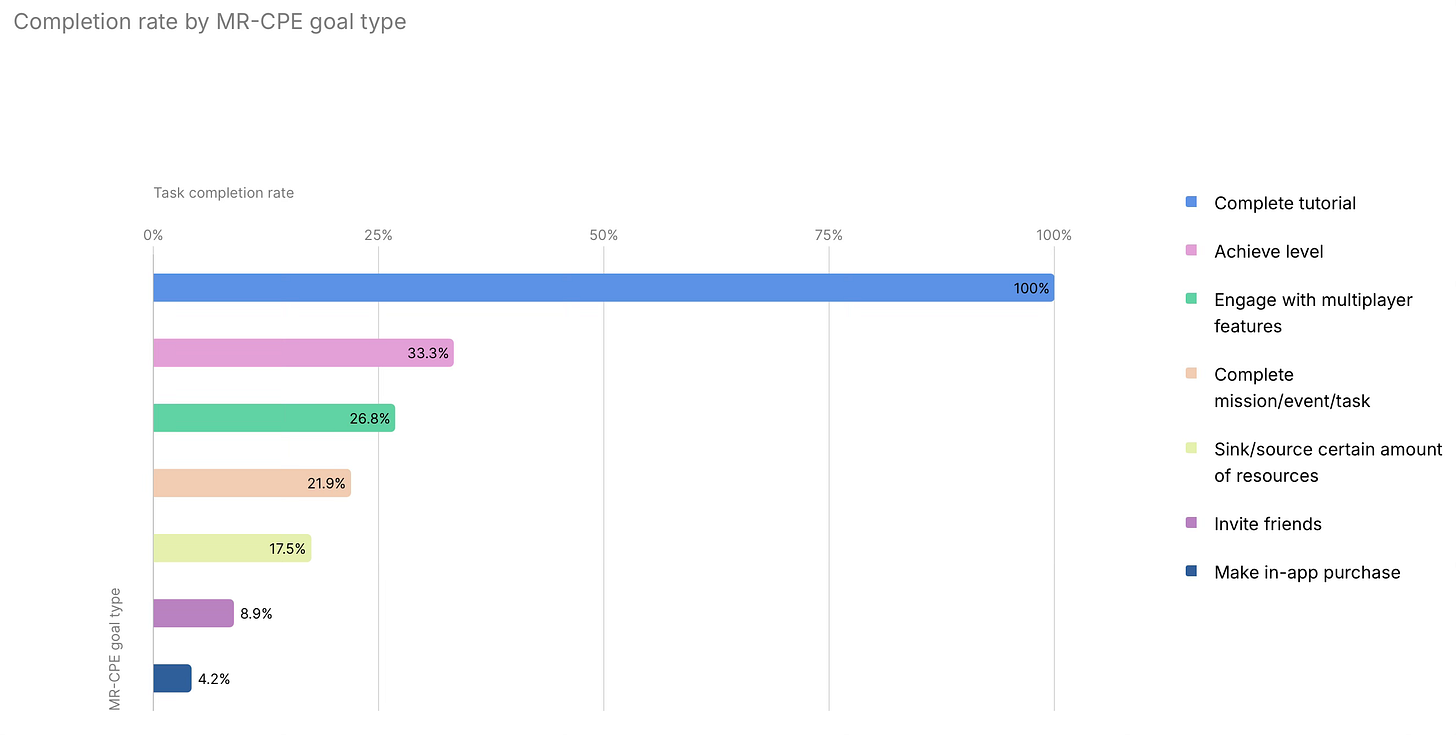
The more complex the task, the lower the conversion rate. Almost 100% of users complete tasks tied to tutorial completion, but only 4.2% complete tasks related to IAP purchases.
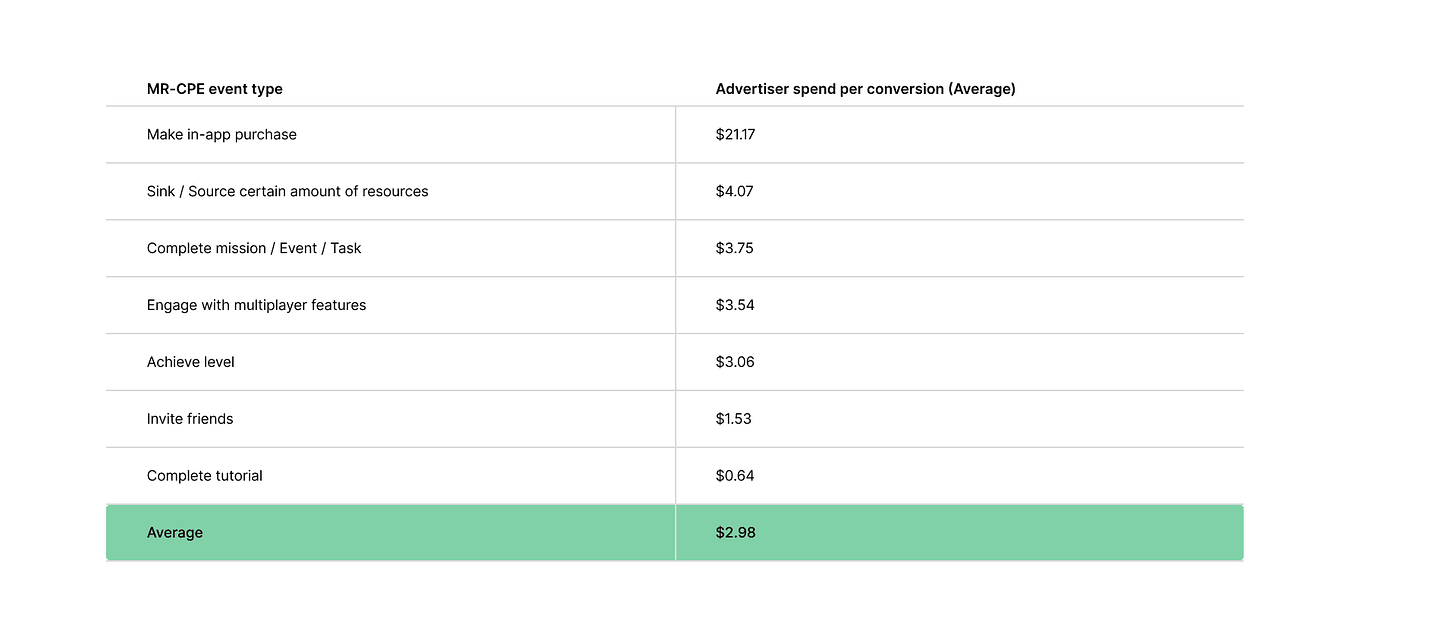
The average cost per paying user in the MR-CPE model is $21.17. A user who completes the tutorial is much cheaper at $0.64.
Trend 5: Offerwalls complement IAP revenue
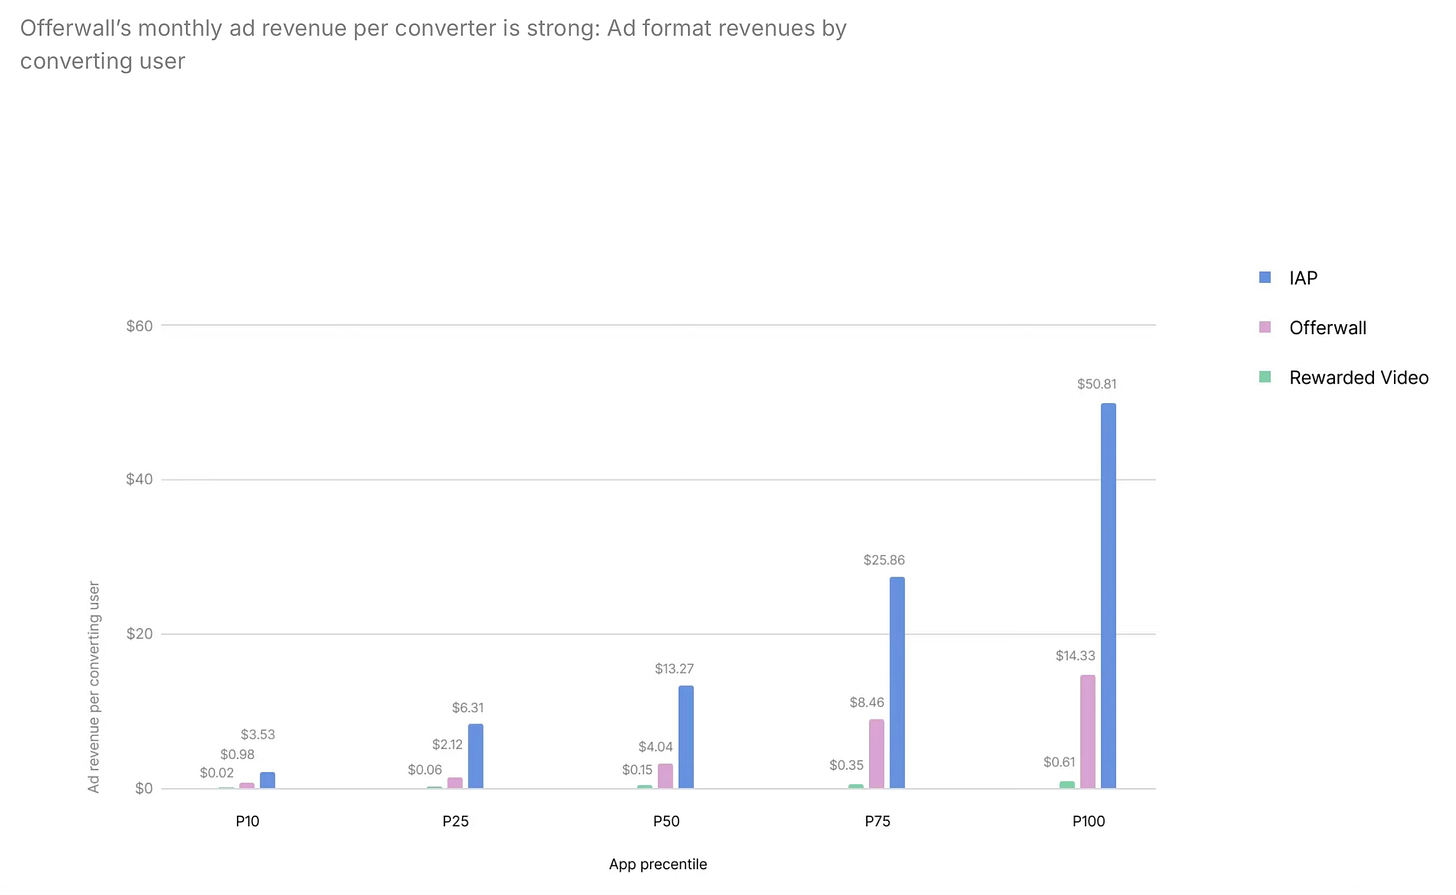
According to Unity, monthly ad revenue from offerwalls exceeds average ad revenue from Rewarded Videos. For the 50th percentile, monthly IAP revenue per paying user is $13.27, revenue from the same user via offerwalls is $4.04, and revenue from Rewarded Video is $0.15.
Offerwalls located in the lobby or on the main screen of a game are opened more often. The same goes for pop-ups.


