



Reports of the week:
Sensor Tower: The Gaming Market in H1'26
Niko Partners: India’s Gaming Market in 2026
CADPA: The Chinese Gaming Market in H1’26
Amir Satvat: Layoffs in the Gaming Industry in 2026
Circana: The U.S. Video Game Market in July 2026
Sensor Tower: The Gaming Market in H1'26
All numbers are collected until June 30, 2026.
Mobile Market
IAP revenue is gross (before store commission); it includes paid downloads, in-app purchases, and subscriptions. Ad revenue and third-party purchases are not counted. Downloads are counted once per Apple or Google account.
Sensor Tower doesn’t count D2C revenue, third-party store revenue, or Android revenue in China.
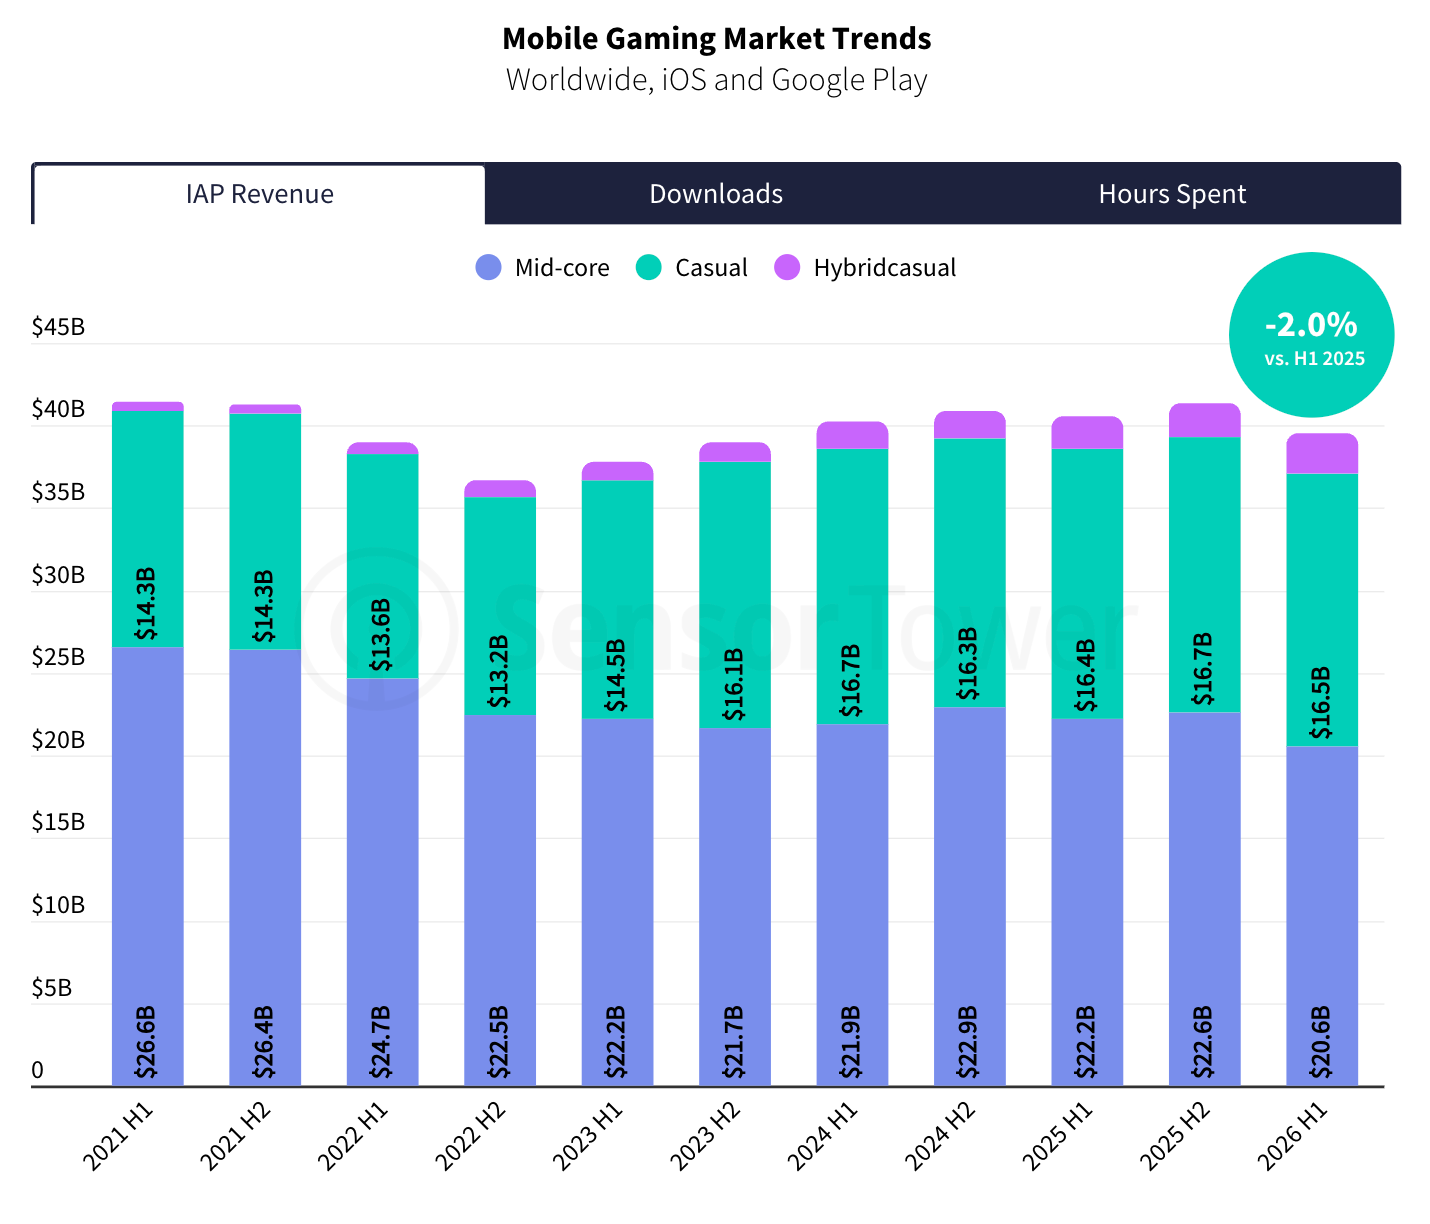
Mobile games earned $40 billion in IAP revenue (-2.0% YoY). By IAP revenue, the hybrid casual segment is growing, and casual projects are holding steady. But the mid-core genre is losing revenue.
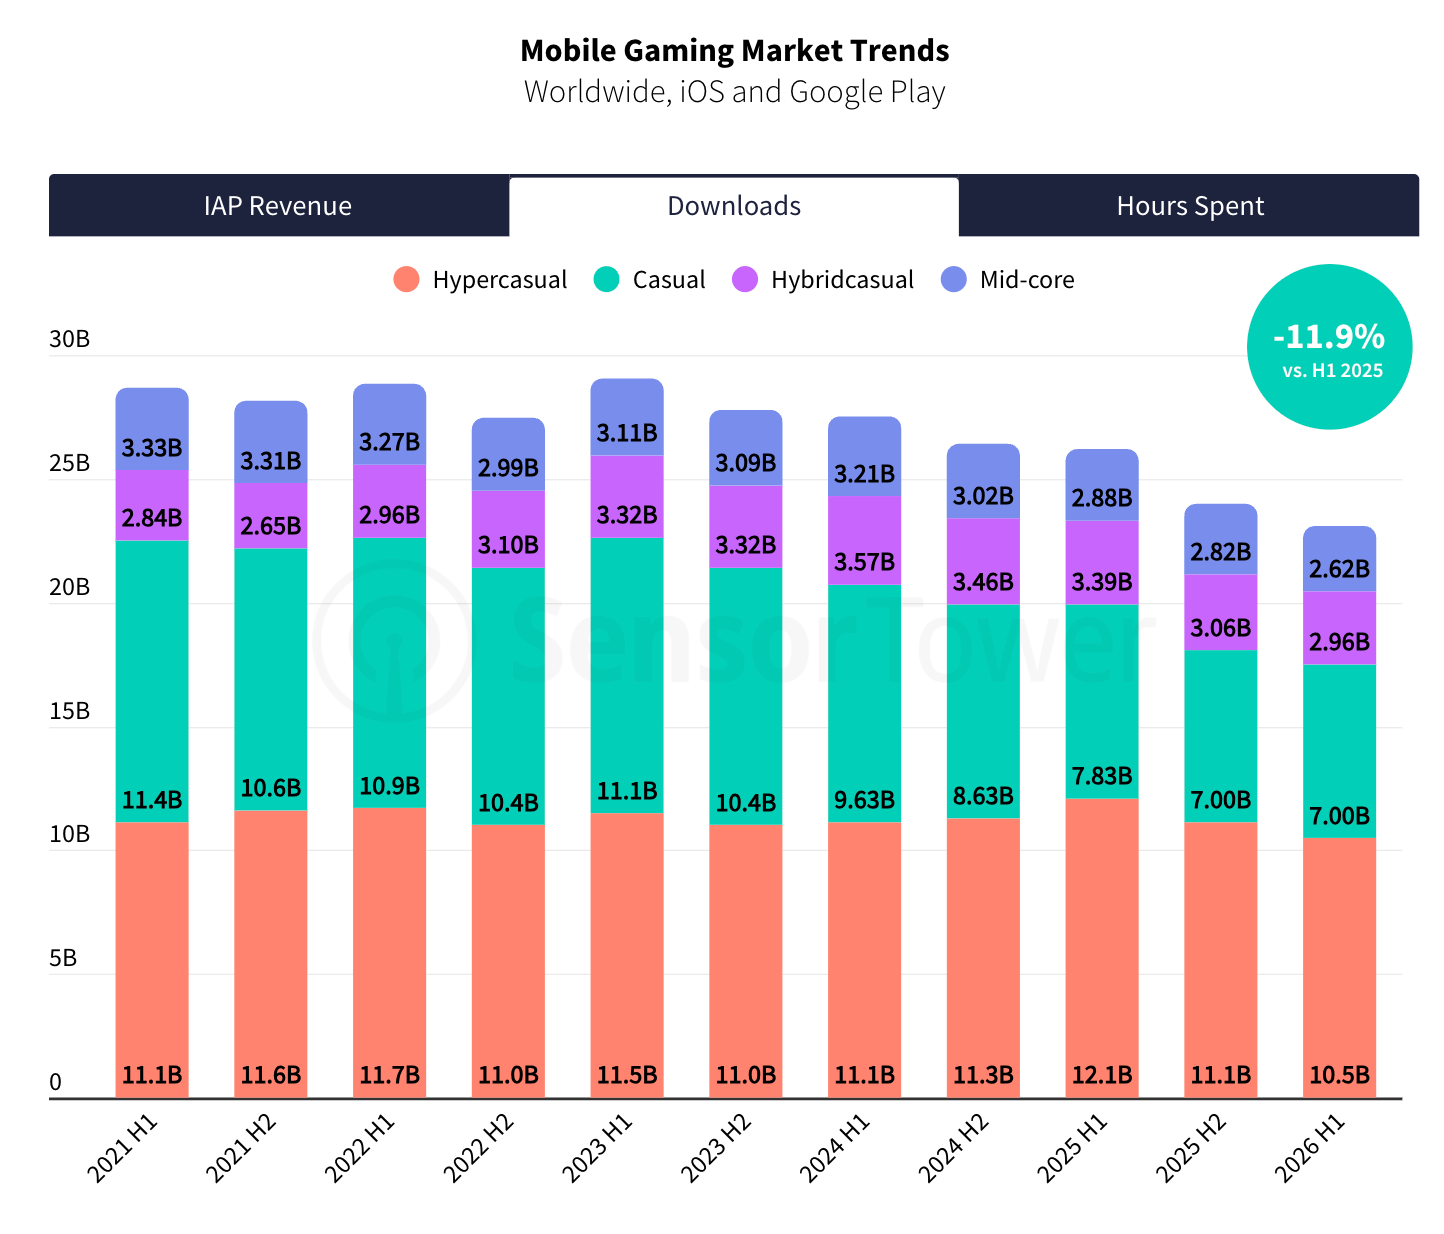
Downloads fell to 24 billion (-11.9% YoY), and total playtime was 221 billion hours (the same as in the first half of 2025).
A word from our sponsor

Game studios run on contractors — artists, composers, QA testers, translators — often spread across a dozen countries. That’s a lot of contracts, tax rules, and IP clauses to track. Mellow handles all of it: compliant contracts, automated payments, and IP protection built in, for contractors in 150+ countries.
Hypercasual games lost the most downloads.
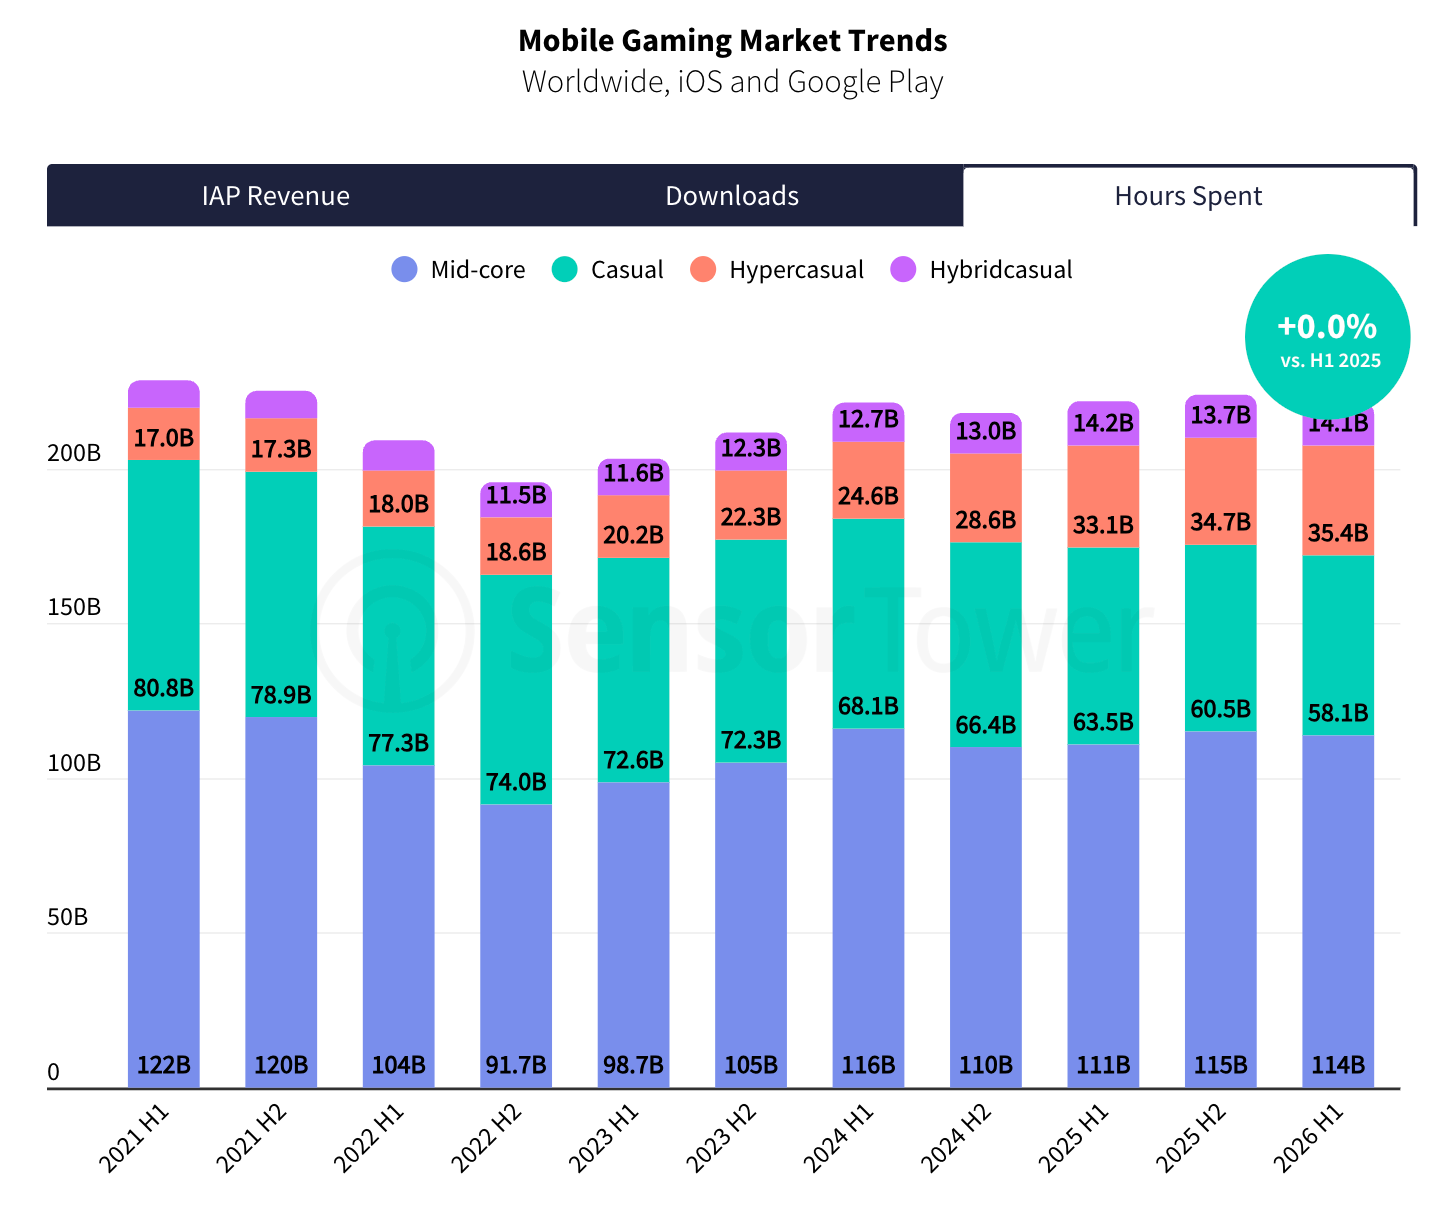
People played casual projects less (in hours) and spent more time in mid-core projects. That didn’t translate into revenue growth, though. The games people spend the most time in are Roblox (which Sensor Tower classifies as mid-core), Garena Free Fire and Mobile Legends: Bang Bang.
The US is the largest mobile market by IAP revenue ($12.1 billion; -7% YoY), China is second ($6.46 billion - but without the Android market. In reality China is most likely ahead of the US), with Japan ($4.94 billion; -10% YoY) and South Korea ($2.32 billion; -10% YoY) behind them.
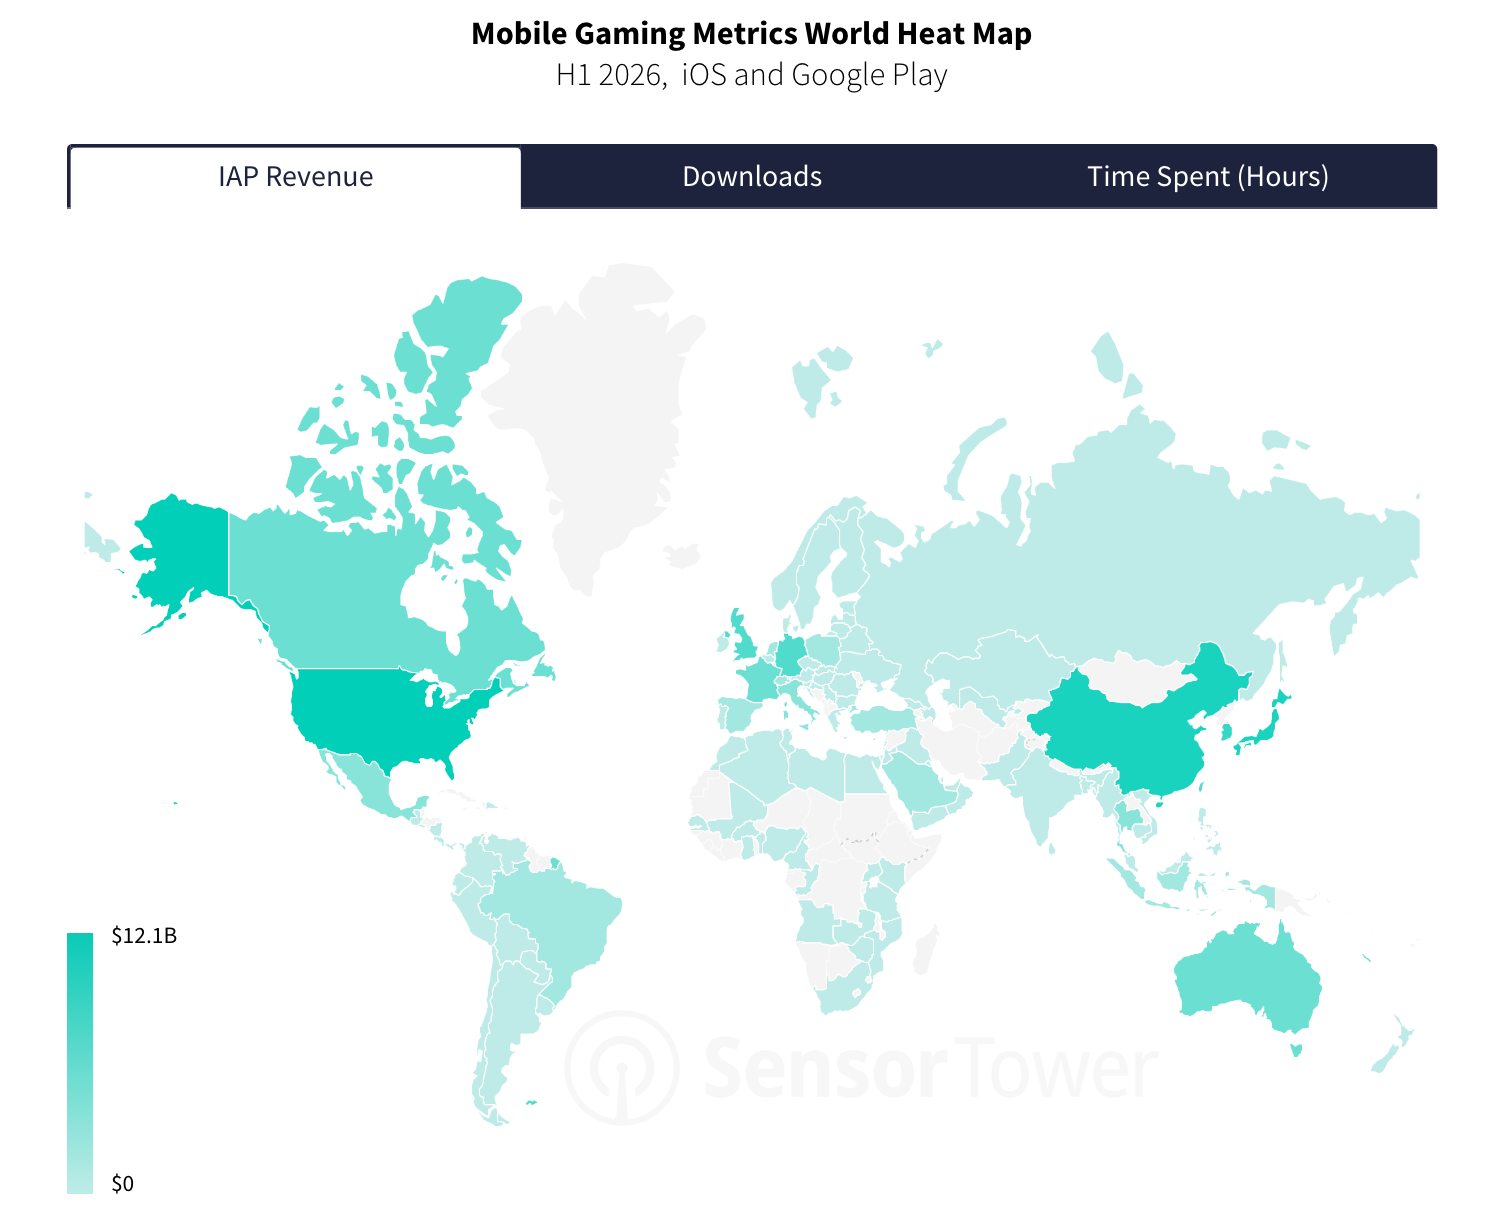
Europe is the only region growing in IAP revenue. On average, it grew 10%, with Germany (+7%), the UK (+10%) and France (+8%) as the main drivers.
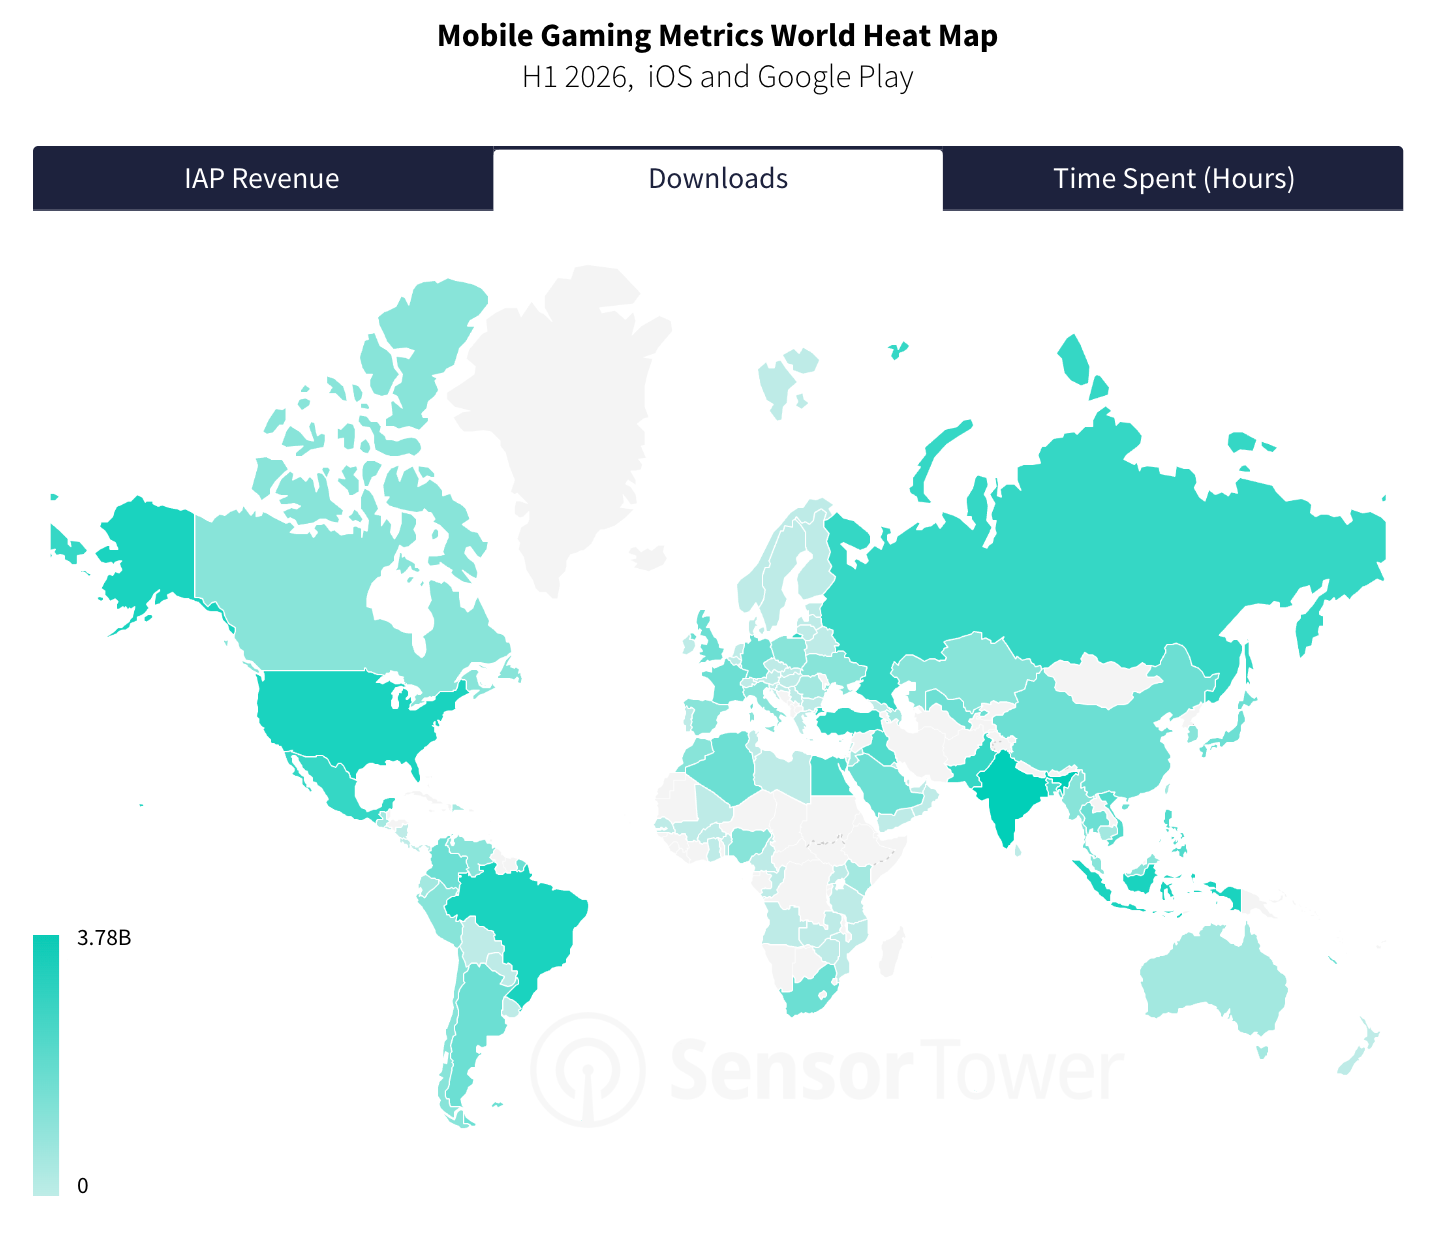
India leads in downloads (3.78 billion installs), Indonesia and India lead in time spent, and Asia accounts for roughly half of all hours mobile users spend in games.
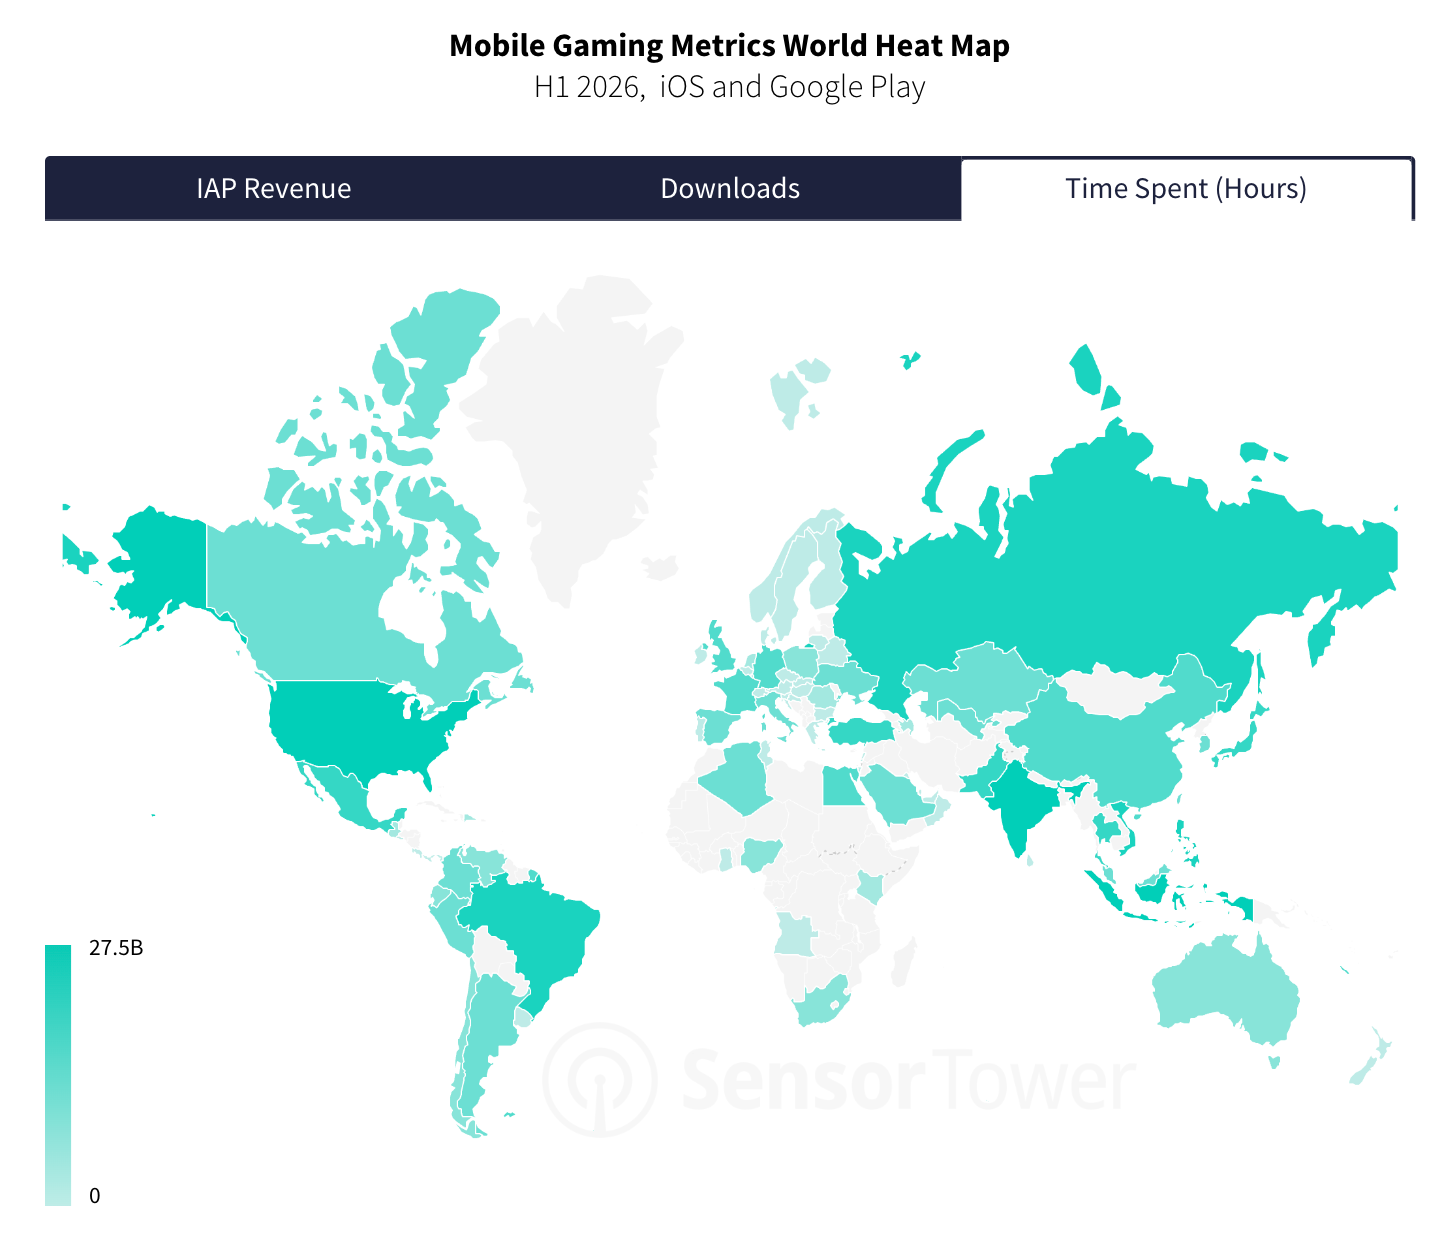
Downloads fell in every large region. Africa held up best (-2%), while several large European and Southeast Asian markets lost close to 20%.
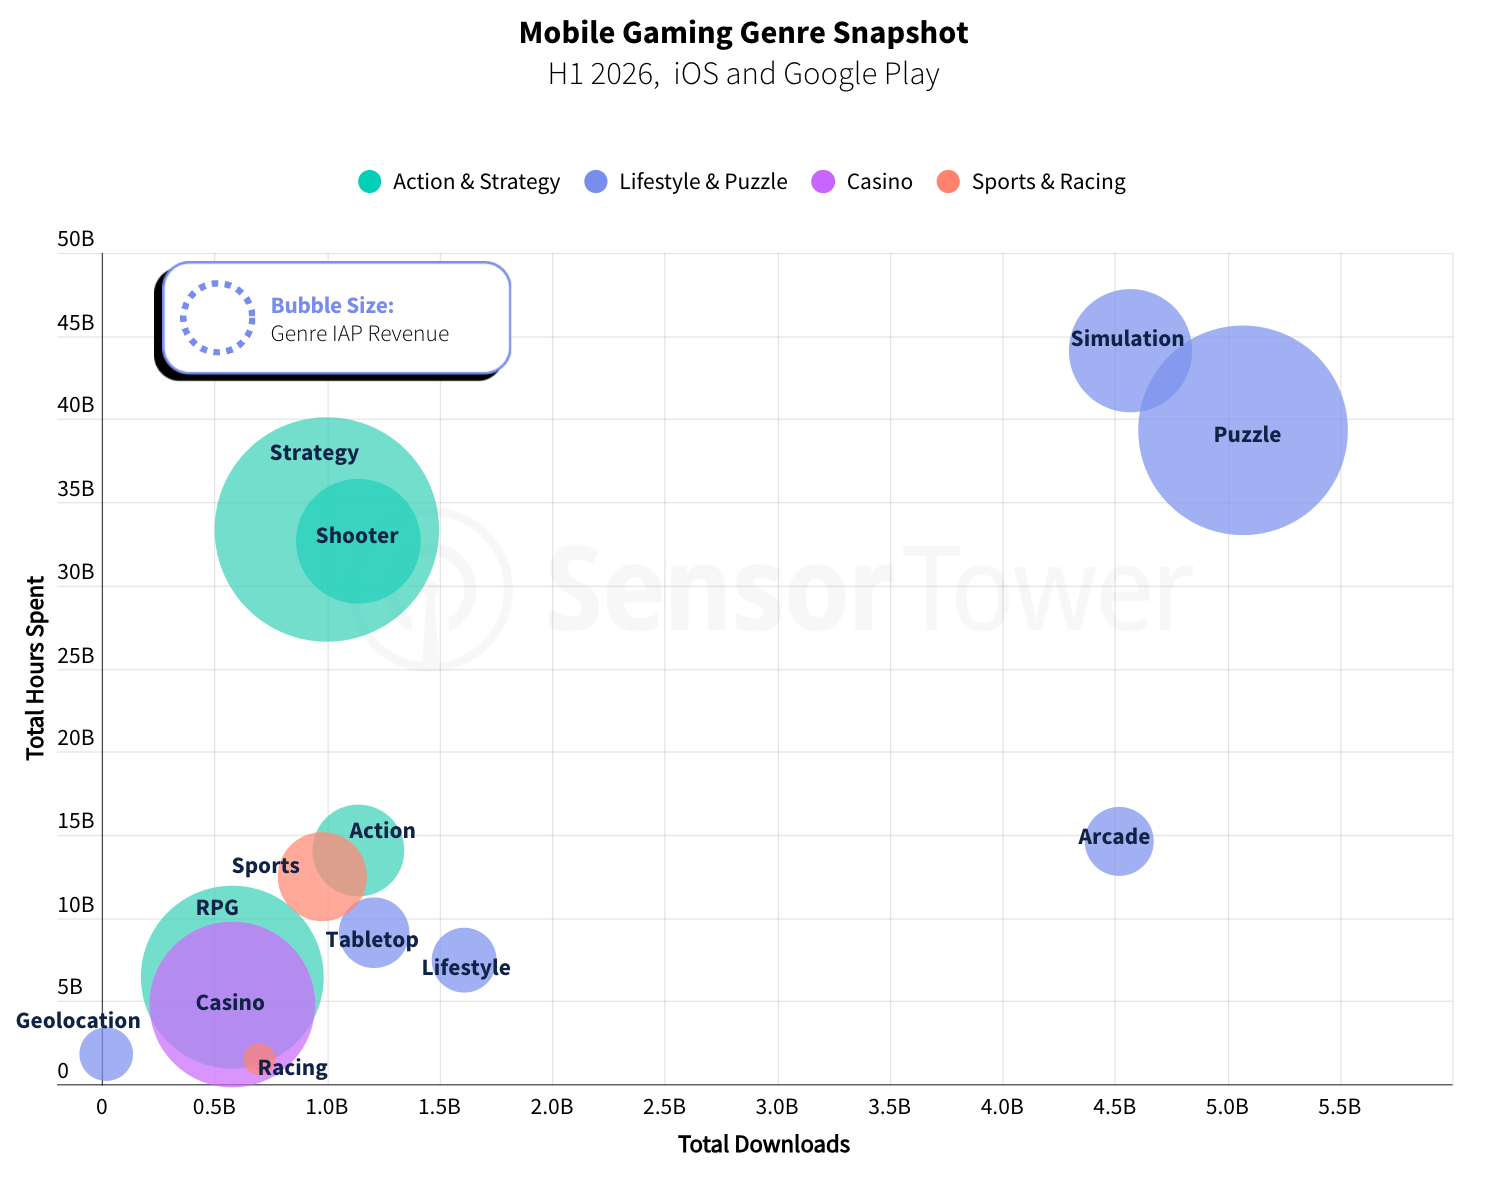
By IAP revenue, Strategy is the largest genre. In H1’26, it earned $9.27 billion; Puzzle was second at $8.07 billion, and RPG third at $6.12 billion.
At the same time, Strategy has only a billion installs in H1’26. For comparison, Puzzle has 5.07 billion, Simulation 4.57 billion, Arcade 4.52 billion.
On hours spent, Simulation leads (44.14 billion hours), followed by Puzzle (39.33), Strategy (33.37), and Shooter (32.69).
Downloads fell by roughly 12% across every genre, but Puzzle IAP revenue grew almost 20% while Strategy fell about 5%. So the revenue gap narrowed from $3 billion to $1.2 billion over the year.
Almost the entire absolute revenue gain came from Puzzle: +$353 million in the US, +$89.2 million in Germany, +$80.2 million in Japan, +$76.3 million in the UK, +$63.5 million in Korea, +$53.3 million in China. Puzzle grew by roughly $1.3 billion compared with H1’25 revenue. That’s about 70% of the entire absolute revenue gain in the market.
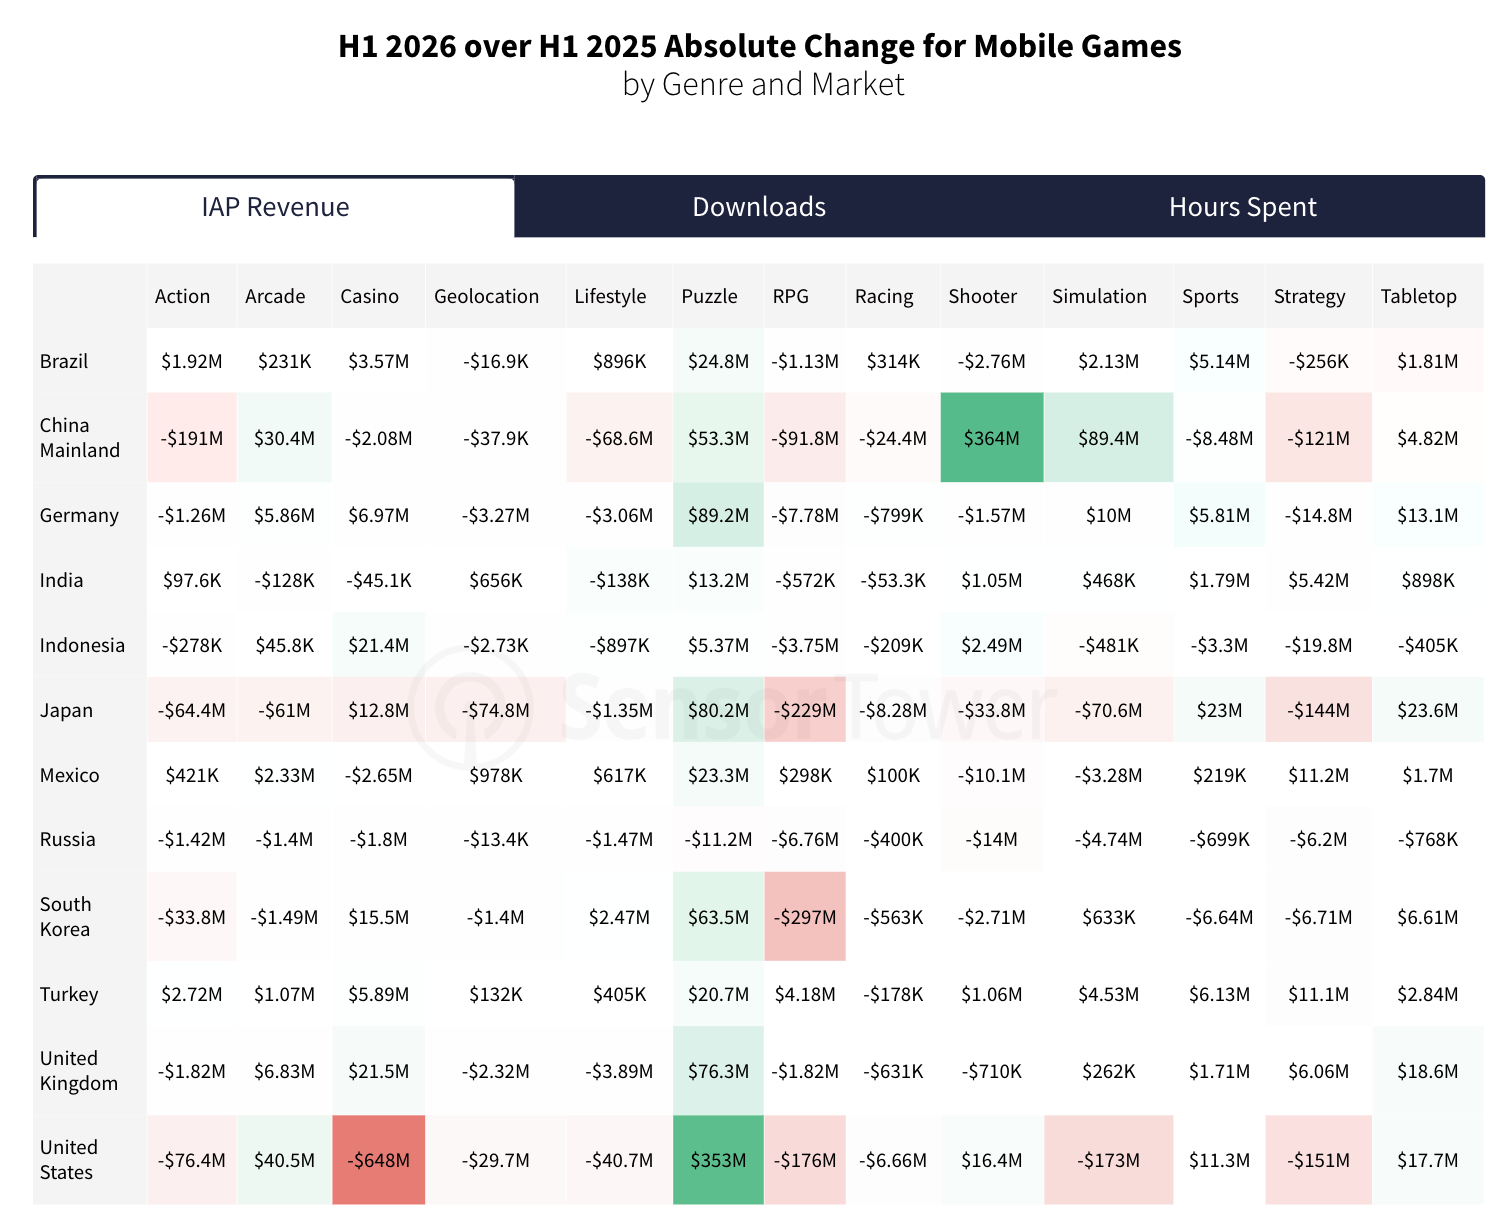
The biggest growth outside Puzzle came from the Shooter category in China (+$364 million), largely thanks to Delta Force. The steepest IAP revenue drops were Casino in the US (-$648 million), RPG in Korea (-$297 million), and RPG in Japan (-$229 million).
❗️Sensor Tower notes that the drop in US Casino IAP revenue is largely explained by the shift to D2C, and that 57% of miHoYo’s US revenue, by their estimate, goes around the stores. So this applies to other genres too.
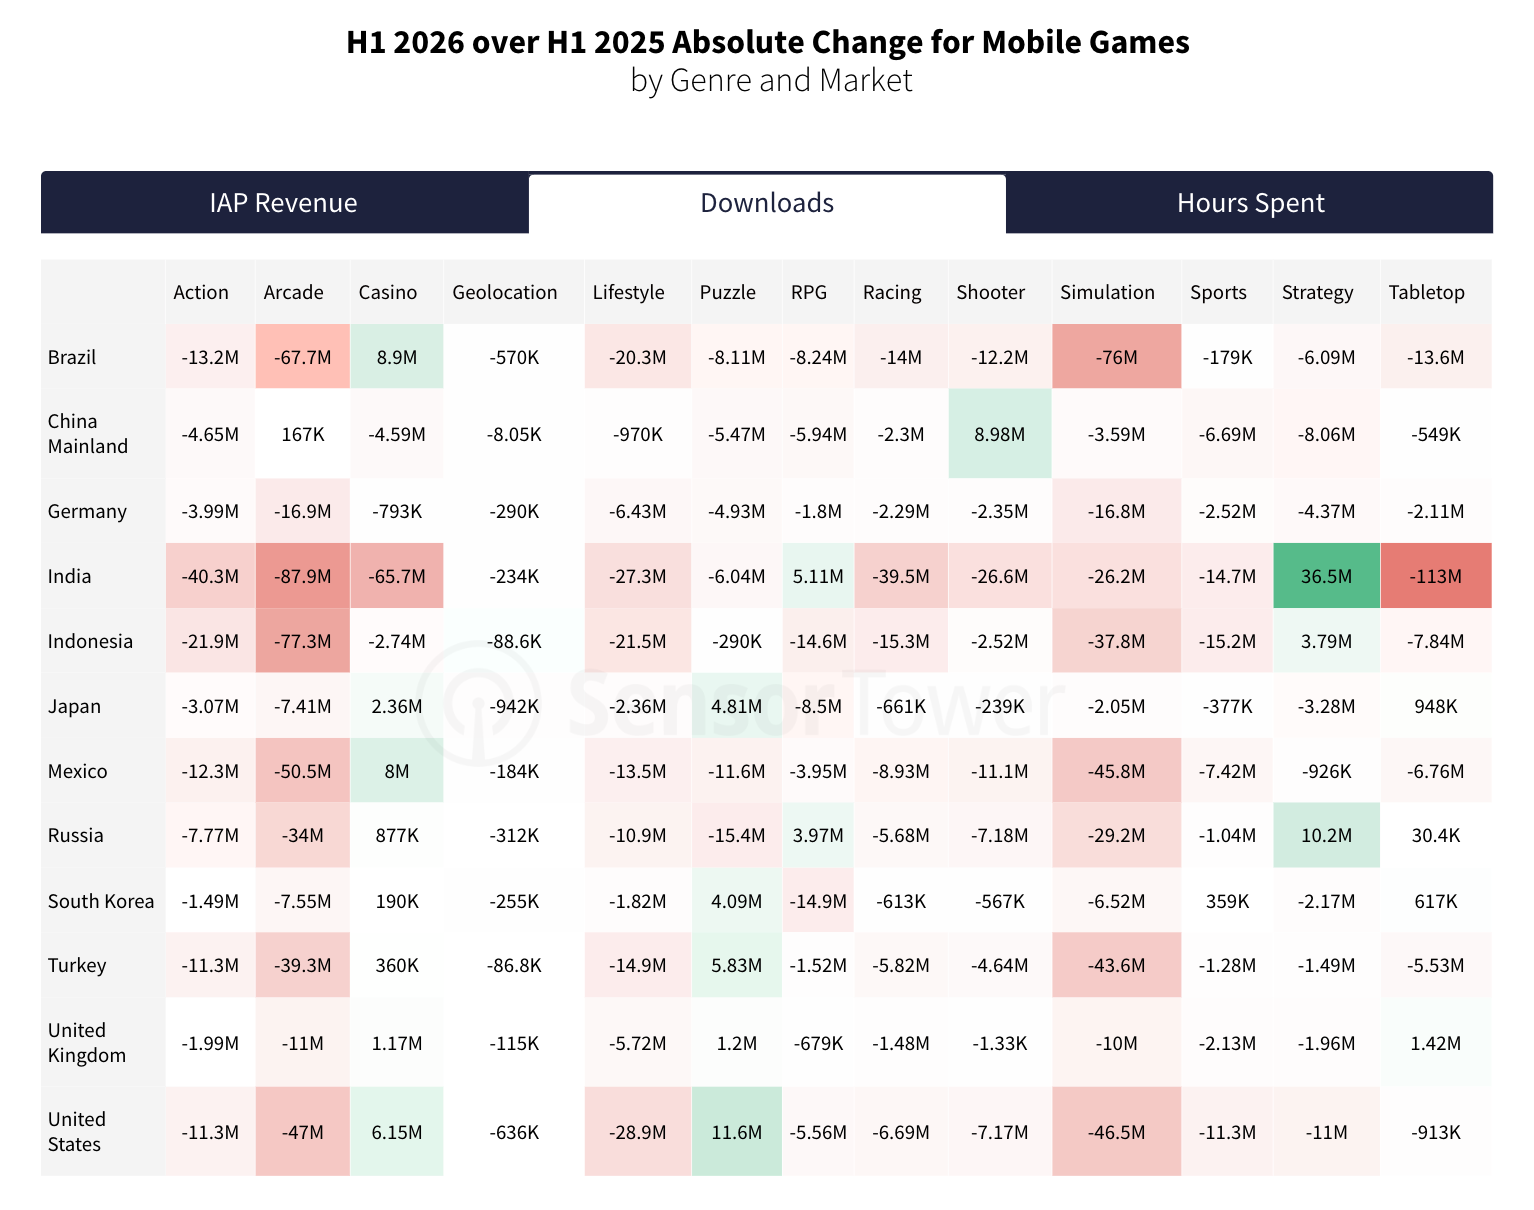
By downloads, the only large gain is Strategy in India (+36.5 million installs). Everything else is either flat or falling.
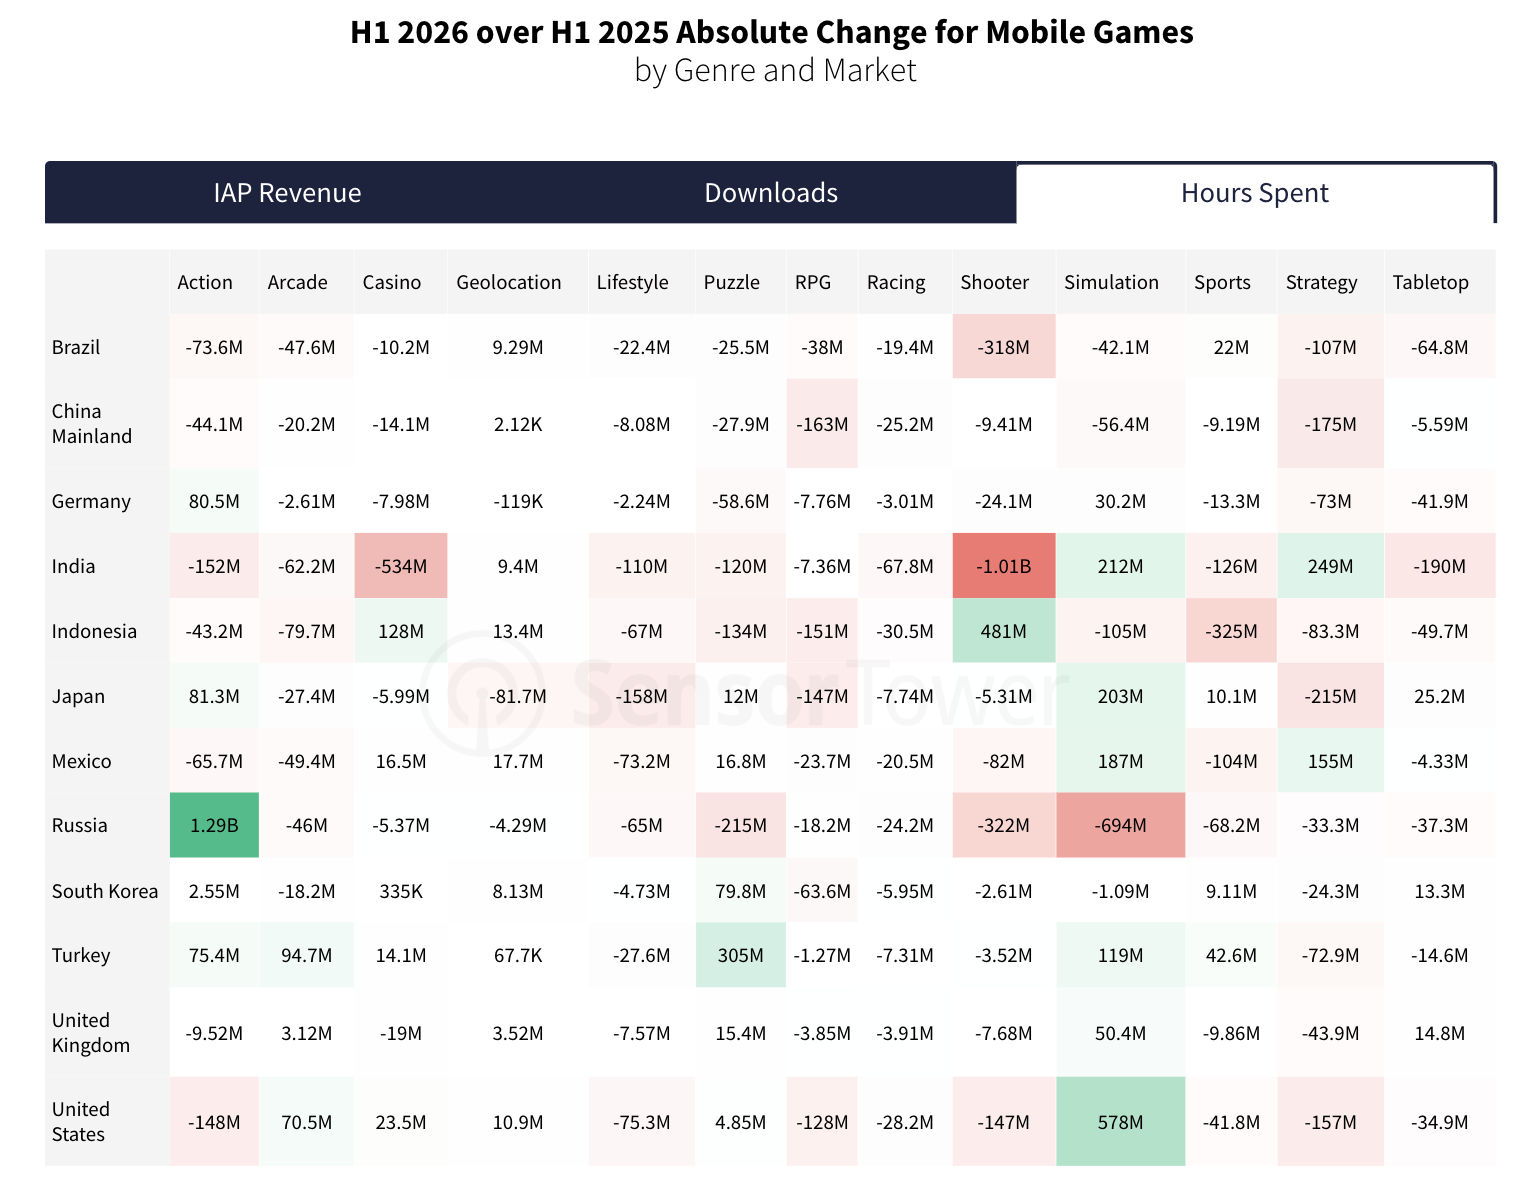
People in the US started playing simulation games more - by 0.6 billion hours; in India they play far less shooter and casino; and action in Russia grew by 1.3 billion hours. Sensor Tower writes that this happened against the backdrop of Brawl Stars’ comeback, but I couldn’t find confirmation of that.
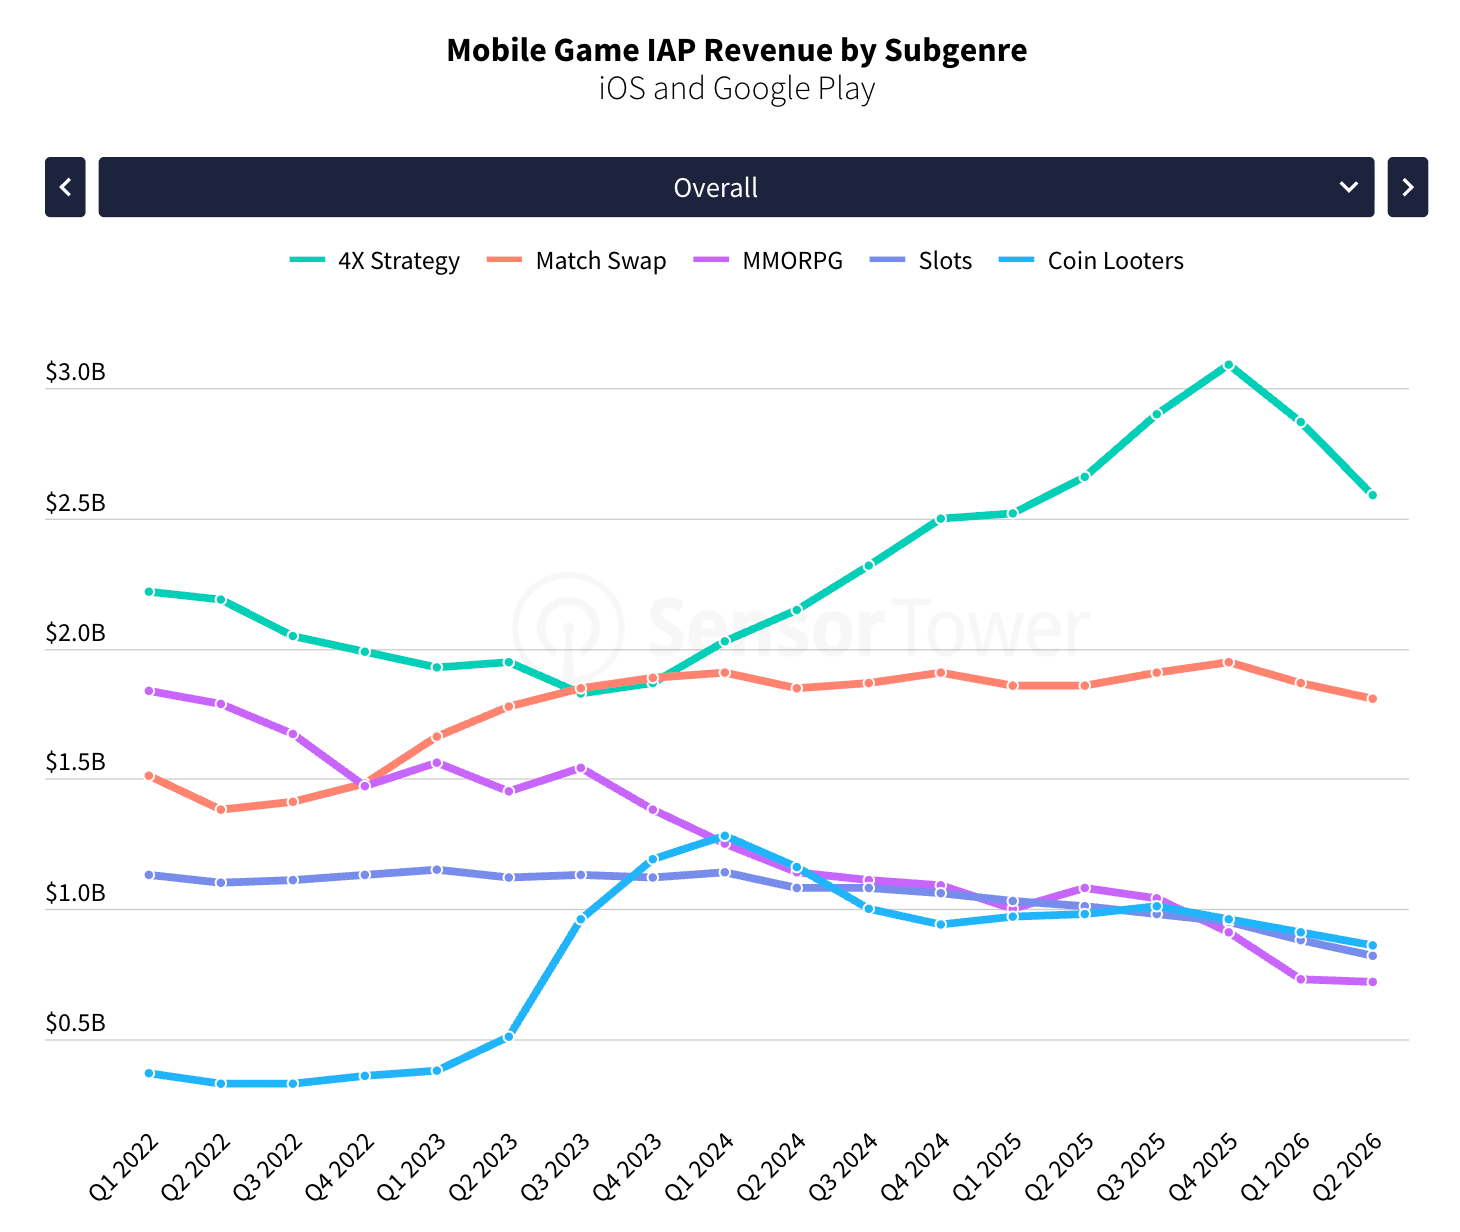
4X Strategy revenue has been falling for a second straight quarter after peaking at $3.09 billion in Q4’25.
Last War: Survival and Whiteout Survival together earned $370 million less in H1’26 than a year earlier. Kingshot (+461%, to $700 million) and Last Z: Survival Shooter (+328%, to $359 million) came along to replace them.
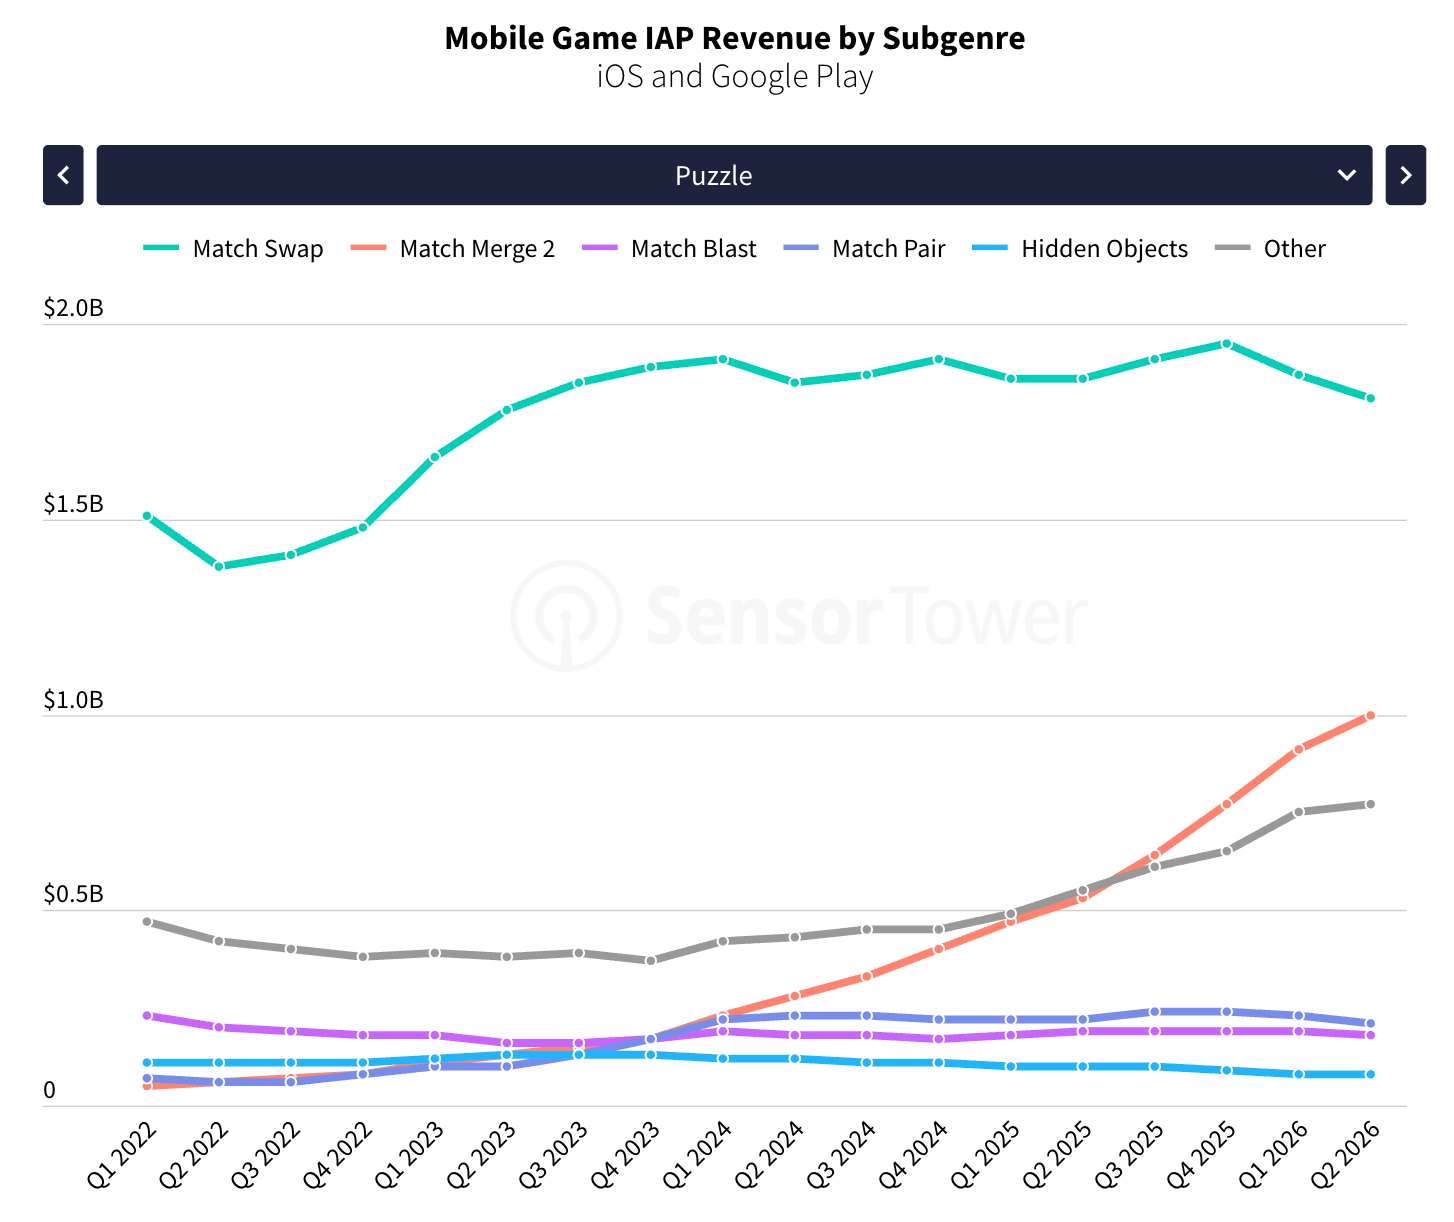
The Match Merge 2 genre nearly doubled - to $1.91 billion - and moved into third place among puzzle sub-genres. The main driver is Gossip Harbor (+135%).
Match Swap is on a plateau ($1.81 billion in Q2’26).
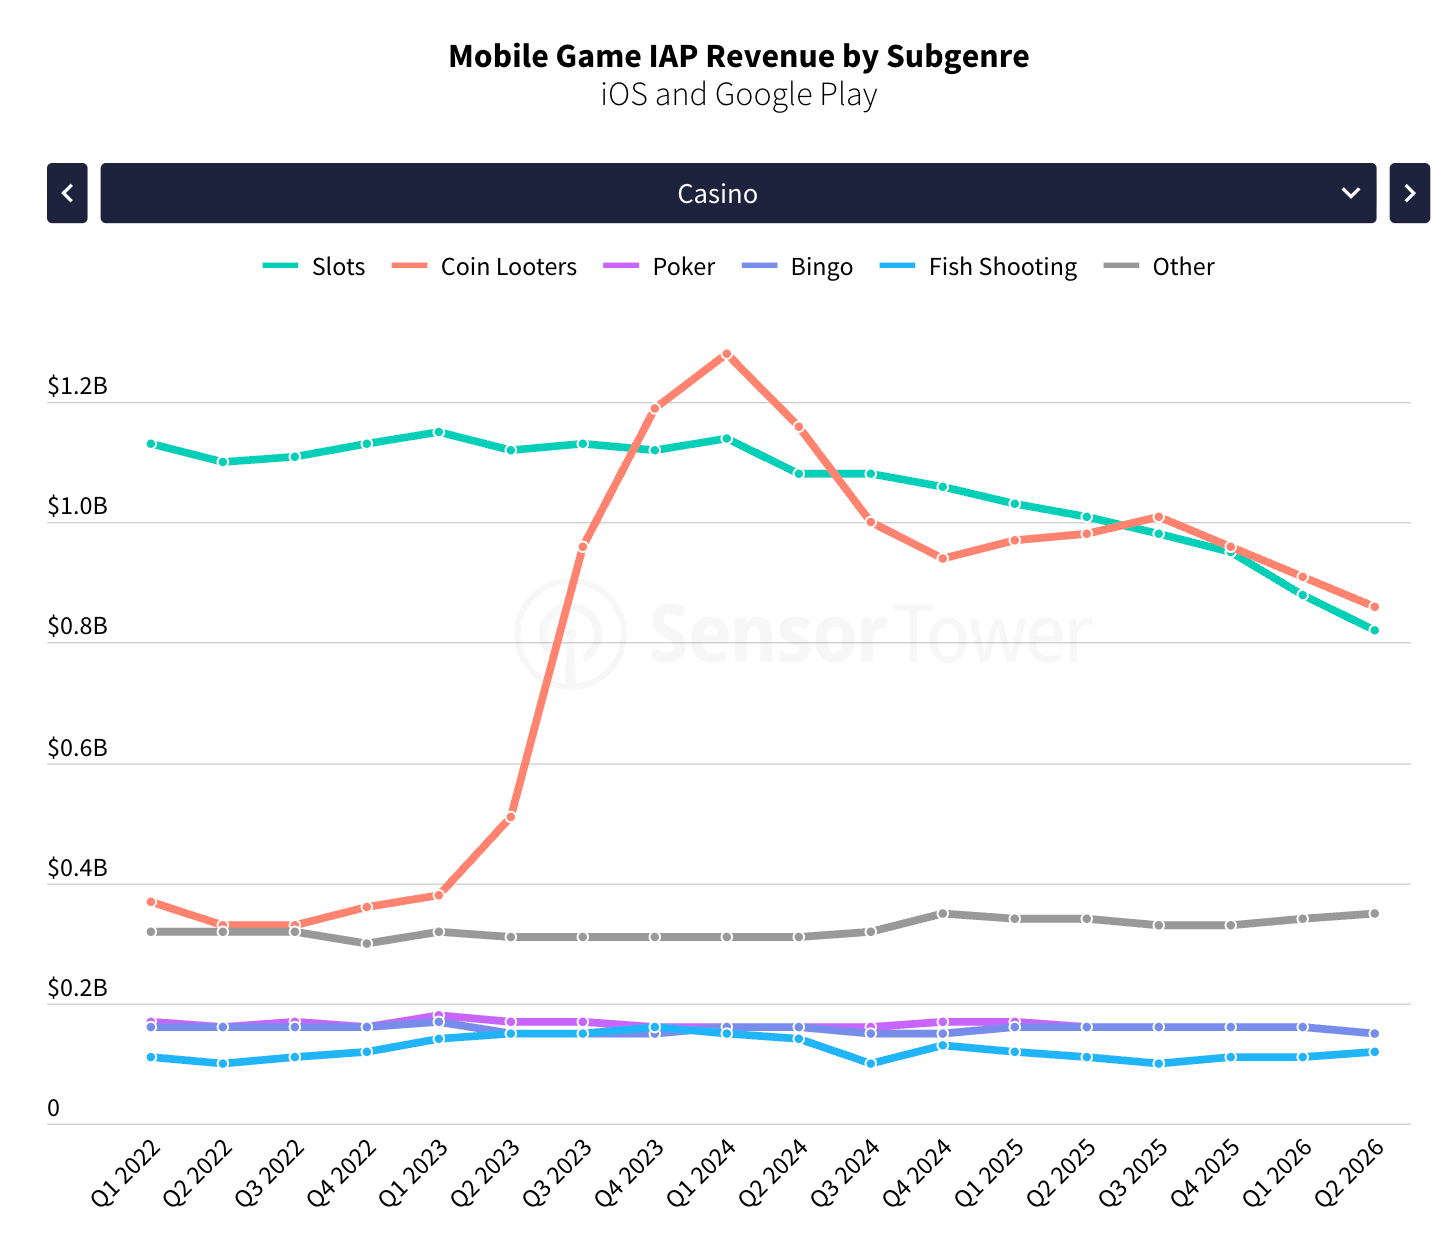
Coin Looters keeps losing revenue on the back of MONOPOLY GO!’s decline (-18%), but Sensor Tower ties that to D2C. The same goes for the revenue drop in slots, as companies try to pull their biggest spenders onto their own channels.
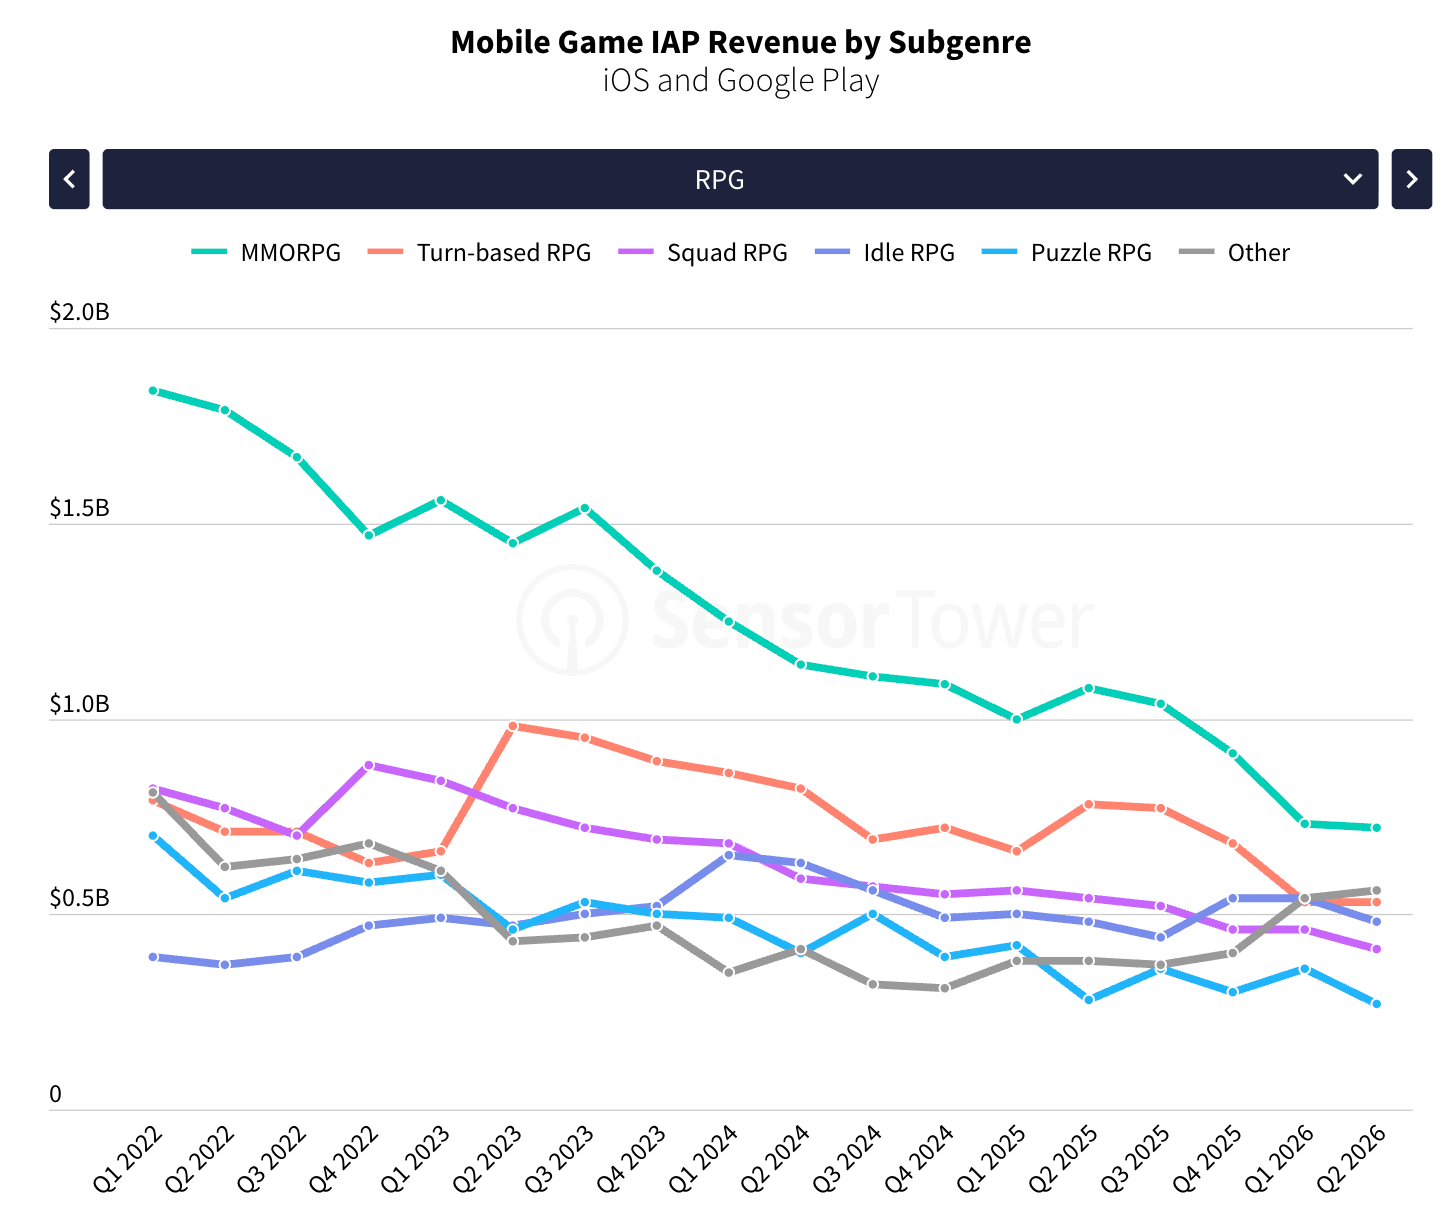
The whole RPG genre is going through a rough time. The MMORPG decline is especially pronounced.


Sensor Tower also included a breakdown of how different types of users play different genres. In the UK, for example, sports fans are 6.8 times more likely than the average user to play sports games. And in the US, parents are, for some reason, 4.4 times more likely to play racing games. I'm not sure what to do with this information yet.
Competitive Landscape
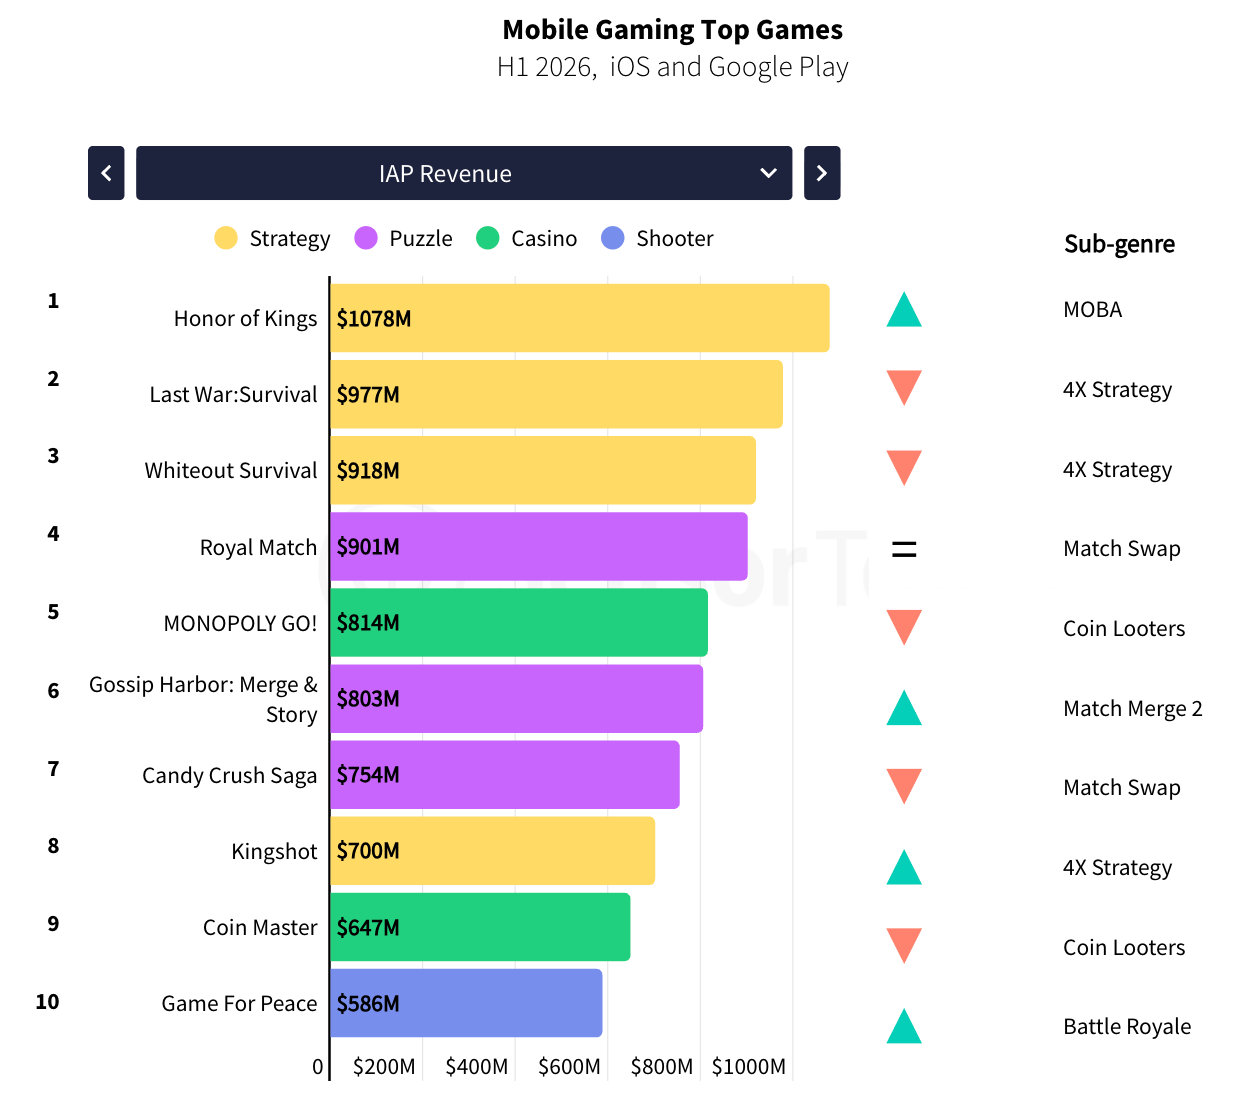
Leaders by IAP revenue: Honor of Kings ($1.078 billion), Last War: Survival ($977 million), Whiteout Survival ($918 million).
Honor of Kings took back first place despite a 2% YoY decline in money terms. Last War and Whiteout Survival each fell roughly 16%. Gossip Harbor and Kingshot broke into the top 10 with triple-digit growth, pushing out Roblox and Pokémon TCG Pocket.
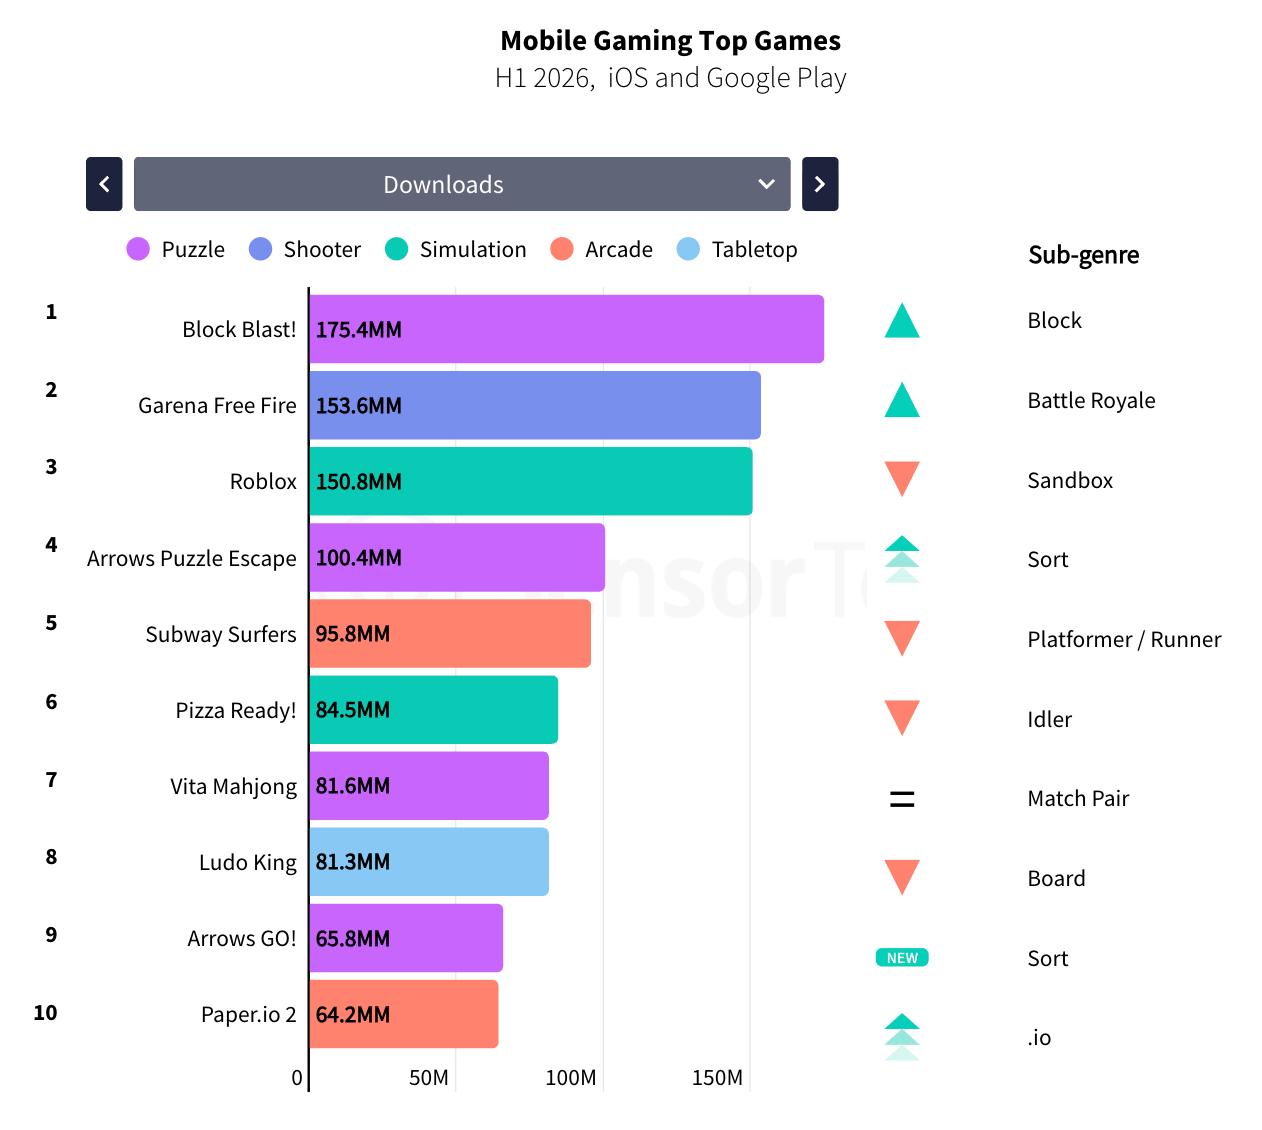
Leaders by downloads: Block Blast! (175.4 million), Free Fire (153.6 million), Roblox (150.8 million).
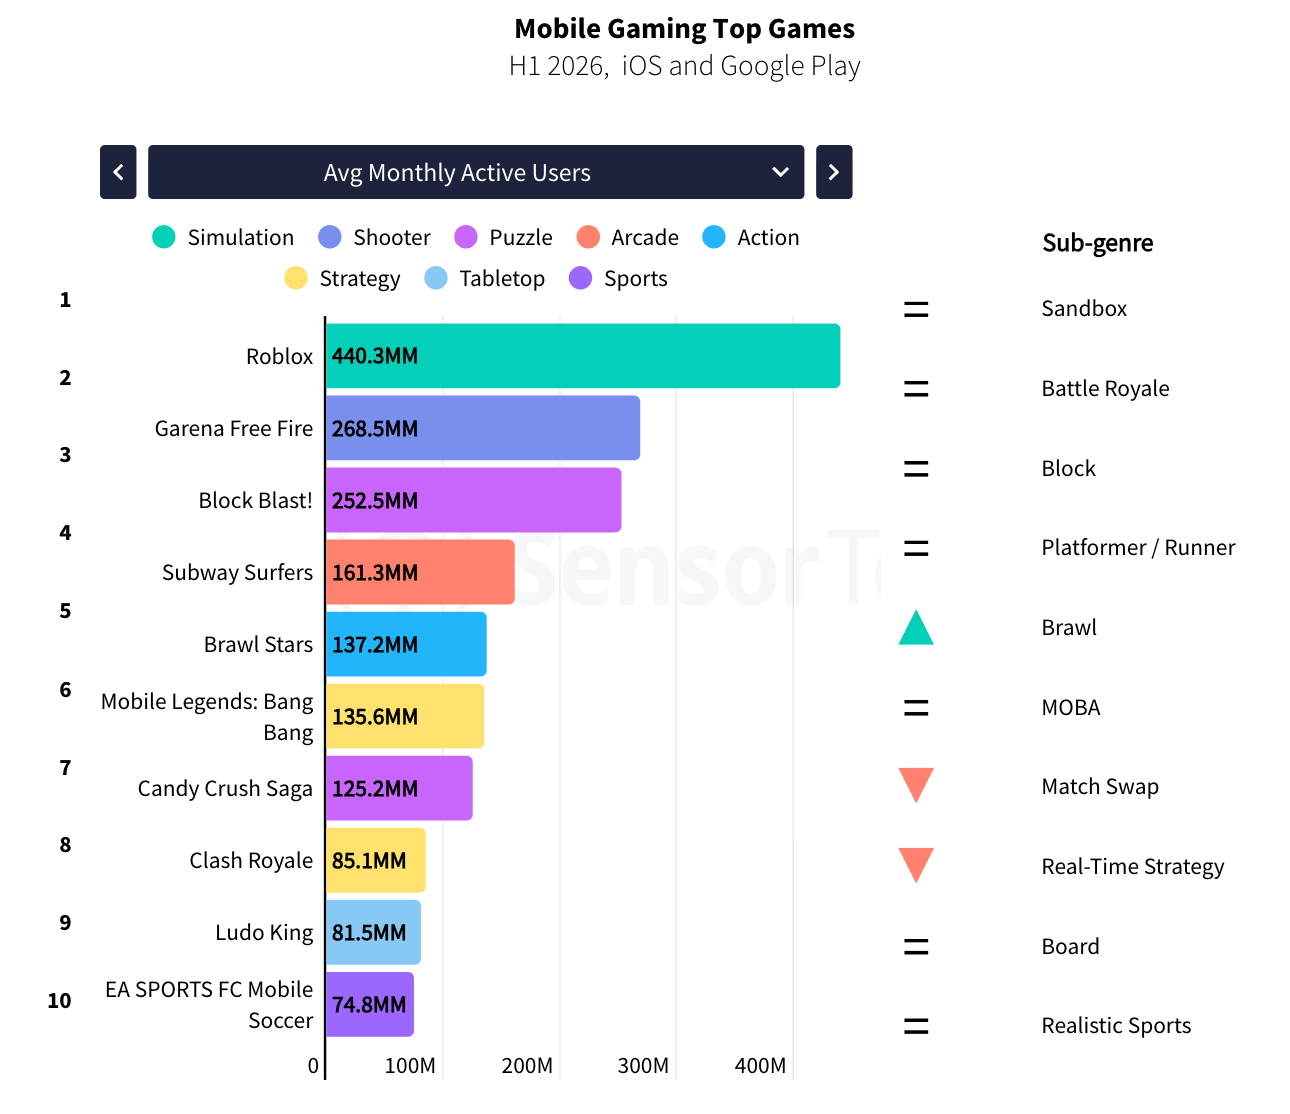
By average MAU, Roblox is ahead of everyone in the world (440.3 million), Free Fire is second (268.5 million), and Block Blast! third (252.5 million). None of the audience leaders made the top 10 by revenue, except Candy Crush Saga.
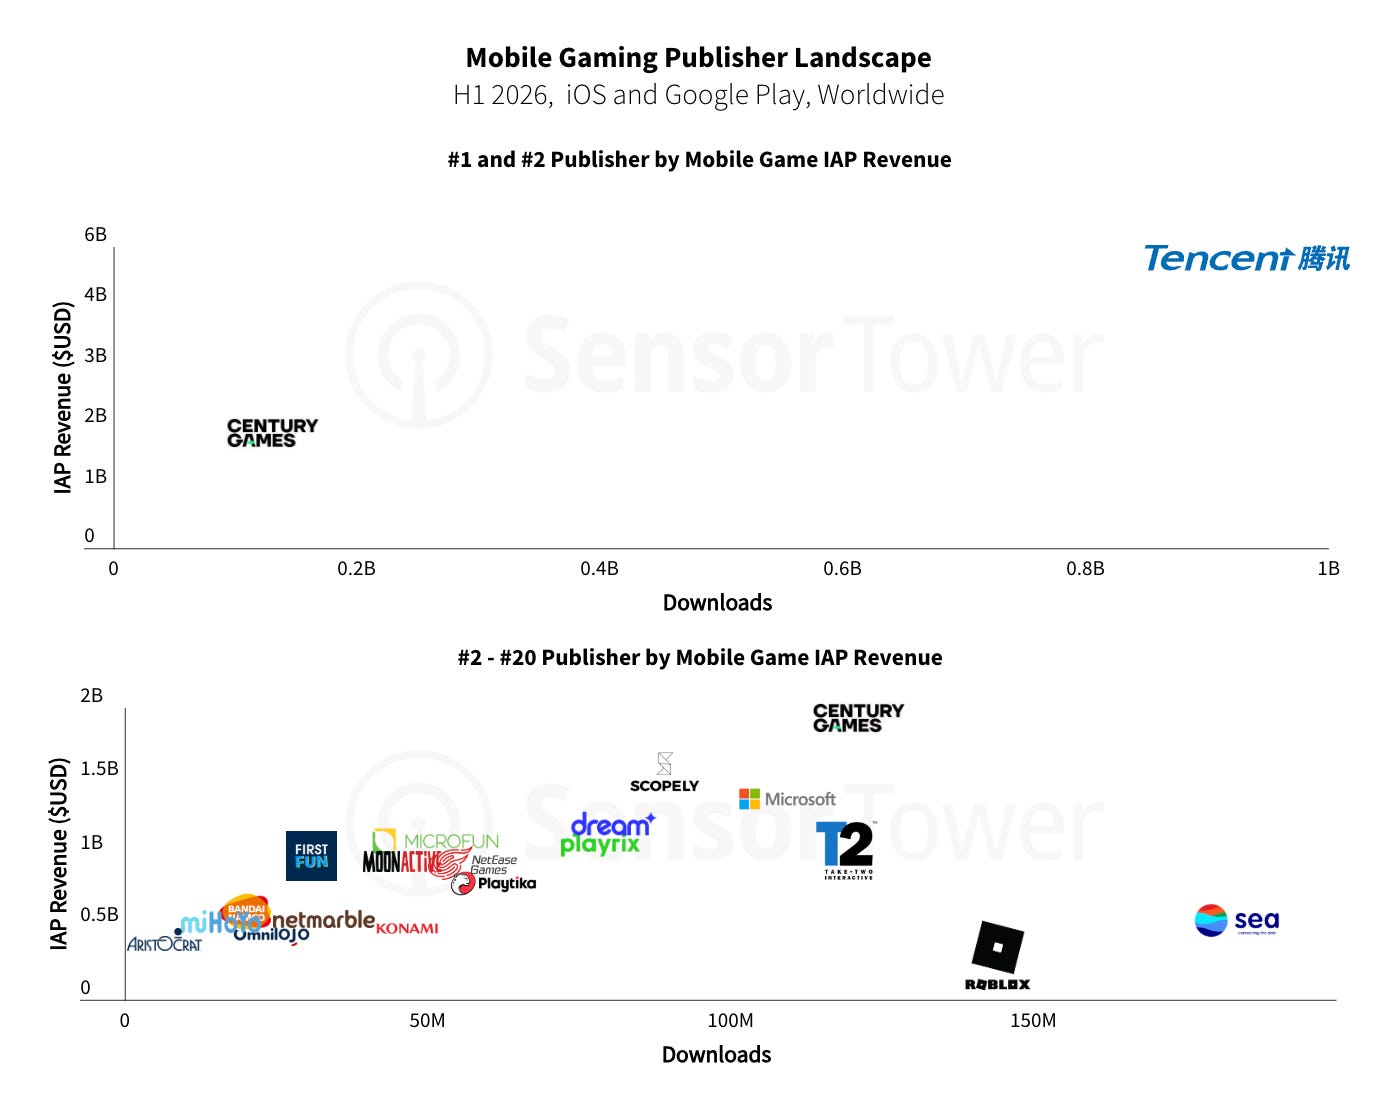
Tencent is the world's largest mobile games company. It has $5.03 billion in IAP revenue and 934 million downloads in H1’26. Century Games moved into second place with $1.93 billion in IAP revenue (+45% YoY) and 119 million downloads. Over the year, it narrowed Tencent’s lead from 3.7x to 2.6x.
Eight publishers cleared the billion mark for the half, including Scopely ($1.53 billion), Microsoft ($1.36 billion), Dream Games ($1.23 billion), Playrix ($1.18 billion), Microfun ($1.06 billion), and Take-Two ($1.04 billion).
The main breakouts of H1’26 are Microfun and Omnilojo ($494 million), both of which doubled IAP revenue and moved into the top 10 and top 20, respectively. Omnilojo, though, has already fallen off its H2’25 revenue peak.
The most notable declines are Roblox (-29%, $403 million in IAP revenue on 143 million downloads) and miHoYo (-24%, $544 million). Both are explained by heavy use of D2C tools.
❗️I flagged this above: according to Sensor Tower, 57% of miHoYo’s US revenue goes through the D2C.
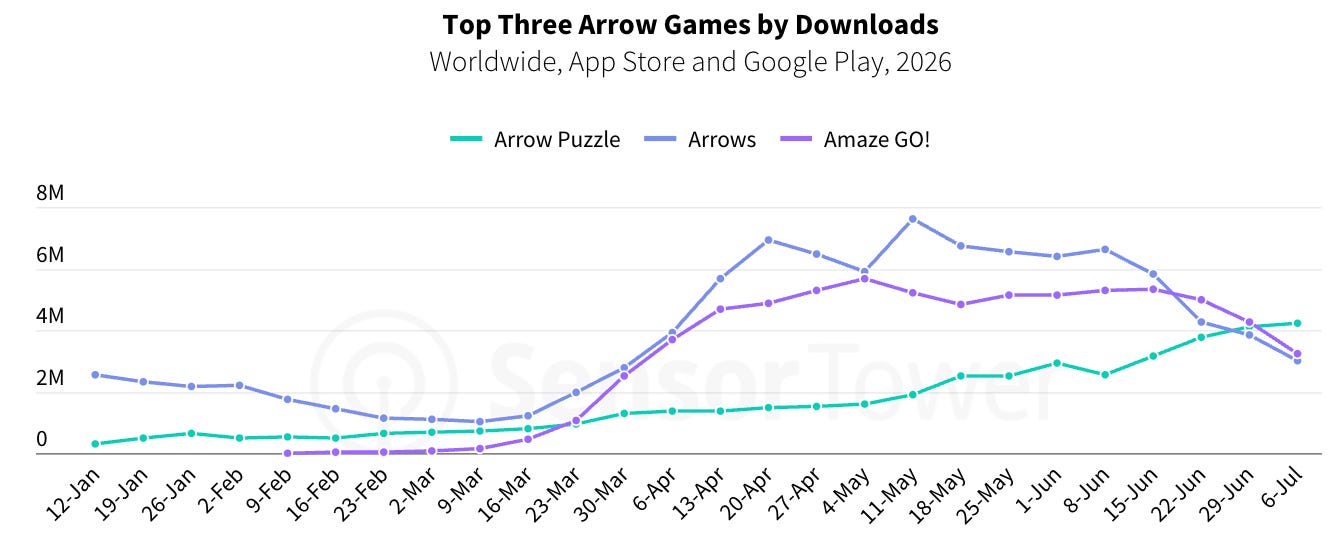
Arrow puzzles were one of the biggest download drivers of H1’26, and the balance of power inside the genre shifted twice. Arrows held the lead through winter and spring with a peak of 7.61 million downloads in the week of May 11; Amaze GO! launched in mid-February and reached 5.68 million in the week of May 4, and Arrow Puzzle grew steadily all period and overtook both by early July (4.24 million against 3.01 and 3.23 million).
Sensor Tower broke down the ad placements in all three. Non-rewarded interstitials after a level are there in all of them, but Arrow Puzzle unlocks its rewarded offers noticeably earlier: restoring a life from level 1-2 versus level 4 in Arrows and level 15 in Amaze GO!. On top of that, on iOS Arrow Puzzle has separate placements for coins, the eraser, Grid Guide, Magic Wand, and double rewards - the game simply has more ad placements.
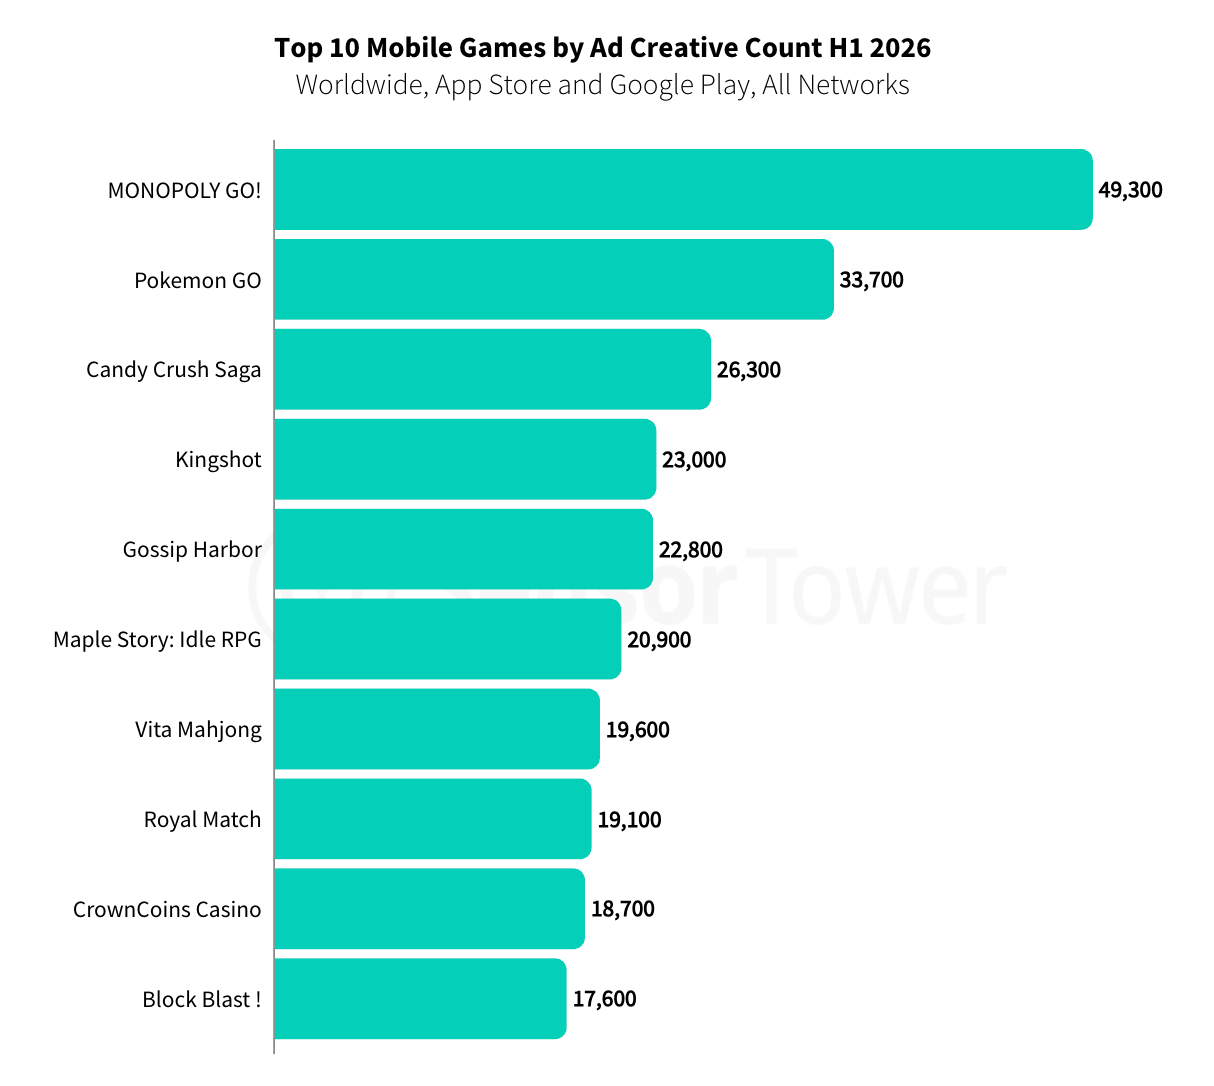
Top teams make tens of thousands of ad creatives in half a year. The leaders are MONOPOLY GO! (49,300), Pokémon GO (33,700) and Candy Crush Saga (26,300).
Pokémon GO, Candy Crush Saga, Royal Match and Gossip Harbor were also among the creative-count leaders in H1’25. Many people note that creatives (and their volume) are a major success factor in today’s market.
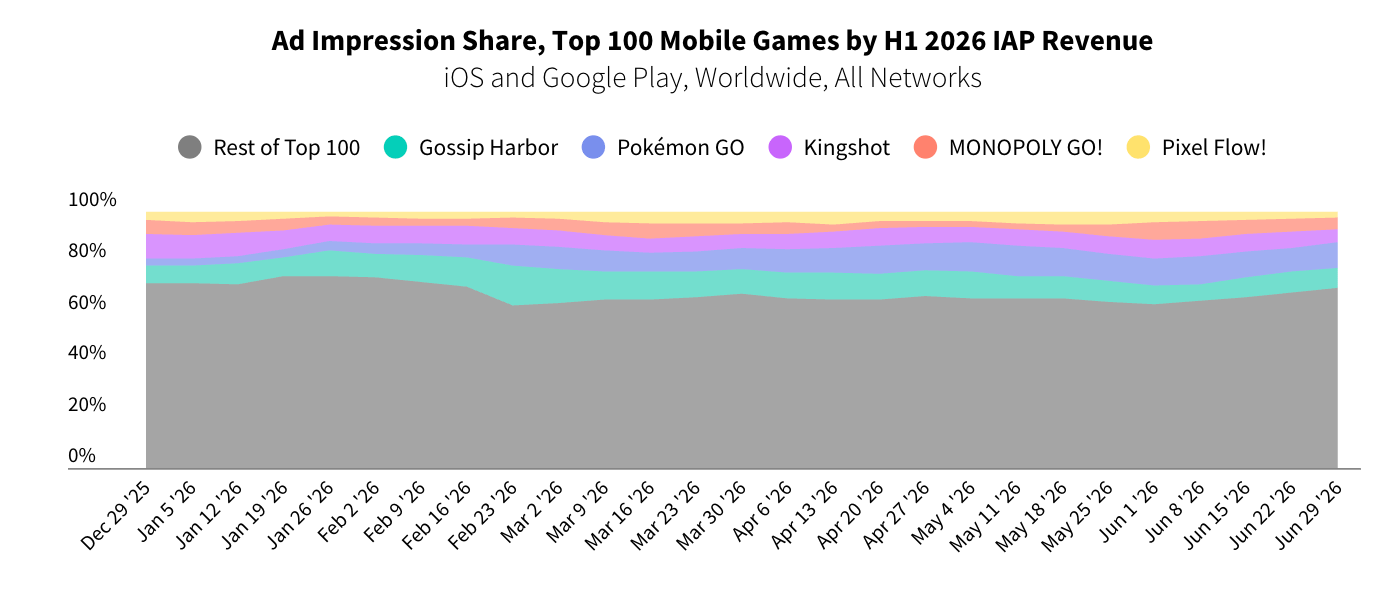
By share of ad impressions within the top 100 in H1’26, the leaders were Gossip Harbor, Pokémon GO, and Kingshot. Even though they made fewer creatives than MONOPOLY GO!.
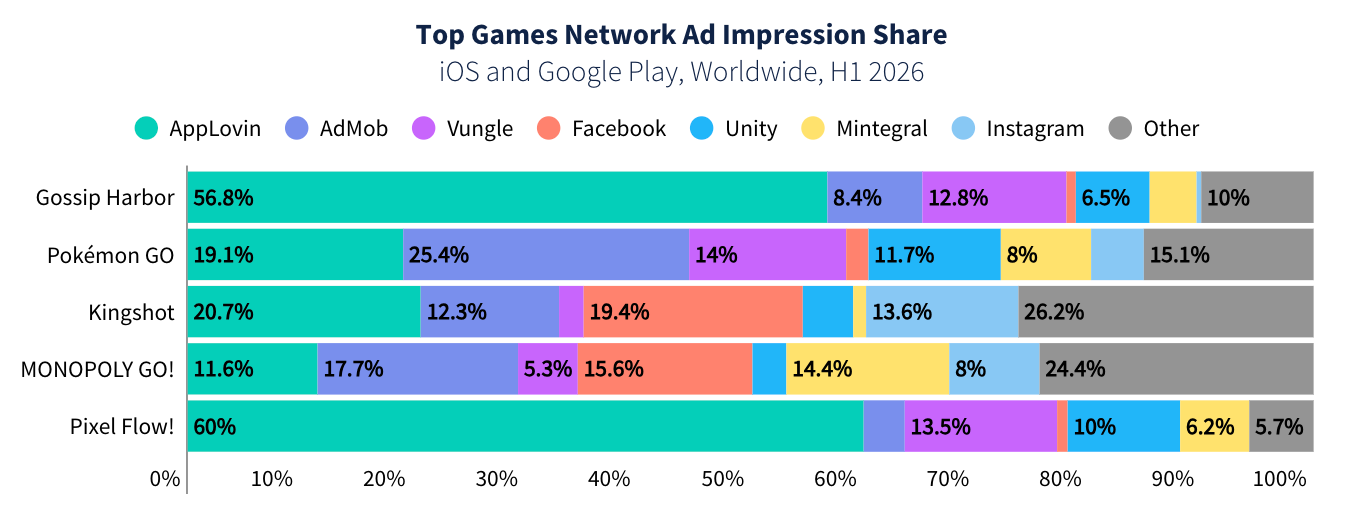
Marketing mixes differ across the board: Gossip Harbor and Pixel Flow! are almost entirely on AppLovin (56.8% and 60% of impressions). Pokémon GO, by contrast, is diversified: AdMob has 25.4%, AppLovin 19.1%, Vungle 14%, and Unity 11.7%. Kingshot started using AppLovin more, and MONOPOLY GO! went the other way, toward Meta.
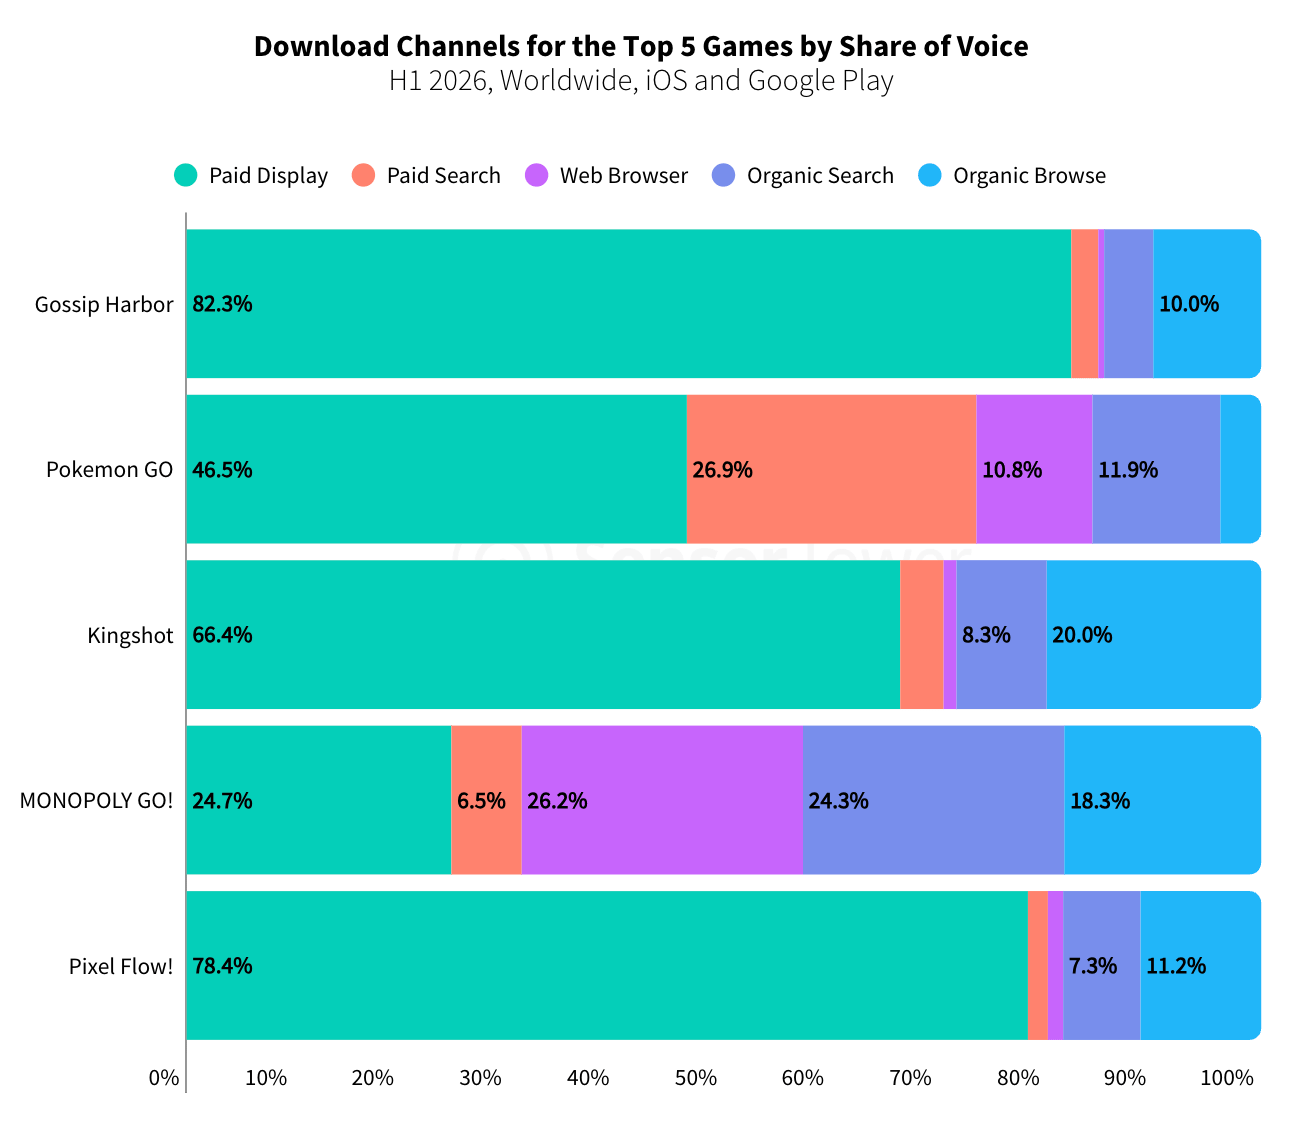
In terms of traffic sources, everything rests on paid acquisition. But some projects (MONOPOLY GO!, for example) have an organic share of 42.6%.
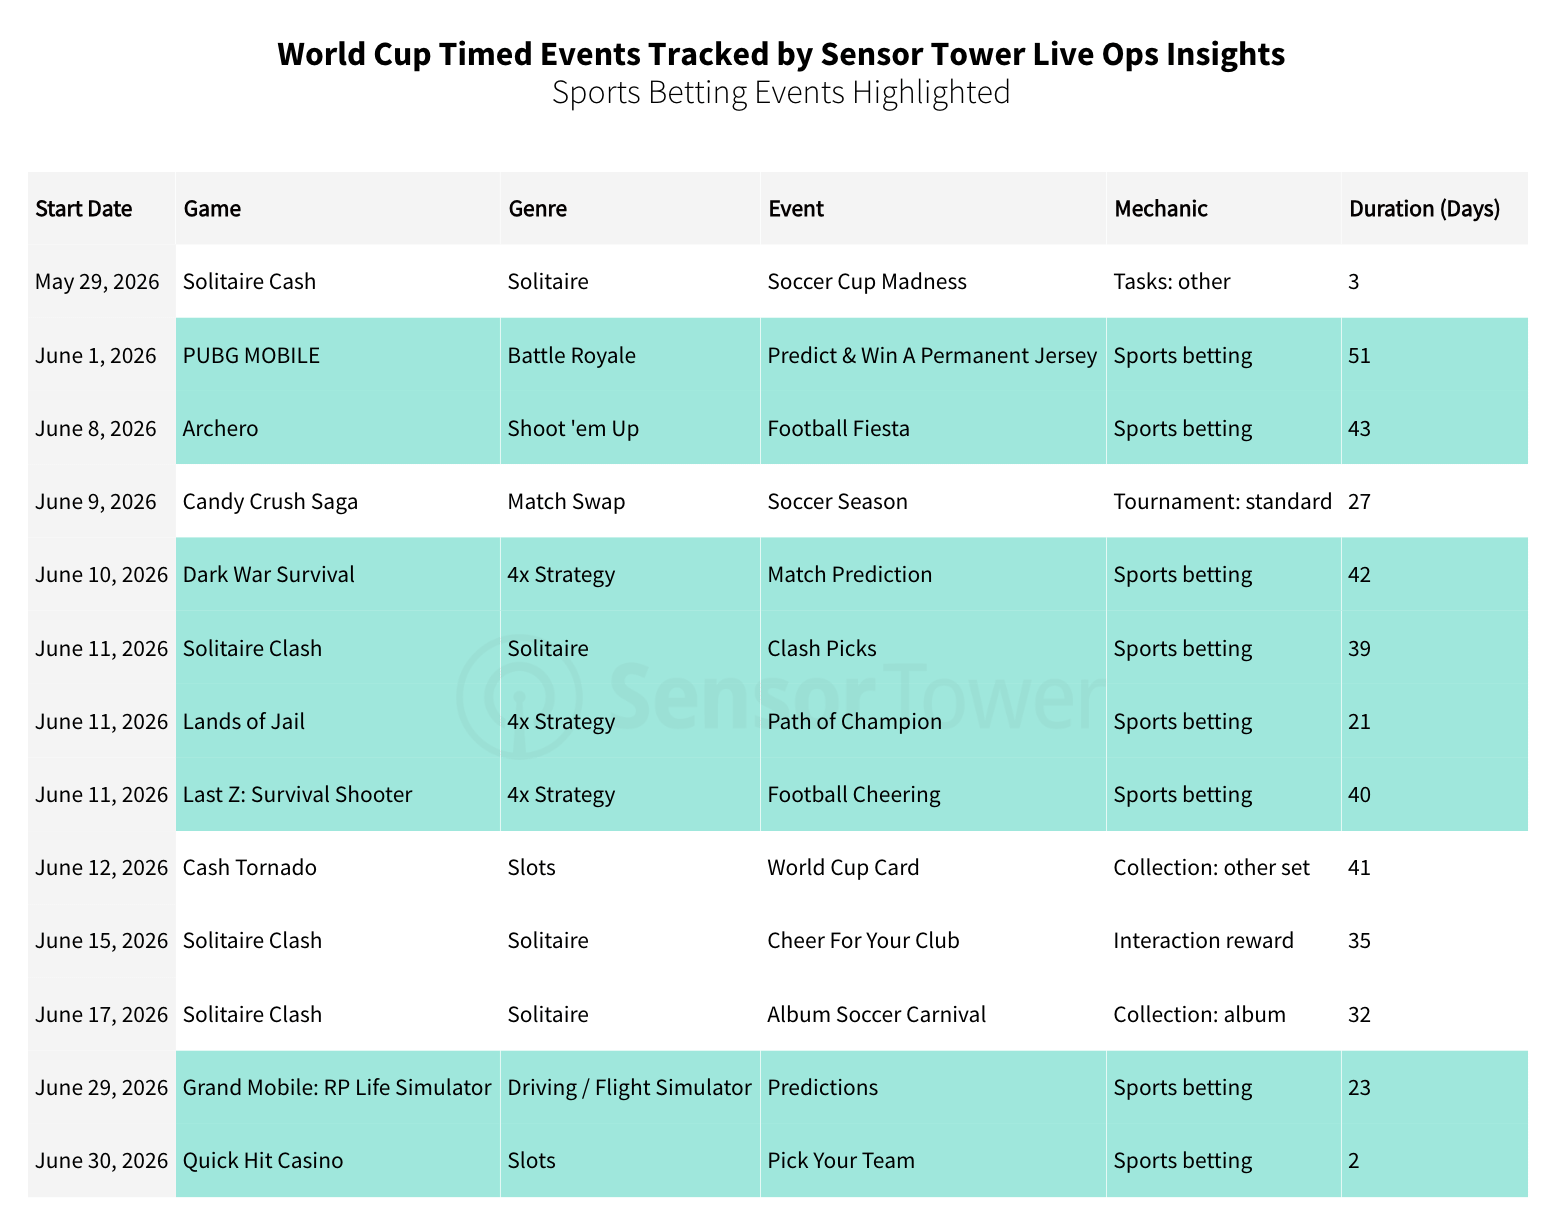
8 of the 13 events in non-sports games built around the FIFA World Cup in the US used a match-betting mechanic.
Sports games themselves grew 7% YoY in IAP revenue on the back of the football festivities (the market, as a reminder, fell 2%), though downloads still fell 8% (against 12% market-wide).
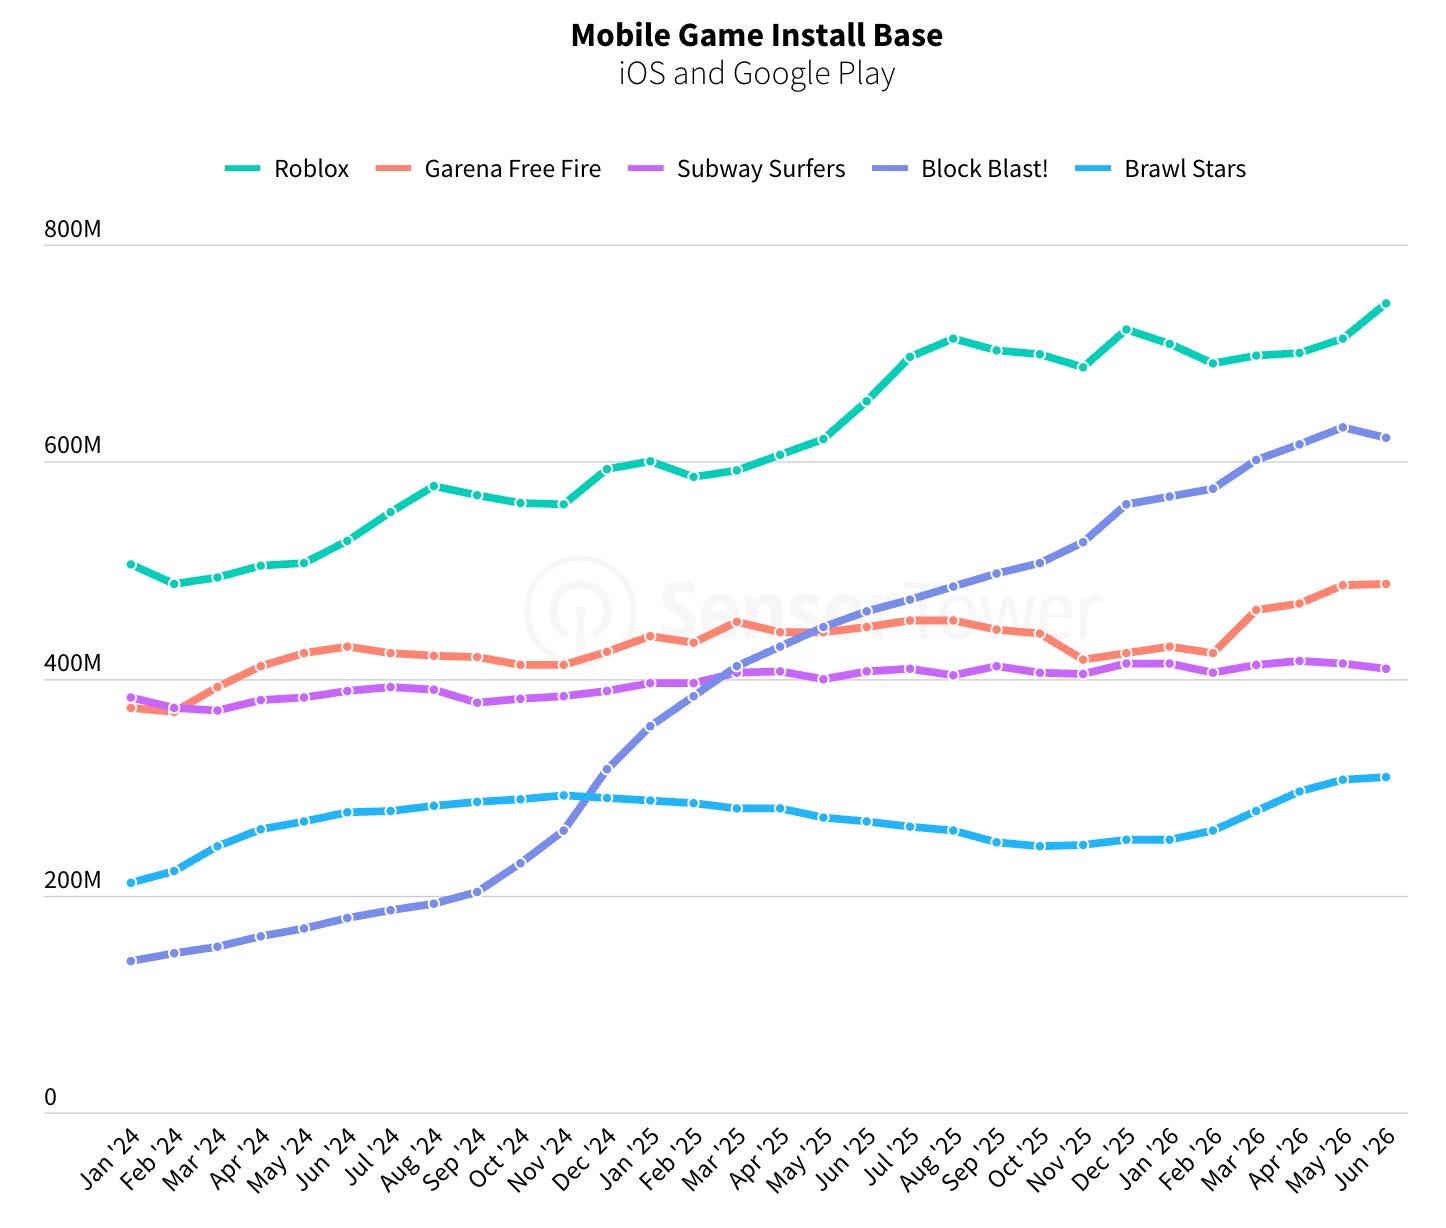
Roblox leads in install base (746 million devices in June 2026), but Block Blast! is right behind (622 million devices).
Block Blast!’s average MAU grew 68% YoY on download growth of just 11%; Roblox’s MAU added 18% with no significant install growth. Brawl Stars’ downloads grew 35%.
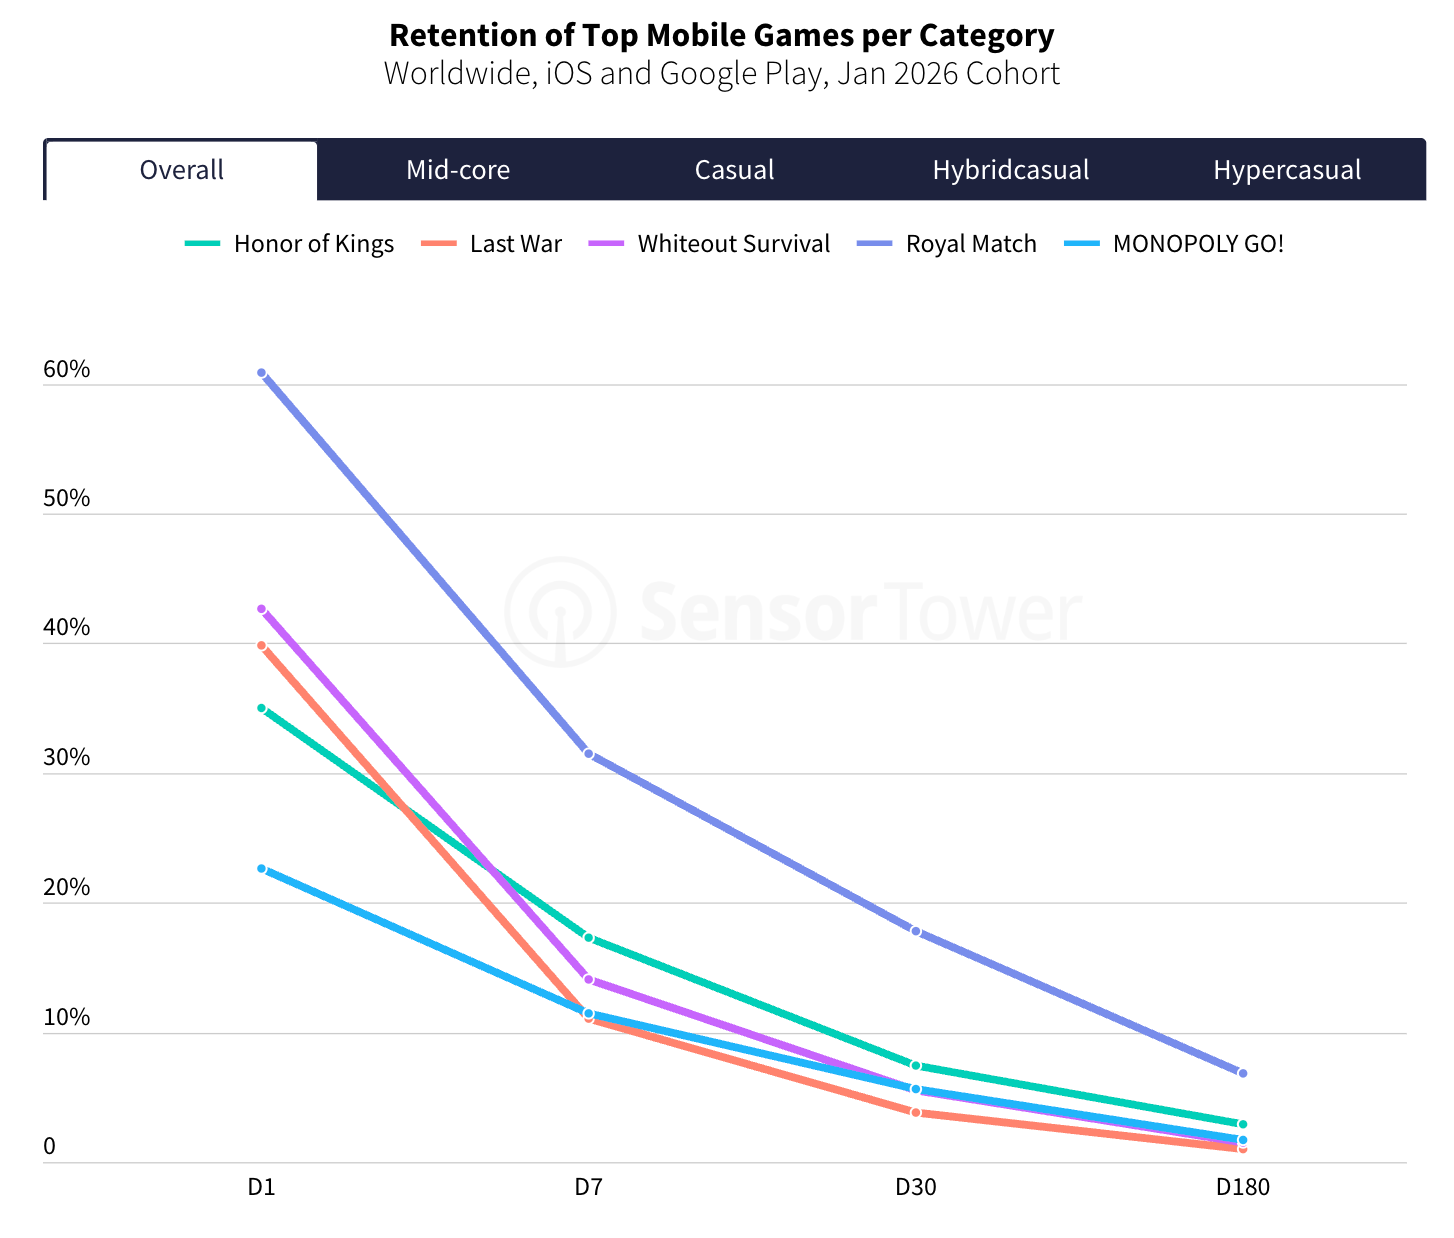
Retention for the January 2026 cohort in Royal Match is the envy of everyone - D1 60.9%, D7 31.5%, D30 17.8%, D180 6.8%. Block Blast! has the best D180 in the sample (7.93%) and the best D7 (33.4%).
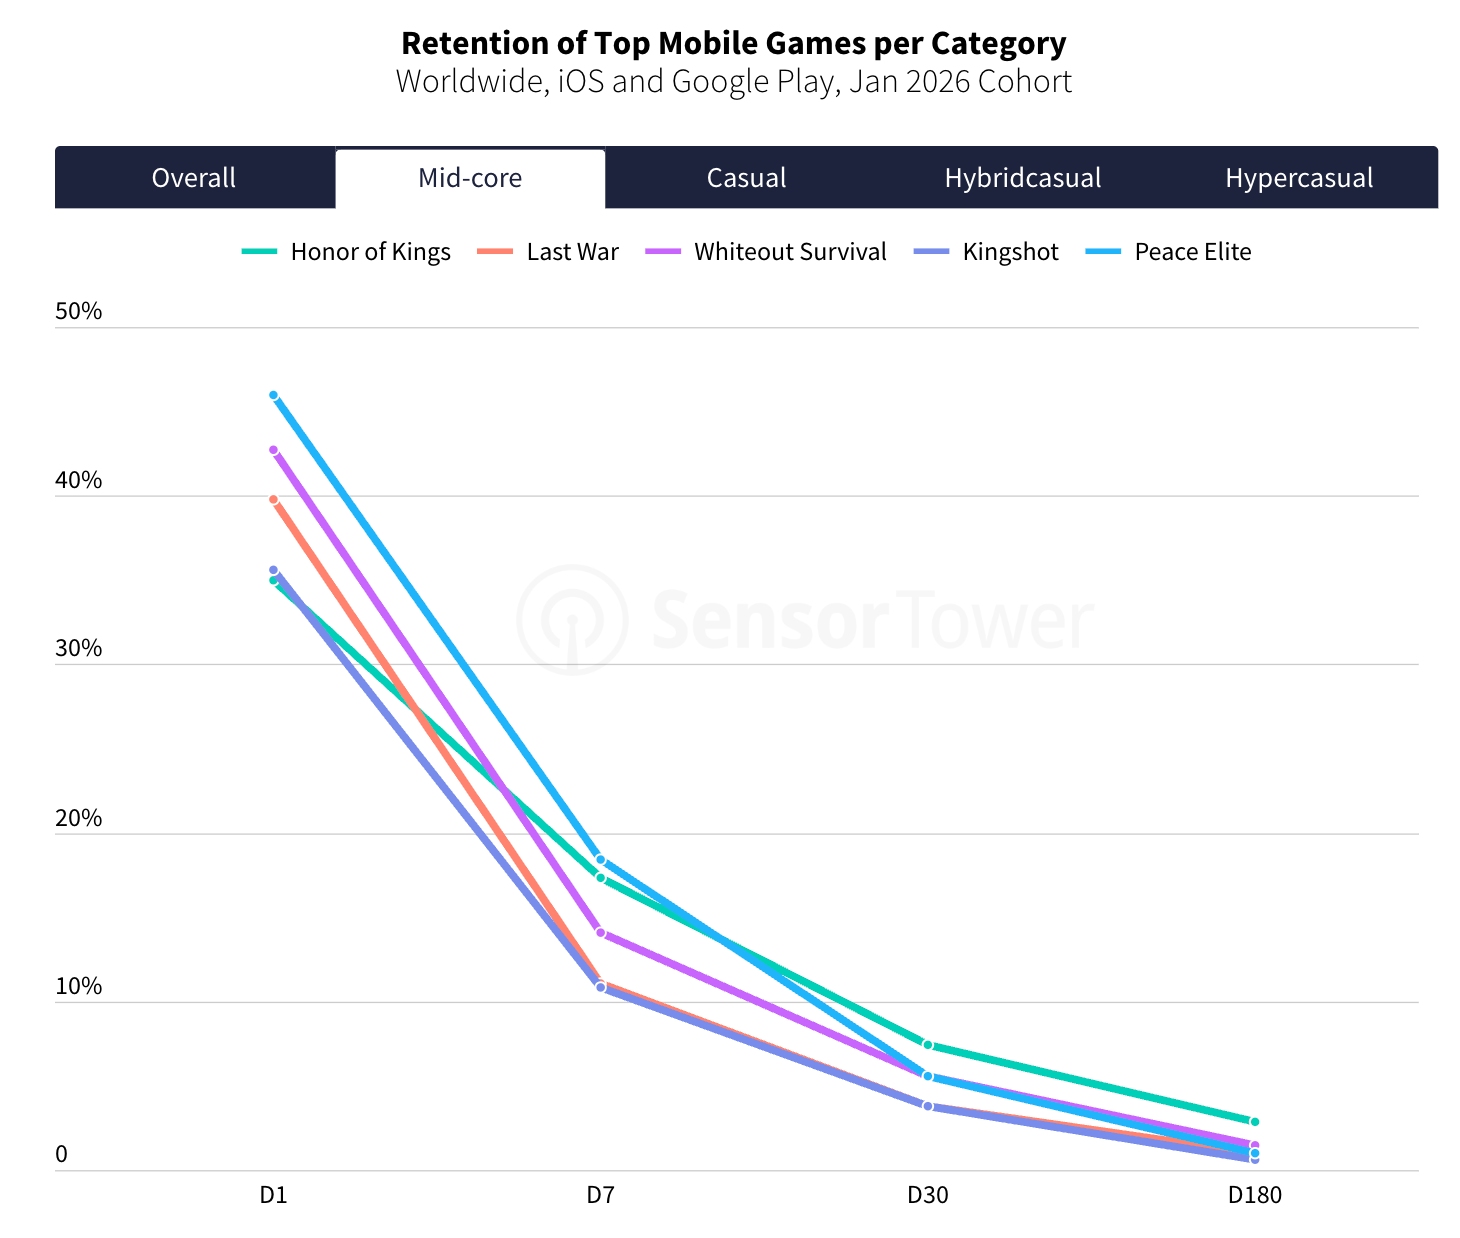
Whiteout Survival - D1 42.7% / D7 14.1% / D30 5.57% / D180 1.48%; Last War - D1 39.8% / D7 11.1% / D30 3.82% / D180 0.99%; Honor of Kings - D1 35% / D7 17.3% / D30 7.4% / D180 2.87%.
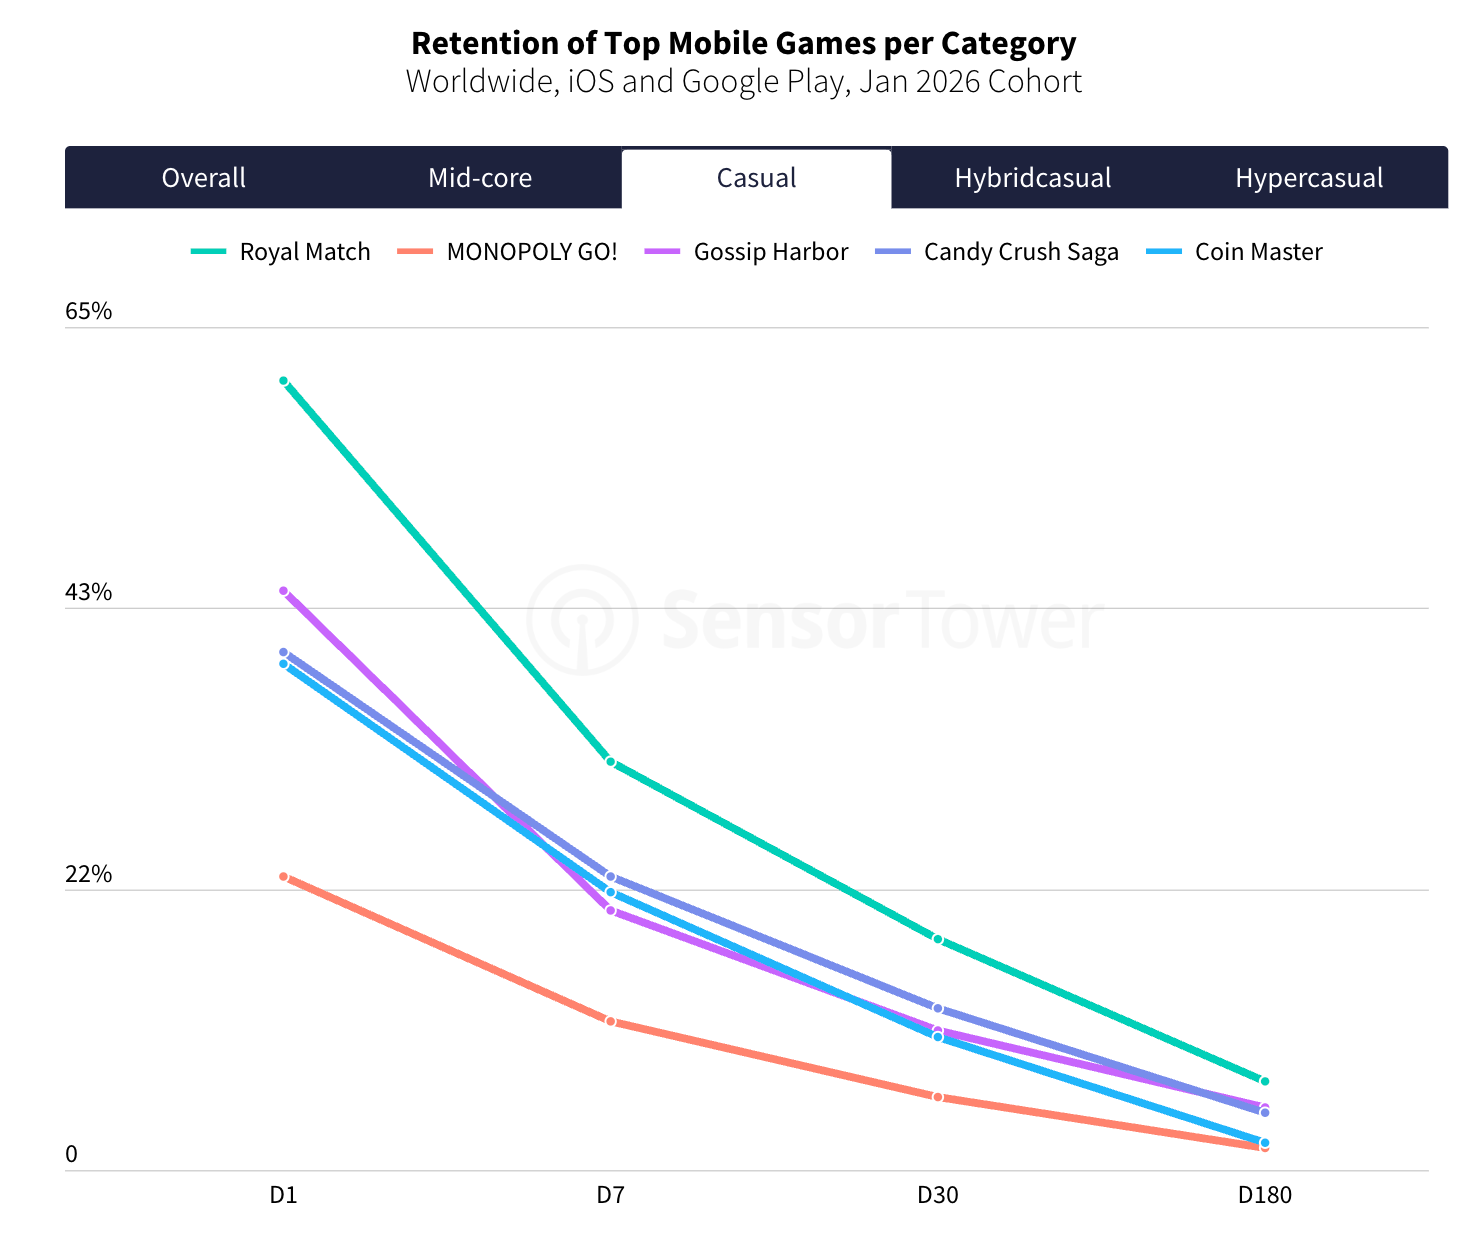
It’s interesting how weak MONOPOLY GO!’s D1 Retention is (22.6%), while its D180 is good at 1.76%. That is understandable, though, given the project's scale and the high volume of non-targeted traffic.
Among casual projects, Gossip Harbor (D1 44.7% / D7 20% / D30 10.8% / D180 4.81%) and Candy Crush Saga (D1 39.9% / D7 22.6% / D30 12.5% / D180 4.44%) have good numbers.
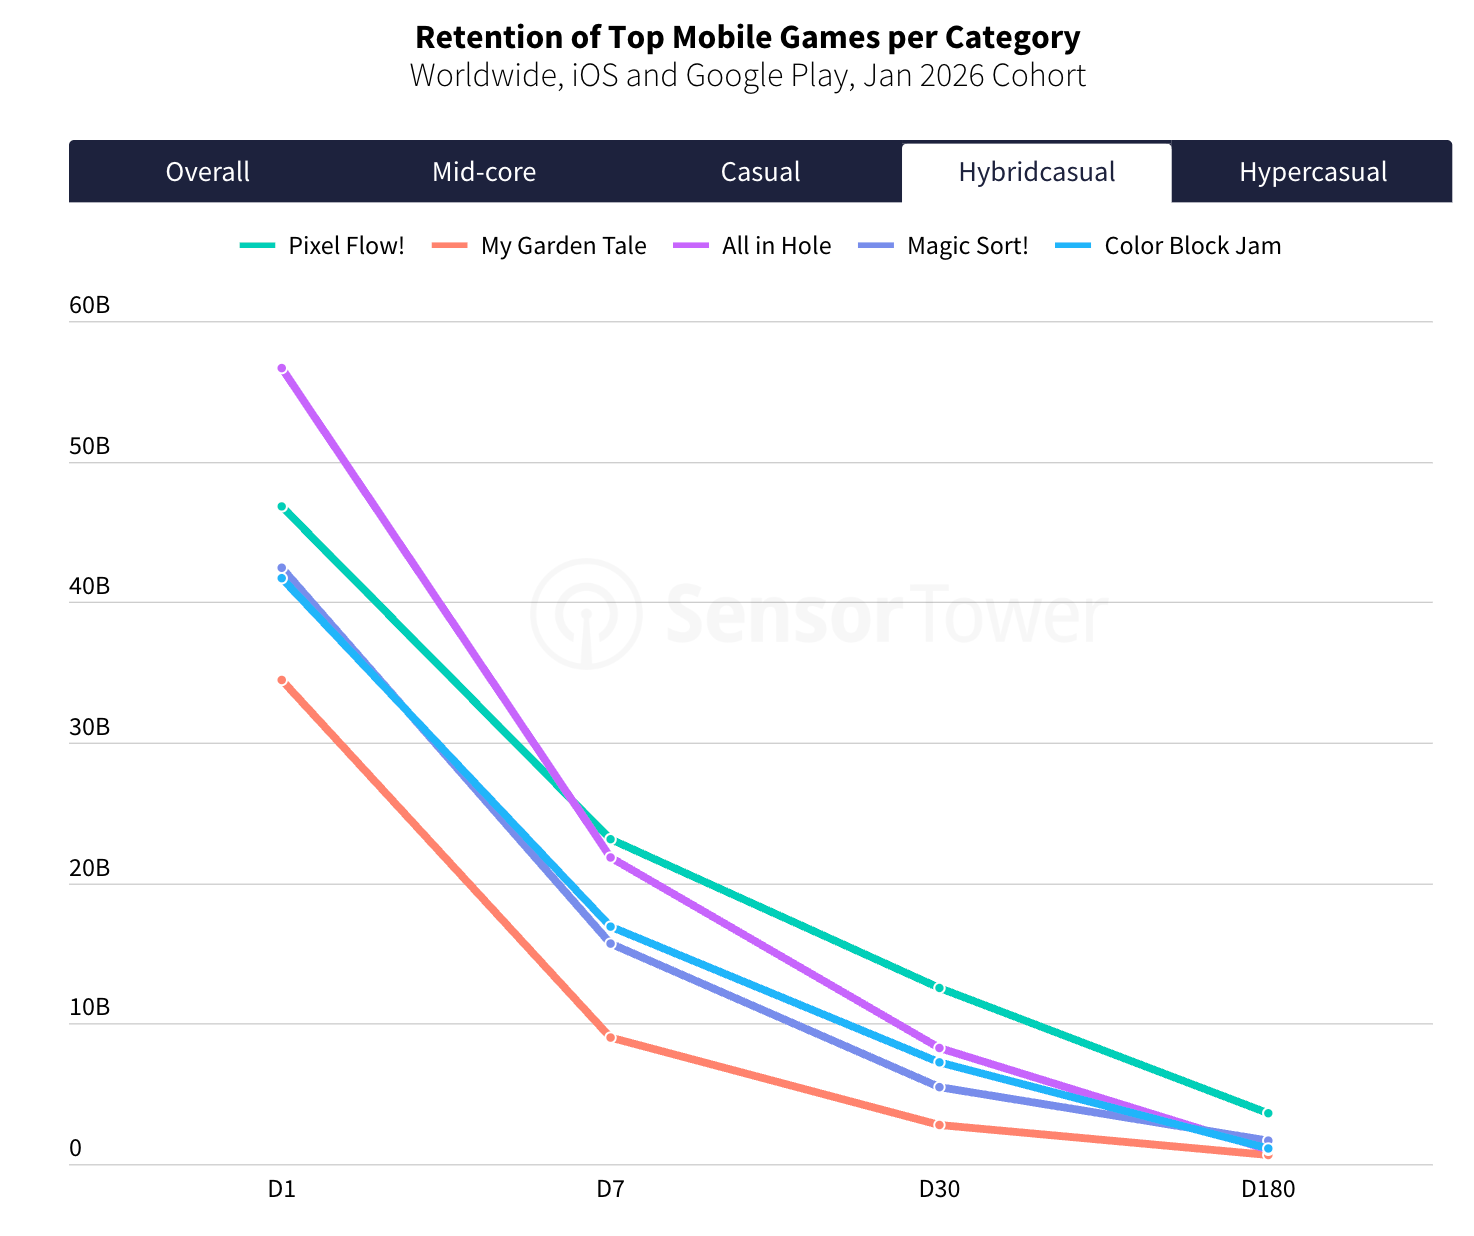
All in Hole leads among hybrid casual projects in D1 retention (56.7%). Pixel Flow!, on the other hand, is more effective than any other project over the medium and long term (D30 12.5%; D180 3.62%).
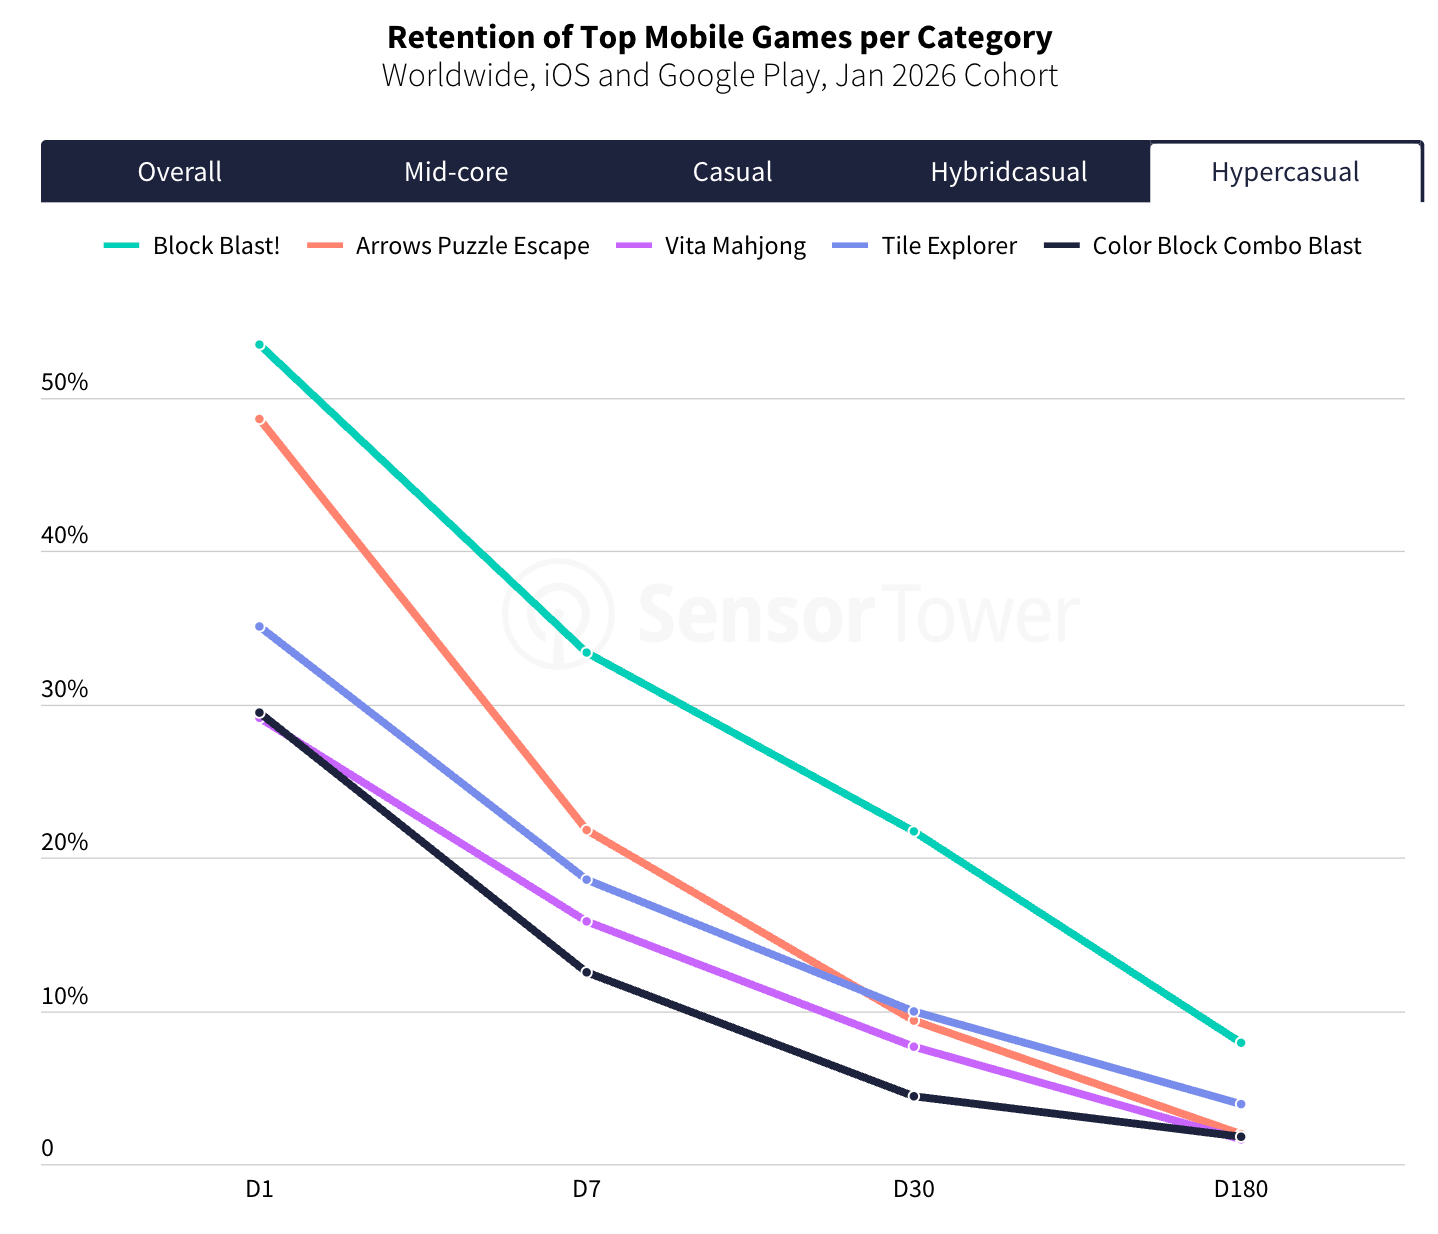
Hypercasual projects have good metrics too. Block Blast! stands out here (D1 Retention 53.5%; D7 33.4%; D30 21.7%; D180 7.93%). You can only dream of numbers like that.
❗️Please note that those are Sensor Tower estimates of Retention, not actual figures.
A word from our sponsor
Game studios run on contractors — artists, composers, QA testers, translators — often spread across a dozen countries. That’s a lot of contracts, tax rules, and IP clauses to track. Mellow handles all of it: compliant contracts, automated payments, and IP protection built in, for contractors in 150+ countries.
Advertising and Ad Monetization
Pathmatics tracks ad spend and impressions across 41 markets and 18 channels. In-game ad monetization data covers 19 countries.
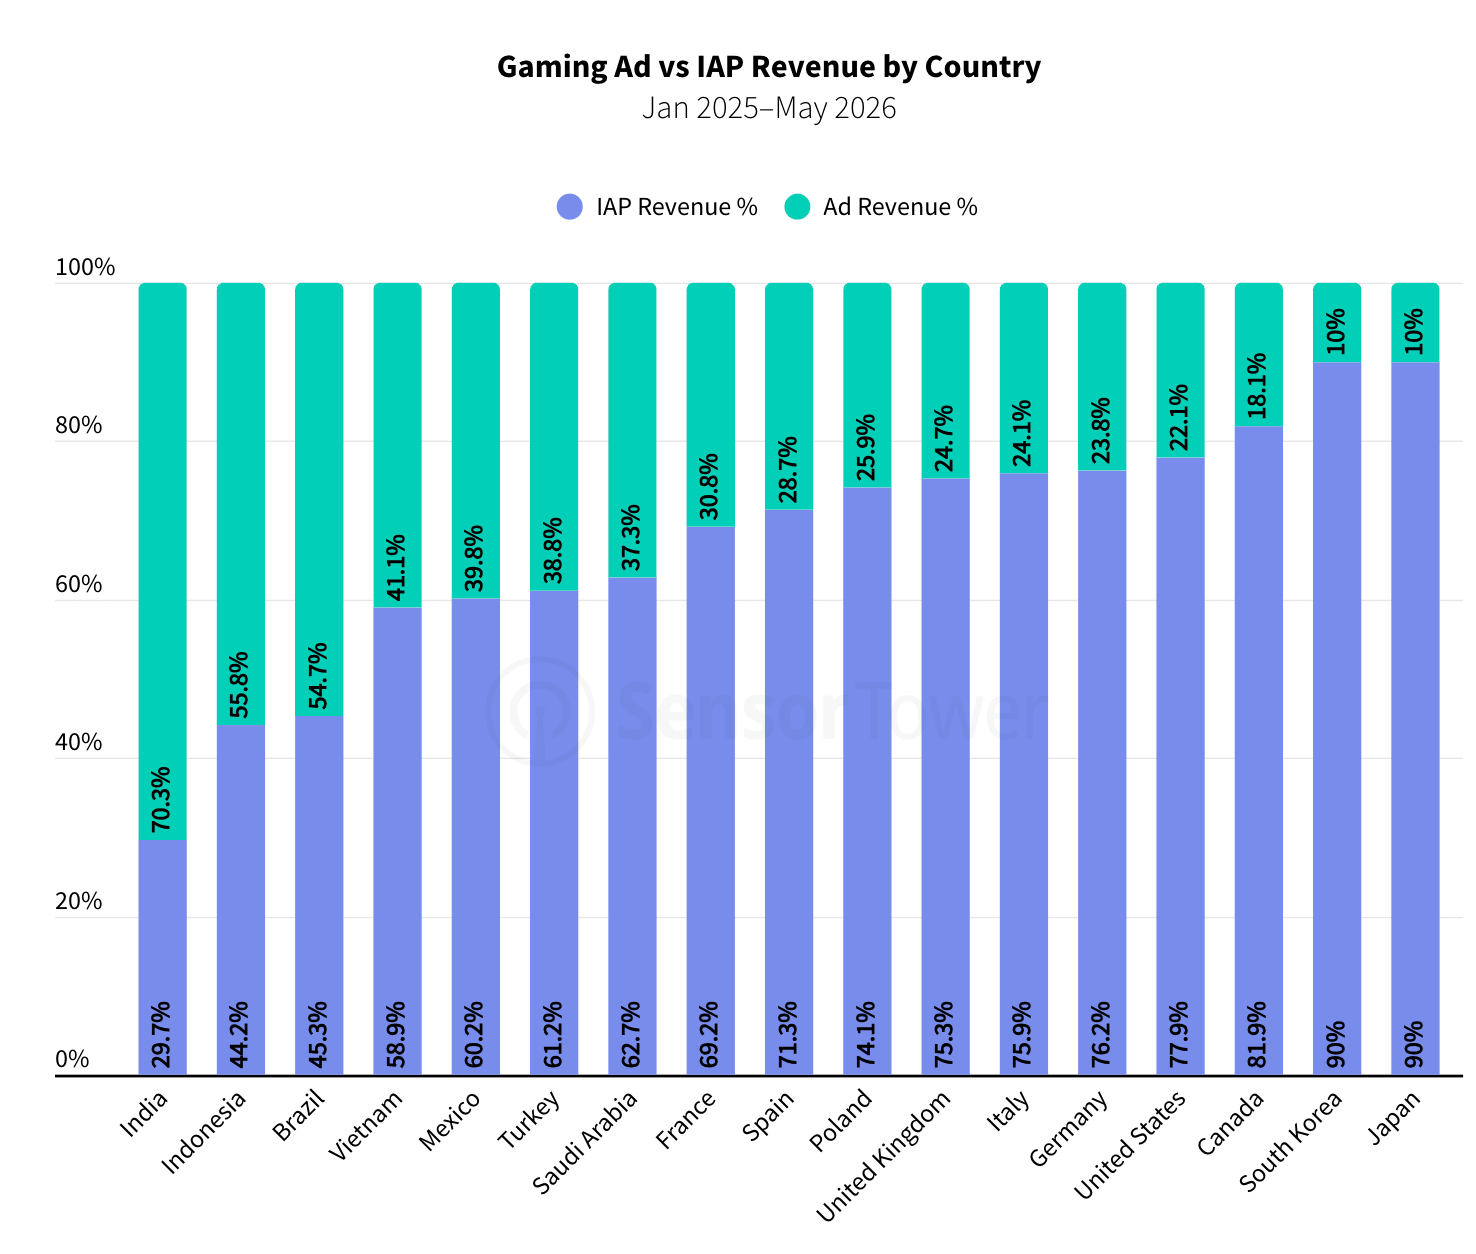
Ad revenue dominates in only three large markets: India (70.3%), Indonesia (55.8%), and Brazil (54.7%). Sensor Tower notes that the approach to the product and to running it should be different when entering these markets, since payment behavior differs a lot from T1 markets.
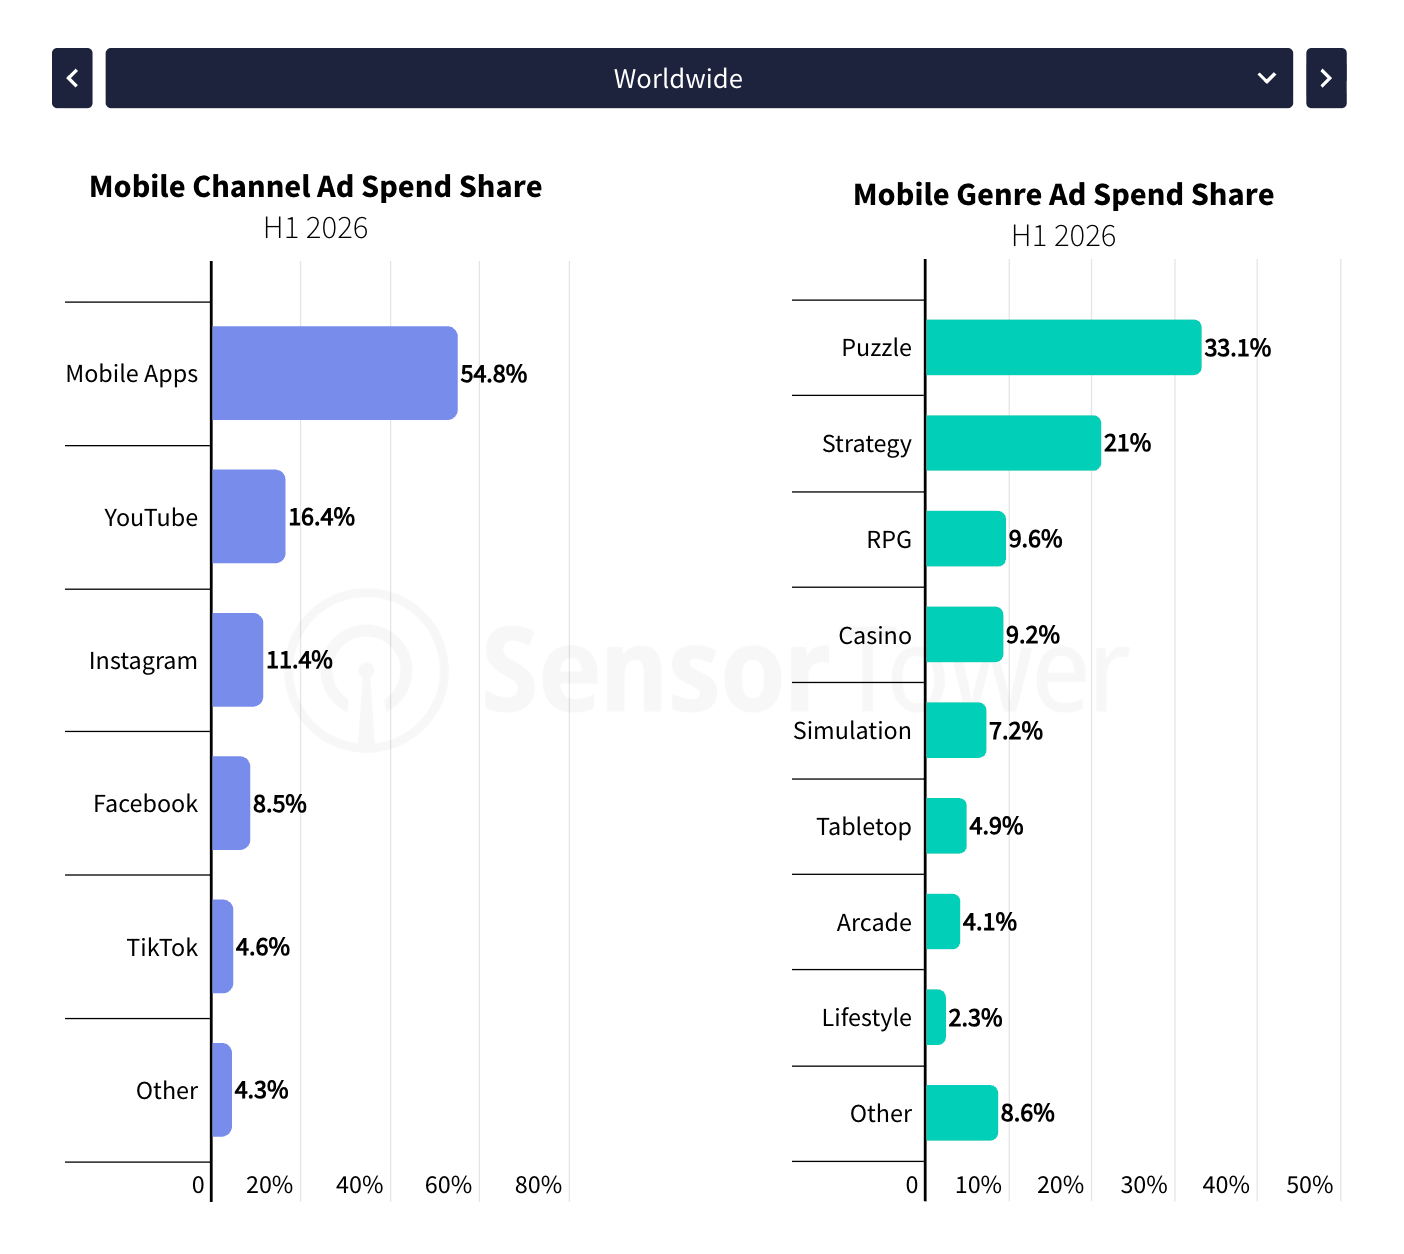
54.8% of all ad impressions come from in-app inventory. YouTube is second (16.4% - and it’s the fastest-growing channel in H1’26), Instagram third (11.4%).
By genre, more than half of all spend goes to Puzzle (33.1%) and Strategy (21%). In Tier-1 Asian countries, more of the spend goes to Strategy.
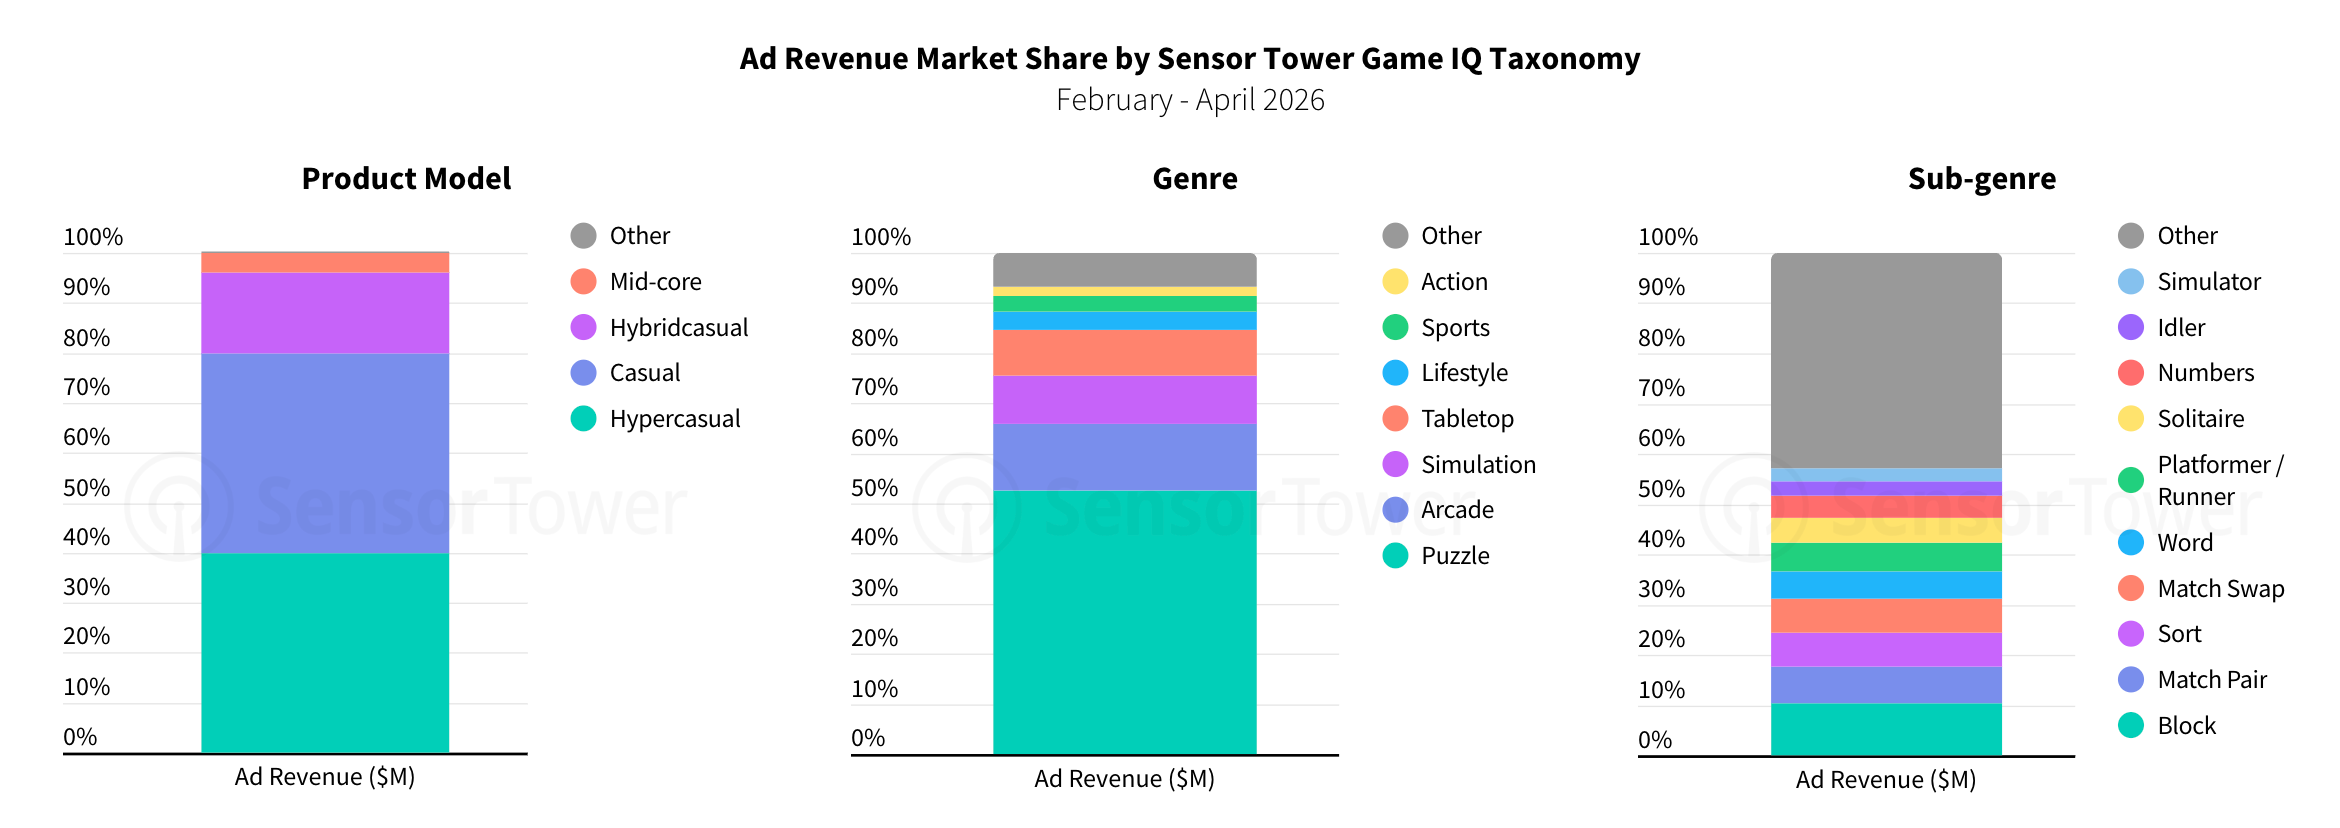
By Sensor Tower’s estimates, ad revenue from February through April 2026 breaks down as follows: hypercasual games - $2.02 billion, casual - $2.01 billion, hybridcasual - $827 million, mid-core - $190 million.
By genre, Puzzle accounts for 53% of ad revenue ($2.65 billion).
By sub-genre, Block leads with $519 million (10% of all ad revenue, thanks to Block Blast!).
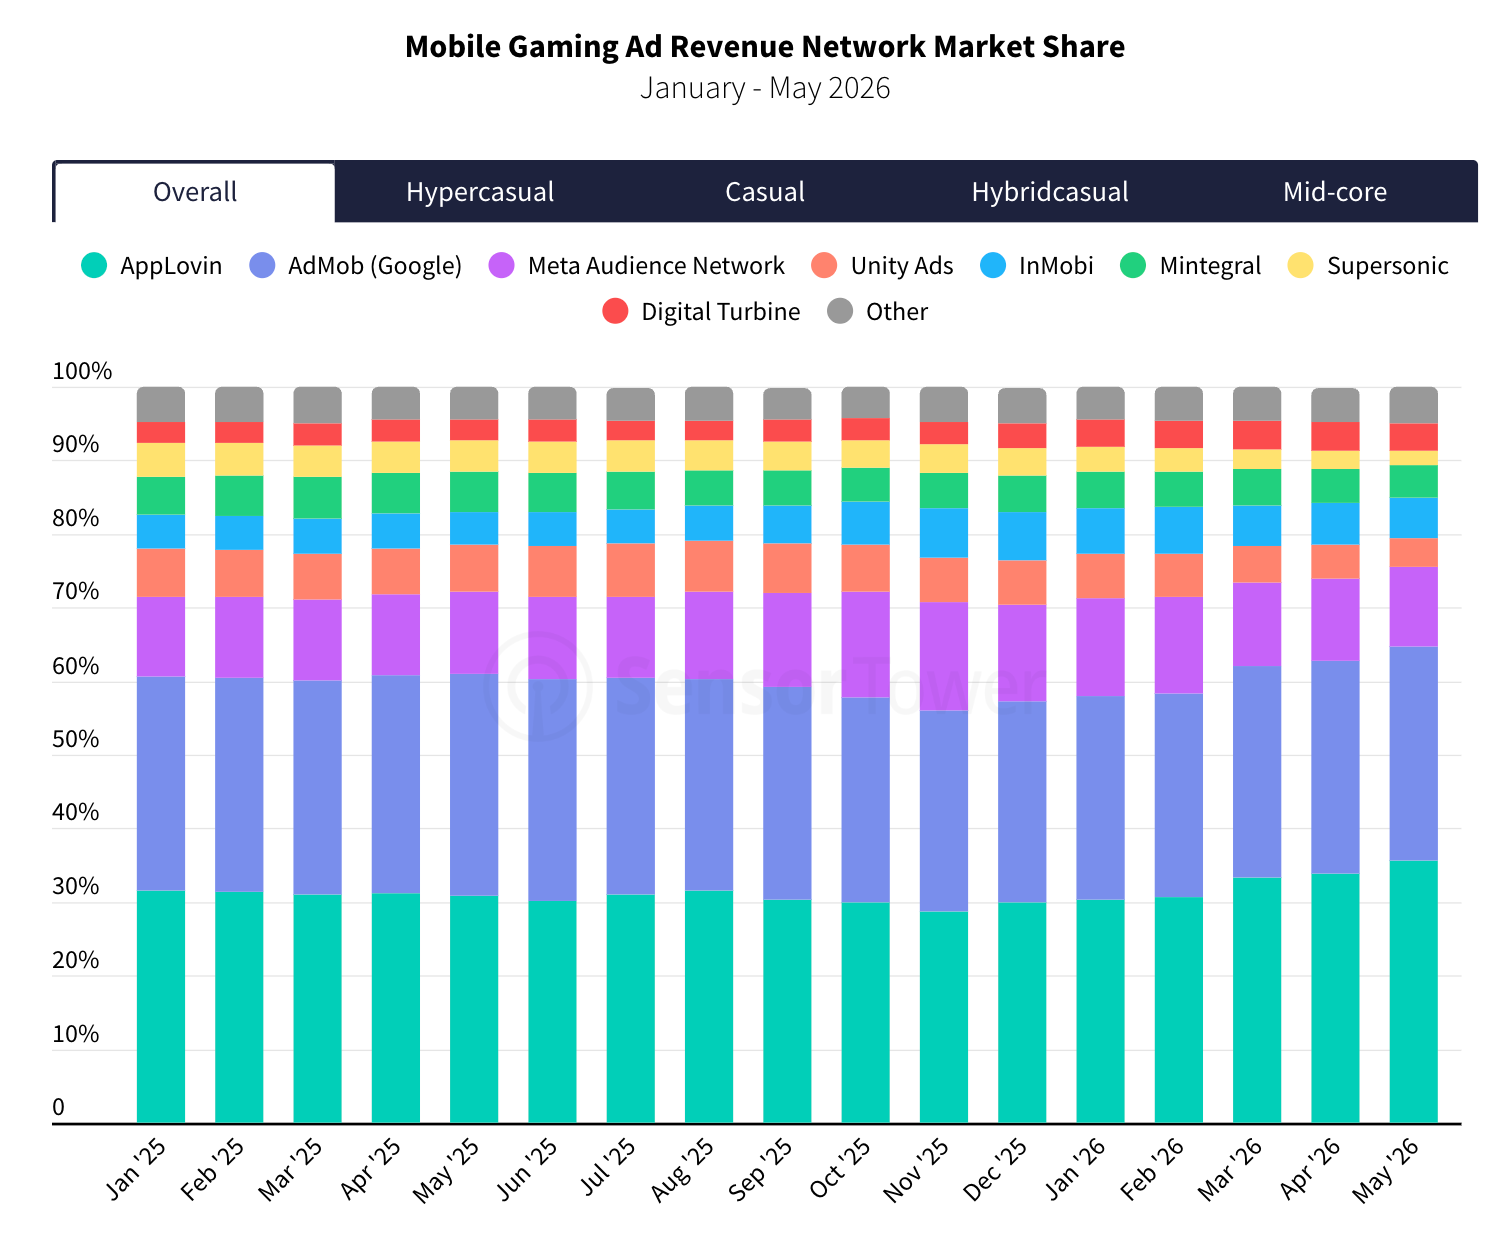
AppLovin and AdMob accounted for almost 65% of all mobile game ad revenue in May 2026, against 61% in January 2025. AppLovin has 35.6%, AdMob 29.2%.
The networks that fell the most are Unity Ads (from 6.5% to 3.8%) and Supersonic (from 4.6% to 1.9%).


AppLovin shows strong results in the hypercasual, hybridcasual, and casual segments. AdMob leads by a wide margin in the mid-core segment (57.8% in May 2026).
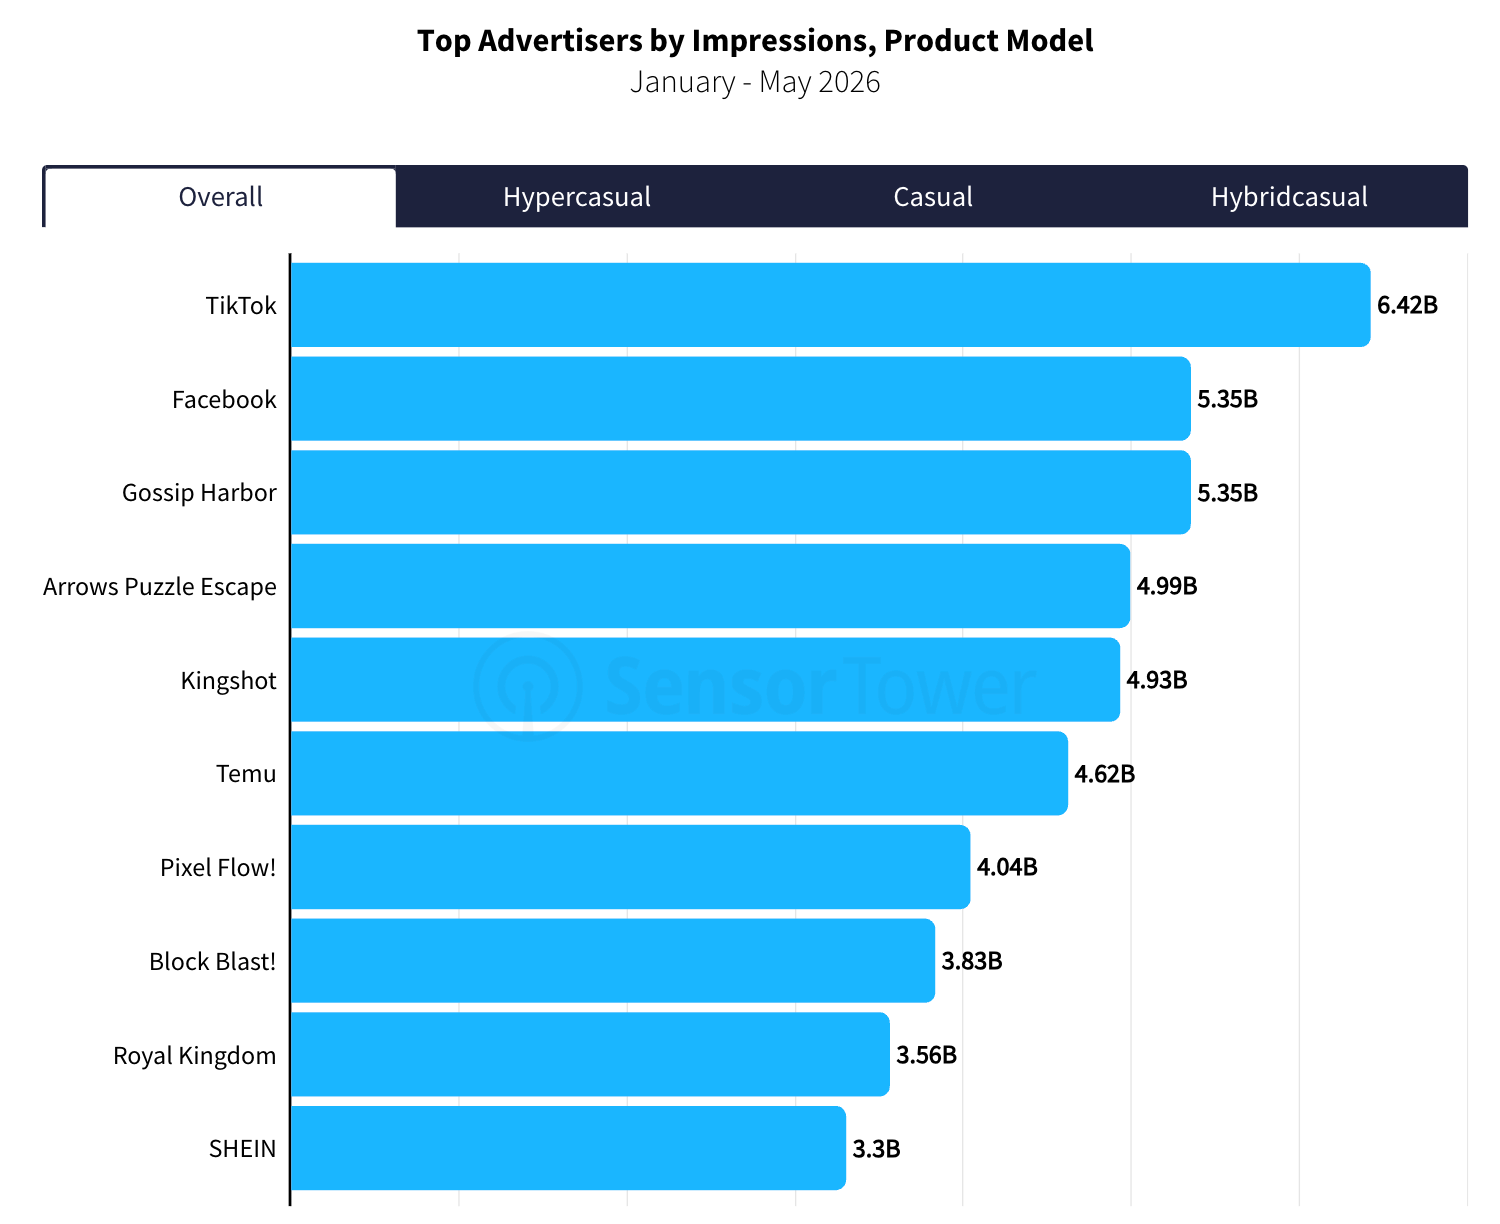
Top advertisers inside mobile games by impressions (January-May 2026): TikTok (6.42 billion), Facebook (5.35 billion), Gossip Harbor (5.35 billion), Arrows Puzzle Escape (4.99 billion), Kingshot (4.93 billion).


In the US, the largest advertiser is Pixel Flow!, with 2.4 billion impressions - the game outspends both social platforms and e-commerce.
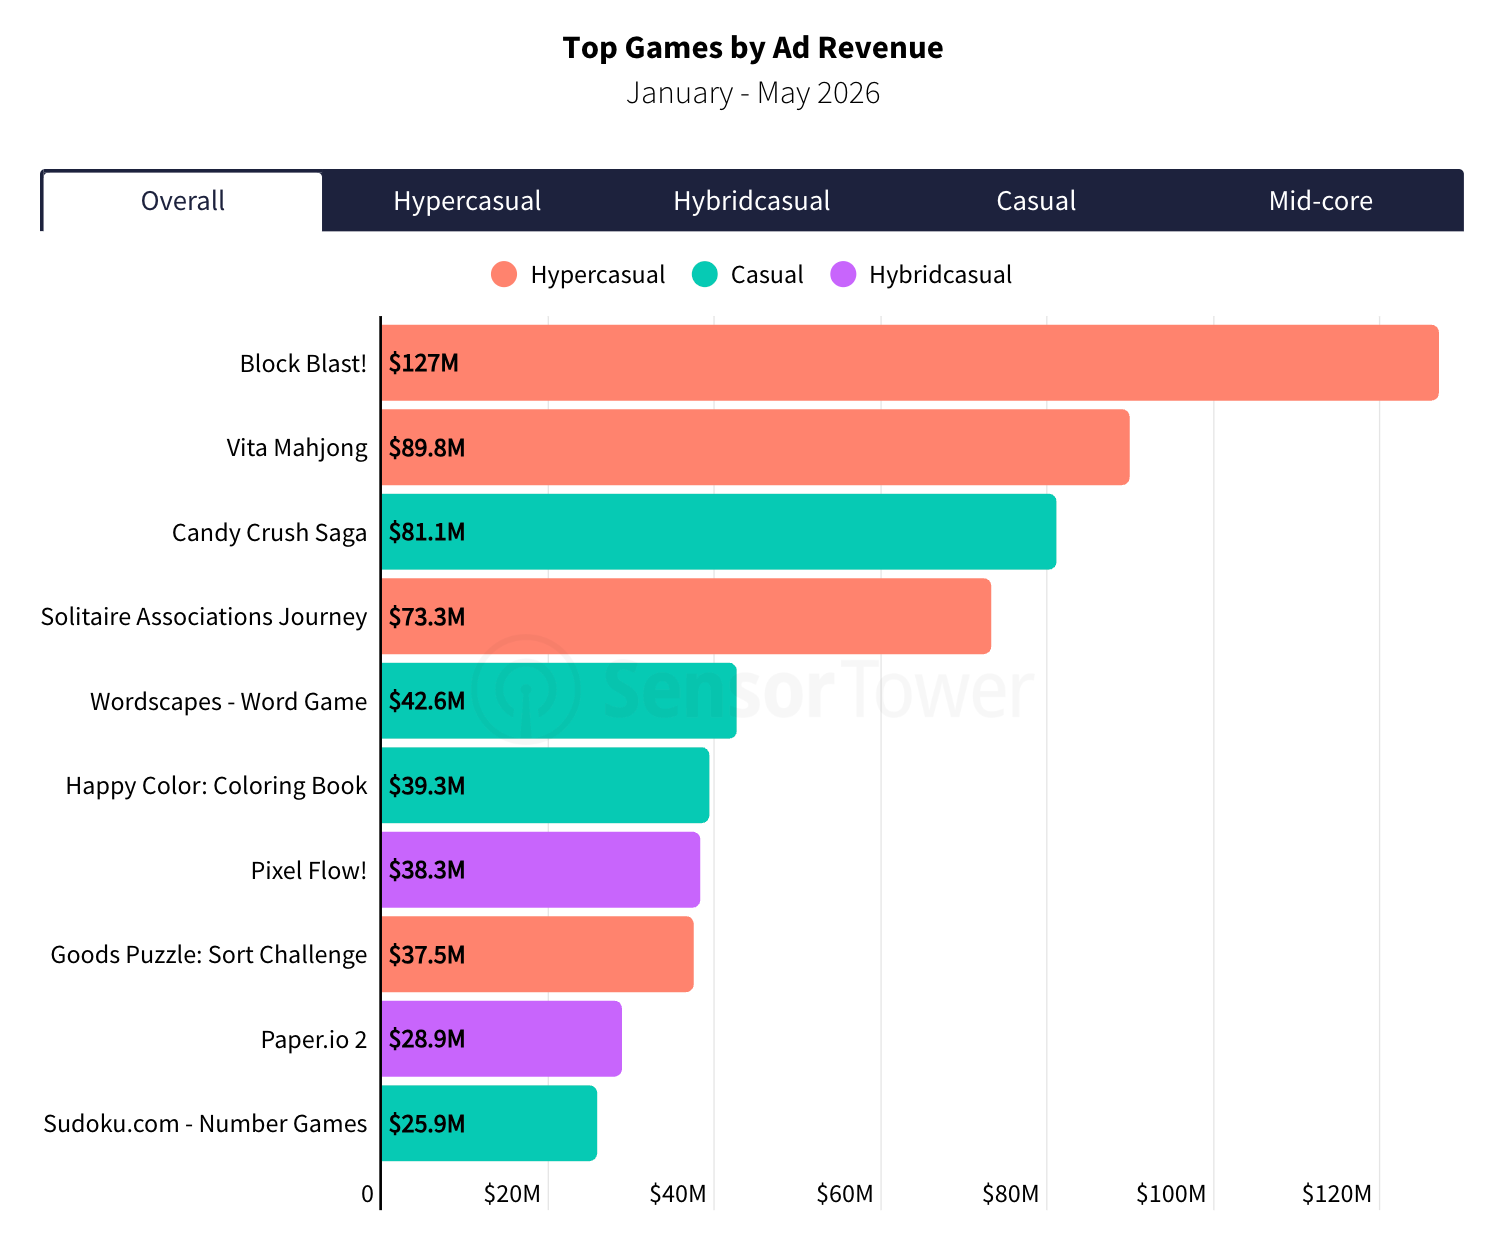
Top games by ad revenue (January-May 2026): Block Blast! $127 million, Vita Mahjong $89.8 million, Candy Crush Saga $81.1 million.


Vita Mahjong doubled its ad revenue year over year and overtook Candy Crush Saga. Every casual game in the top 10 earned less over the first 5 months of 2026 than over the same period in 2025. All of the growth is concentrated in hypercasual projects and newcomers like Pixel Flow!.
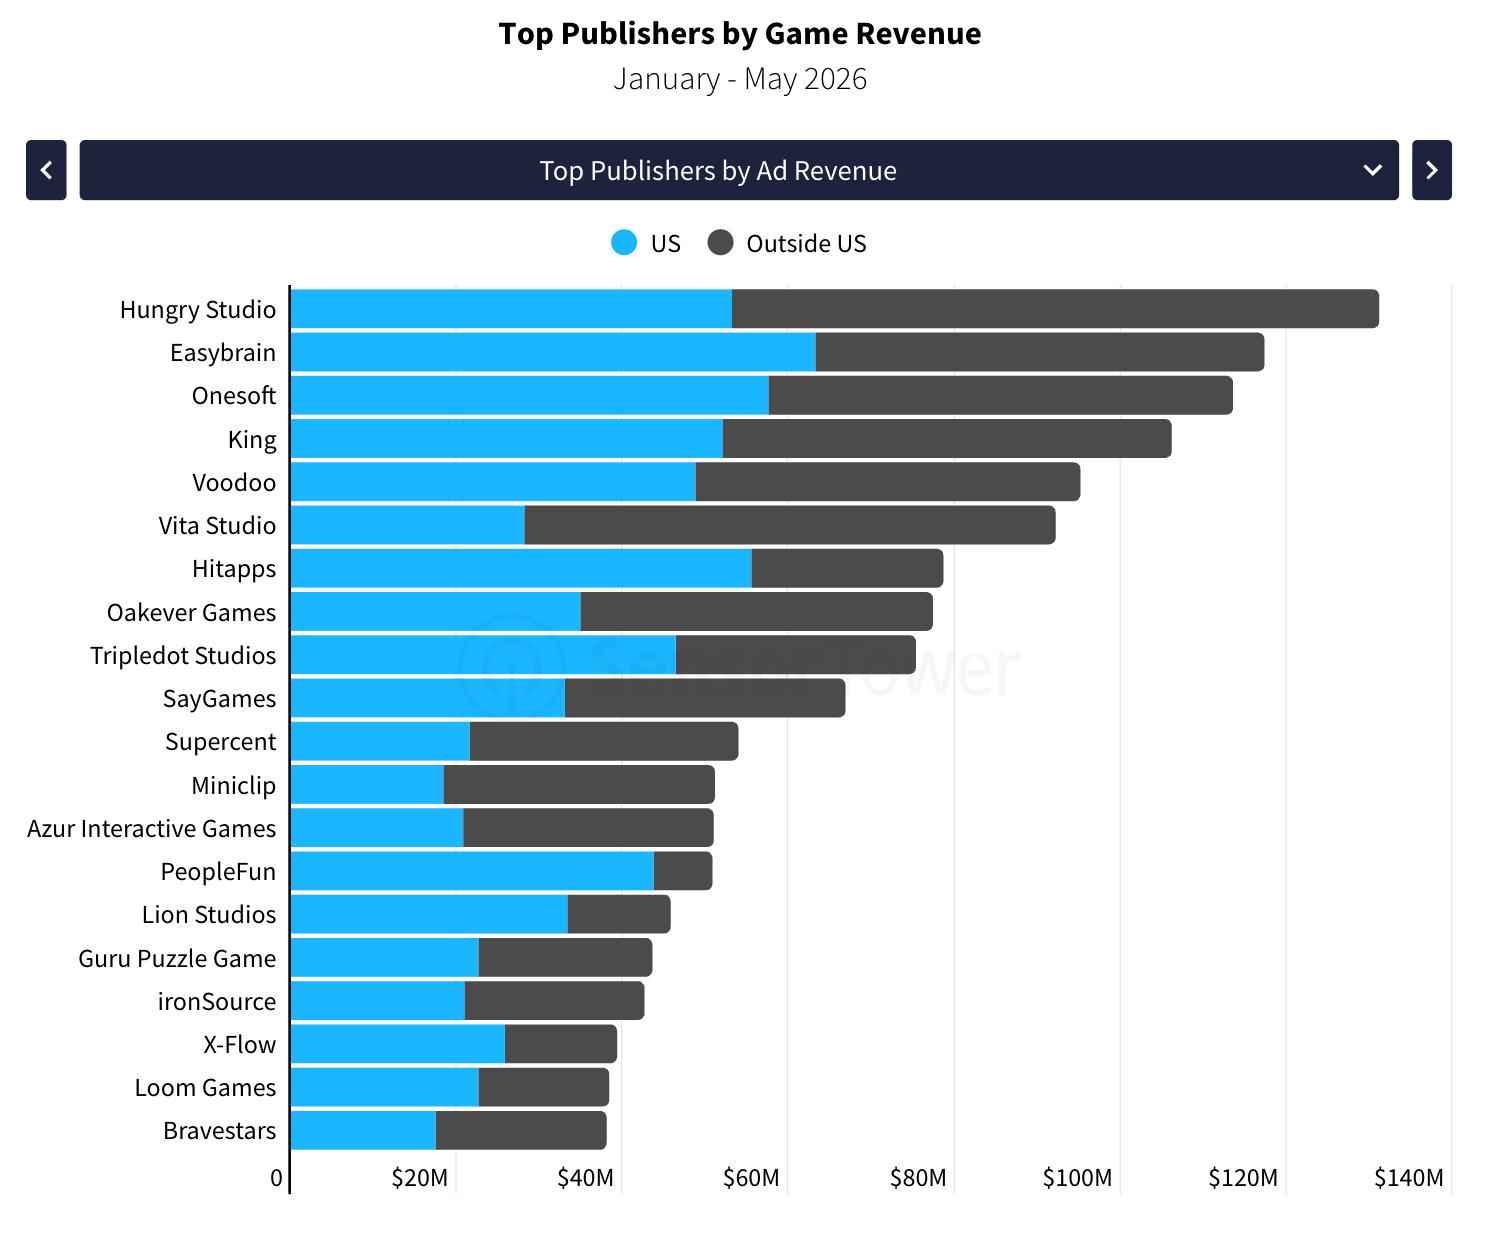
Among publishers, Hungry Studio leads with $131 million, 60% of which comes from markets outside the US. Almost all of the studio’s revenue is Block Blast!. On US revenue share, Easybrain (Sudoku.com) leads, followed by Onesoft (Goods Puzzle), with Hungry Studio only third.


The publisher rankings show that most of the top in T1 countries is taken by companies where IAP revenue overwhelmingly outweighs ad revenue.
PC and Console Market
The PC/console market is estimated using Video Game Insights data. It covers 140,000+ games in 50+ countries on Steam, PlayStation and Xbox. Copies sold include free giveaways through subscriptions (PS Plus, Game Pass).
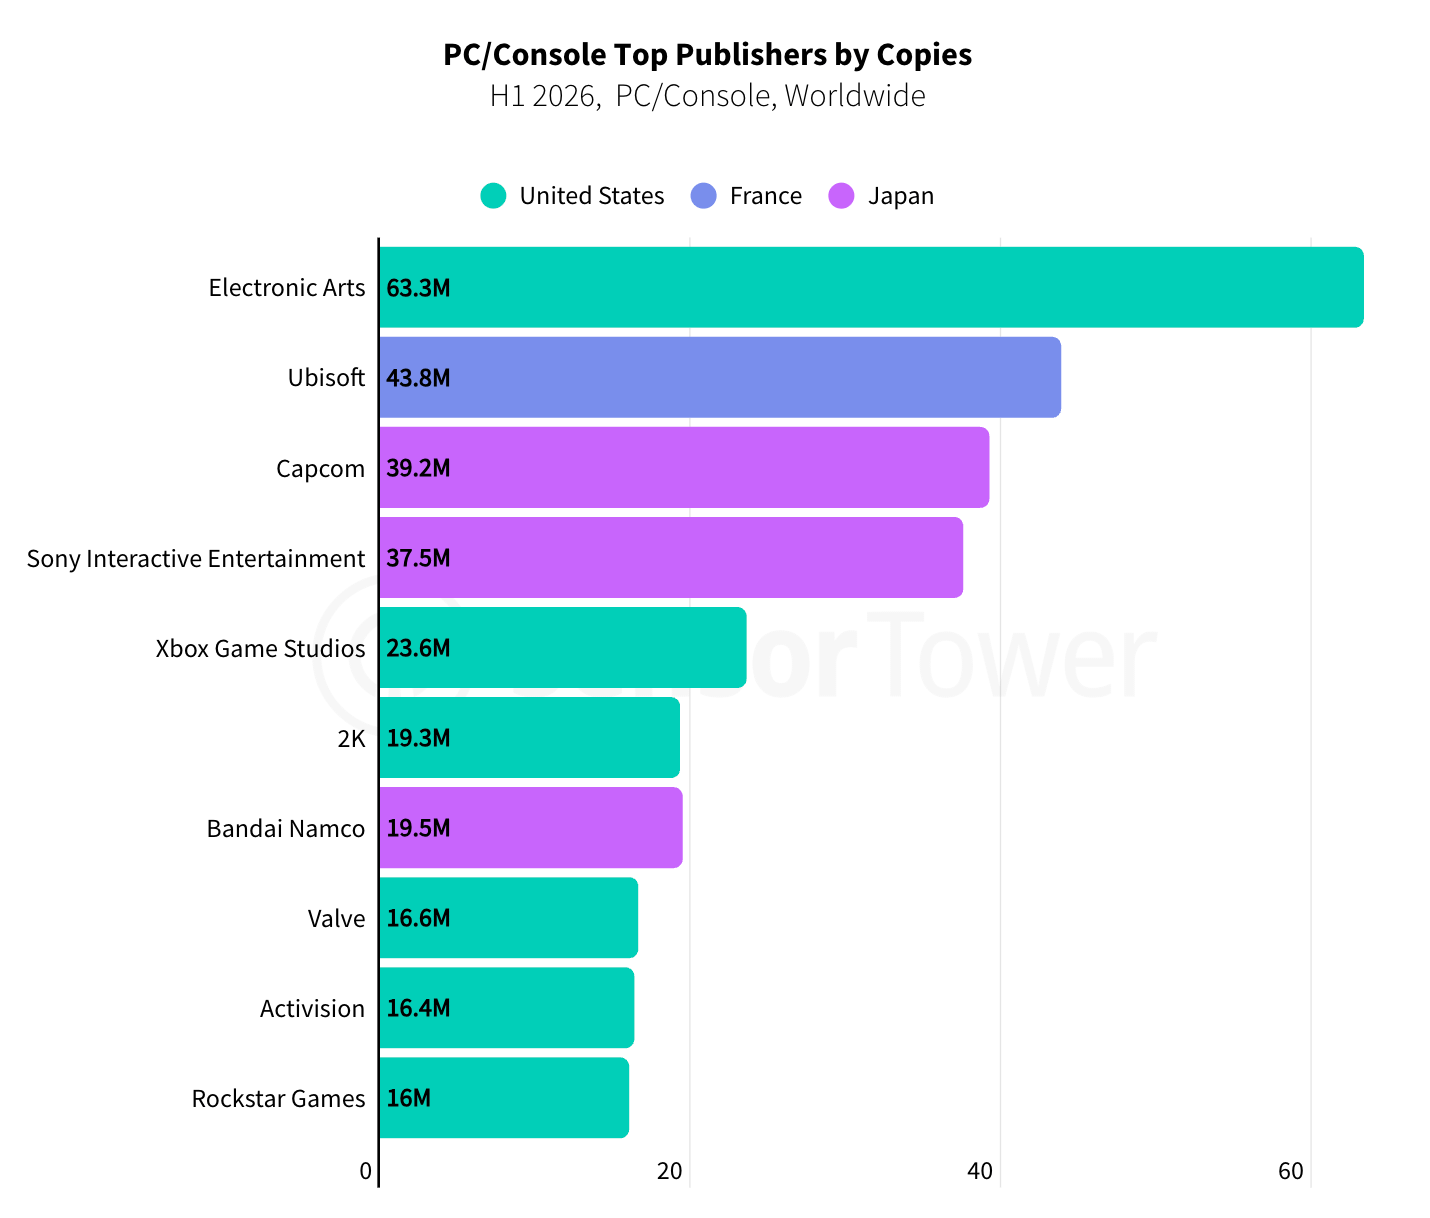
Top publishers by copies sold: EA (63.3 million), Ubisoft (43.8 million), Capcom (39.2 million), Sony (37.5 million), Xbox Game Studios (23.6 million). Six of the ten are American, three Japanese, and from Europe there’s only Ubisoft. The ranking includes free copies given away through PS+ and Xbox Game Pass.
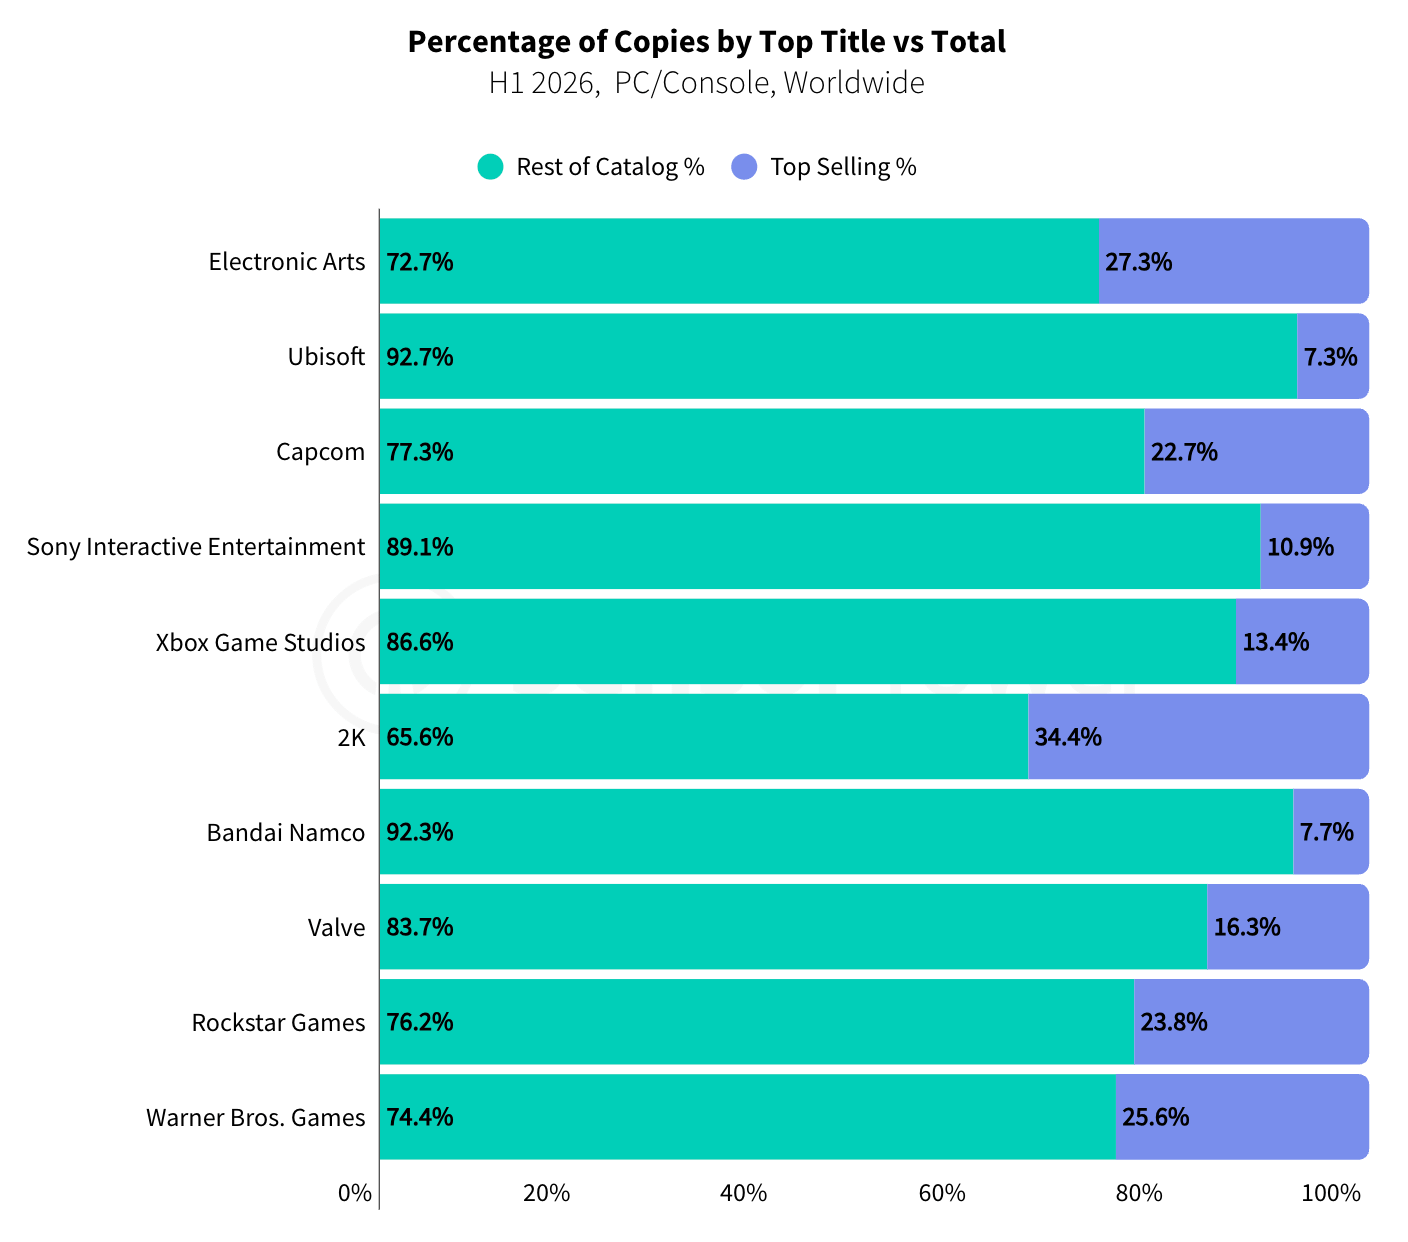
Sensor Tower calculated how dependent different companies are on a single project in 2026. For 2K, NBA 2K26 accounts for 34.4% of all copies; for EA, FC 26 is 27.3%; Warner Bros. 25.6%; Rockstar 23.8%; Capcom’s Resident Evil Requiem 22.7%. Ubisoft is in a healthier position - The Crew Motorfest accounts for 7.3% of copies. There’s no serious single-product dependency at Bandai Namco (7.7%), Sony (10.9%) or Xbox Game Studios (13.4%).
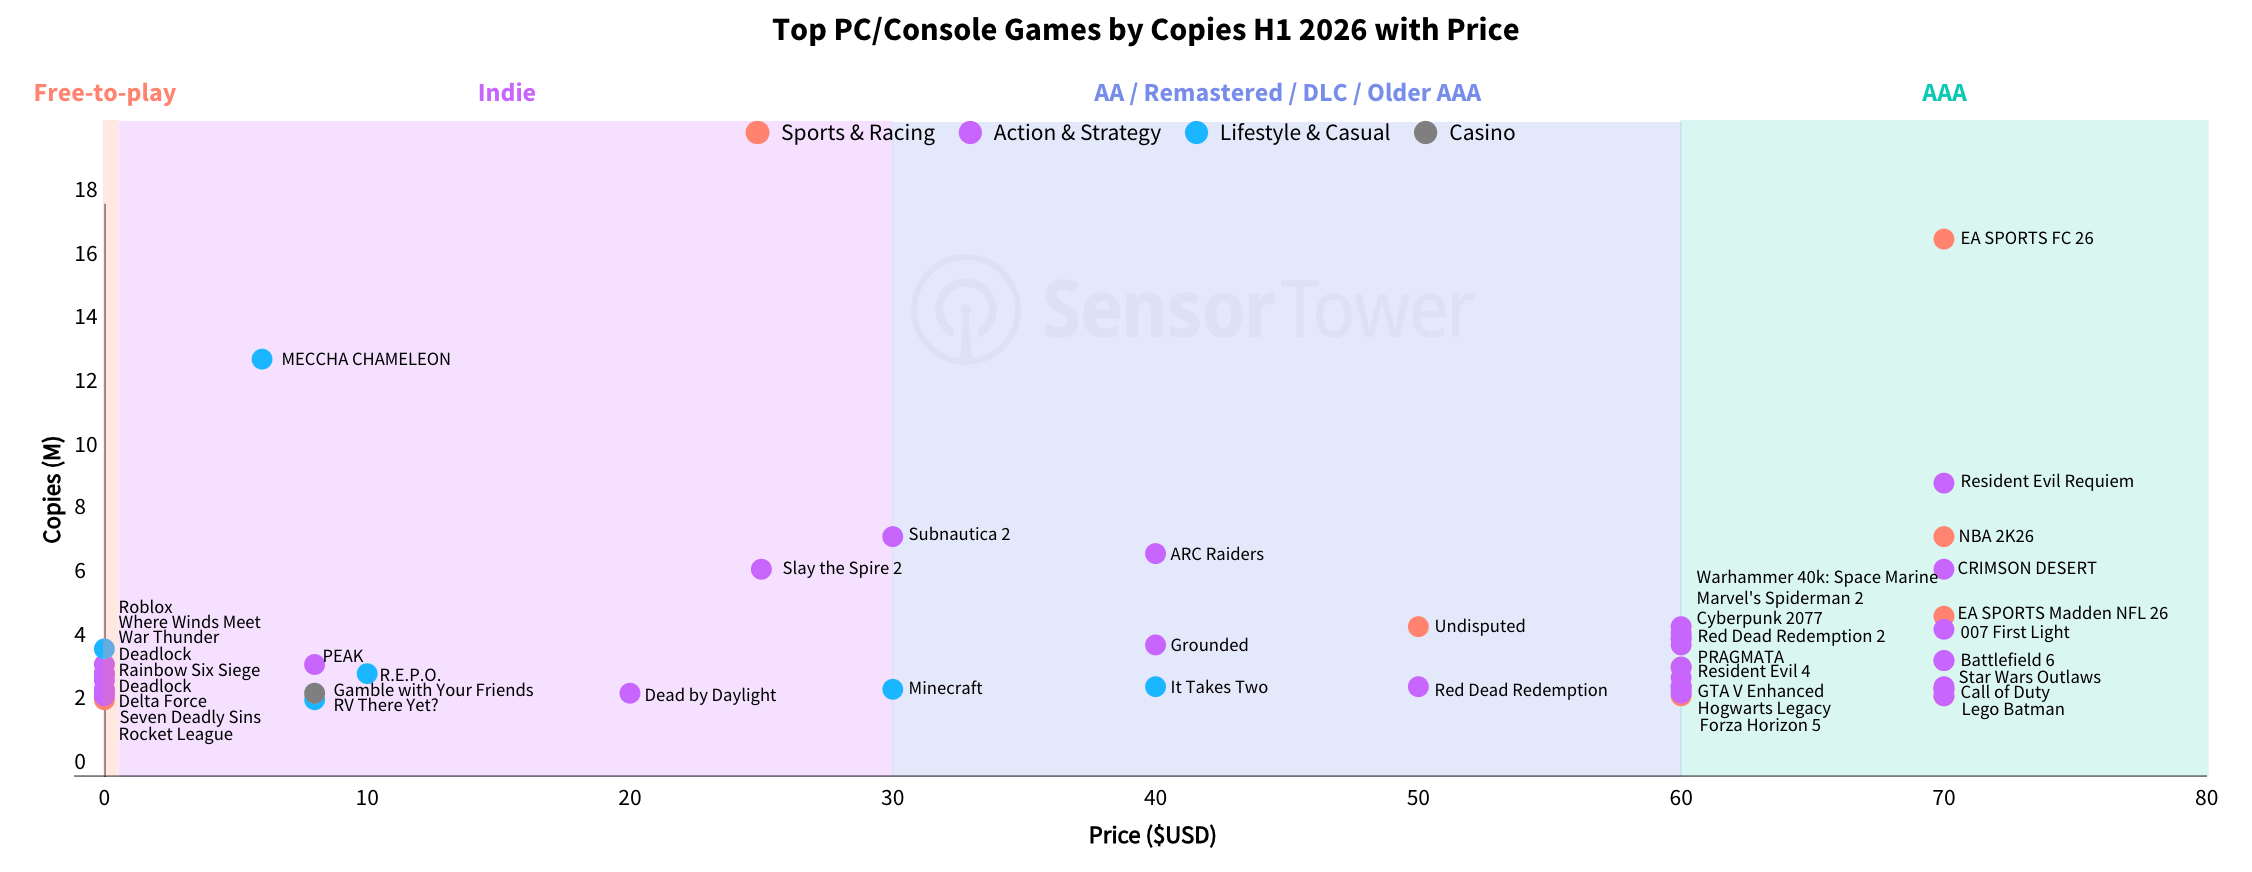
The best-selling game of the half (by copies) is EA SPORTS FC 26 ($70, 16.9 million copies). Second is MECCHA CHAMELEON - 13.1 million copies (though the game costs $6).
❗️MECCHA CHAMELEON’s sales have already passed 20 million copies by now.
Among F2P projects, Roblox comes first (4 million copies), then Where Winds Meet (3.5 million), skate. (3.2 million) and War Thunder (3.2 million).
It’s worth noting the density of cheap projects at the top of the chart: MECCHA CHAMELEON, PEAK (3.5 million copies), R.E.P.O. (3.2 million copies), and, at a stretch, Slay the Spire 2 belongs here too (the game priced at $25).
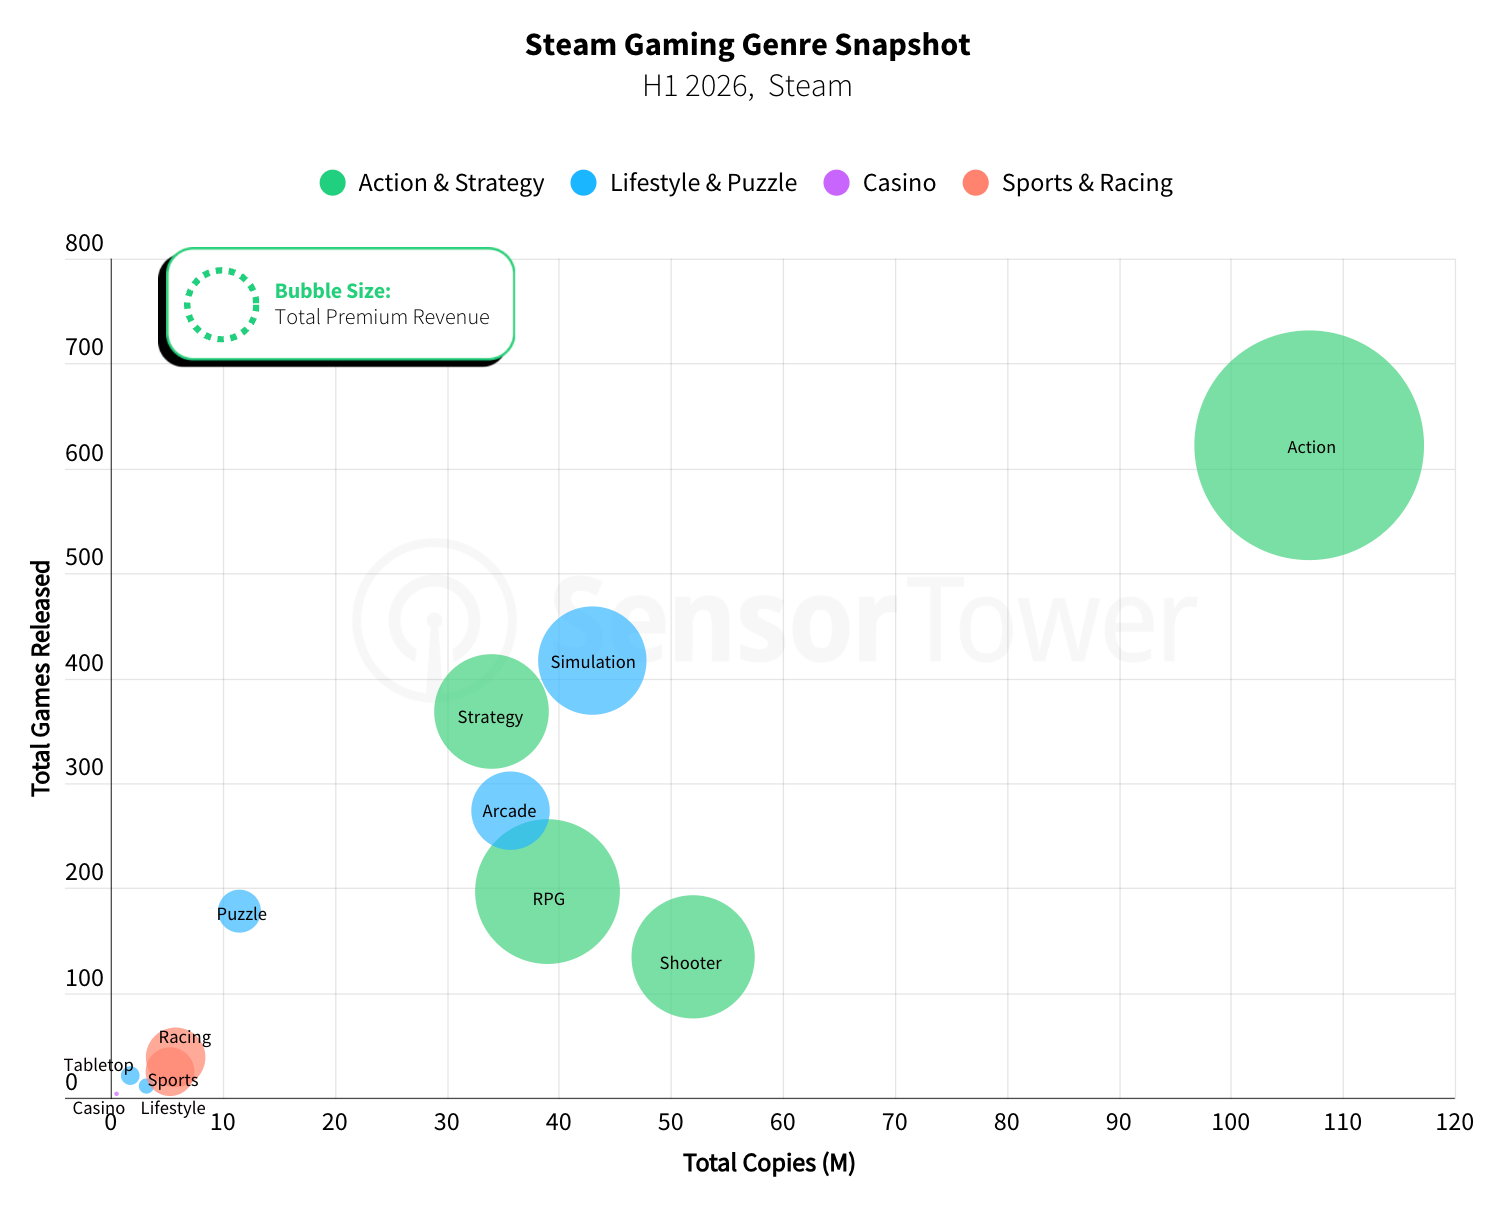
Action is Steam's most popular genre. It accounted for 107 million copies, 622 releases, and $2.005 billion in revenue from copy sales, which is about 40% of the market.
RPG is the best genre in terms of monetization. 39 million copies sold brought in $786 million. 197 projects came out in the genre.
Shooters are bought more often - 52 million copies in H1’26 - but they earn less ($566 million on 134 releases).
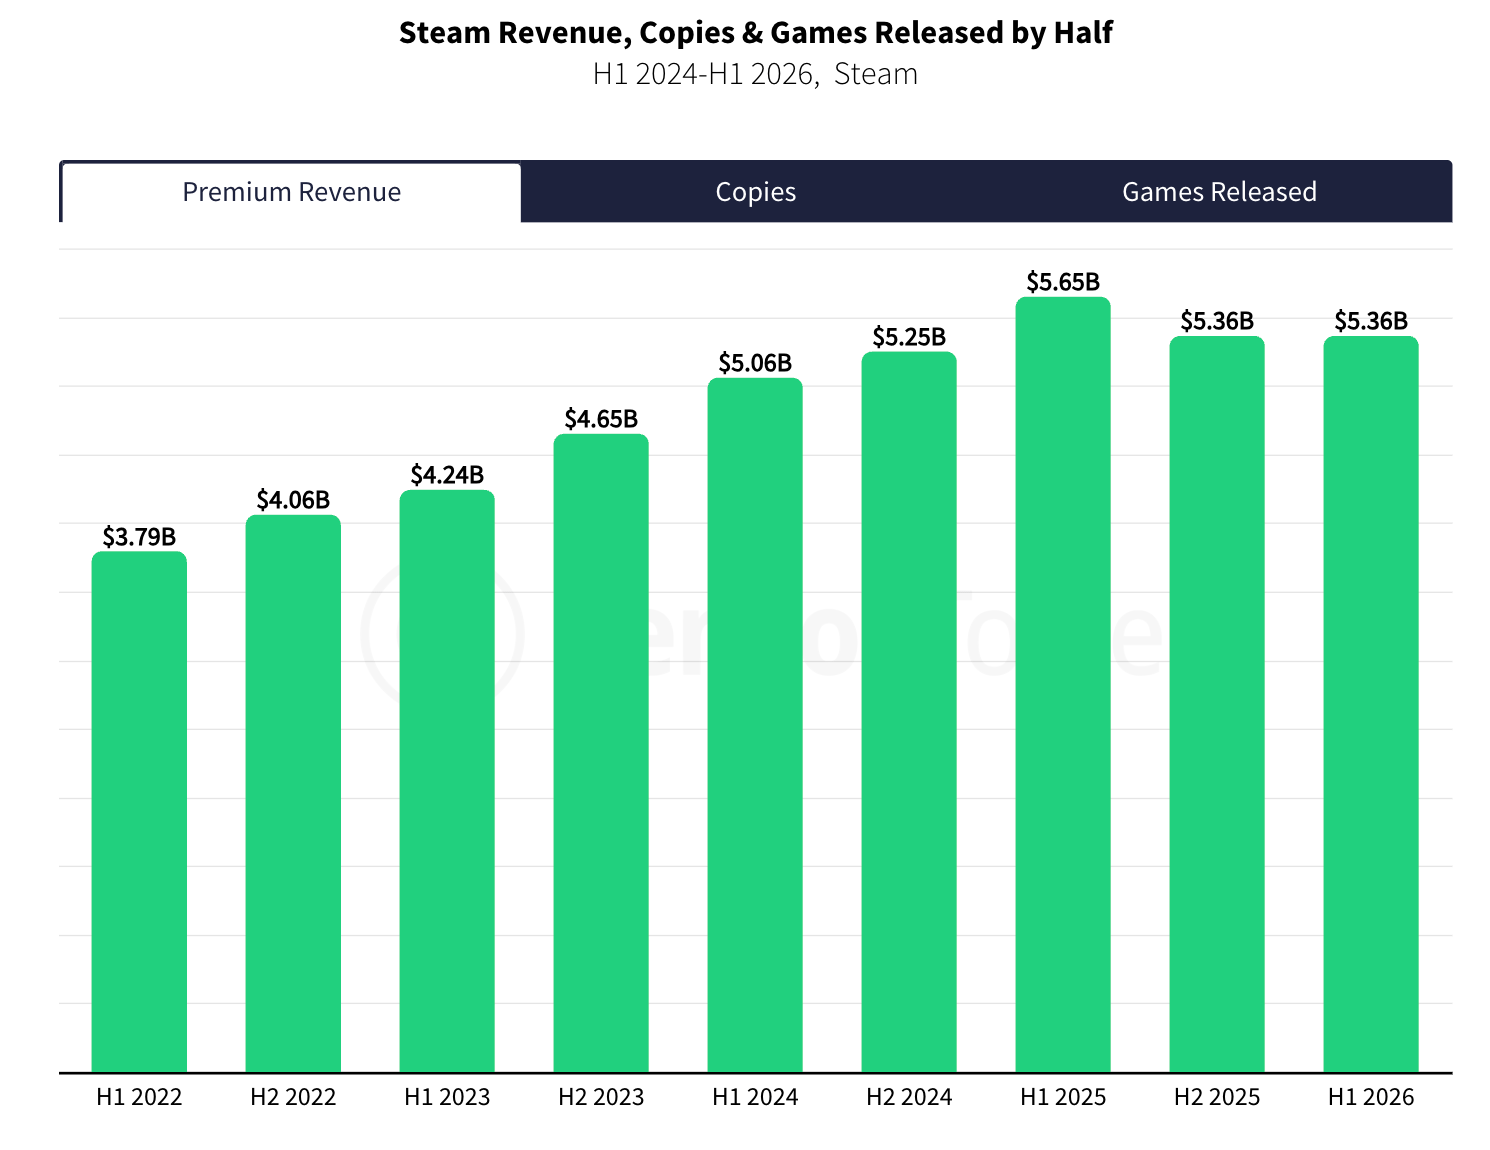
Steam’s revenue growth has stalled for the first time in several years. In H1’26 revenue came to $5.36 billion - 5% less than in H1’25 ($5.65 billion).
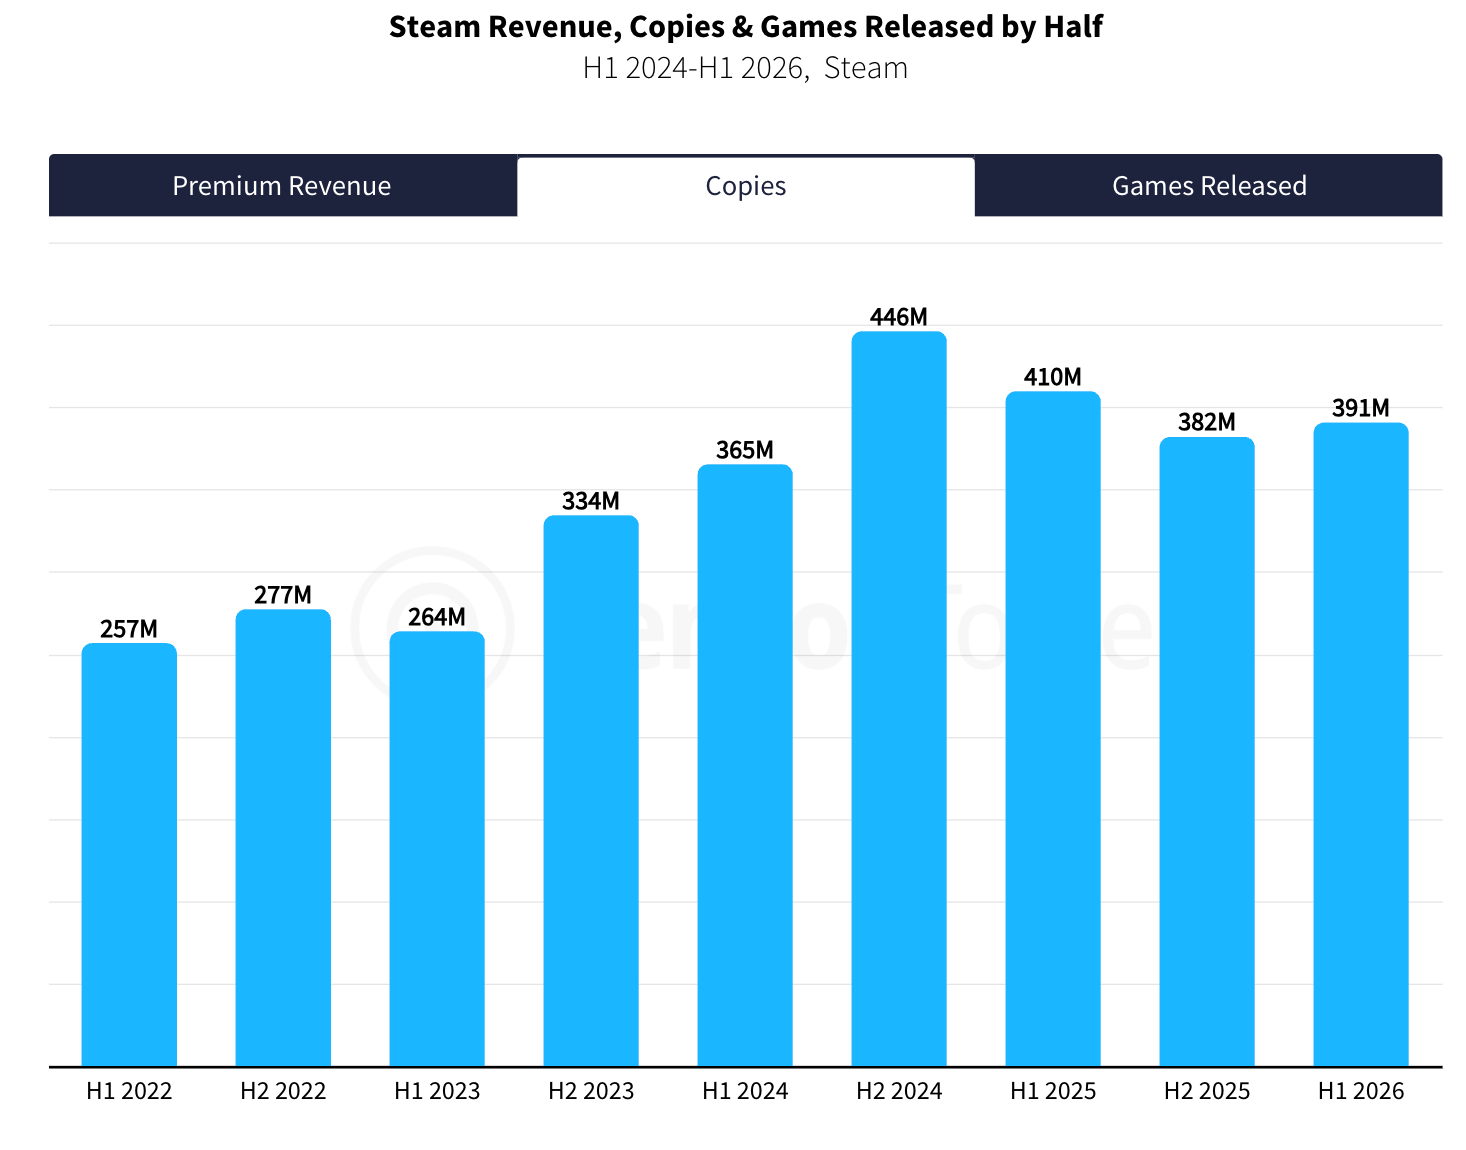
The picture on copies sold is similar.
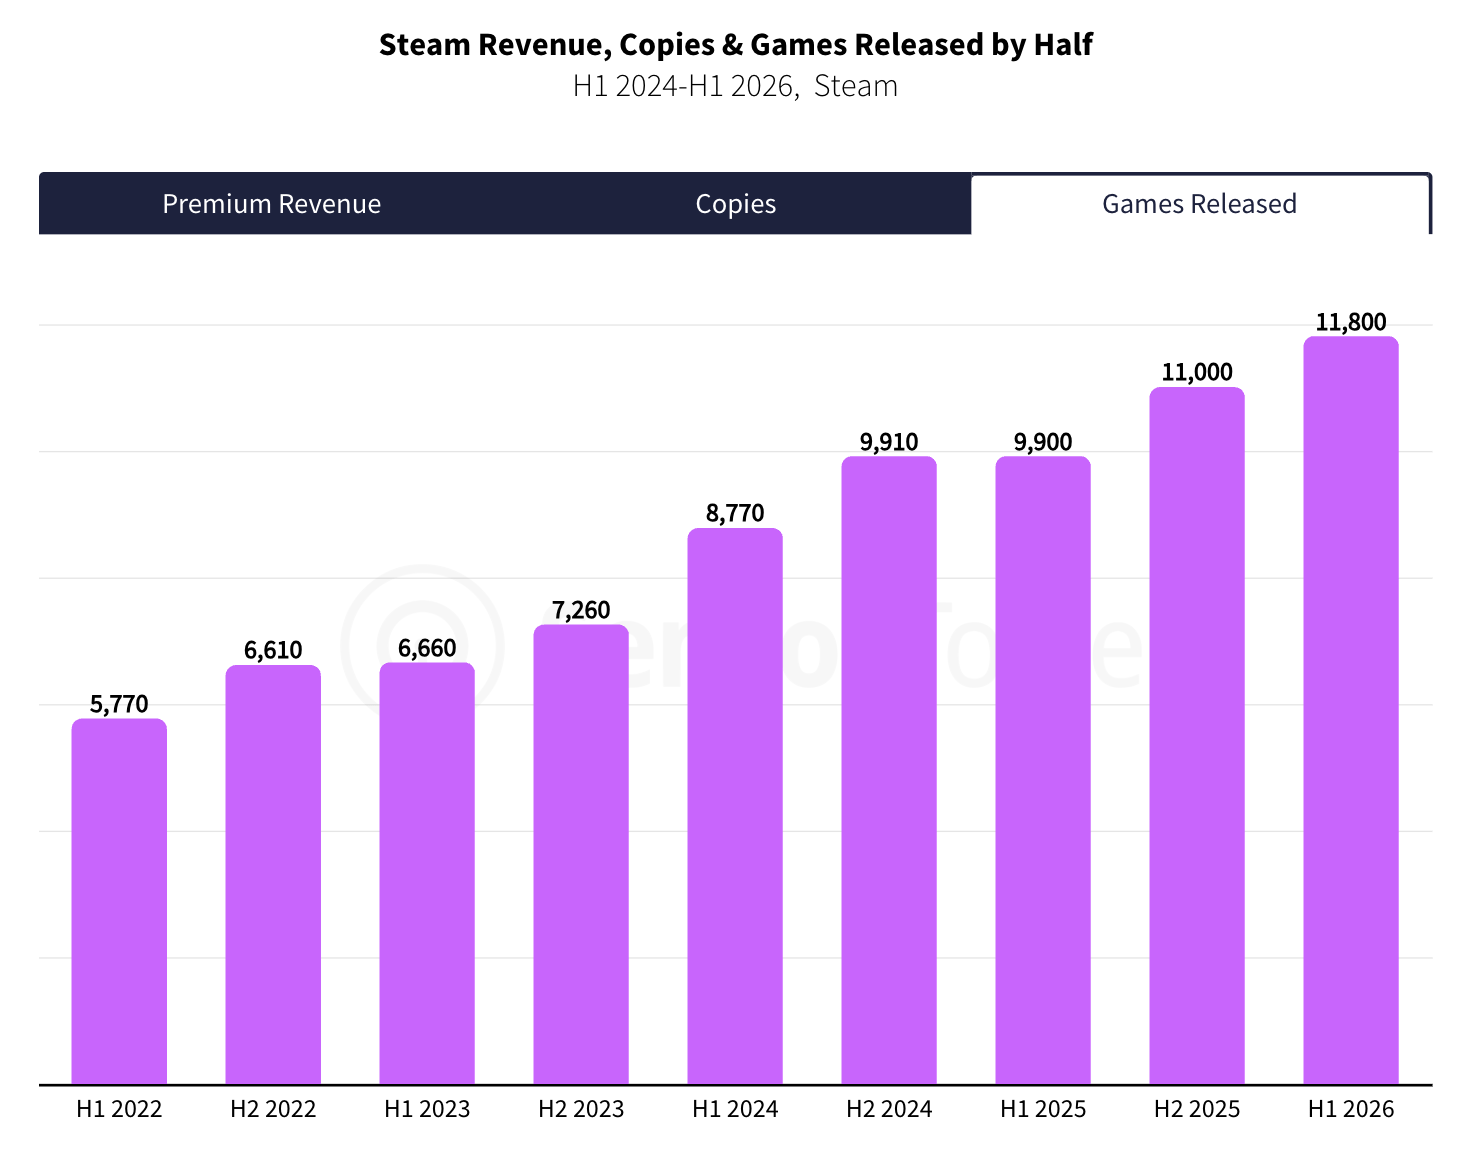
At the same time, competition is getting tougher. 11,800 games have already come out in H1’26 - more than in any other half over the last 5 years (and in history, for that matter).
❗️Given how many companies are jumping into the PC/console market, I’d guess a lot of them will have some unpleasant surprises.
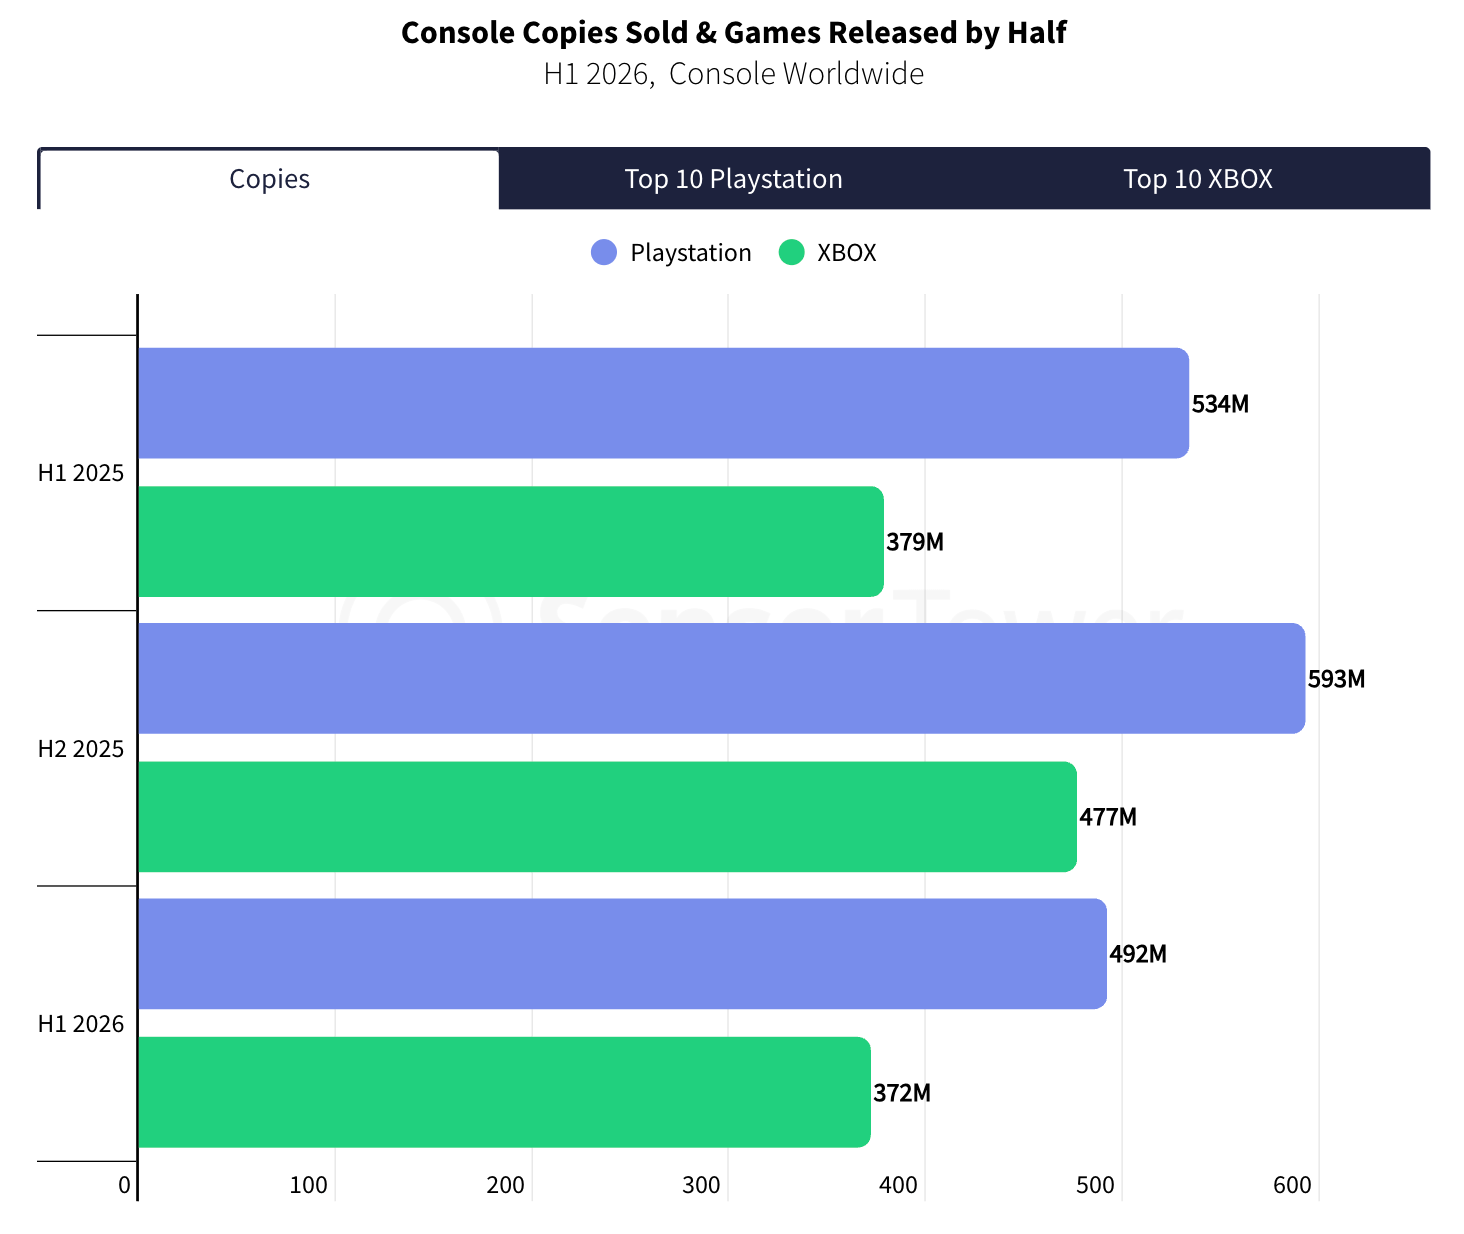
Game sales on PlayStation fell vs. last year and vs. the previous half. 492 million copies were sold in H1’26. Xbox shows similar dynamics, with 372 million copies sold in H1’26.
❗️Given the difference in console sales, Xbox players buy/download new projects more actively.
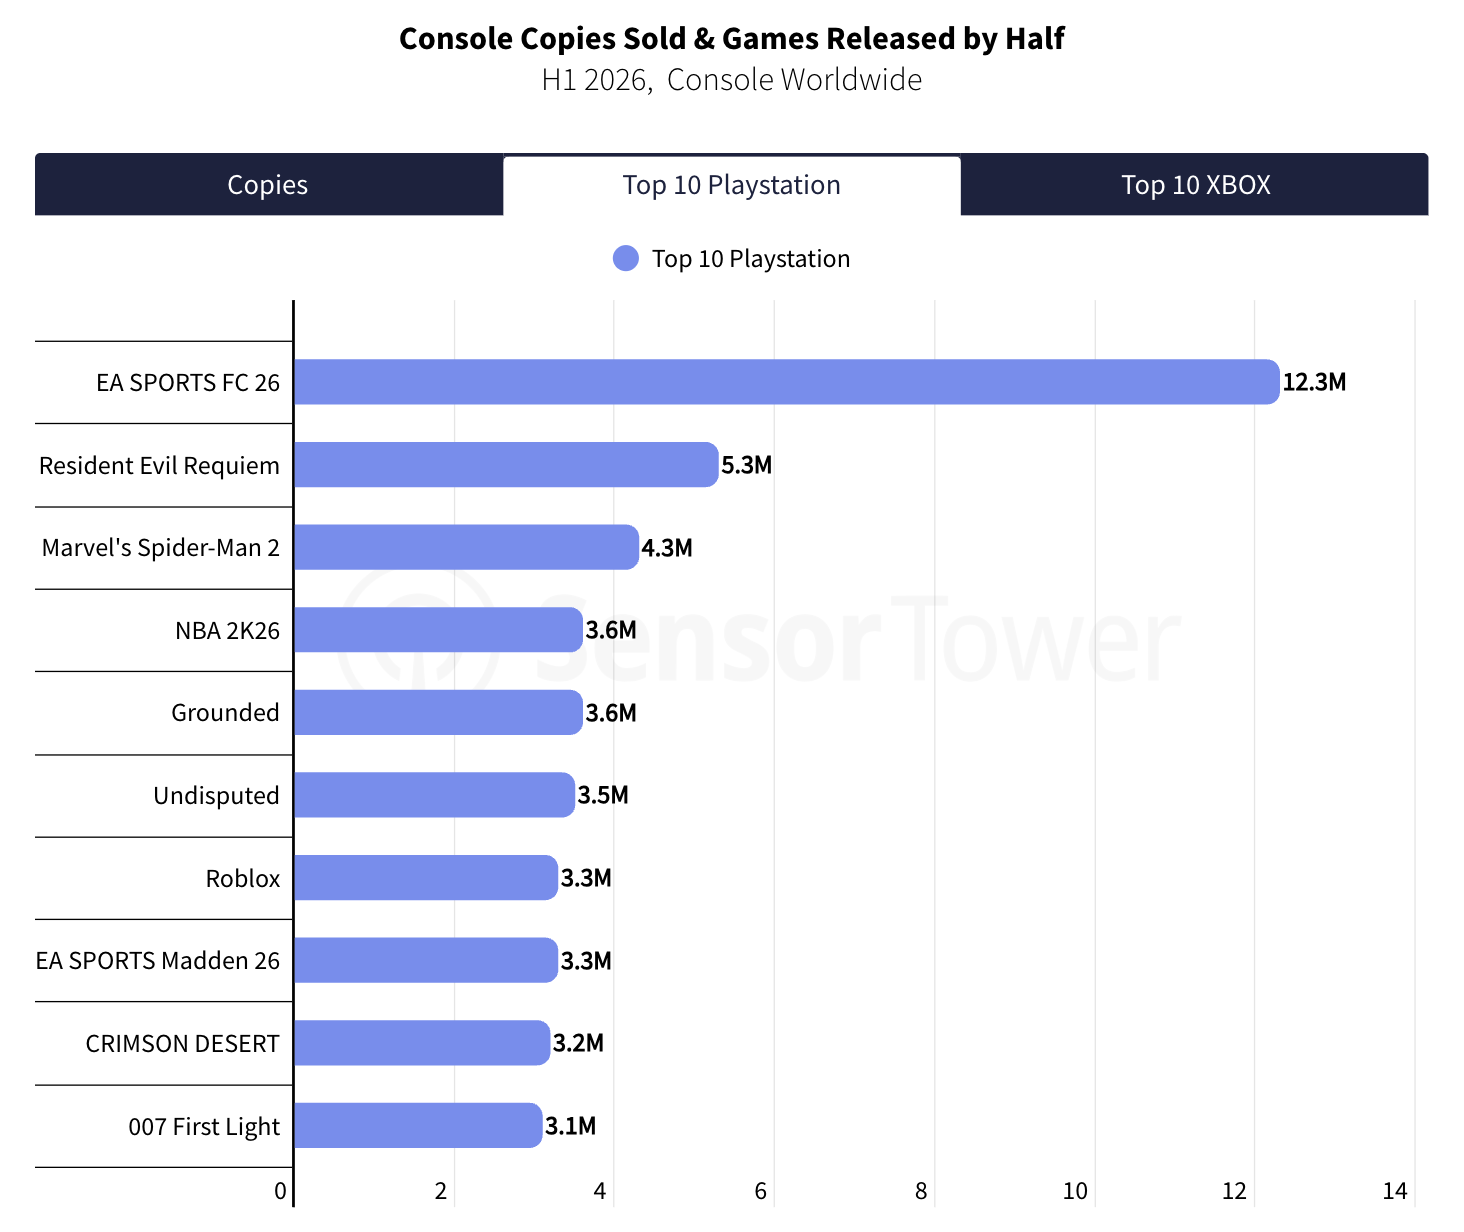
On PlayStation in H1’26, EA SPORTS FC 26 leads by a wide margin - 12.3 million copies; Resident Evil Requiem is second (5.3 million copies) and Marvel’s Spider-Man 2 third (4.3 million).
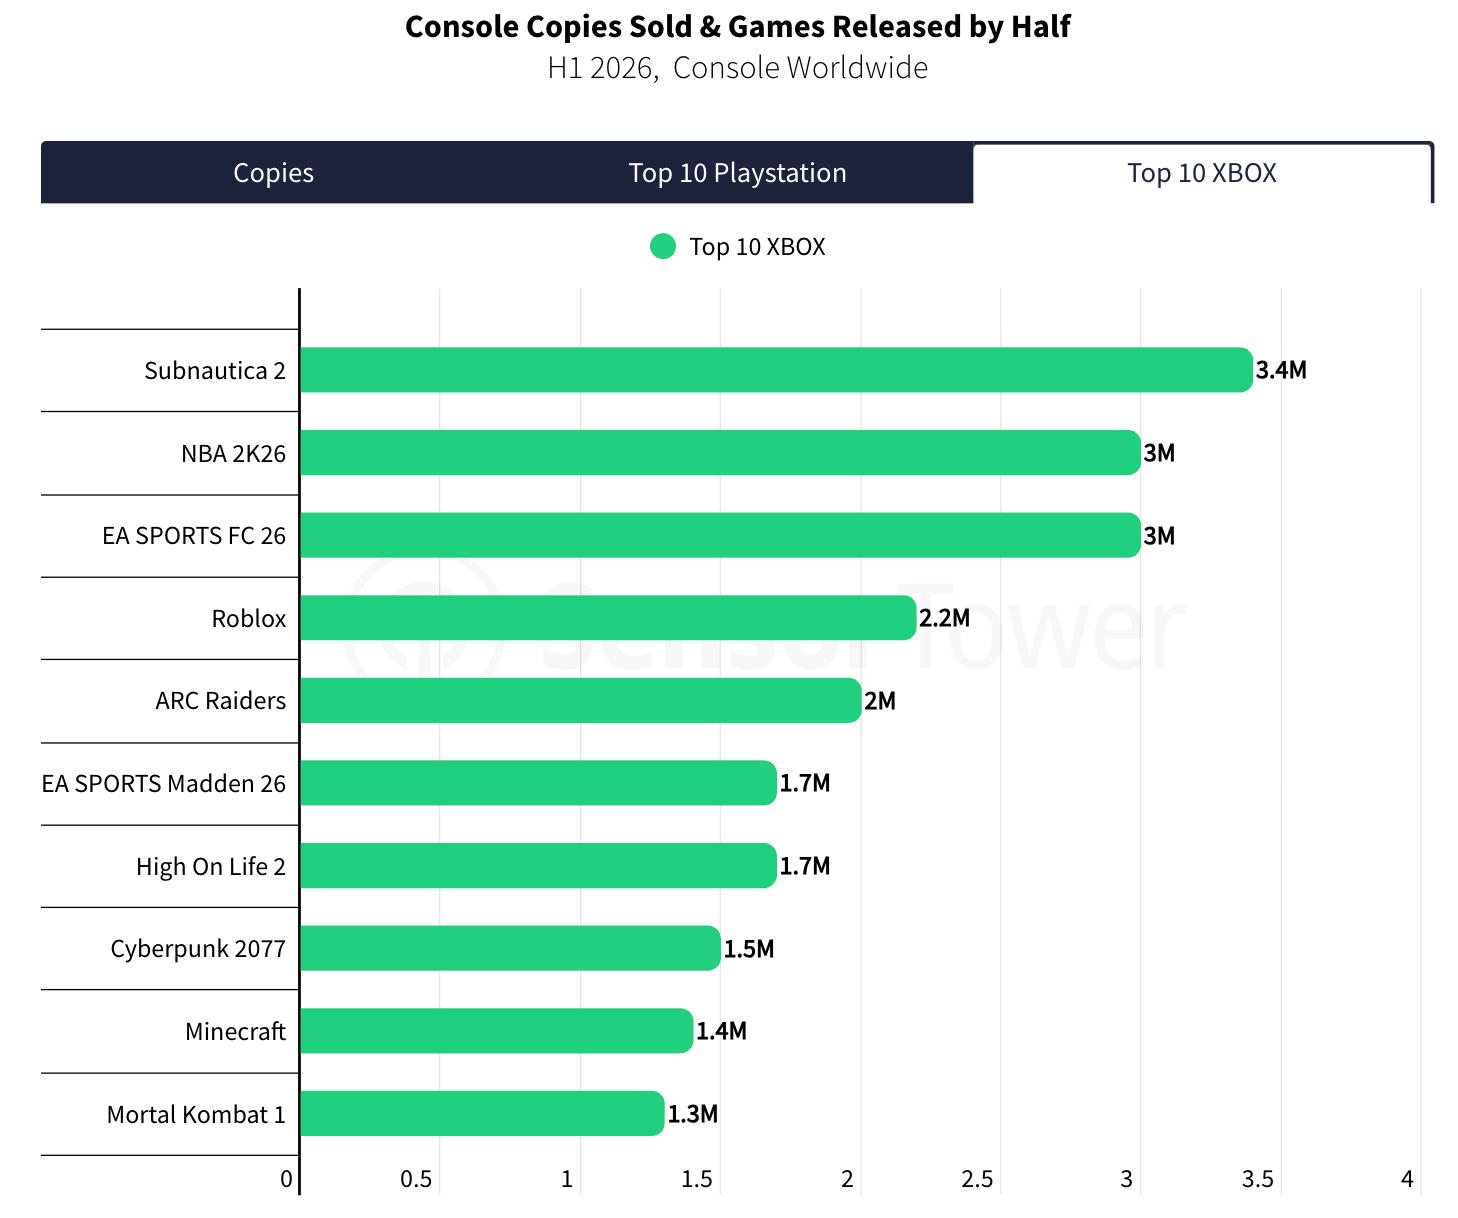
On Xbox, distribution by copies is smoother: Subnautica 2 leads (3.4 million copies), with NBA 2K26 and EA Sports FC 26 at 3 million each.
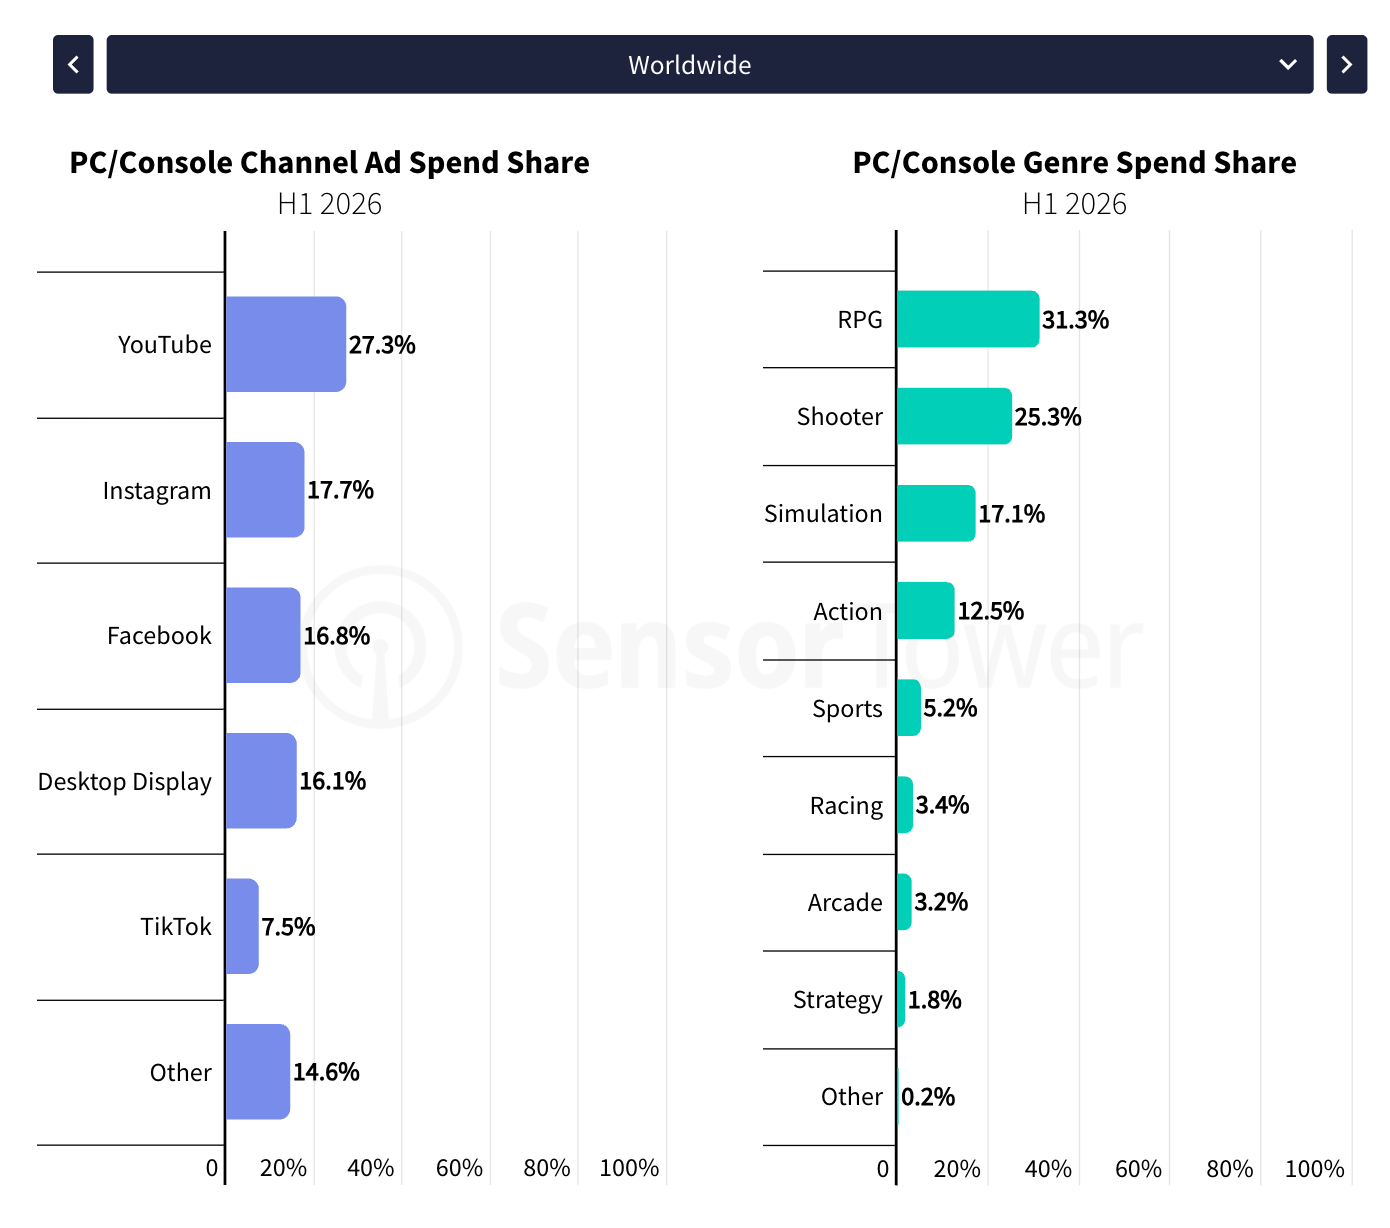
In PC and console game advertising, YouTube leads globally (27.3% of spend), Instagram is second (17.7%) and Facebook third (16.8%).
By genre, more than half of ad spend goes to RPG (31.3%) and Shooter (25.3%), followed by Simulation (17.1%) and Action (12.5%).
A word from our sponsor
Game studios run on contractors — artists, composers, QA testers, translators — often spread across a dozen countries. That’s a lot of contracts, tax rules, and IP clauses to track. Mellow handles all of it: compliant contracts, automated payments, and IP protection built in, for contractors in 150+ countries.
Browser Games
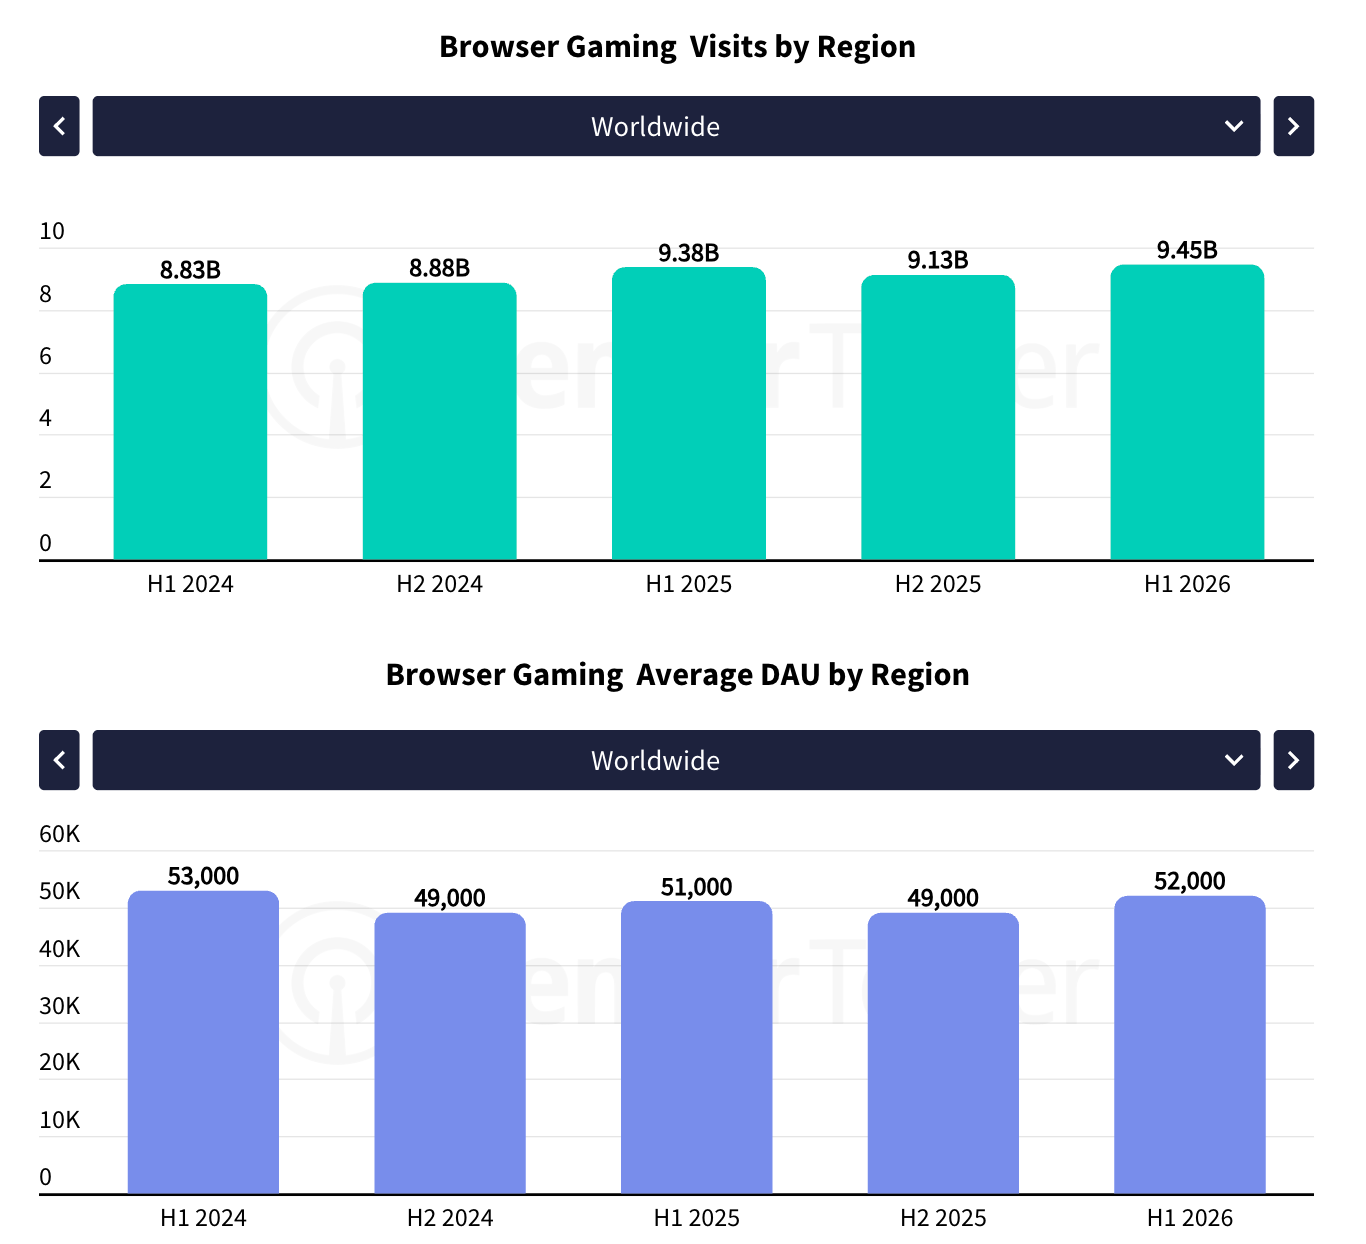
Visits to browser game sites grew slightly in H1’26 against last year - to 9.45 billion. Average DAU, meanwhile, is flat at around 52,000.


All of that (small) growth is concentrated in Asia. European countries, by contrast, are declining.
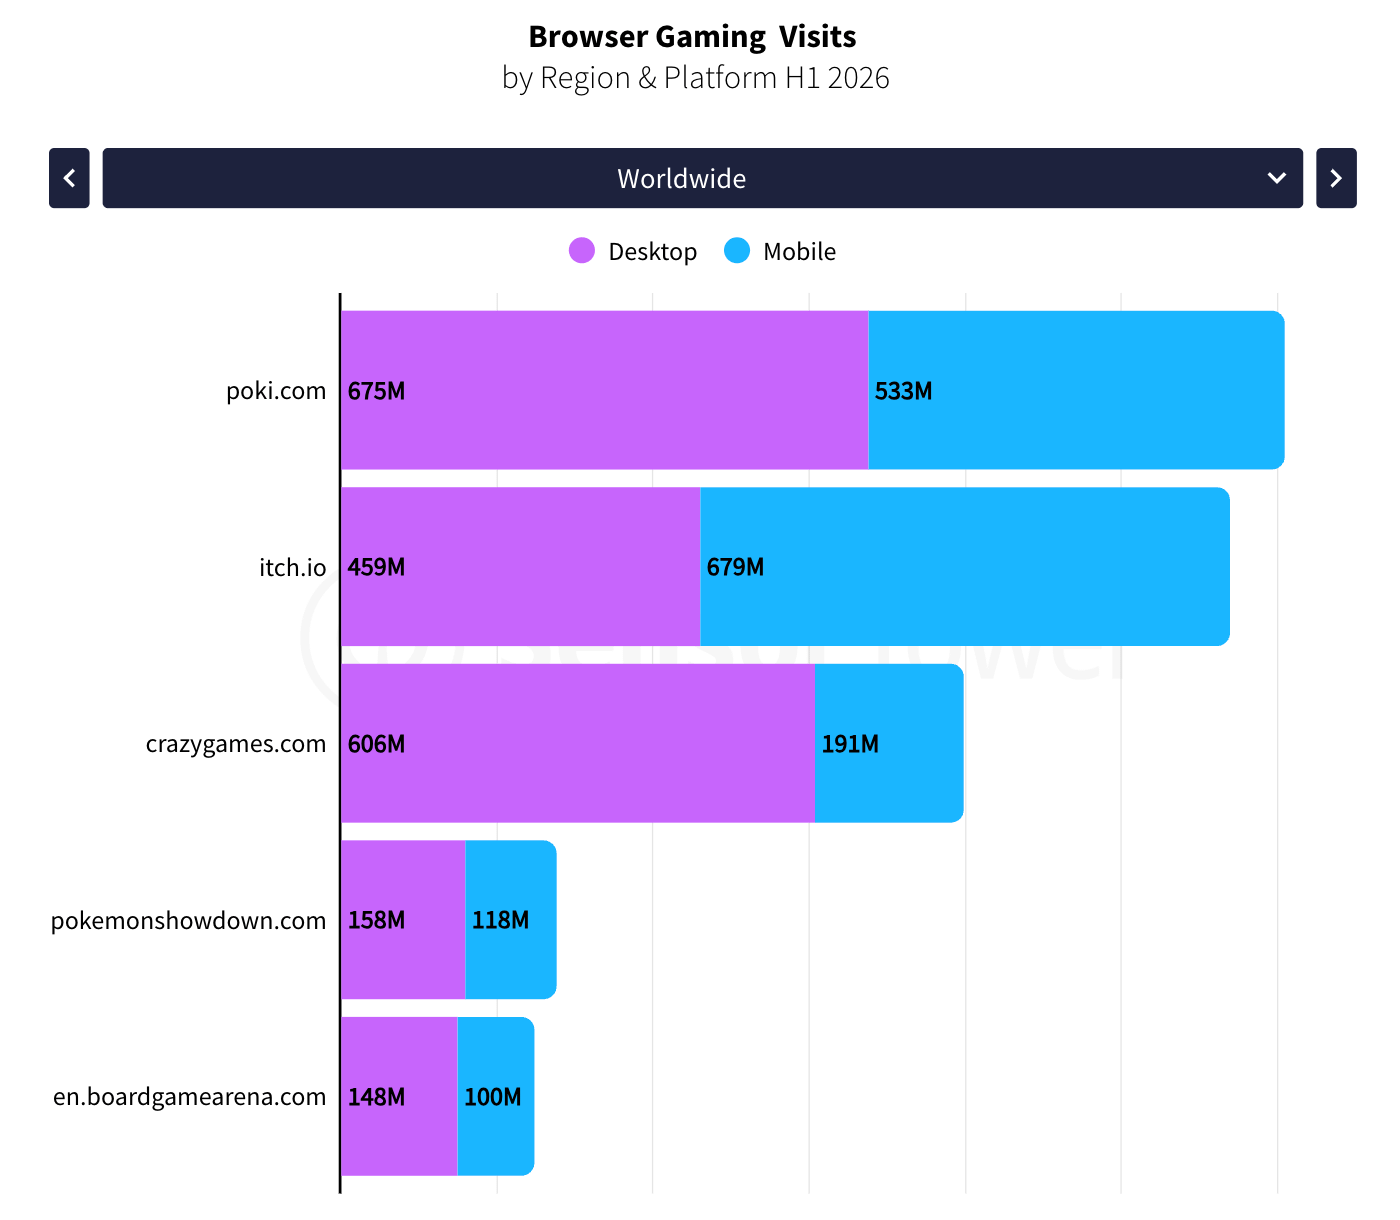
The top 3 web game platforms: poki.com (675 million desktop visits and 533 million mobile), itch.io (459 and 679 million), and crazygames.com (606 and 191 million).
Poki’s global lead rests on Asia - the site has 304 million desktop and 343 million mobile visits there. In Europe and Latin America, itch.io is more popular. Games on Crazy Games are played more often on desktop, while on itch.io - surprisingly - it’s mobile. Poki sits somewhere in the middle.
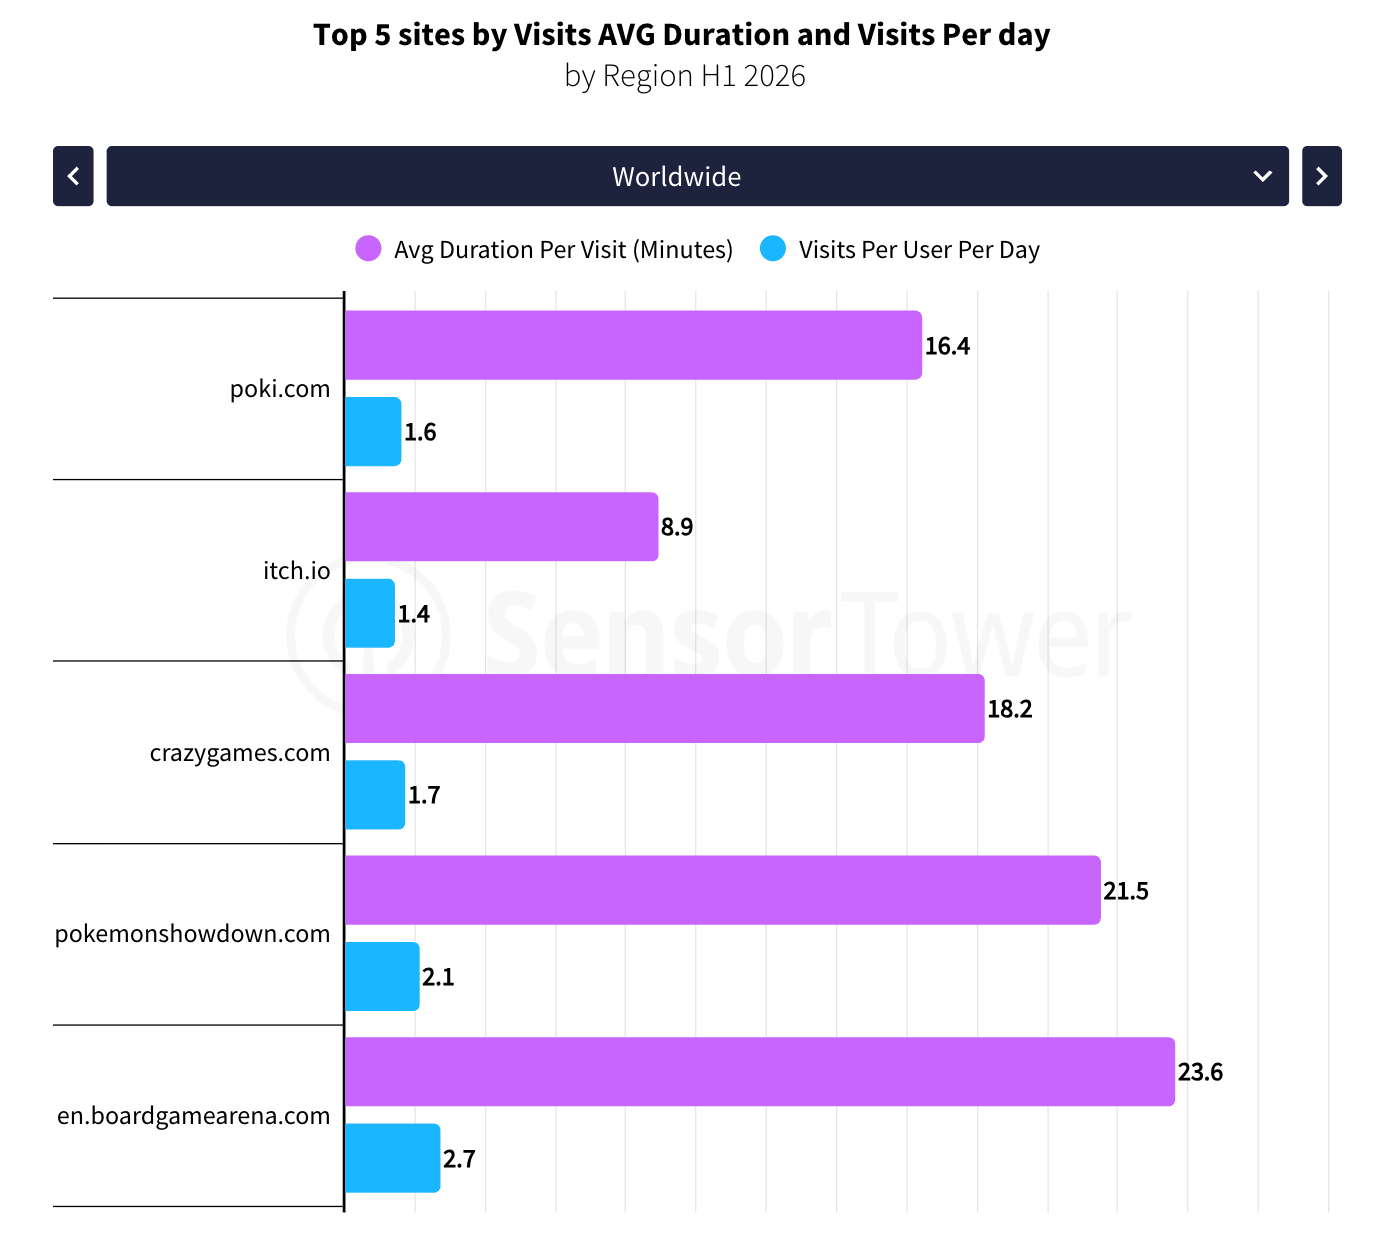
Traffic volume doesn’t correlate with engagement. People stay longest on en.boardgamearena.com (23.6 minutes per visit, 2.7 visits a day) and pokemonshowdown.com (21.5 minutes, 2.1 visits) - these are more niche sites. Among the large platforms, crazygames.com holds its audience best (18.2 minutes, 1.7 visits).
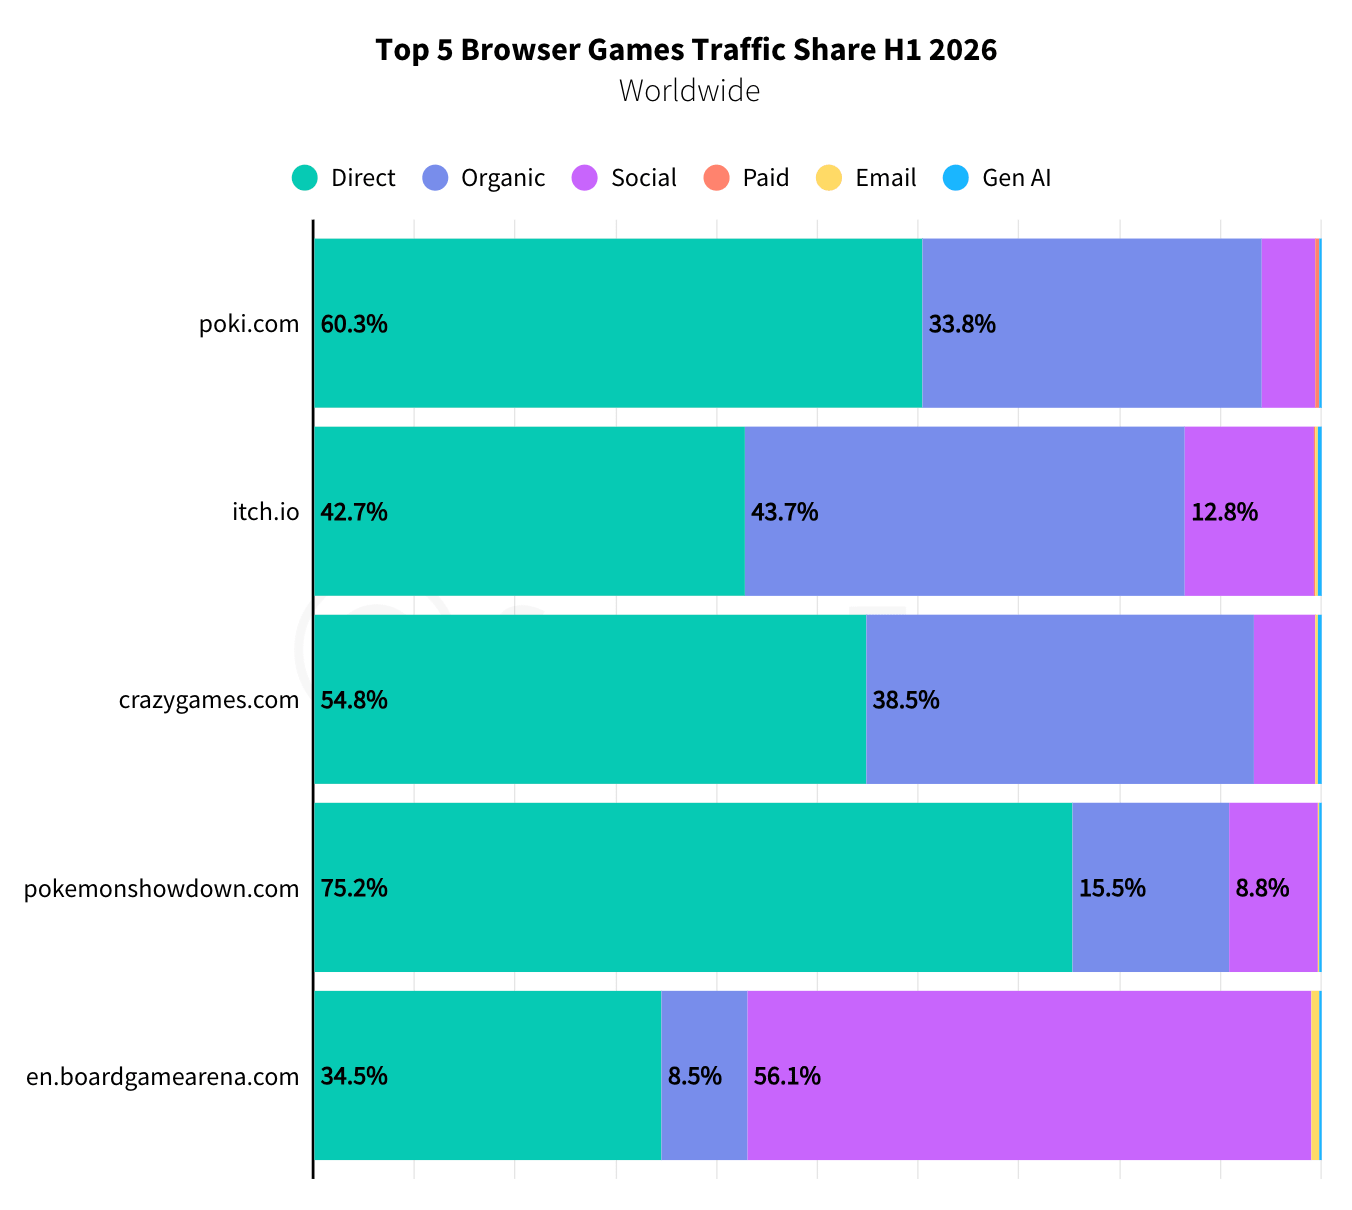
Almost all web platforms run on direct and organic traffic. For poki.com, those channels account for 94.1% of traffic, for crazygames.com 93.3%. I’d guess that’s a very high-margin business.
Niko Partners: India’s Gaming Market in 2026

Player behavior data comes from a survey.
The Market
India’s gaming market passed the $1 billion mark for the first time in 2025, generating $1.04 billion (+14.8% YoY).
❗️Niko Partners counts video games only. India’s huge real-money gaming segment (fantasy sports, rummy) is not part of that $1.04 billion.
In 2026, Niko Partners expects the market to grow to ~$1.2 billion, and to $1.77 billion by 2030. The five-year CAGR is 11.2%. That makes India the fastest-growing market Niko Partners tracks.
A word from our sponsor

Need a freelance 3D artist, composer, or QA tester fast? Mellow’s AI Scout finds qualified talent in under 48 hours — free to try, no commitment. Describe the role, get a shortlist, hire when you’re ready.
In 2025, the country had 511 million players. In 2026, that number will pass 550 million, and by 2030 analysts expect the country to have more than 700 million gamers.
India’s ARPU in 2025 was $2.04; by 2030 the metric should rise to $2.52.
❗️The audience in the country is enormous and brings in very little money, and despite the high growth rates, little will change in the coming years.
The Audience and Its Preferences
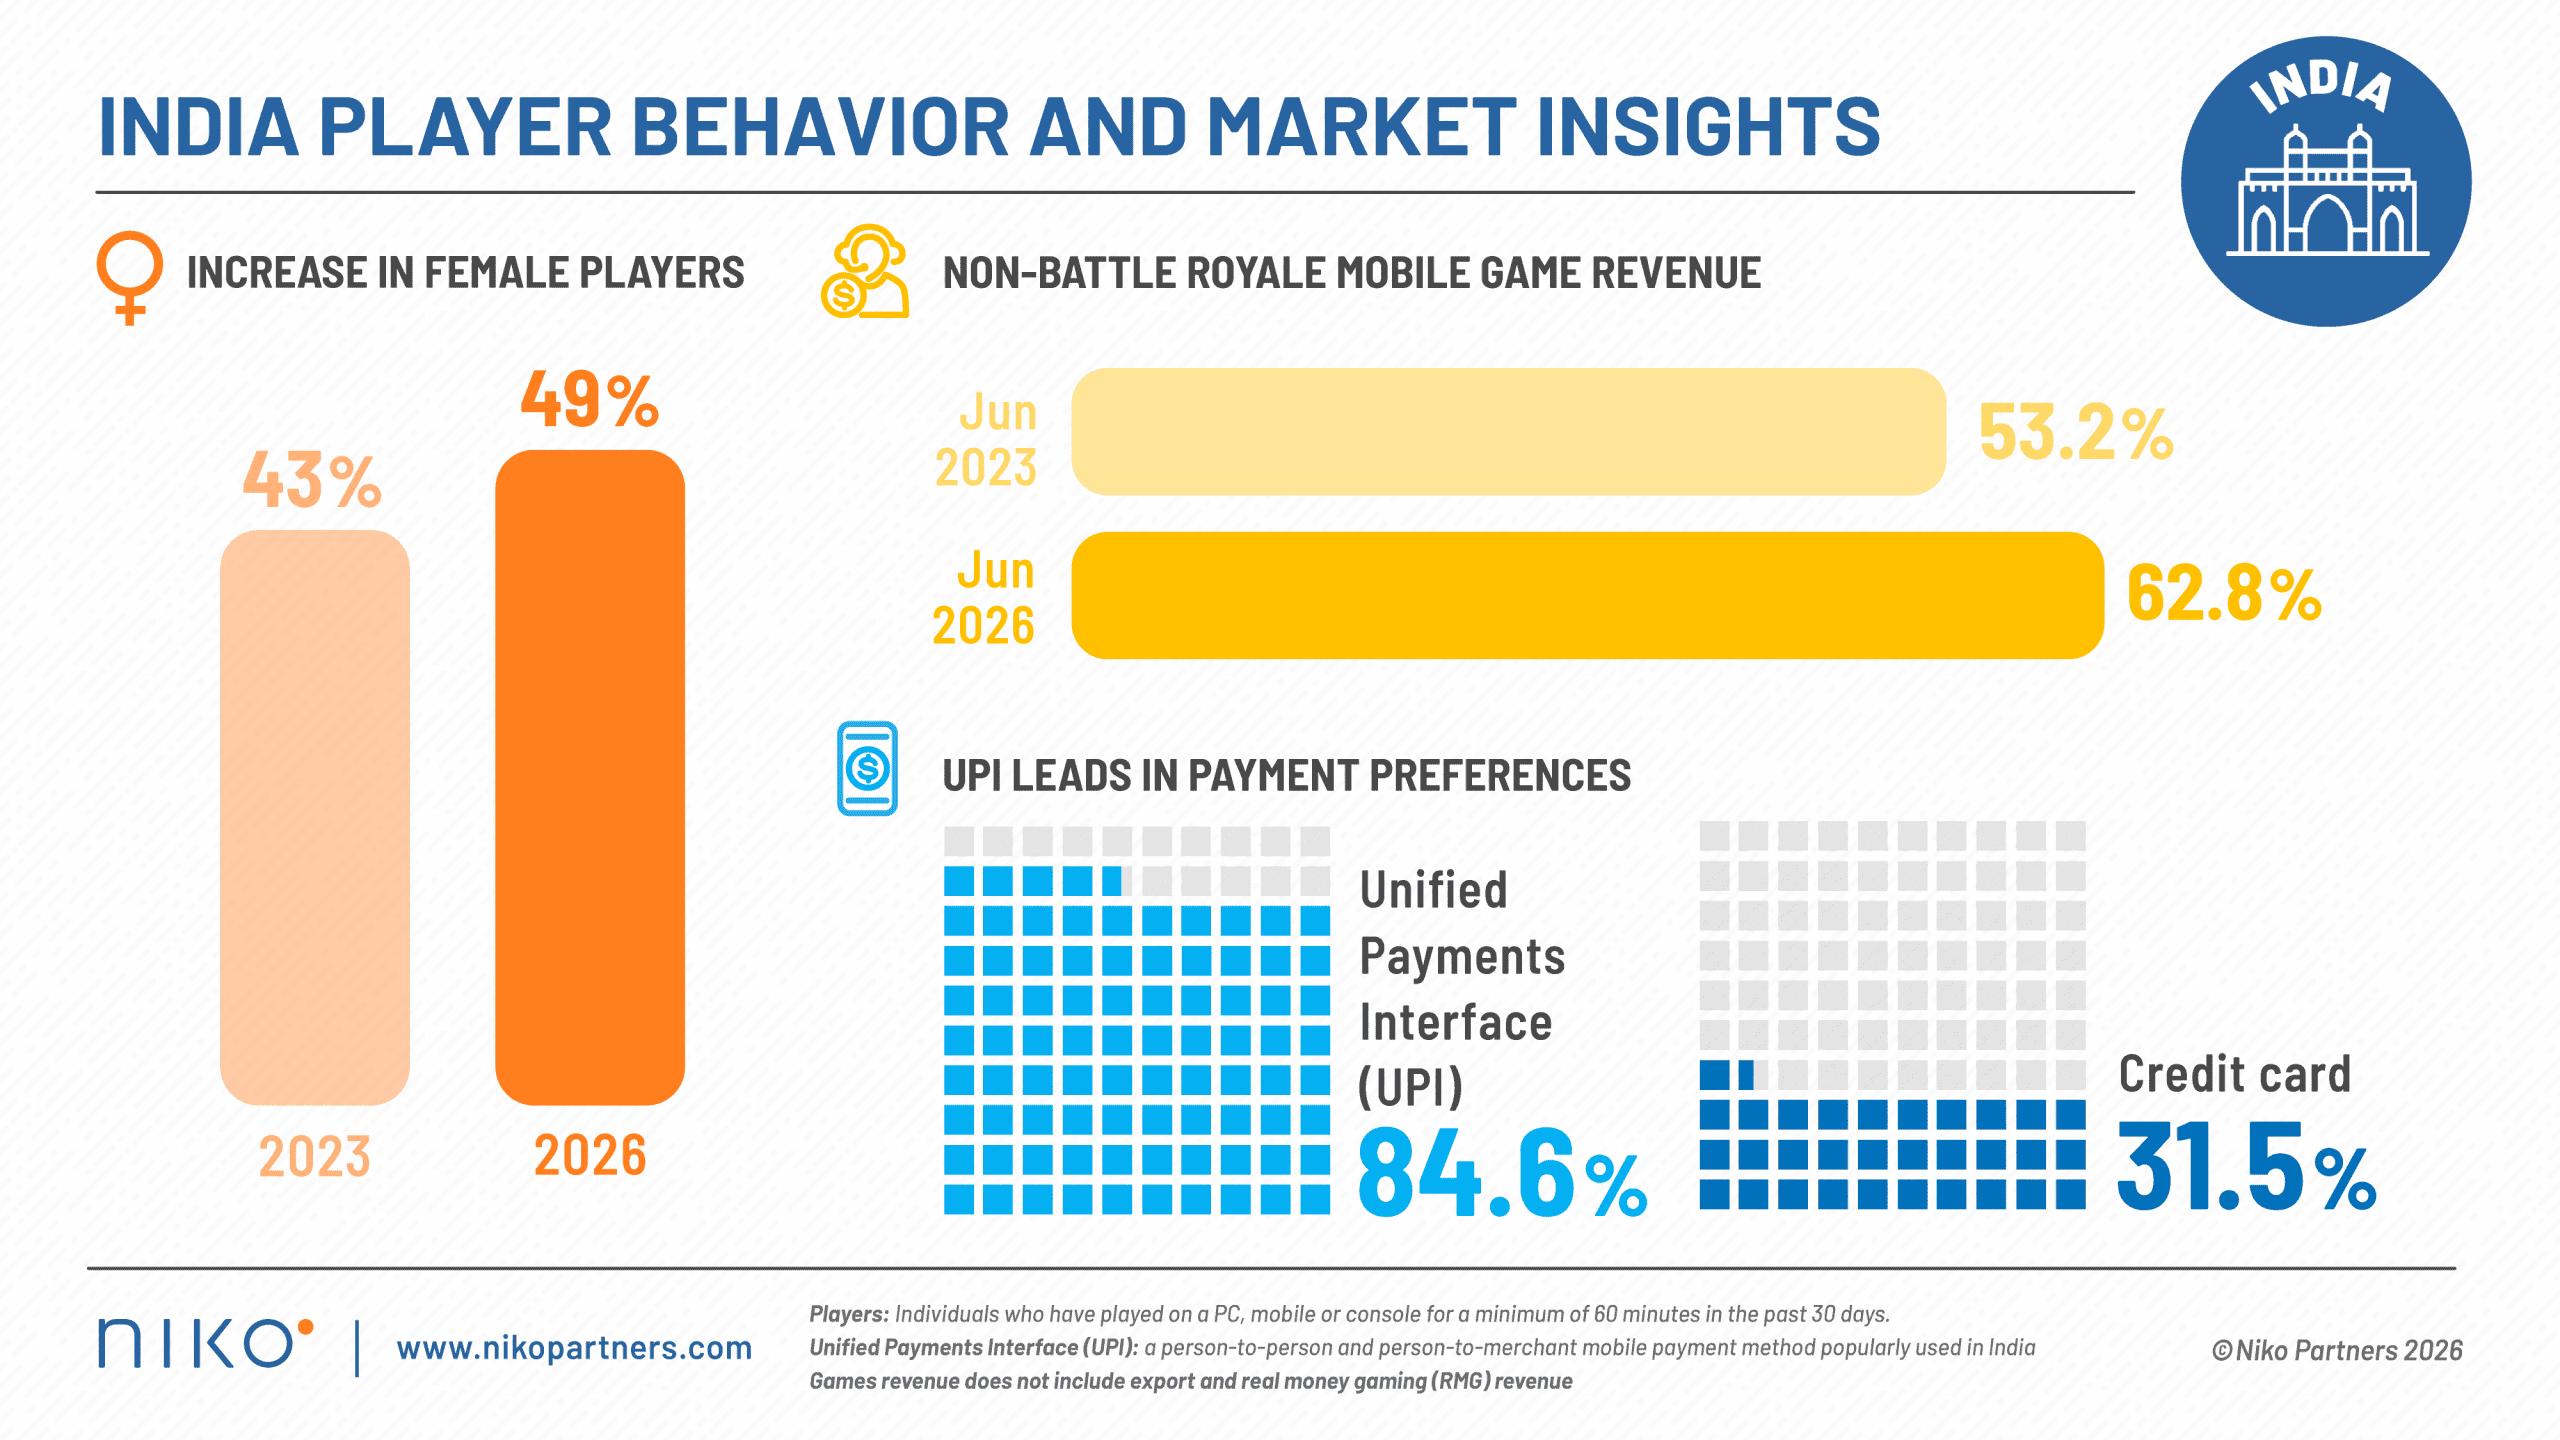
The share of women among players rose from 43% in 2023 to 49% in 2026. Male and female gamers in the country are now split almost evenly.
In June 2026, games outside the Battle Royale genre accounted for 62.8% of mobile revenue, up from 53.2% in June 2023. Battle Royale still leads the market, but concentration is declining.
Niko Partners notes that Indian players are spending more time with older PC games.
Various UGC platforms such as Roblox and Minecraft are also gaining popularity in the country. They are especially popular with younger audiences. Roleplay servers in GTA, which Niko Partners mentions separately as a popular livestreaming format, arguably belong in the same bucket.
31.5% of Indian players prefer to buy in-game content outside the usual storefronts: through web shops, third-party stores, and top-up cards.
84.6% of players have paid via UPI at least once. Credit cards are used by 31.5% of players, so UPI is the country’s main payment method.
Indian players’ attitudes toward generative AI have shifted noticeably: they are now more cautious about how both developers and other players use it. Niko Partners links this to the economy and to the conversation around AI’s impact on jobs in the country.
CADPA: The Chinese Gaming Market in H1’26

The report was presented on July 30 at the CDEC conference in Shanghai. This is the official industry data, compiled by the game committee of China’s CADPA association.
All figures in the report are given in yuan. Dollar conversions here and below use a rate of ~6.74 yuan per dollar as of mid-August 2026.
❗️CADPA counts revenue from Chinese platforms and Chinese developers. This data excludes foreign games not officially published in China.
Market
China’s domestic market in H1’26 was 188.45 billion yuan (~$27.9 billion), +12.17% YoY.
By June 2026, the country had 684 million players (+0.82% YoY). The audience is growing slowly, so the market’s growth came from higher revenue per user.
Chinese self-developed games earned 163.36 billion yuan (~$24.2 billion) domestically, up 16.31% YoY. They account for 86.7% of the domestic market, and they are growing noticeably faster than the market overall.

Managing a distributed dev team shouldn’t mean managing a compliance headache. Mellow’s Contractor Management gives you ready-made contracts, IP compliance, and automated payouts for contractors in 150+ countries — for $35/month per contractor.
Exports
Abroad, Chinese games earned $12.37 billion (+30.22% YoY). Both successful legacy projects and new releases are behind that figure.
Geographically, the main markets for Chinese mobile games have not changed: the US (32.31% of overseas revenue), Japan (14.05%), and South Korea (7.48%). Together, that is 53.84%.
Germany, the UK, and France together account for 10.14% of overseas revenue, and their share grew slightly.
By revenue, among the top 100 Chinese mobile games abroad, Strategy leads with 46.91% of revenue. Merge games are next (16.22%), followed by RPG (9.62%). Shooter is fourth at 8.31%.
Over the year, merge games added 9.74 percentage points of revenue share.
❗️Since the source is in Chinese, I’m not certain whether this means +9.74% YoY or +9.74 percentage points. Either way, the growth is substantial.
Platforms
Mobile games inside China earned 135.21 billion yuan (~$20.1 billion), up 7.9% YoY. That is 71.75% of the domestic market.
Among the top 100 mobile games by revenue, RPG is the most common genre (22% of the total), followed by Strategy (11%).
By revenue in that top 100, though, Shooter takes first place: 26.23% of all revenue, and it grew noticeably over the year. MOBA dropped to second (18.96% of all revenue), and RPG is third (14.35%).
PC client games earned 45.29 billion yuan (~$6.7 billion), up 27.92% YoY. The segment accounts for 24.03% of the market and is the second fastest-growing part of the domestic market after mini games. CADPA attributes the growth to cross-play between PC and mobile versions and strong results from several long-running projects.
❗️ PC client games in China are growing three and a half times faster than mobile. The market is much smaller in absolute terms, though.
Browser games earned 2.02 billion yuan (~$299 million), down 8.47% YoY. The decline has continued for several years.
Console games earned 961 million yuan (~$143 million), down 7.06% YoY. The main reason is the absence of hits on the scale of Black Myth: Wukong.
❗️This covers only official console sales inside China. Grey imports and purchases in foreign regions are not included, so the real figures are higher.
Games with esports disciplines earned 89.62 billion yuan (~$13.3 billion), up 11.12% YoY.
Anime games earned 13.27 billion yuan (~$1.97 billion), down 8.97% YoY. Several large projects saw revenue decline, and new releases could not cover the gap.
Casual mobile games earned 18.21 billion yuan (~$2.7 billion), +10.74% YoY. In-app purchases accounted for 67% of all revenue, and advertising for 33%.
Mini games earned 31.66 billion yuan (~$4.7 billion), up 36.01% YoY. That is the fastest-growing segment of the Chinese gaming market.
Within mini games, in-app purchases brought in 21.14 billion yuan (+38.12%), and advertising 10.52 billion yuan (+31.94%). The split barely changed vs. H1’25: 66.8% IAP revenue against 33.2% advertising.
Board games appear in the report for the first time. The segment earned 3.87 billion yuan (~$574 million) and grew slightly, up 4.03% YoY.
Digital board games brought in 1.997 billion yuan (51.6% of total revenue), and physical ones brought in 1.87 billion yuan (48.4%).
Amir Satvat: Layoffs in the Gaming Industry in 2026
Amir Satvat runs his own game industry layoff tracker as part of ASGC, his free project that helps people in the gaming industry find work. The data is collected from public sources.
Forecast
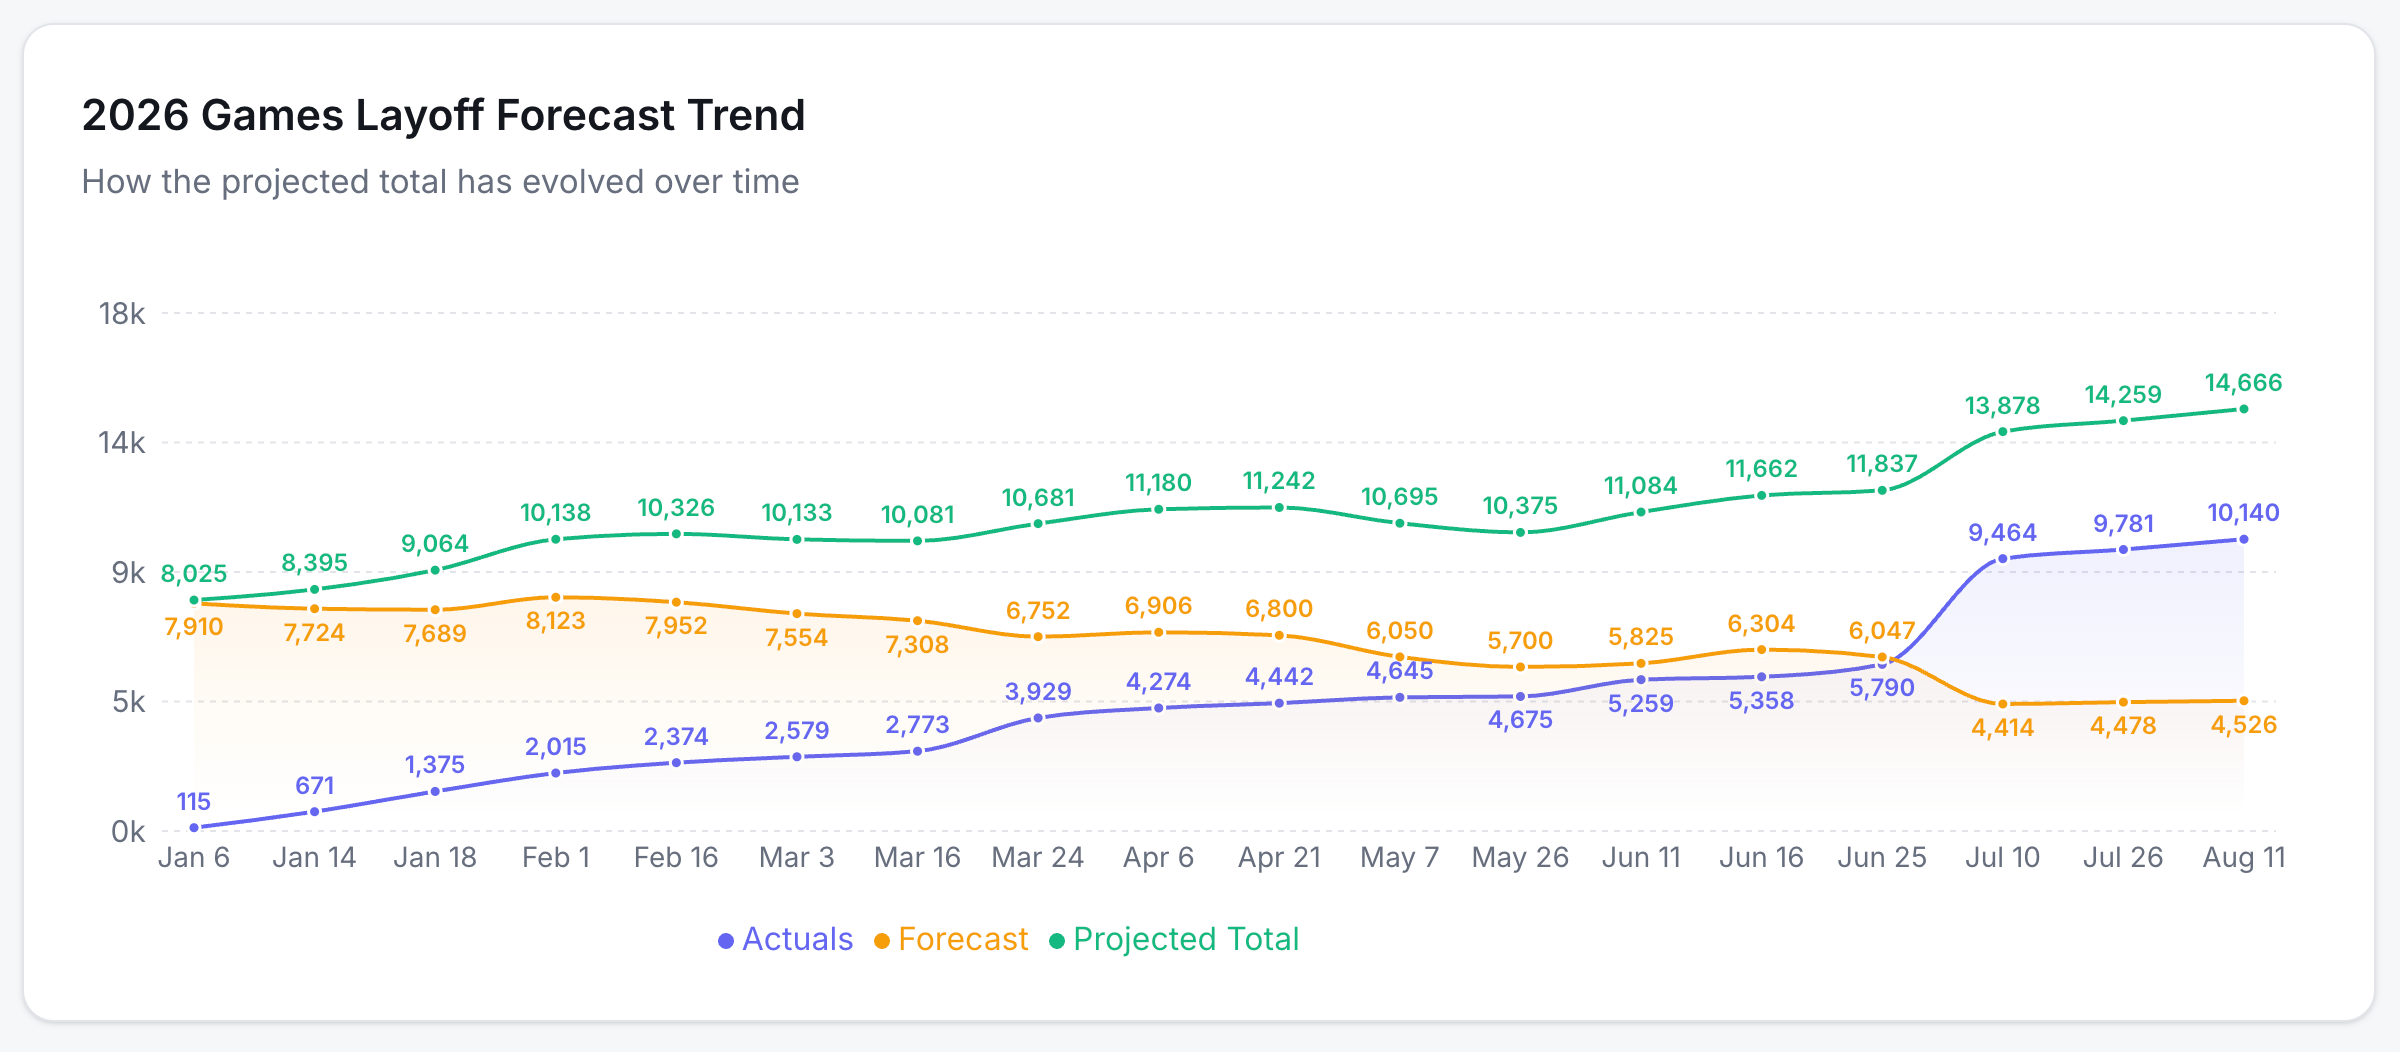
According to the most recent forecast (August 11), 14,666 people will lose their jobs in the gaming industry in 2026. That is 788 more than in the July 10 forecast.
A word from our sponsor
Game studios run on contractors — artists, composers, QA testers, translators — often spread across a dozen countries. That’s a lot of contracts, tax rules, and IP clauses to track. Mellow handles all of it: compliant contracts, automated payments, and IP protection built in, for contractors in 150+ countries.
Confirmed layoffs as of August 11 stand at 10,140. Amir expects another 4,526 people to lose their jobs over the rest of the year.
❗️The forecast is revised and adjusted over the course of the year.
The first version of the forecast, from January 6, projected 8,025 layoffs for the year. Since then, the estimate has grown by almost 83%.
2024 remains the record year, with 15,631 layoffs. But 2026 is already ahead of 2022 (8,500), 2023 (10,500), and 2025 (9,197). And there are still two quarters to go. So, unfortunately, 2026 could set a new ugly record.
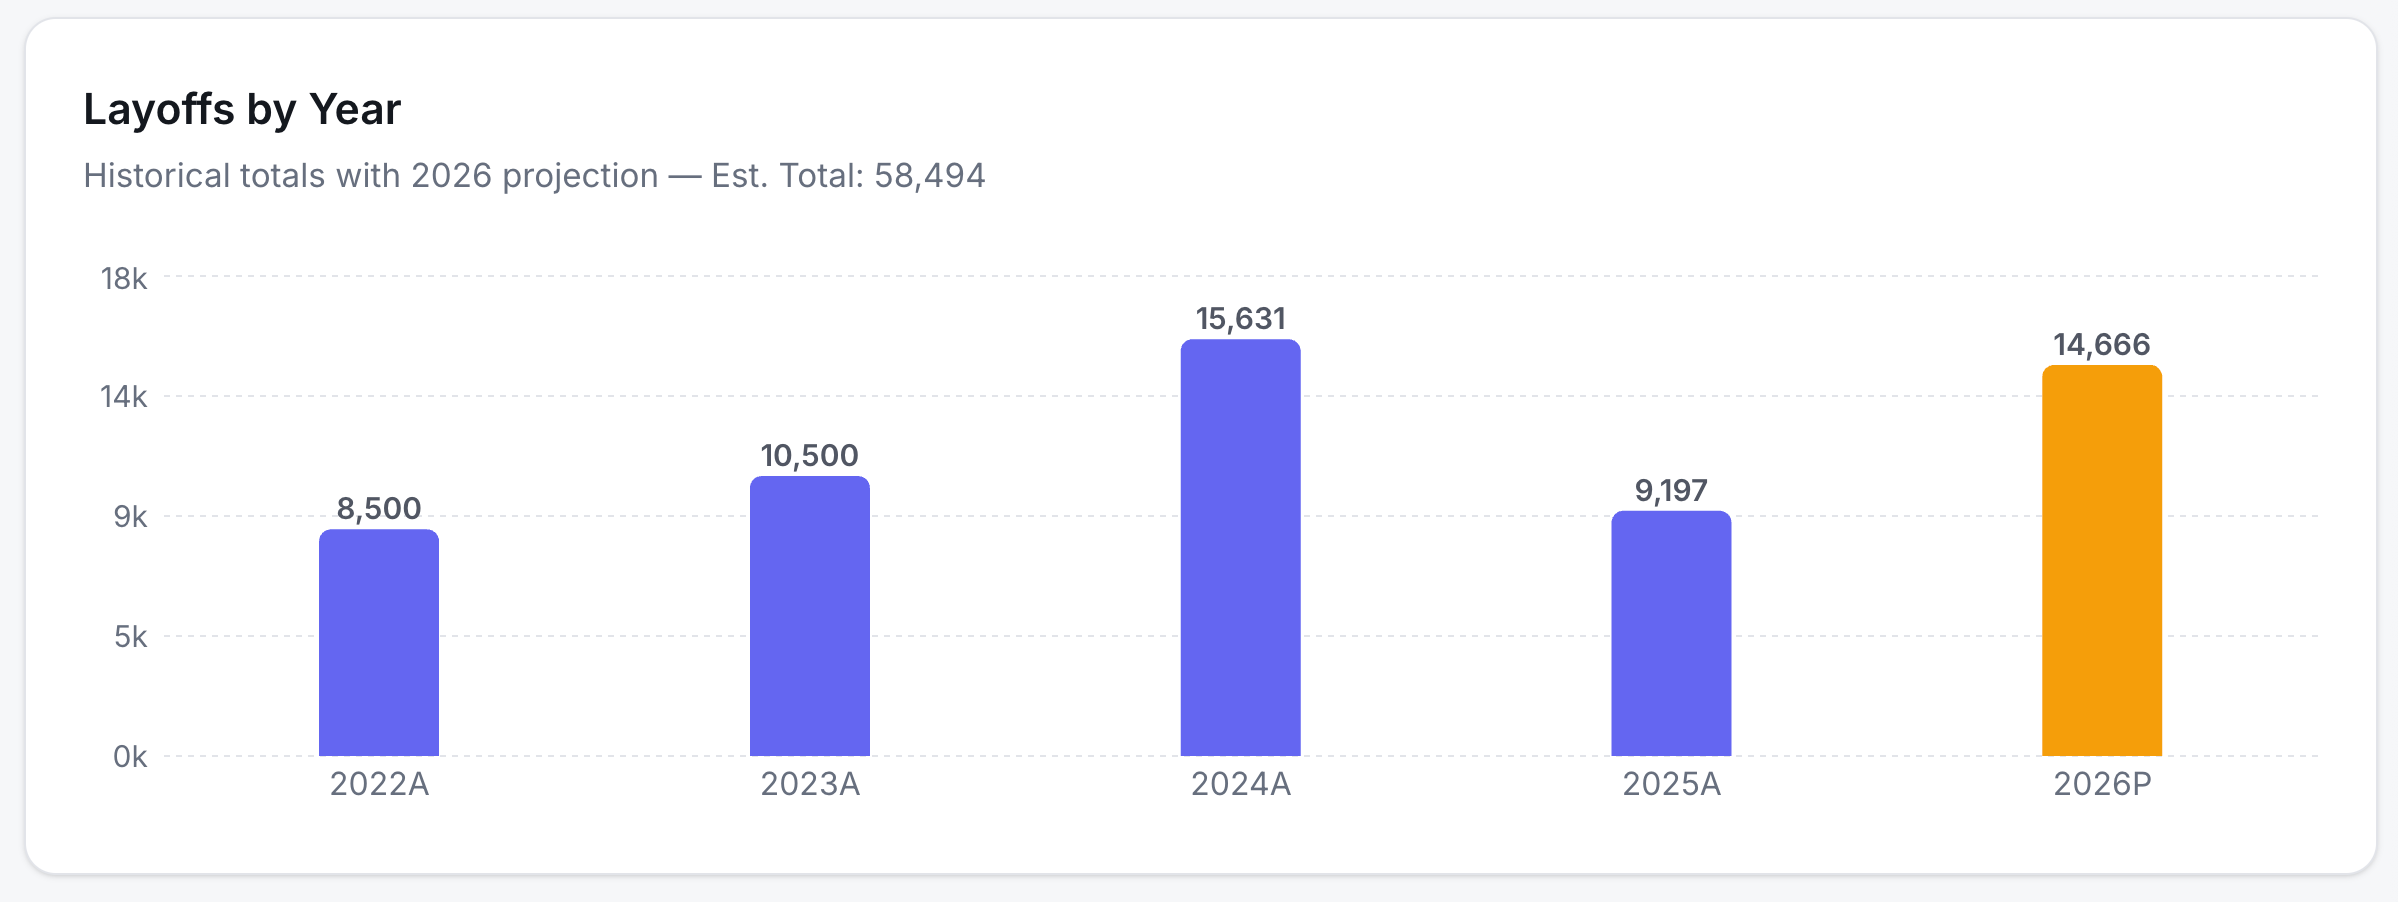
Over five years, from 2022 to 2026, Amir Satvat has counted 58,494 layoffs.
Geography and Concentration
Since the start of 2026, the industry has seen more than 105 layoff events.
North America accounts for 66% of all layoff events and about 79% of affected people. The US has roughly 48% of all layoffs, and Canada ~17%. Europe accounts for ~30%.
The five largest reductions in the gaming industry accounted for 56% of all layoffs; the top two alone accounted for around 44%.
One of those largest rounds is Microsoft. The company cut 1,600 people from its gaming division and warned that it will part with the same number of employees over the next year.
Circana: The U.S. Video Game Market in July 2026
Circana data on the U.S. market. Mobile figures provided by Sensor Tower.
Market
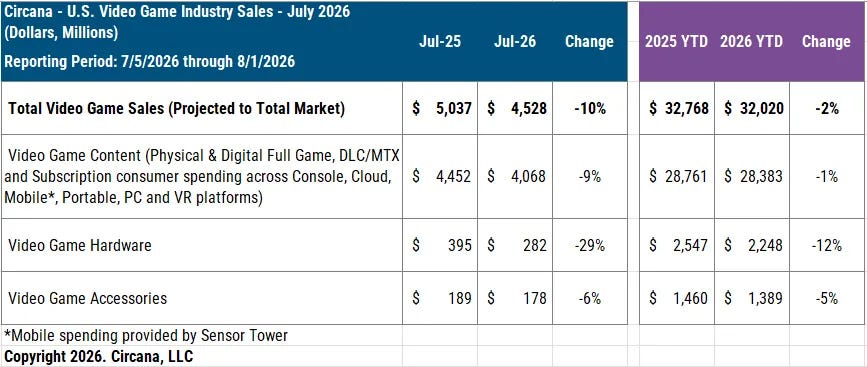
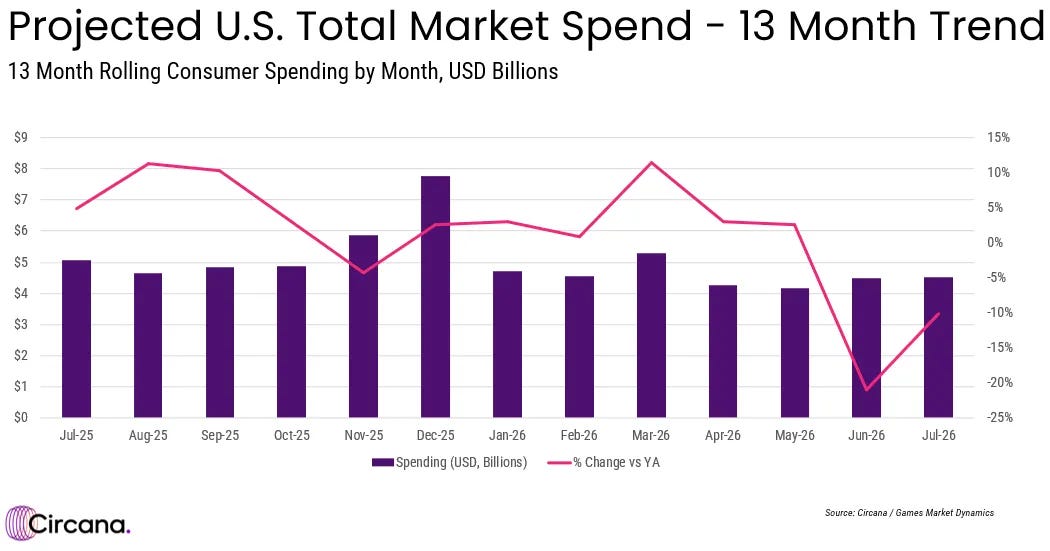
In July 2026, Americans spent $4.5 billion on games (-10% YoY).
Content spending was $4.1 billion (-9% YoY). Mobile content sales dropped the most, but console and PC content also declined versus last year.
A word from our sponsor
Need a freelance 3D artist, composer, or QA tester fast? Mellow’s AI Scout finds qualified talent in under 48 hours — free to try, no commitment. Describe the role, get a shortlist, hire when you’re ready.
Through the first seven months of 2026, the U.S. market is running 2% behind 2025.
❗️I’ll note again that part of mobile revenue is missed because of D2C’s growing popularity. The real picture for mobile content is likely better than the one Circana shows.
In July 2026, Americans spent $282 million on hardware (-29% YoY). Circana notes that this is the worst July since 2020 ($163 million).
In units, hardware sales fell 39% versus July 2025. The average price of a new system rose 16%, to $542. Mat Piscatella notes that rising system prices are weighing on sales. The Nintendo Switch 2 is getting a price increase on September 1.
Every platform declined in units: PlayStation 5 sales fell 6%, Xbox Series 18%, and Nintendo Switch 2 51%. In dollars, the PlayStation 5 led July; in units sold, the Nintendo Switch 2 came first.
❗️The Nintendo Switch 2 launched in June 2025, and July was the console’s second month on the market, so the comparison is still against a high base.
After 14 months on the market, the Nintendo Switch 2 is running 11% ahead of the original Switch’s sales pace. Circana reported the same gap at the 11-month mark.
Accessories brought in $178 million in July 2026 (-6% YoY). This is the worst July since 2019 ($144 million). Racing controller spending fell 26%, while cases and organizers grew 36% in dollar sales.
Game Sales
❗️Circana uses a methodology that combines projected estimates with actual sales.
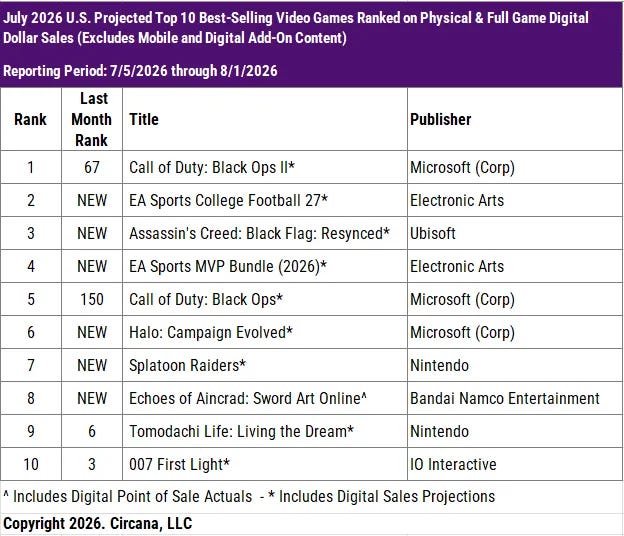
Call of Duty: Black Ops II was the best-selling game of July in the U.S., thanks to the release of its PS4 and PS5 port. Call of Duty: Black Ops, also re-released on PlayStation, took 5th place on the chart.
EA Sports College Football 27 was second among new releases by sales.
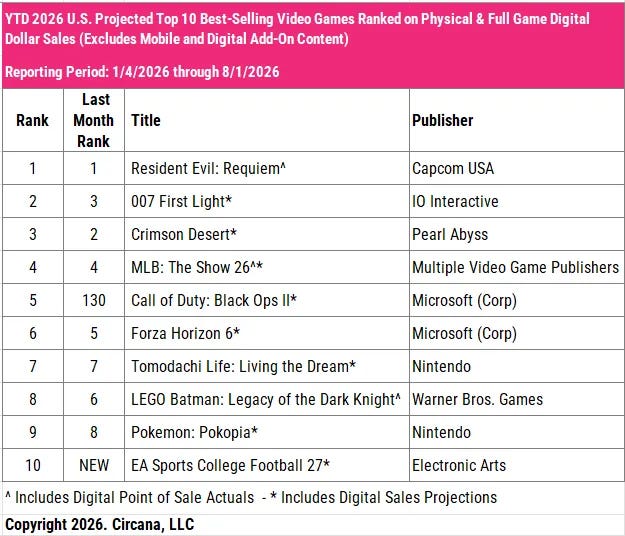
Through the first seven months of 2026, the top performers in dollar sales are Resident Evil: Requiem, 007 First Light, and Crimson Desert.
EA Sports College Football 27 is the one new release in the top 10. It will most likely add a couple of positions by the end of the year.
On mobile (data from Sensor Tower), the top of the U.S. revenue chart is MONOPOLY GO!, Royal Match, and Pokémon GO.
Pokémon GO jumped 10 spots in revenue, to third place. Its revenue rose 230% versus June, driven by anniversary events: the game turned 10.
Last War: Survival lost another four spots and fell to 10th. The game has been declining for three months straight: in May, revenue fell 30% versus April, and in June it fell another 13.8%. Its developers sharply cut user acquisition several months ago.