

Weekly Gaming Reports Recap: August 11 - August 15 (2025)
A lot of reports - regarding the US market in 2025; payment habits of western audience by Newzoo & Tebex; Mobile Market in Q2'25 by Sensor Tower.


Reports of the week:
PwC: GTA VI delay caused $2.7B impact on the US market in 2025
Newzoo x Tebex: Player payment behaviour in the West in 2025
Games & Numbers (July 31 – August 13, 2025)
PlaySafe ID: Cheating in Games in 2025
Sensor Tower: Mobile App Market in Q2'25
GameDiscoverCo: Top Steam/Console Games in July 2025 by Revenue & Copies
PwC: GTA VI delay caused $2.7B impact on the US market in 2025

General numbers on the US market
At the end of 2024, PwC estimates the market at $62.8B. That’s 3.6% growth after a 2.8% decline in 2023.
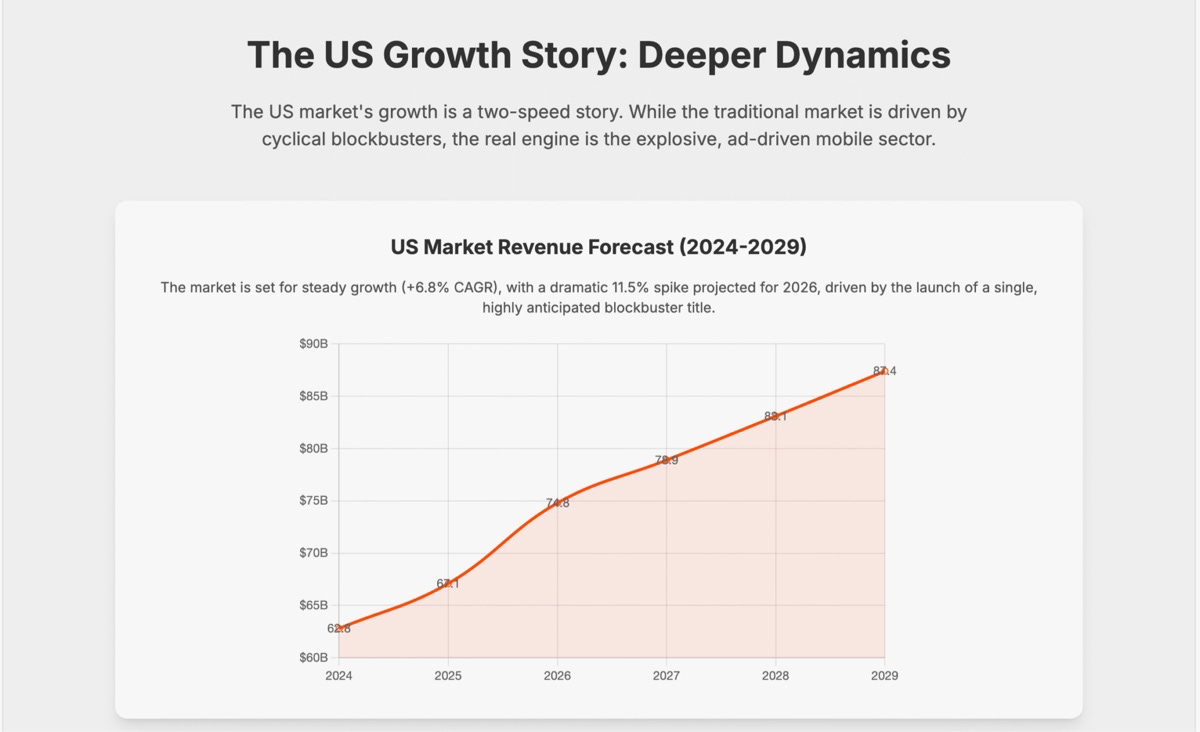
With a forecast of $87.4B by 2029, the US market’s five-year CAGR is projected at 6.8%.
The US market is expected to grow by 11.5% in 2026. It’s clear that the GTA VI factor is included. PwC analysts expect the game to retail for $100 (I doubt).
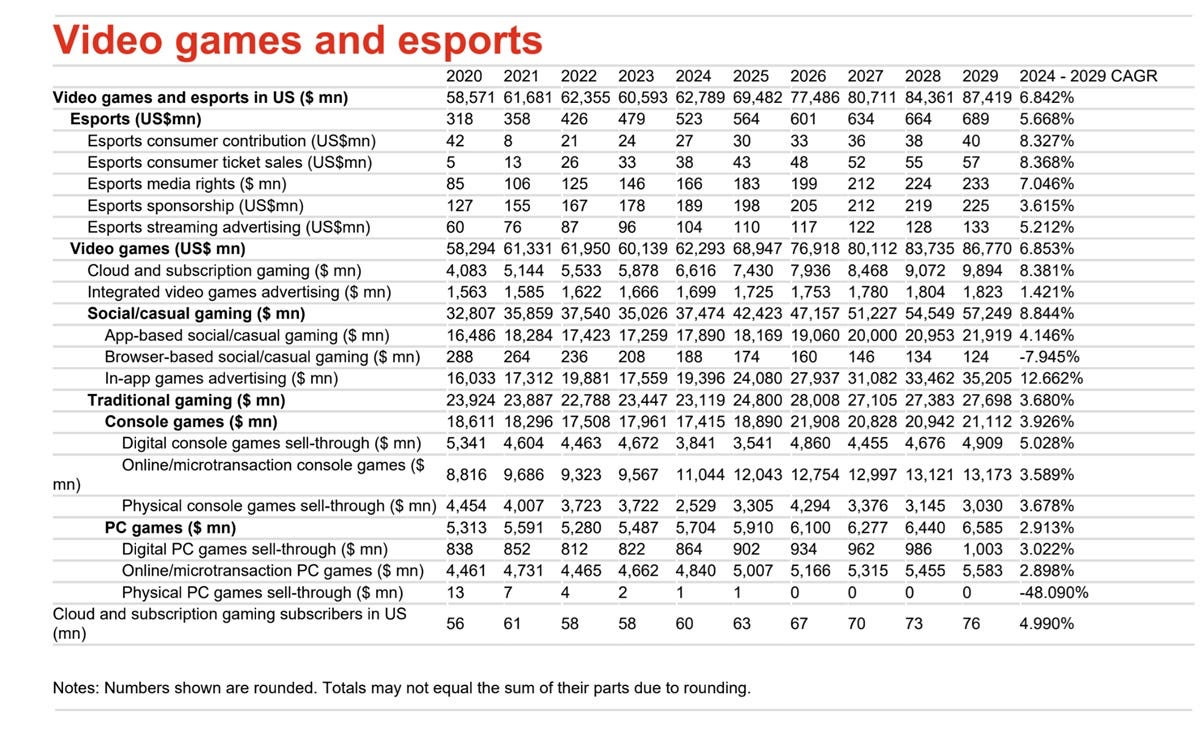
PwC forecasts growth for nearly every market segment between 2024 and 2029. Two segments in the negative: Browser casual games (-7.9% CAGR) and boxed PC game sales (-48% CAGR).
Strongest growth expected for in-game mobile ads — from $19.4B in 2024 to $35.2B in 2029 (CAGR 12.7%).
PwC analysts believe the growth potential for PC/console segments is limited and cannibalized by subscription services. The main potential is in ad revenue expansion.
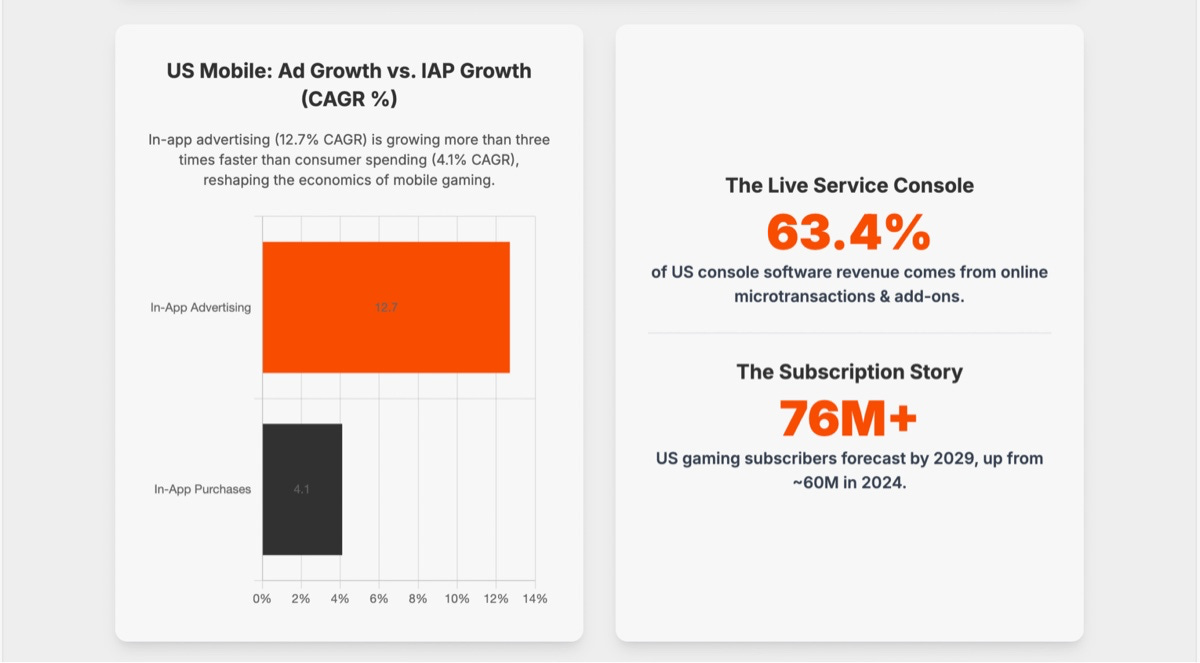
In-game ad CAGR through 2029 is three times that of in-game purchases.
Consider subscribing to the GameDev Reports Premium tier to support the newsletter. Get access to the list of curated articles & archive of Gaming Reports that I’ve been collecting since 2020.
PwC notes that social and casual games in the US earned $37.5B in 2024, over 60% of total revenue. Segment projected to grow to $57.2B by 2029 (CAGR 8.8%) with market share rising to 66%. This includes Roblox, MONOPOLY GO!, Candy Crush Saga, and others.
❗️By PwC methodology, all mobile games are included in “social and casual”.
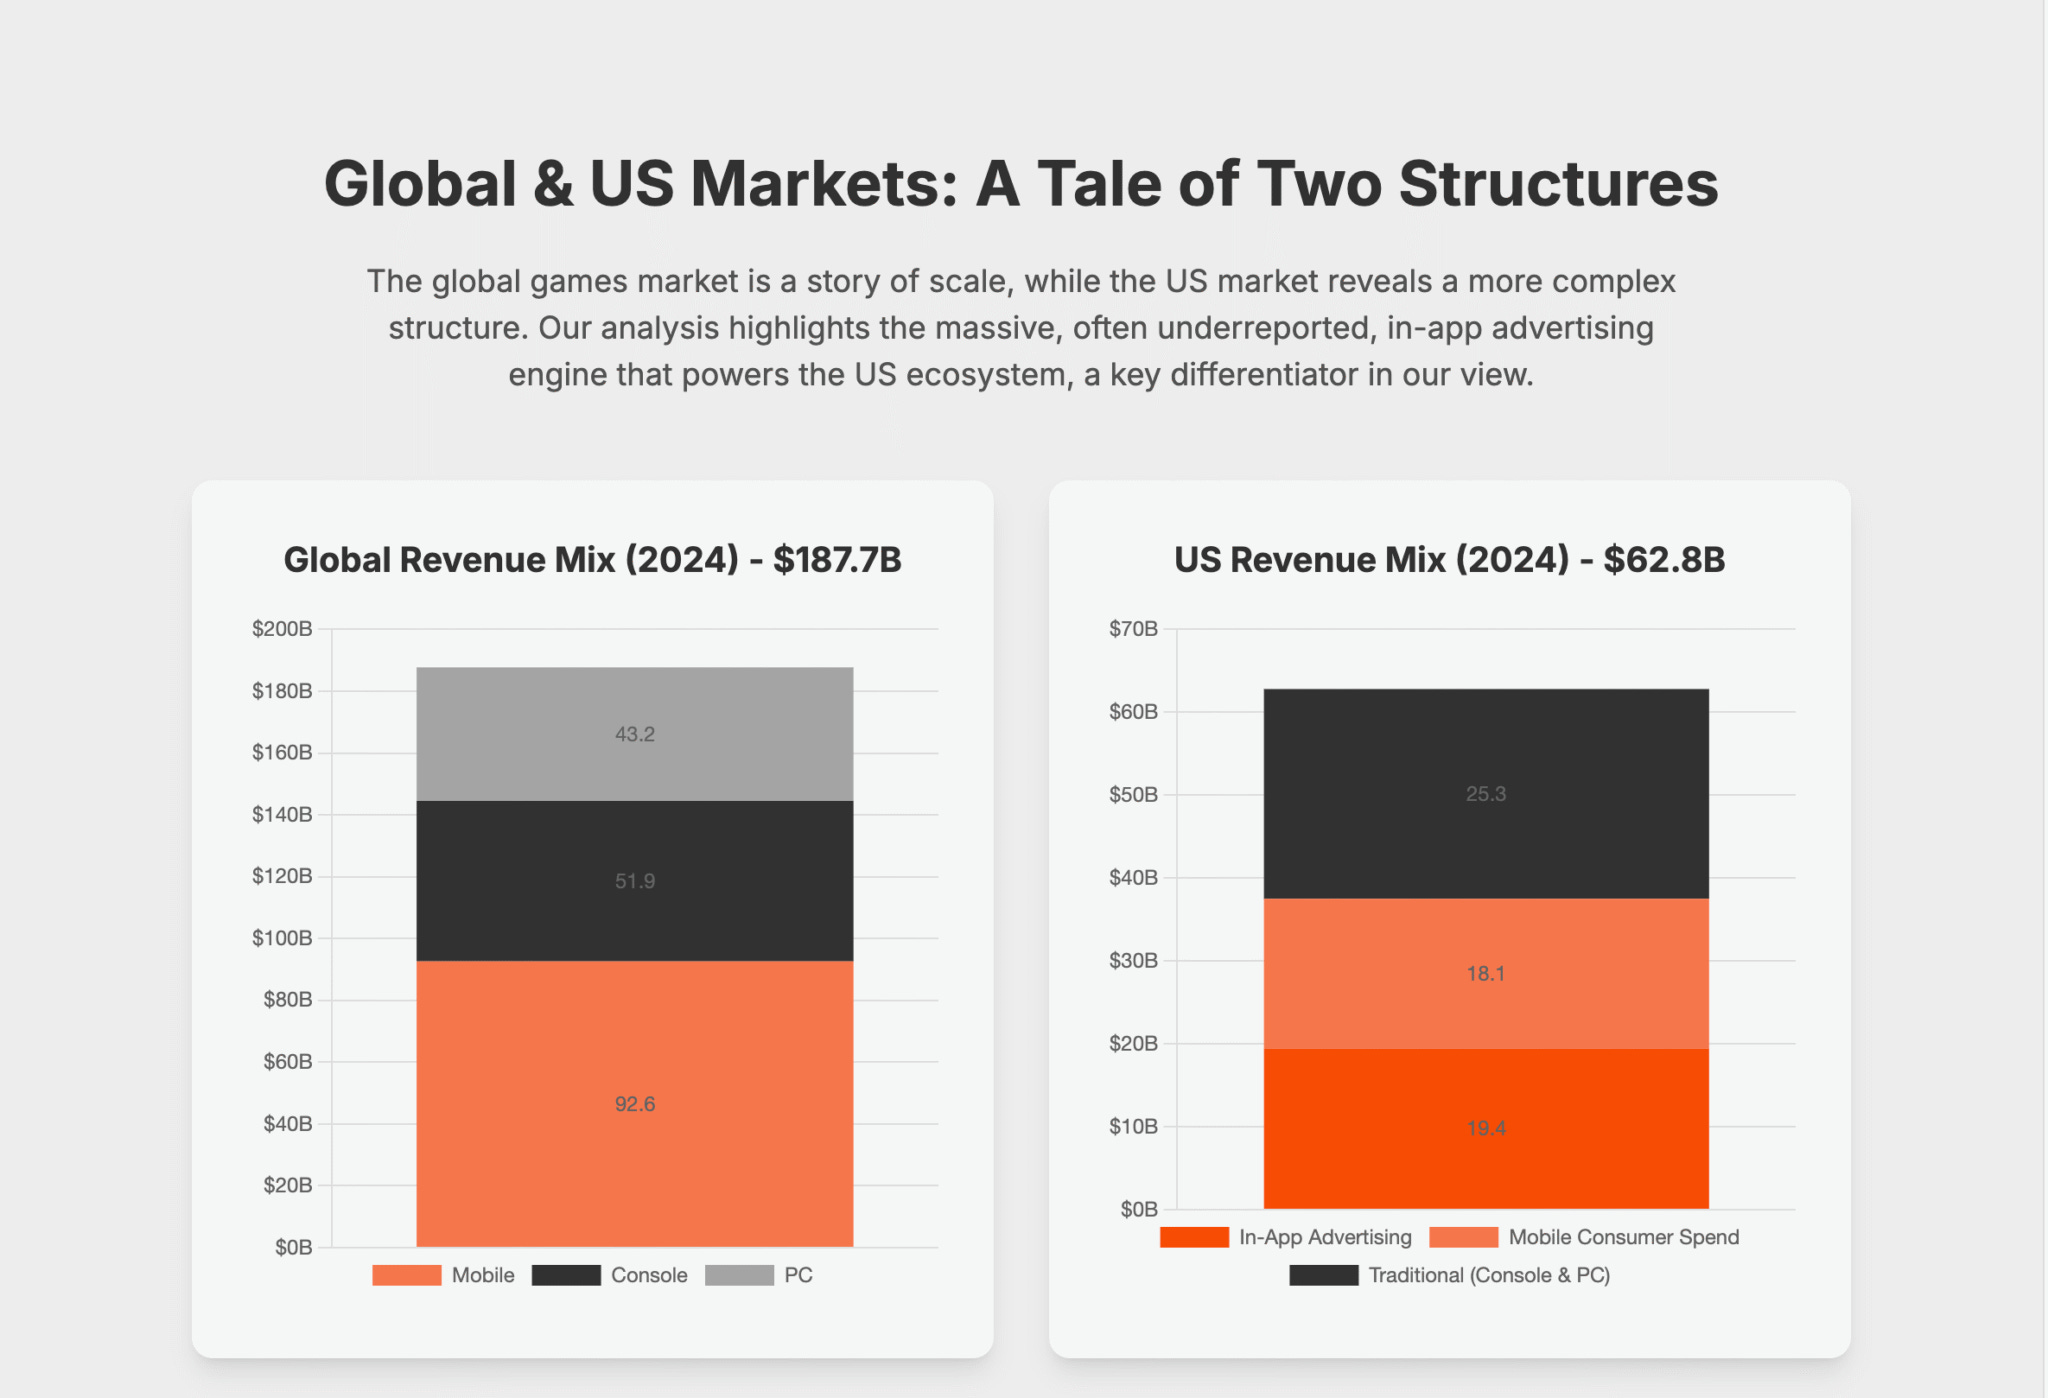
Global games market estimated at $187.7B for 2024. Half of this is mobile revenue.
PC and Console Market
PC/console market in the US is estimated at $23.1B for 2024, it’s the largest traditional games market worldwide. Expected to reach $27.7B by 2029 (CAGR 3.7%).
The console market decreased by 3% in 2024, mainly due to lower sales. In-game transactions for 2024 hit $11B, 63.4% of all console revenue.
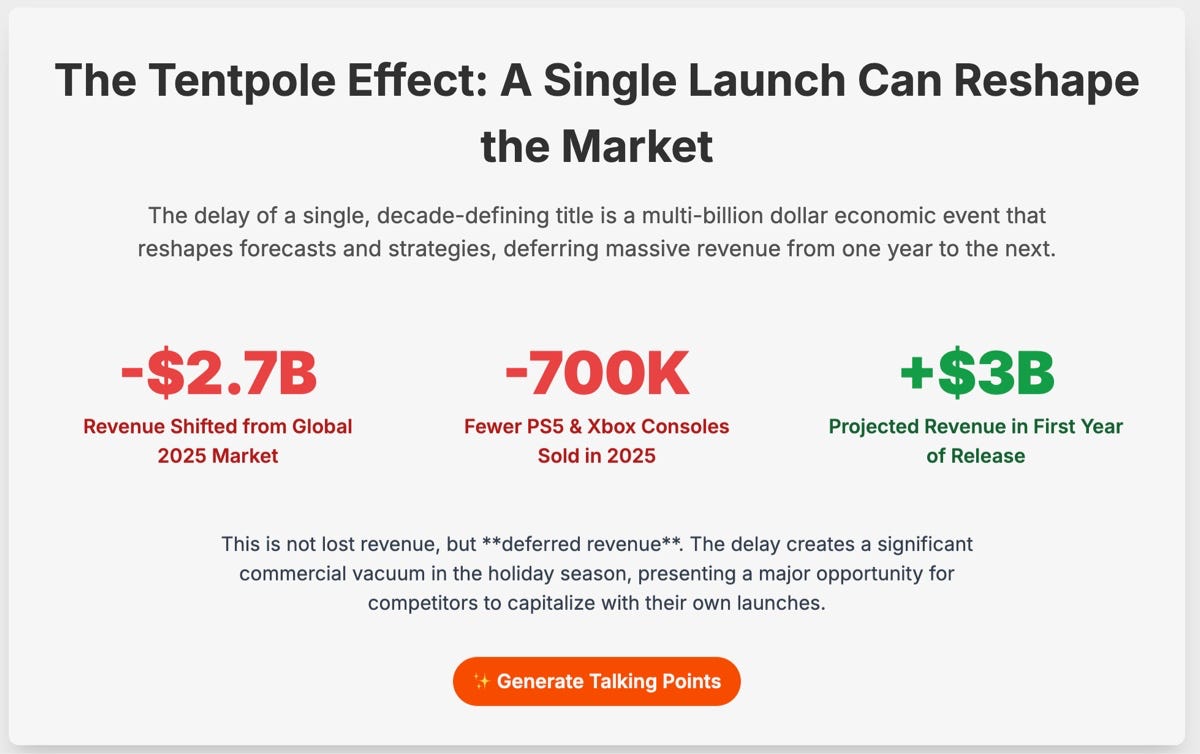
Delaying GTA VI to 2025 is estimated to have a $2.7B impact and 700K fewer PlayStation 5 and Xbox Series S|X sold. The game is expected to generate $3B in its first release year.
The US PC market generated $5.7B in 2024. Forecast: $6.6B by 2029 (CAGR 2.9%). Both full game sales and in-game transactions are growing; the latter accounts for 85% of total segment revenue.
The US subscription market is $6.6B. Expected to hit $9.9B by 2029 (CAGR 8.4%). There are over 60M Xbox Game Pass, PlayStation Plus, and Apple Arcade owners in the US, projected to grow by 2029.
US Esports
US esports market is comparatively small — $523M. No explosive growth expected, with a projection of $689M by 2029 (CAGR 5.7%).
The US is the world’s #2 esports market after China. Despite most discipline creators being US-based (Riot Games, Valve, Activision Blizzard), PwC expects the gap to widen.
US esports sponsorships valued at $189M in 2024. Only modest growth forecast to $225M by 2029.
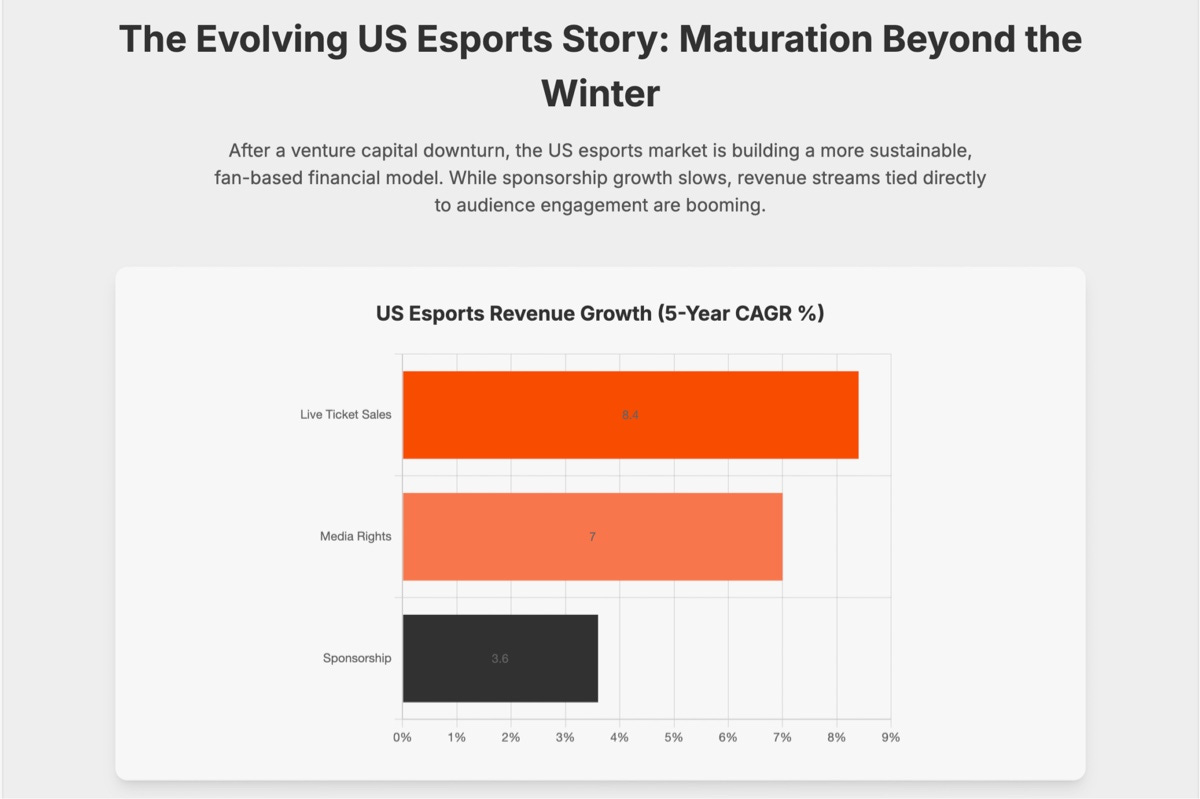
While sponsorship numbers are modest, the market for selling competition rights is growing. In 2024, this was $166M, forecast to reach $233M by 2029. With a CAGR of 7%, this revenue stream is set to overtake sponsorships in 2028.
Interest in events is also there. Ticket sales market is expected to grow from $38M in 2024 to $57M by 2029 (+8.4% CAGR).
Newzoo x Tebex: Player payment behaviour in the West in 2025
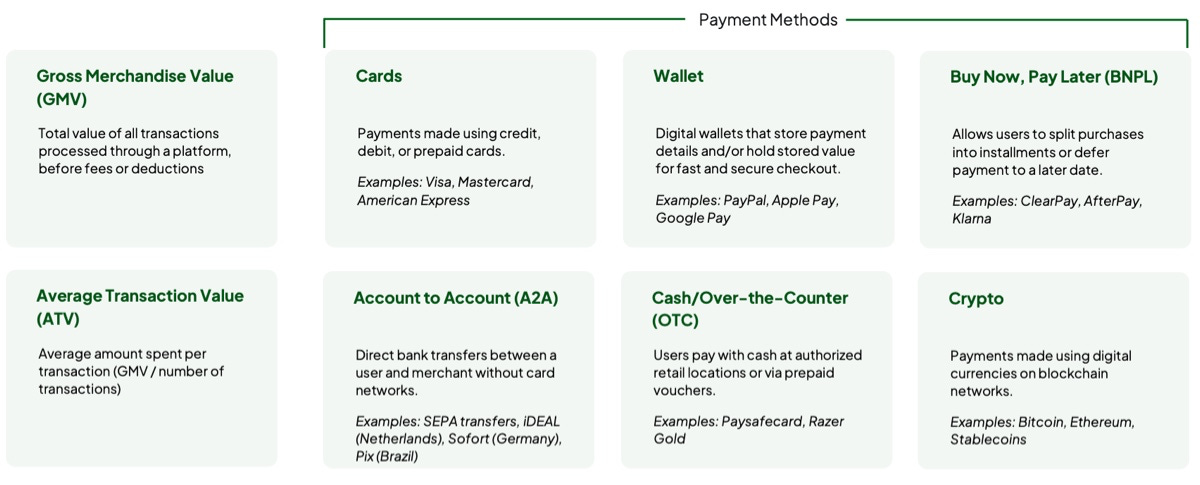
Tebex is a D2C payment system from Overwolf. Companies break down payments into different types, which are shown in the image.
$188.9B is the size of the gaming market in 2025. North America and Europe account for 46% of all spending.
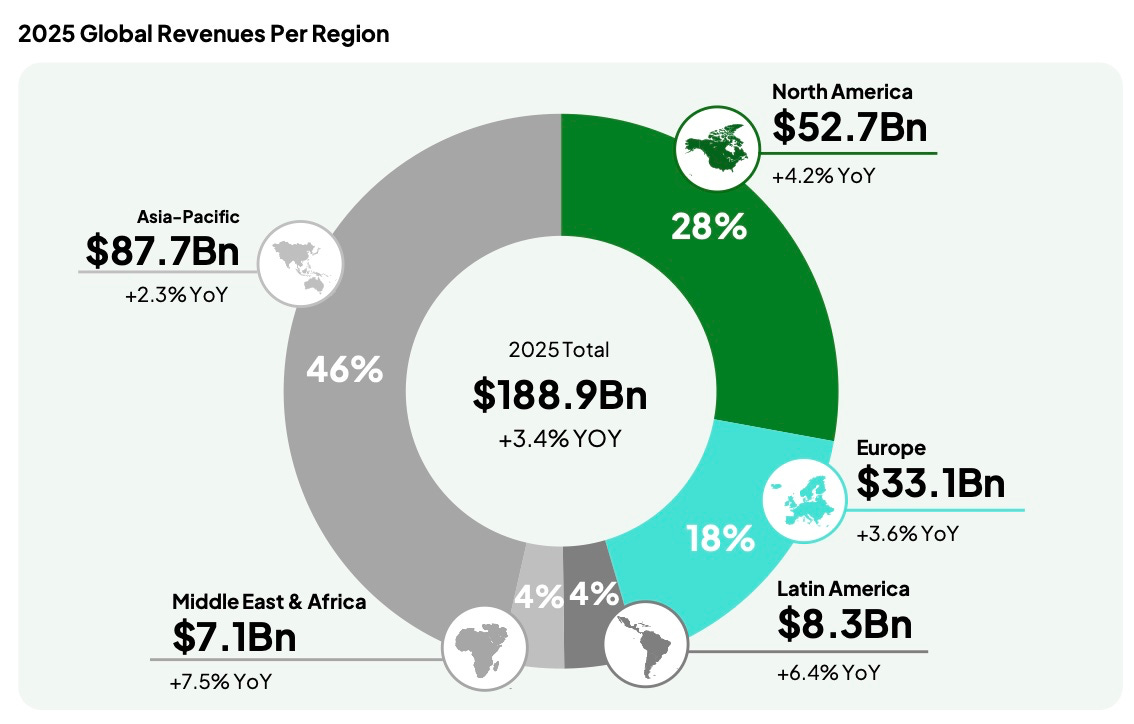
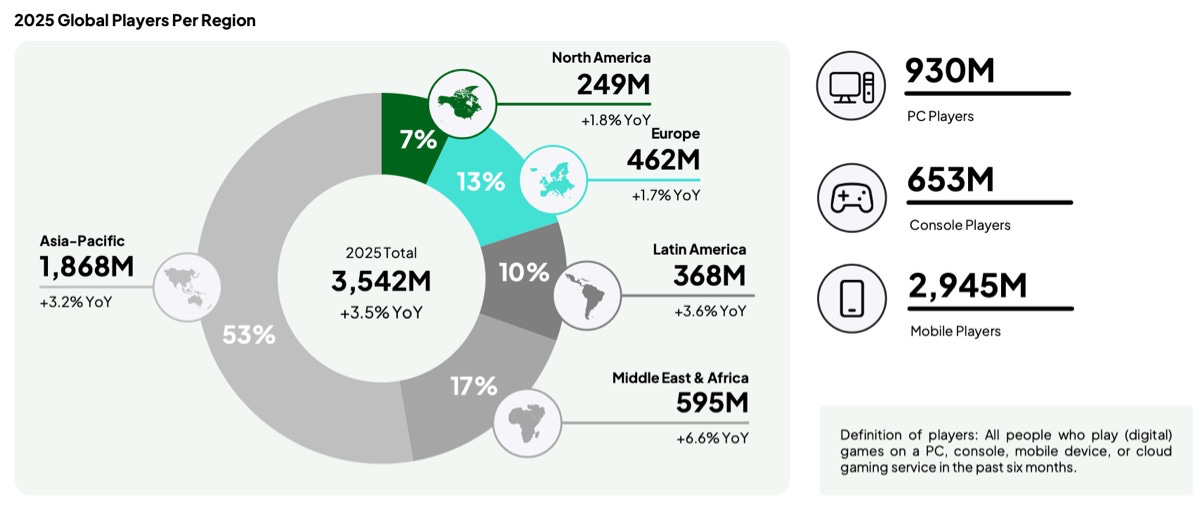
Despite taking a major share of revenue, North America and Europe make up only 20% of all players globally.
Payment characteristics in global markets
For the first time, Newzoo publishes statistics on the number of paying players by region. The Asia-Pacific region leads with 742M (+3.9% YoY); second is the Middle East & Africa (222M, +7.4% YoY); third is Europe (264M, +3% YoY); fourth, Latin America (171M, +5.4% YoY); last is North America (162M, +1.6% YoY).
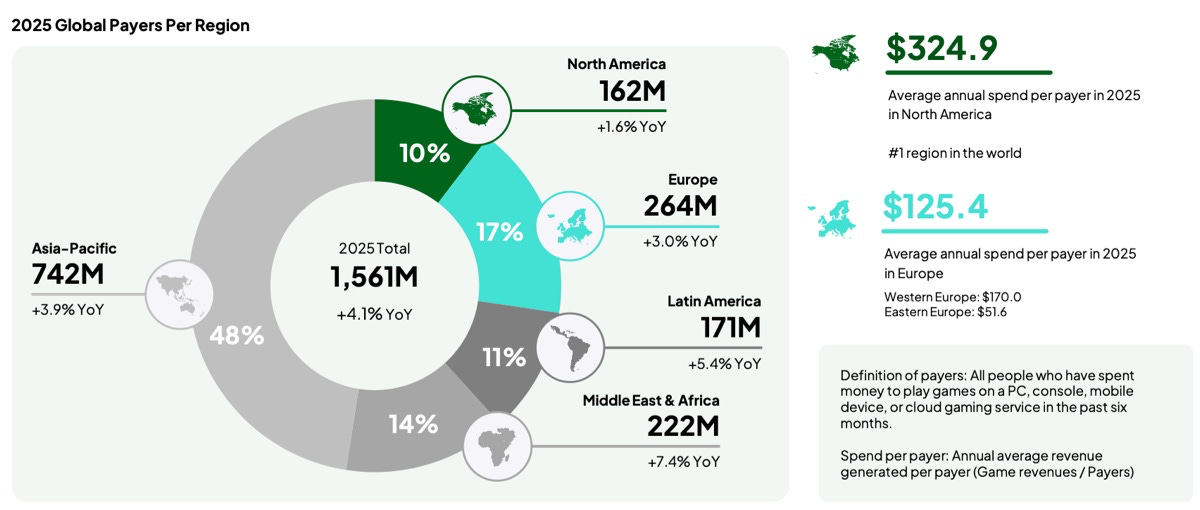
North America has the highest annual ARPPU - $324.9. In Europe, it is $125.4, with Western Europe at $170, and Eastern Europe at $51.6.
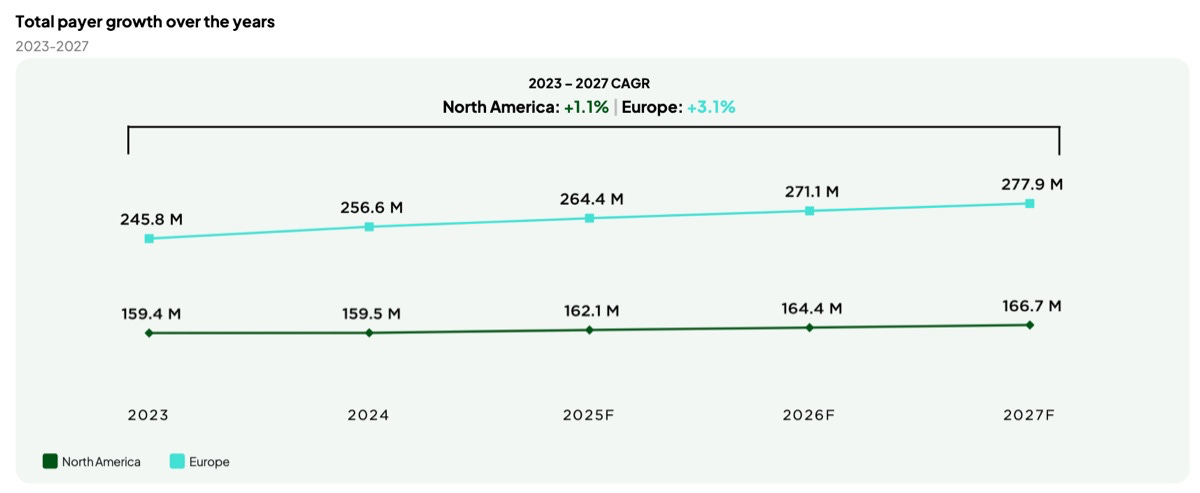
Europe is growing faster than North America in the number of paying players. The average annual growth rate from 2023 to 2027 in North America is 1.1%, while in Europe it’s nearly three times higher, at 3.1% yearly.
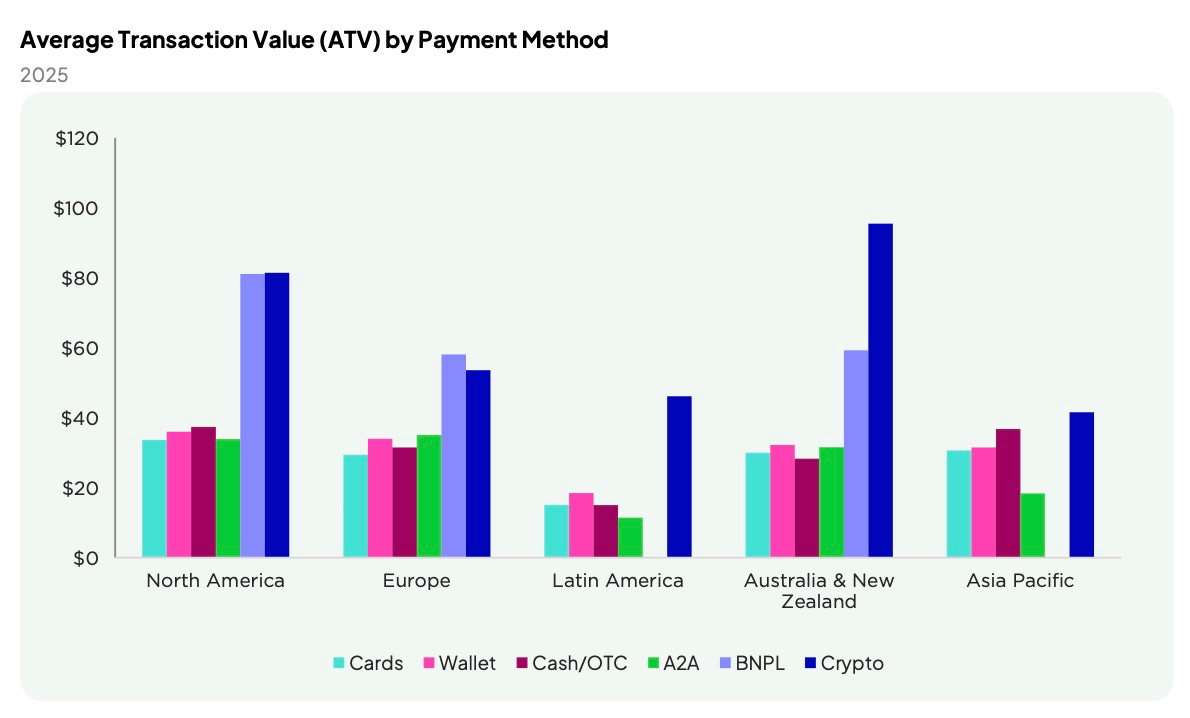
When looking at average transaction value ( ATV — total transaction volume divided by the number of transactions) for BNPL (buy now, pay later) & Crypto, North America, Europe, Australia, and New Zealand all have higher-than-average amounts compared to more traditional payment methods.
Speaking of payments. We at MY.GAMES passed $1M monthly revenue for Fable Town, our recent launch. Kudos to the MGVC Publishing team, our Mobile Publishing branch, and Reef Games, the developers. The game is now in the top 10 Merge-3 titles by Sensor Tower, and we’re steadily growing. Without crypto! 🙂
Users prefer different payment types. Tebex highlights BNPL and cryptocurrency payments. In Europe and North America, these methods have a higher ATV than card payments. However, the overall volume of such payments is still much smaller.
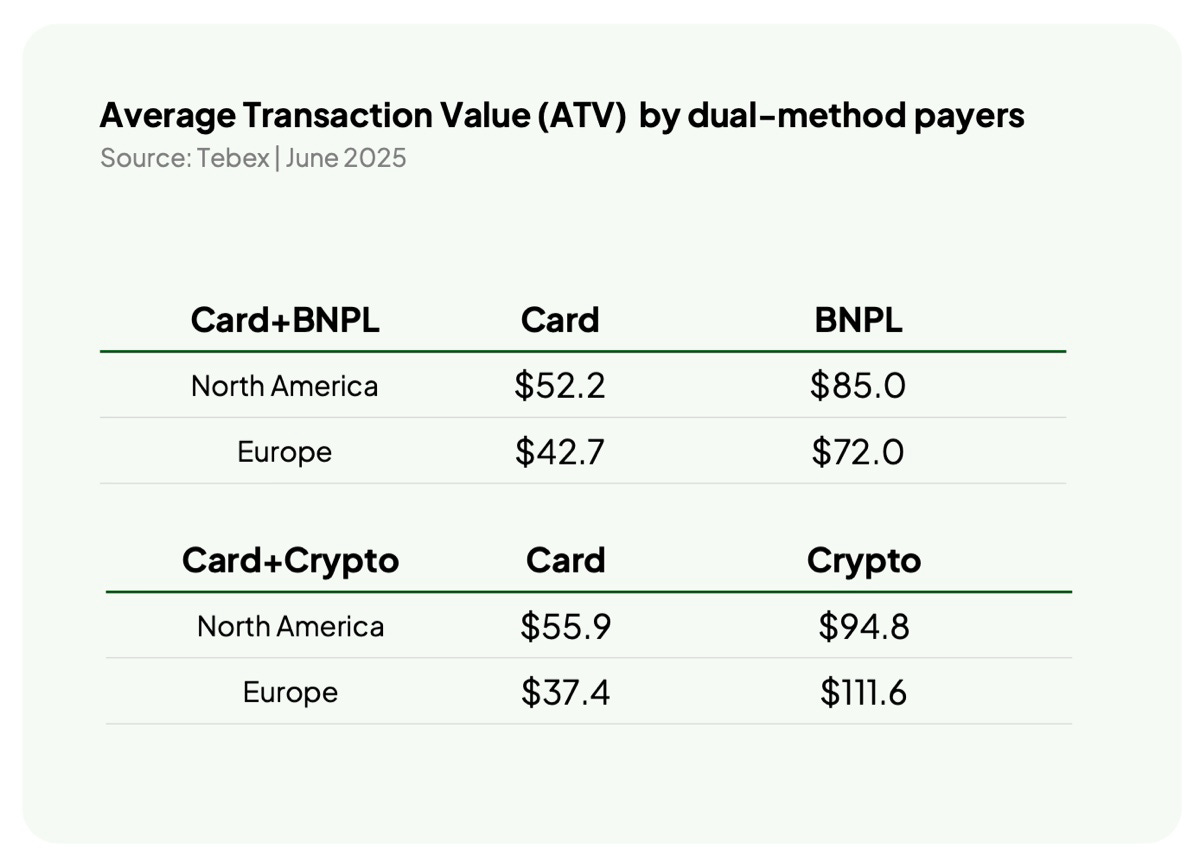
Among users who have used both cards and BNPL, there was no decrease in transaction frequency. The average monthly ATV in 2025 grew from $30 to $40. Most likely, this indicates that users, responding to inflation, prefer to buy more expensive, but more valuable items.
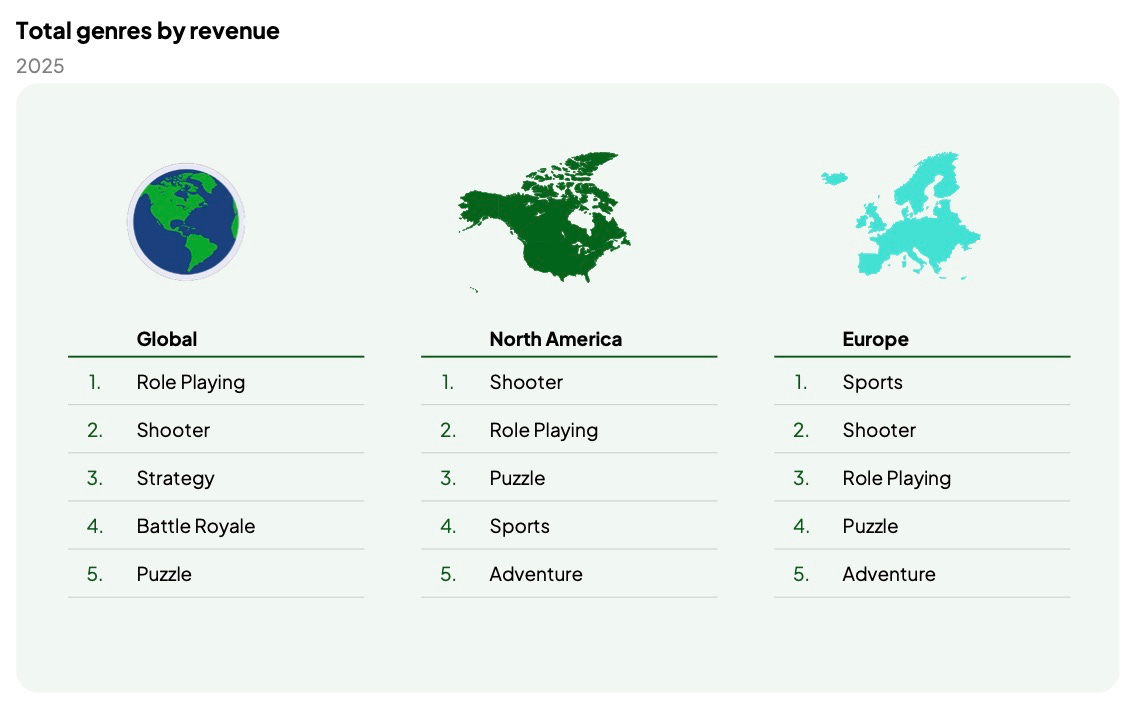
Shooters, RPGs, and puzzle games are the highest-earning genres in the US. In Europe, sports games lead. The main revenue comes from microtransactions, DLC, and subscriptions.
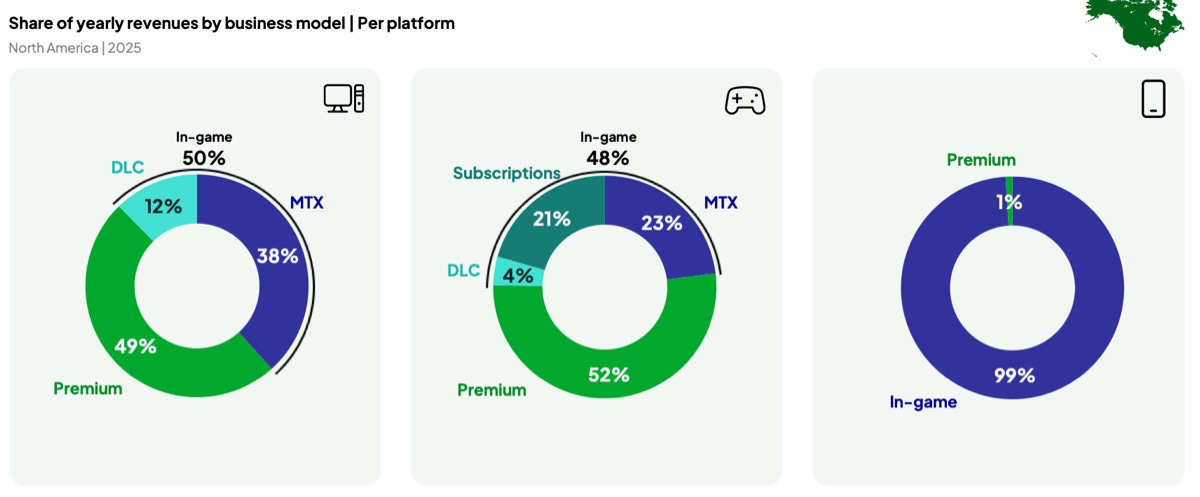
In the US, consoles have a unique source of revenue—subscriptions, which account for 21% of all spending. On PC and mobile, subscriptions are less common. Interestingly, despite subscriptions, more premium games are purchased on consoles (52%) than on PC (49%), even though theoretically those should be included in subscriptions.
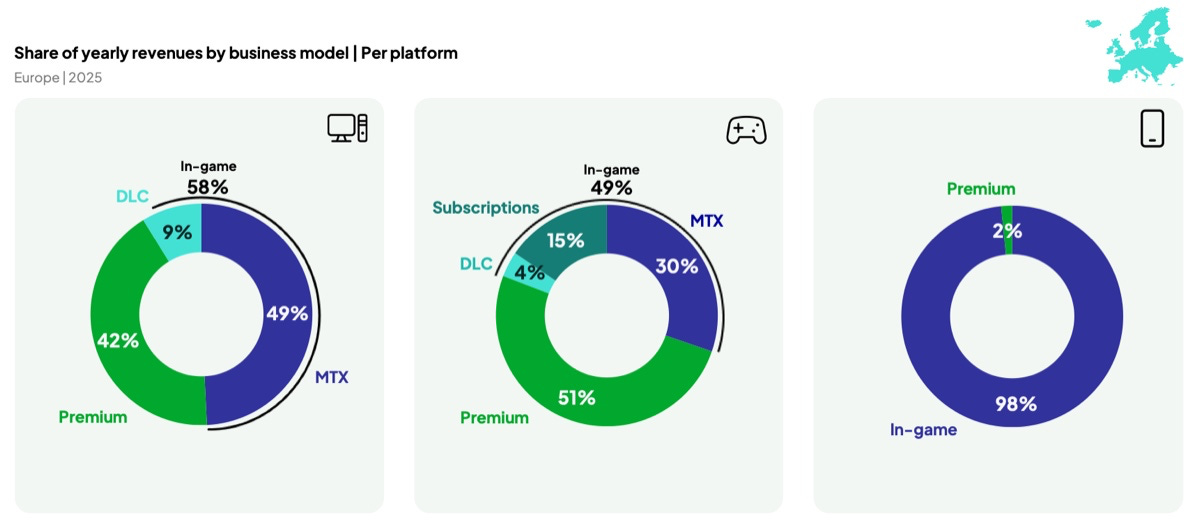
In Europe, things are similar to the US, but users are much more active with microtransactions on both PC and console.
Profile of Paying Users in North America and Europe
Newzoo surveyed 2,794 payers in North America and 10,713 in Europe. “Payers” refers to those who pay monthly in games, on all platforms.
The average American paying user is 33.6 years old, male (57% of cases), with a low or medium income (66% probability), and working full time (53%).
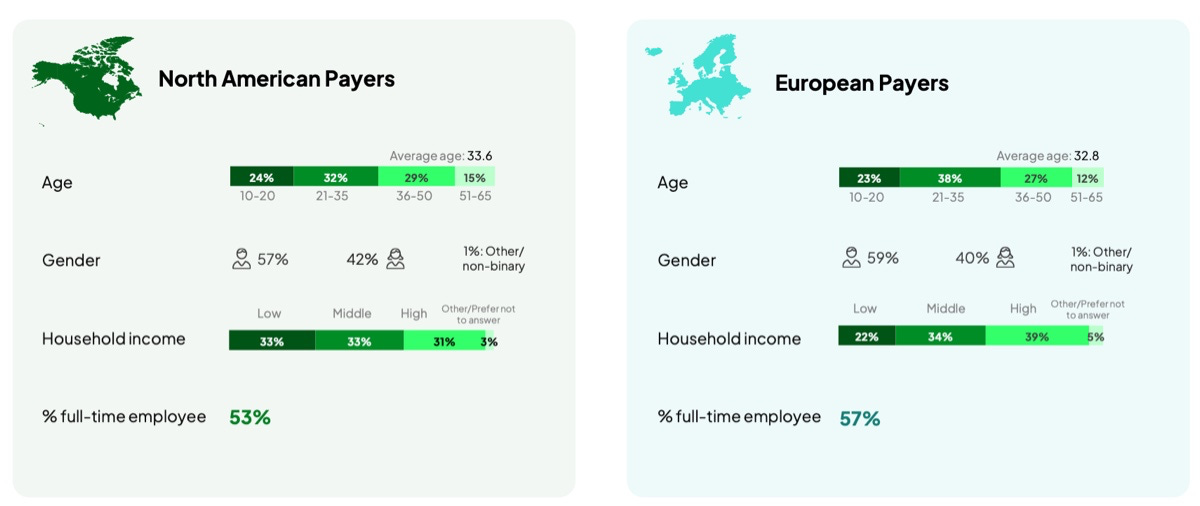
In Europe, the profile is similar. Slightly more males among respondents, and users report higher incomes.
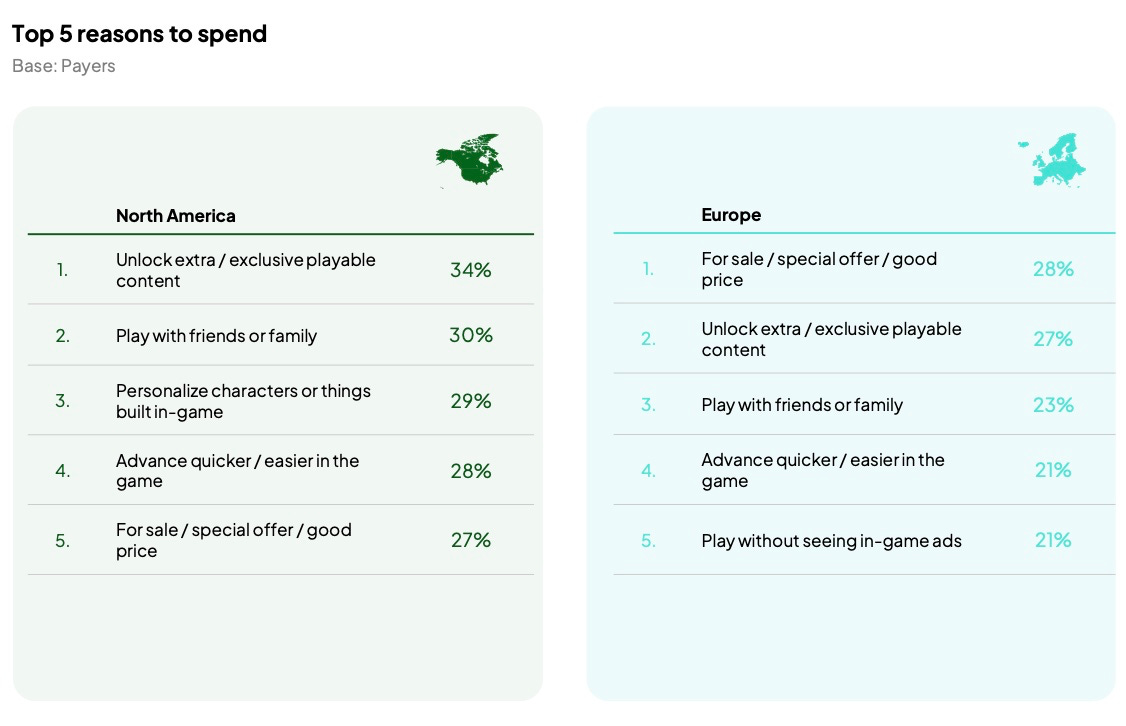
There are substantial differences in motives for purchases. In North America, they pay to unlock new content (34%), play with friends/family (30%), and personalize characters or build something in-game (29%). In Europe, there’s more focus on discounts and special offers (28%), and users are less tolerant of ads, often paying to remove them (21%).
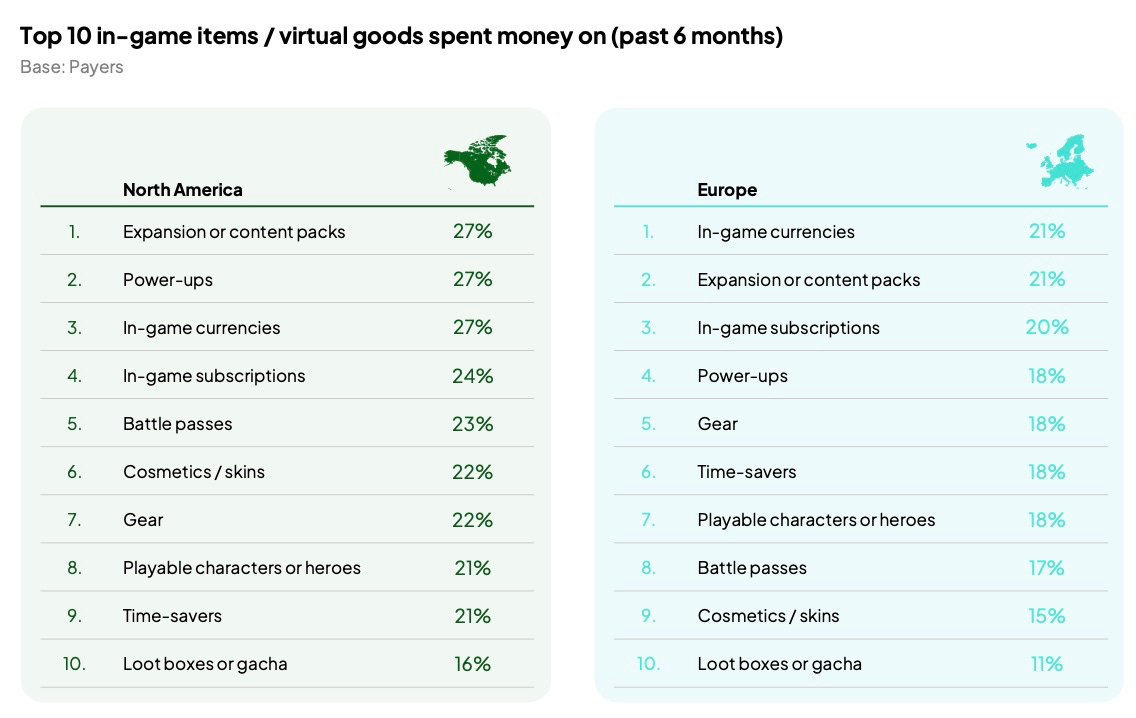
Users rarely purchase just one content type. Typically, it’s a mix of various kinds of content.
Games & Numbers (July 31 – August 13, 2025)

PC/Console Games
Ready or Not sold over 2 million copies on consoles within two weeks after launch. Total sales for the project have exceeded 10 million copies.
Total sales of Control have reached 5 million copies, as reported by Remedy.
Persona 3 Reload has been purchased over 2 million times worldwide. The developers also reminded that the project is available on Nintendo Switch 2.
The quirky dating sim Date Everything! has surpassed 500,000 copies sold. In the game, you can date various objects.
Titan Quest II sold over 300,000 copies in its first 3 days in Early Access.
As Satya Nadella stated, more than 50 million people have played Call of Duty: Black Ops 6. This includes users who got the game for free via Game Pass.
The Battlefield 6 open beta became the most successful in the series’ history. At its peak, just over 521,000 people played simultaneously.
The new PEAK update helped the game set a new peak CCU record, 135,400 people. A new biome (desert) was added to the game.
Mobile Games
InnoGames surpassed €2 billion in revenue. Forge of Empires was the top earner. However, Tribal Wars, Grepolis, and Elvenar each earned over €200 million.
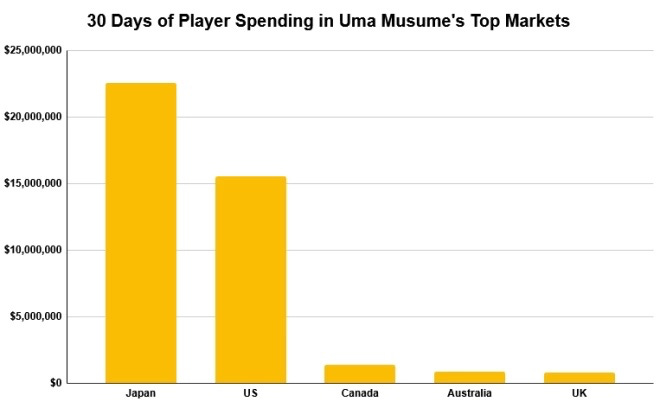
In the first 30 days after global launch, Uma Musume: Pretty Derby earned $22.8 million in overseas markets, which is 50.3% of the total monthly revenue. The US accounted for 68% of all overseas revenue.
Castle Duels earned $13 million in its first year. The game was downloaded 3.5 million times.
Azur Games’ titles have been downloaded over 10 billion times, according to company co-founder and CEO Dmitry Yaminsky.
Platforms
Total PlayStation 5 sales reached 80.3 million units. Still, to beat the PlayStation 2 record (160 million), just as many more need to be sold.
In fiscal Q1'25 (calendar Q2'25), Nintendo sold 5.82 million Nintendo Switch 2. Mario Kart World was bought by nearly every console owner—5.63 million copies sold.
UGC
Roblox DAU in Q2'25 grew 41% to 111.8 million. The number of unique monthly paying users grew 42% to 23.4 million.
PlaySafe ID: Cheating in Games in 2025

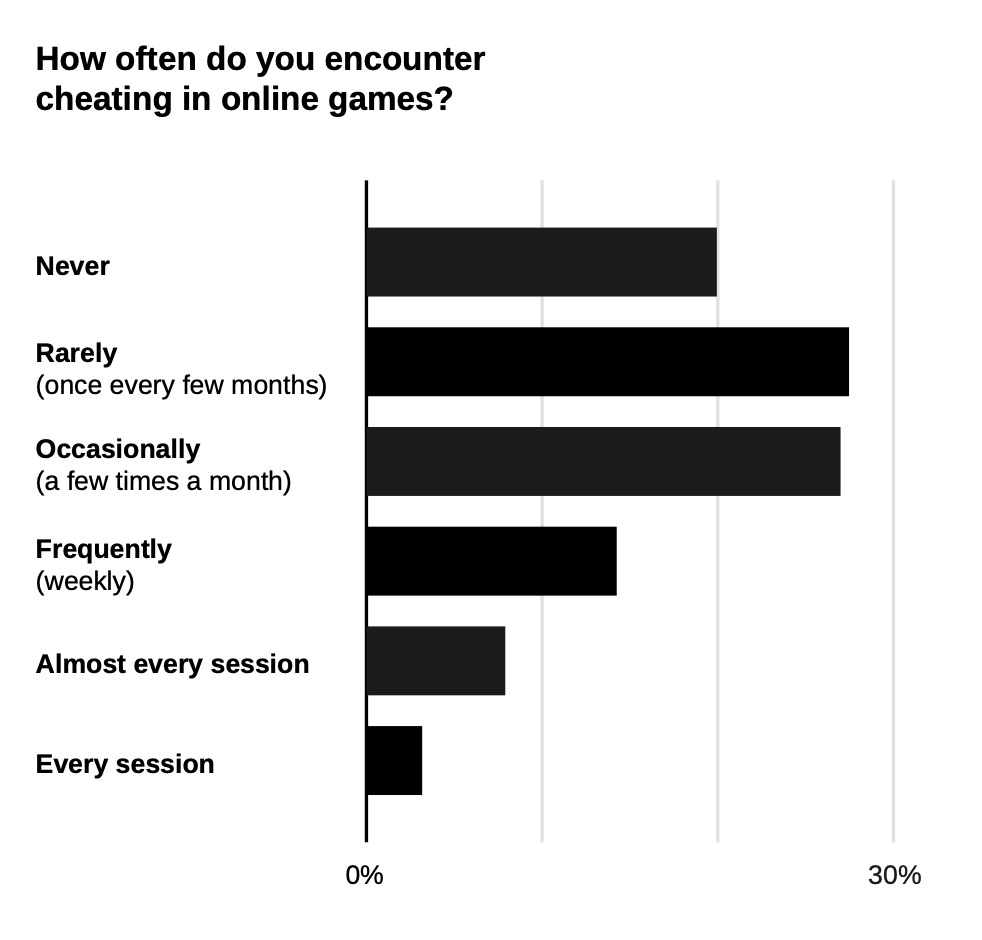
This report is based on a survey of 2,013 PC gamers aged 18+ in the UK and the US. The research was conducted by Atomik Research.
80% of players have encountered cheaters at least once in their lifetime. 52% come across them every month.
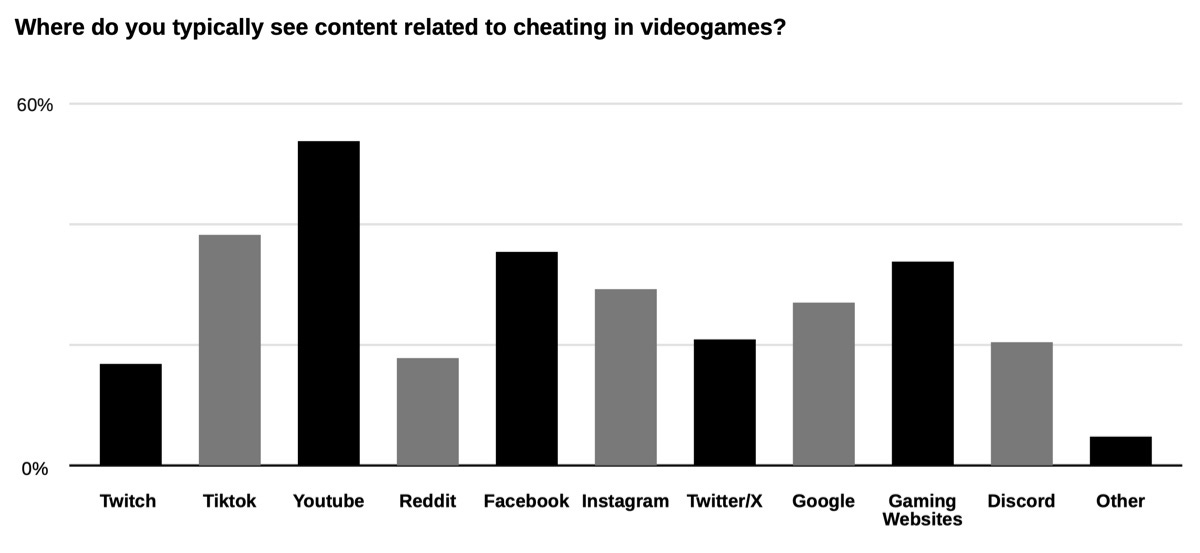
54% of players see cheating-related content on YouTube. 38% encounter cheaters in TikTok, 34% on gaming websites.
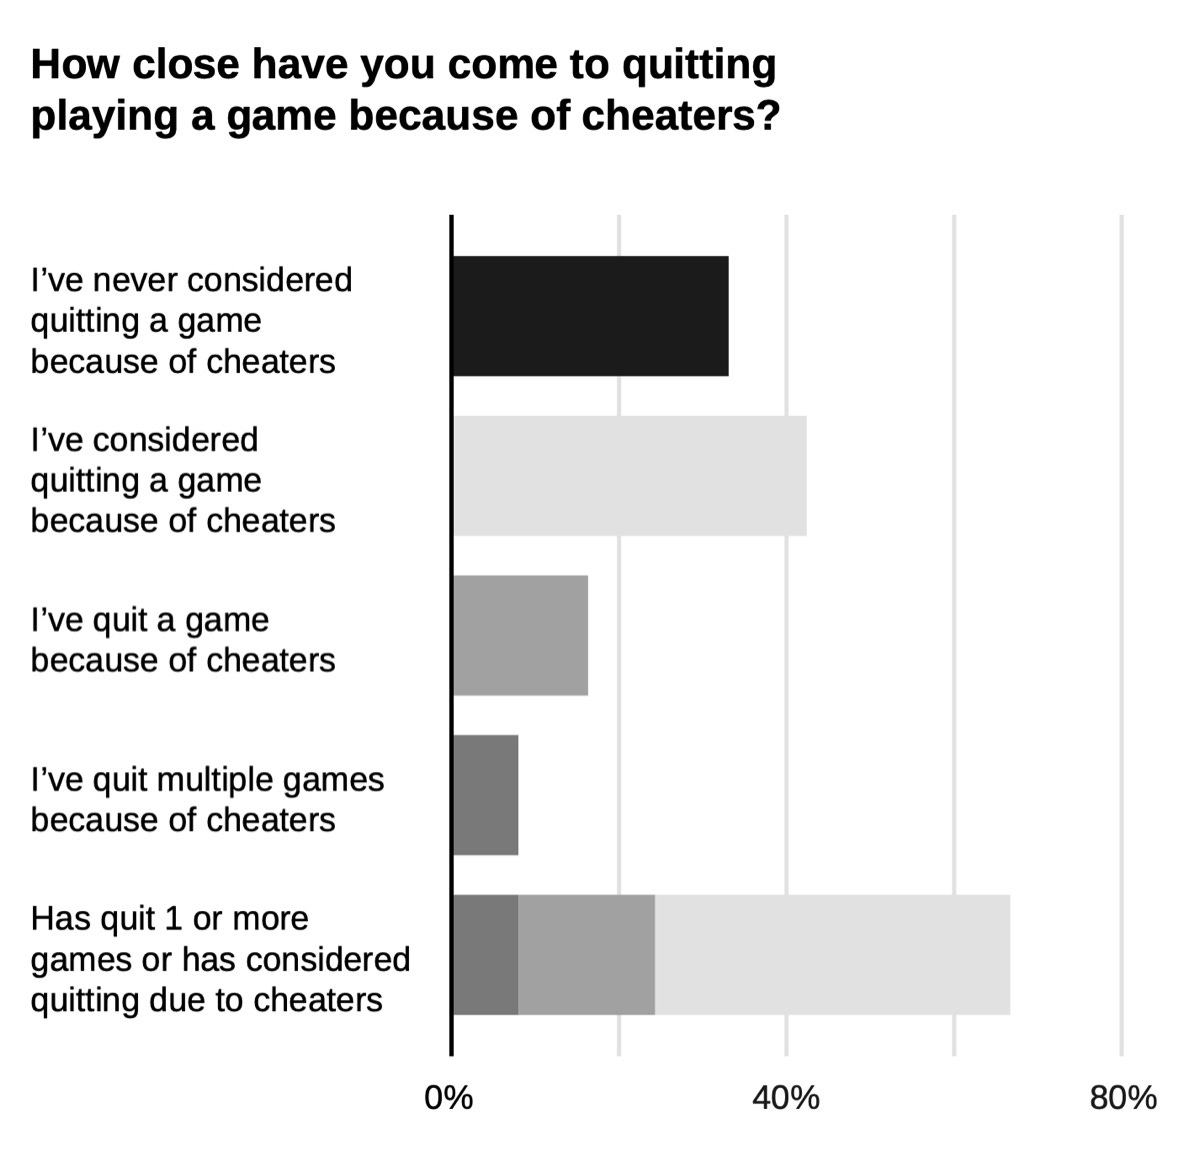
42% of surveyed players said they wanted to quit a game because of cheaters. Some respondents even stopped playing certain games entirely due to the high number of cheaters.
Consider subscribing to the GameDev Reports Premium tier to support the newsletter. Get access to the list of curated articles & archive of Gaming Reports that I’ve been collecting since 2020.
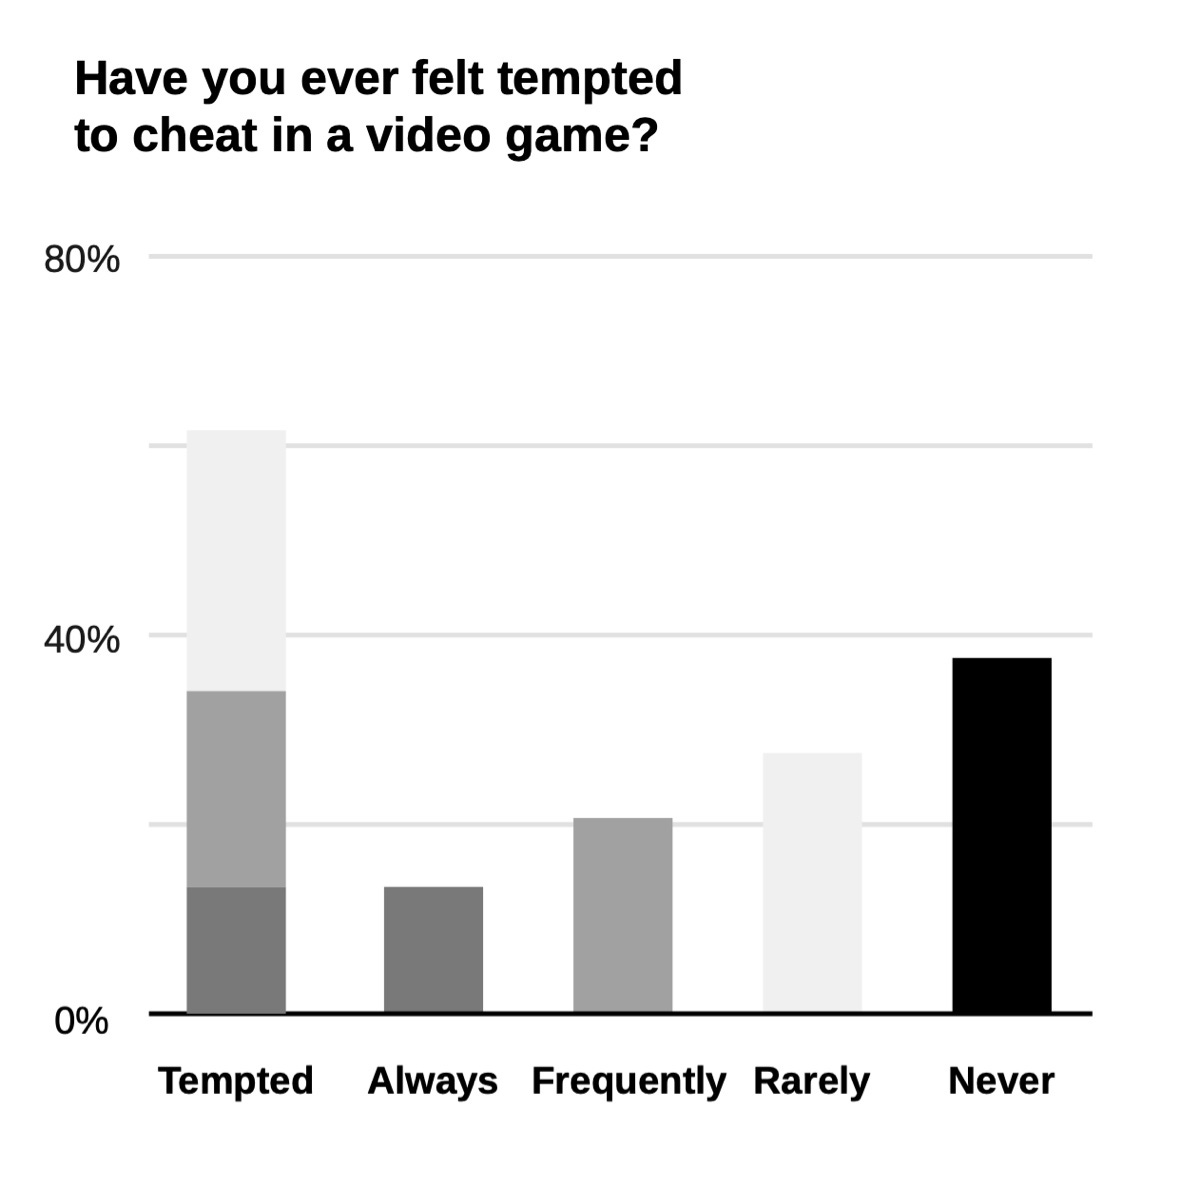
Despite this negativity, 62% of players admit they sometimes feel tempted to use cheats. For 25%, this temptation happens often.
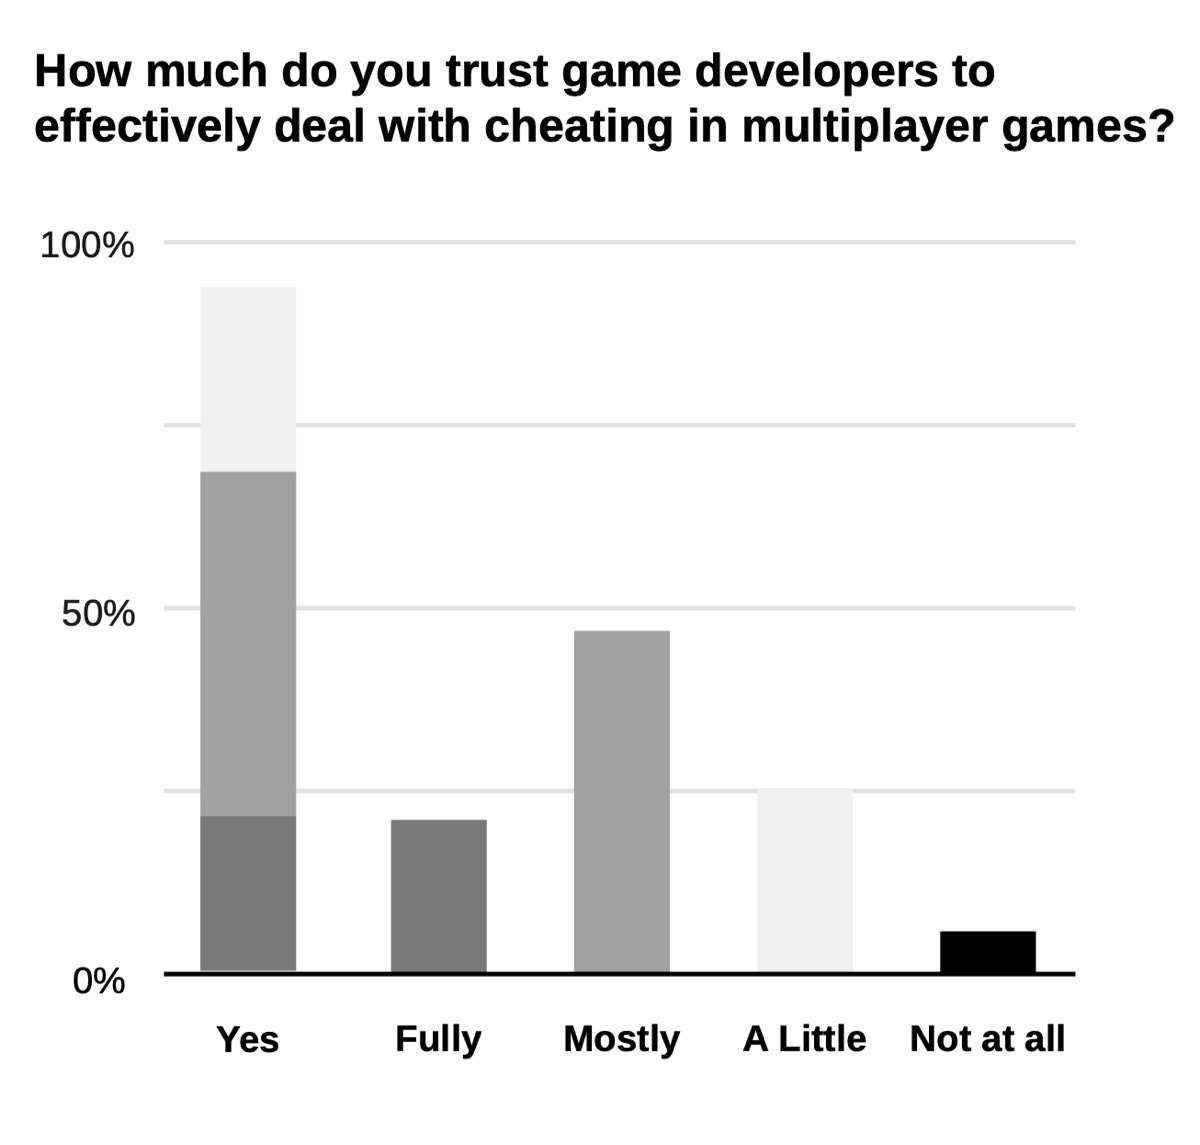
At the same time, 94% of players believe developers are effectively fighting cheaters, which makes sense, as it’s in the developers’ best interest.
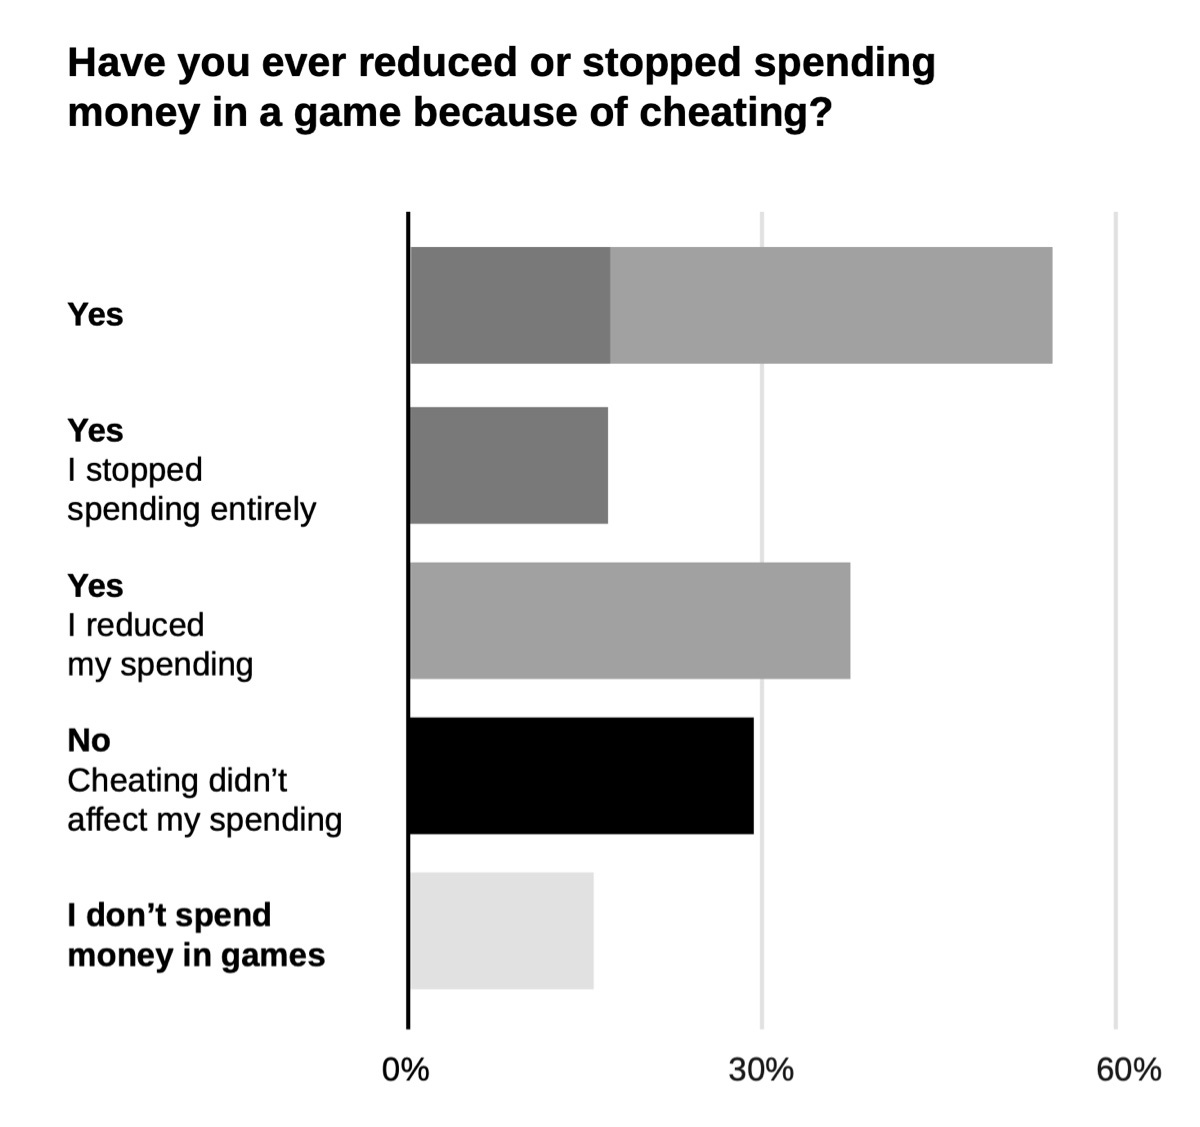
The survey revealed that 17% of players completely stopped spending money in games where cheaters are present. 38% reduced their spending.
The most sensitive group to cheating issues is users who spend $11–50 per month. 33% of players in this category stopped all spending and quit the game.
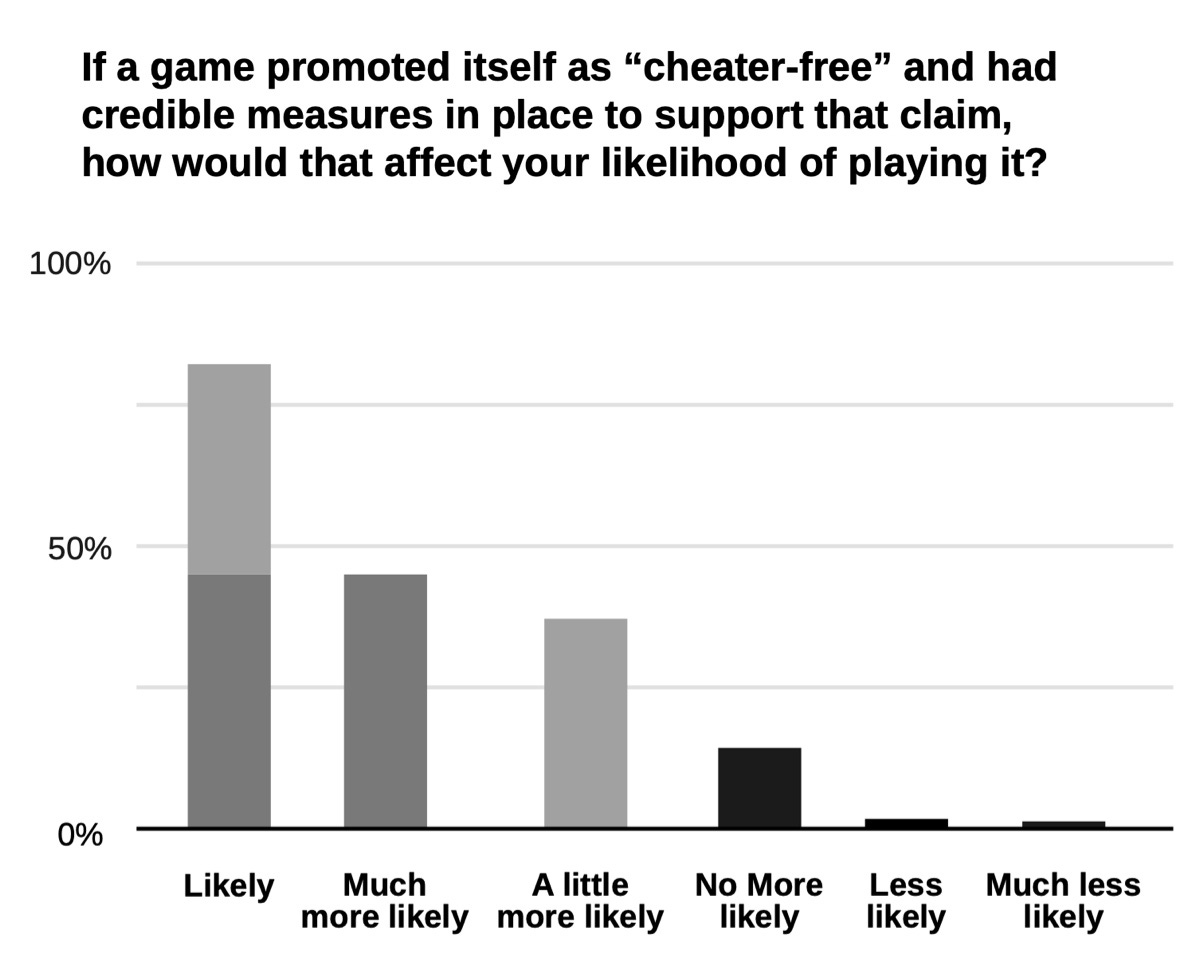
The absence of cheaters is strong marketing. 83% of players said they’re more likely to play a game without cheaters.
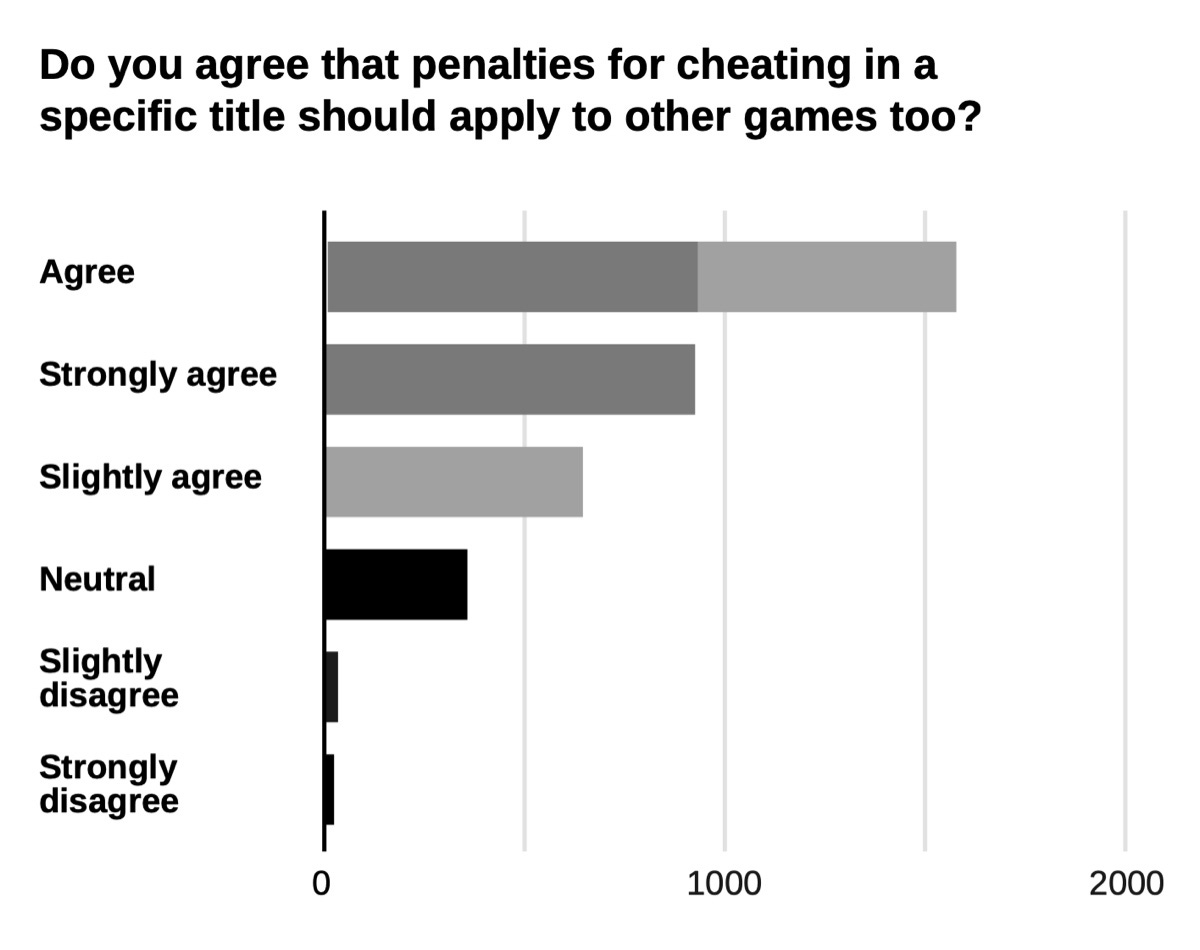
79% of players want cheating bans to extend beyond a single game - so that cheaters can’t ruin the experience in another title after being banned from the current one.
Sensor Tower: Mobile App Market in Q2'25

Market Overview
It happened – in Q2'25, for the first time in history, mobile users spent more money on apps than on games. The share of non-gaming apps in total IAP revenue in Q2'25 reached 52%. In Q2’19, it was 26%.
Total IAP purchases in Q2'25 amounted to $40.9 billion – an 11.5% increase over Q2'24.
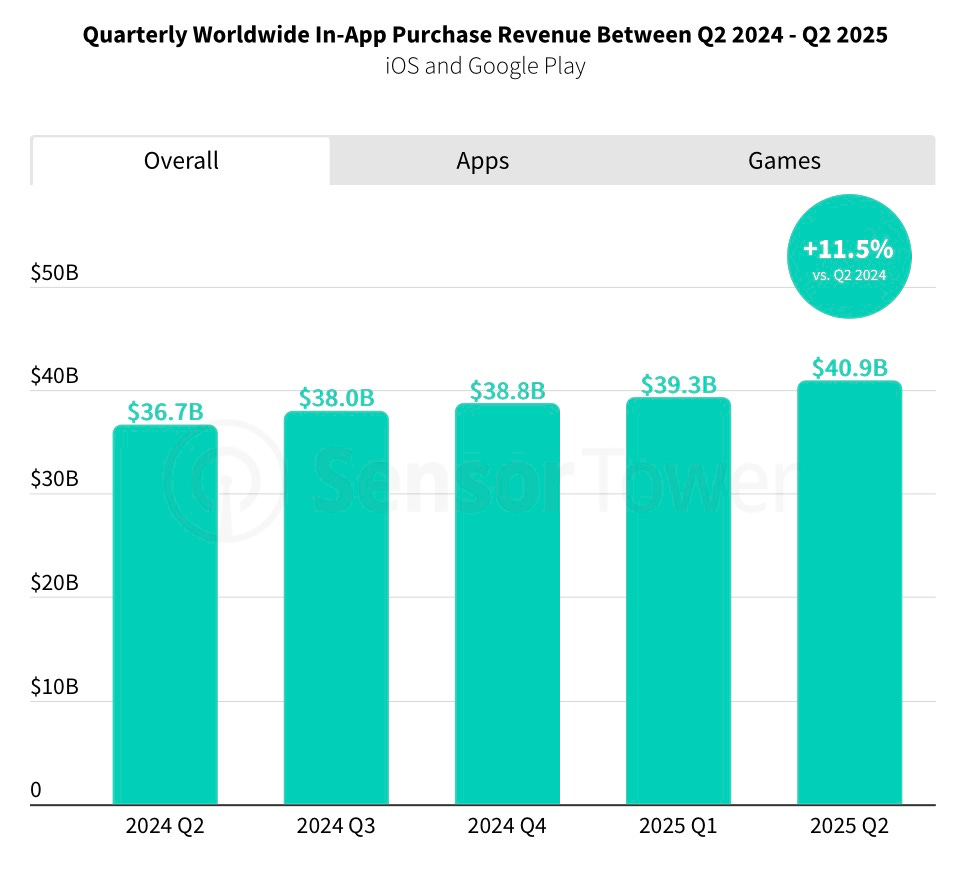
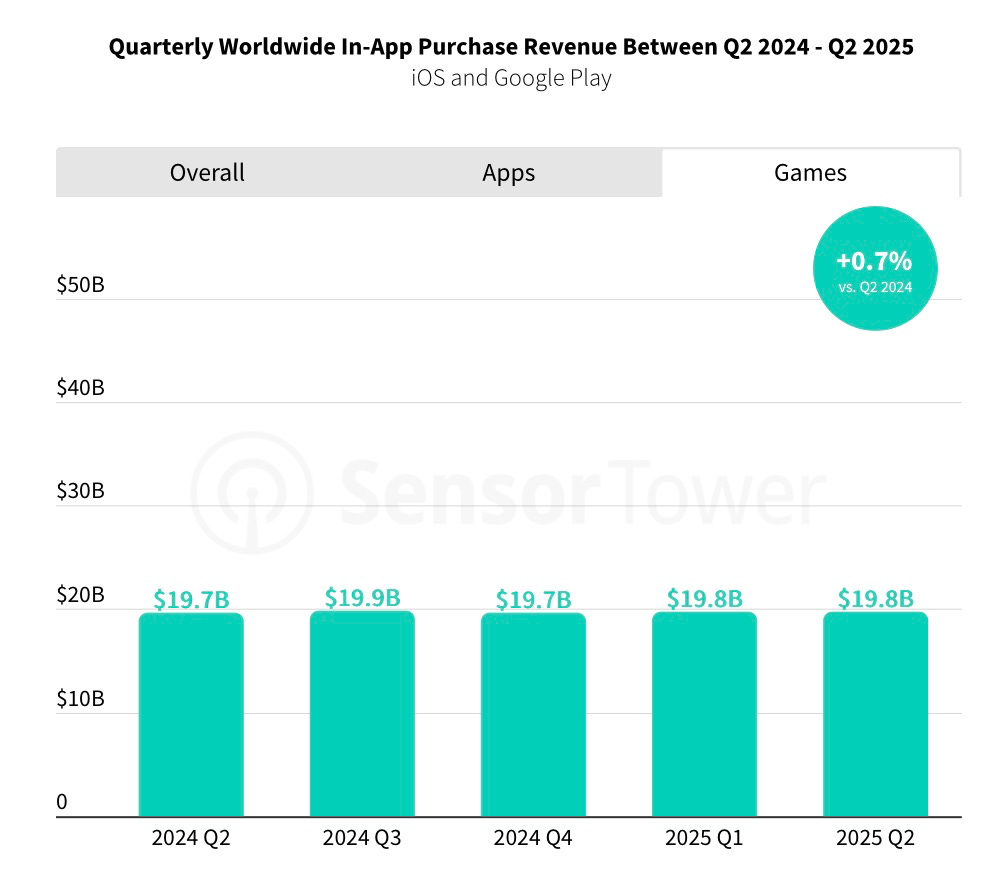
However, games made only a minor contribution to that growth. Game revenue in Q2'25 was $19.8 billion – up just 0.7% from Q2'24. The growth came from non-gaming apps.
iOS still dominates in revenue. Of the $41 billion earned from IAP, iOS accounts for $28 billion. Even excluding China (where Google Play isn’t available), the platform gap is $10 billion.
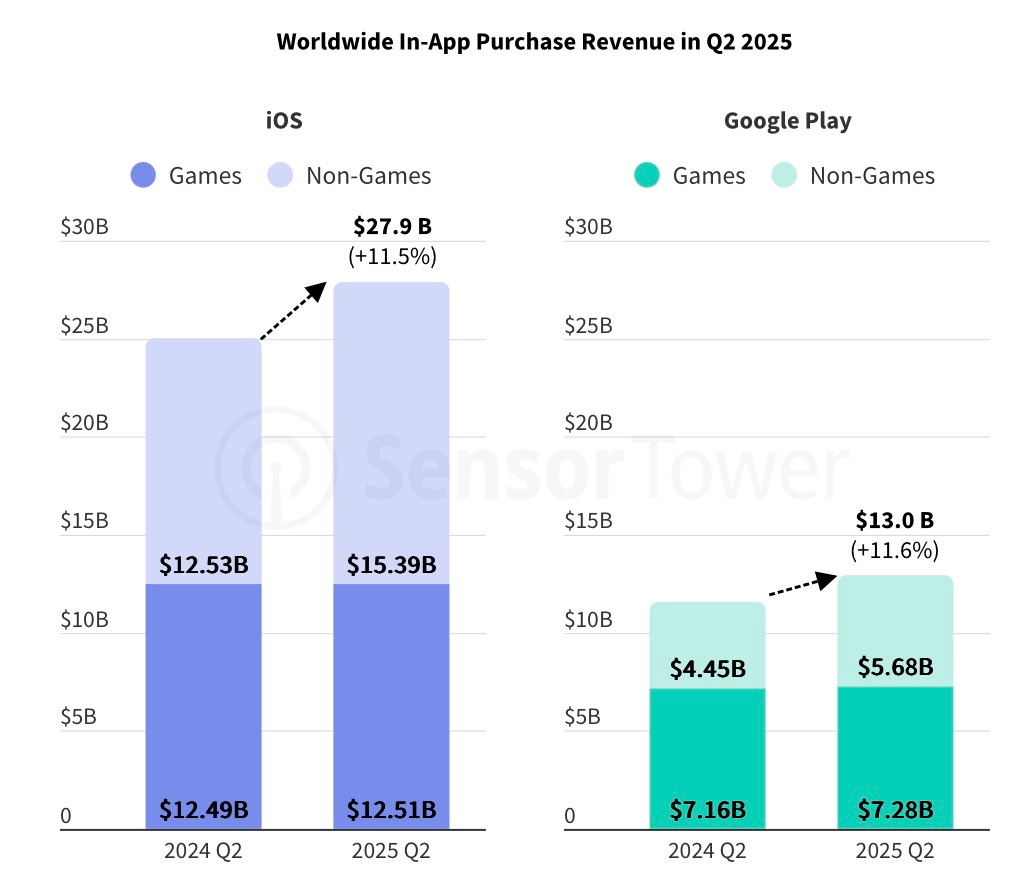
At the same time, both platforms are growing at the same rate – 11.5-11.6% YoY.
Consider subscribing to the GameDev Reports Premium tier to support the newsletter. Get access to the list of curated articles & archive of Gaming Reports that I’ve been collecting since 2020.
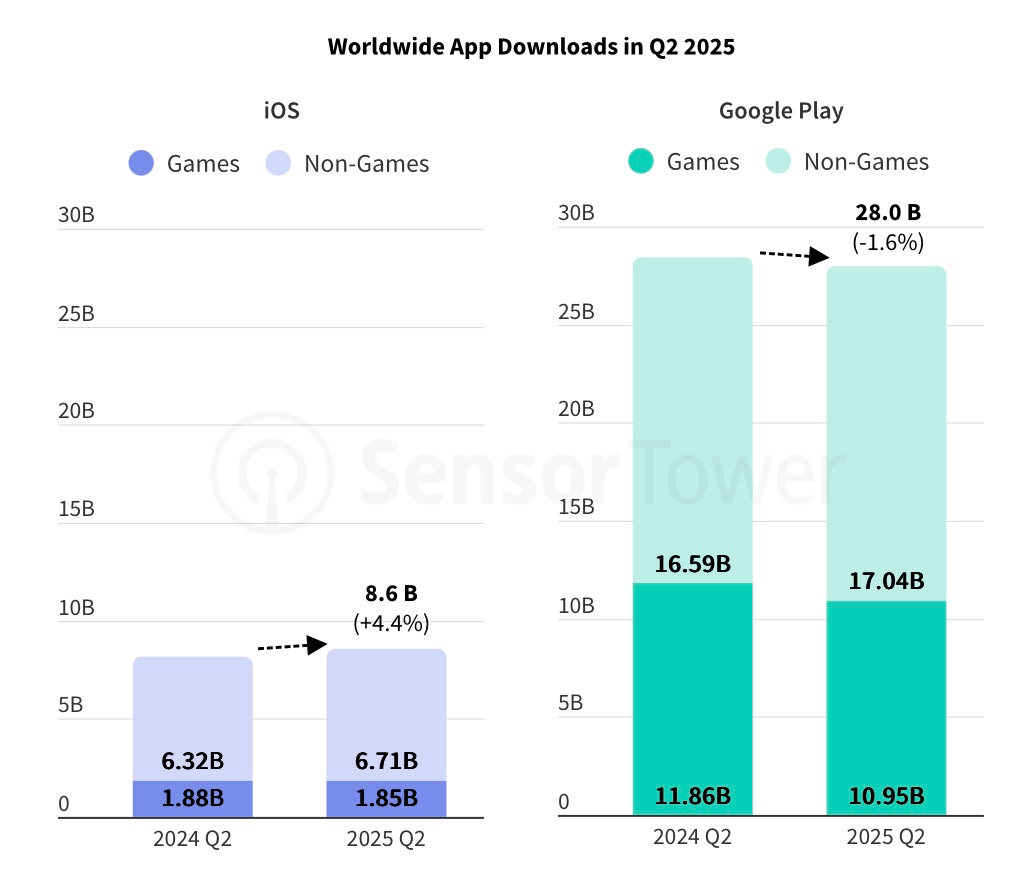
In terms of downloads, the market is static compared to Q2'24 – 36.6 billion installs.
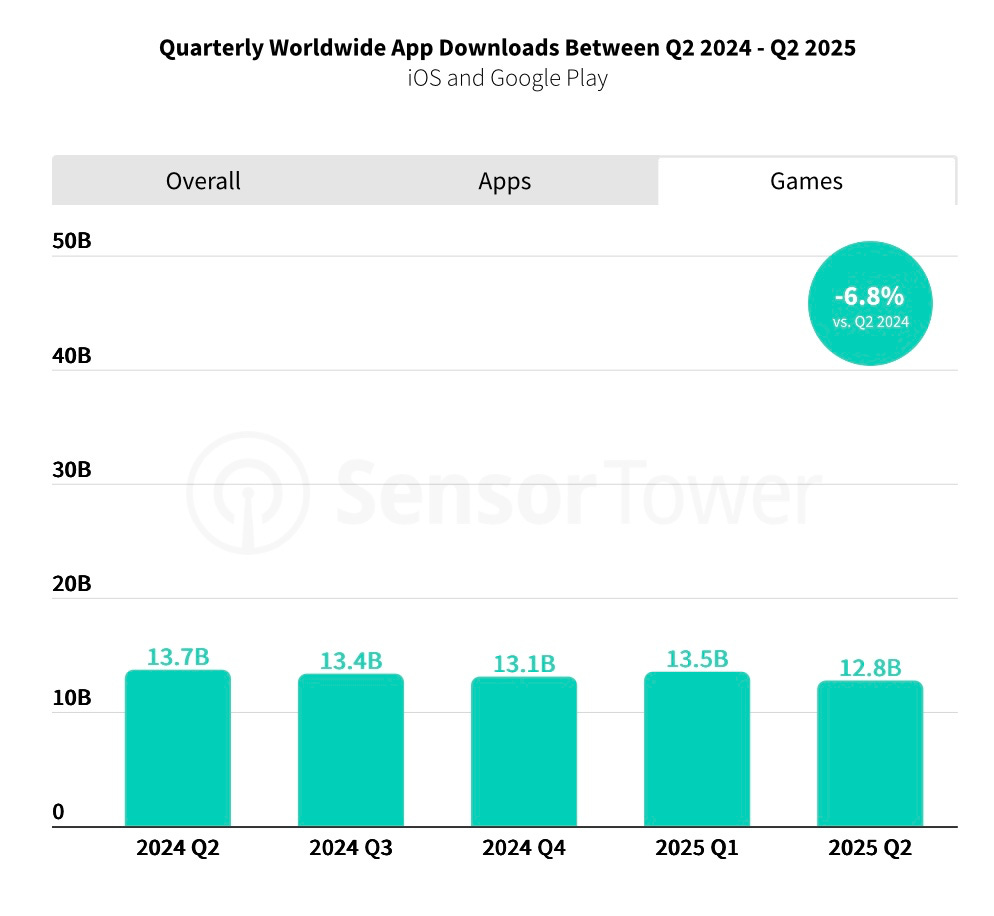
But non-gaming app installs grew by 3.7% (to 23.8 billion), while game installs dropped by 6.8% (to 12.8 billion).
Google Play leads by a significant margin in downloads, but its Q2'25 trend is negative. iOS, although much smaller in absolute numbers, is growing.
Game Market
Strategy (+23% YoY), puzzle (+13% YoY), and shooter (+12% YoY) genres led Q2'25 in IAP revenue growth (measured in both absolute and relative terms).
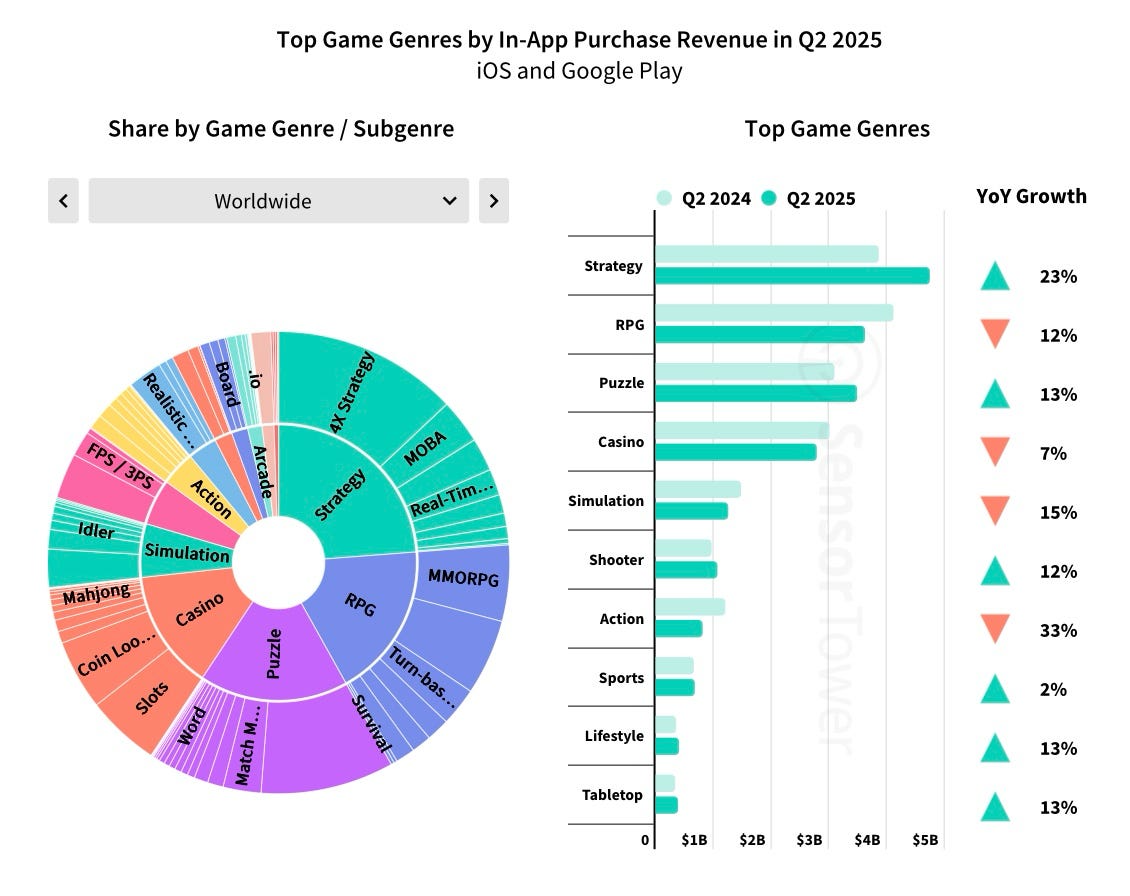
RPG declined by 12% in Q2'25 – if the trend continues, puzzle will move up to 2nd place in revenue. Other falling genres include casino (-7% YoY), simulation (-15% YoY), and action (-33% YoY).
In terms of downloads, every genre except strategy saw declines in Q2'25. Strategy downloads grew 5% YoY, largely due to the aggressive scaling of Kingshot.
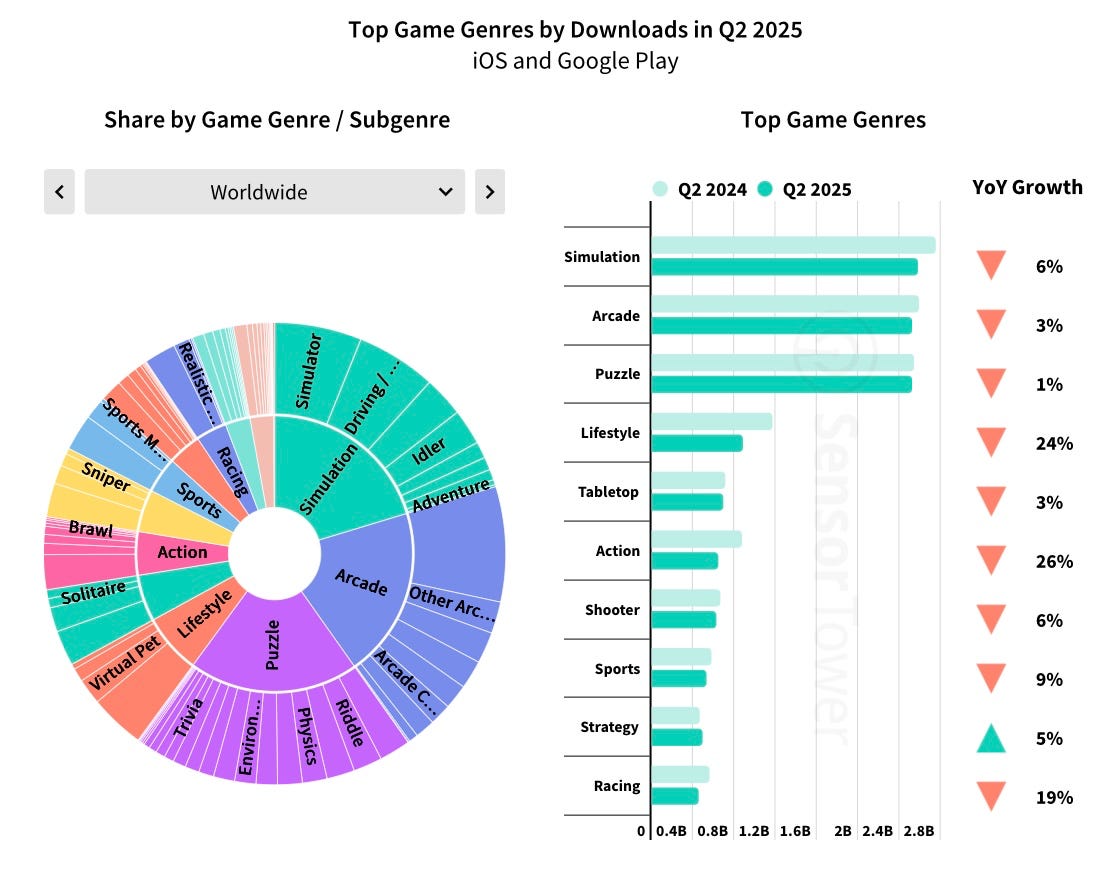
Last War: Survival, Royal Match, Whiteout Survival, MONOPOLY GO!, and Honor of Kings were the top revenue generators in Q2'25. No new titles appeared in the top 10.
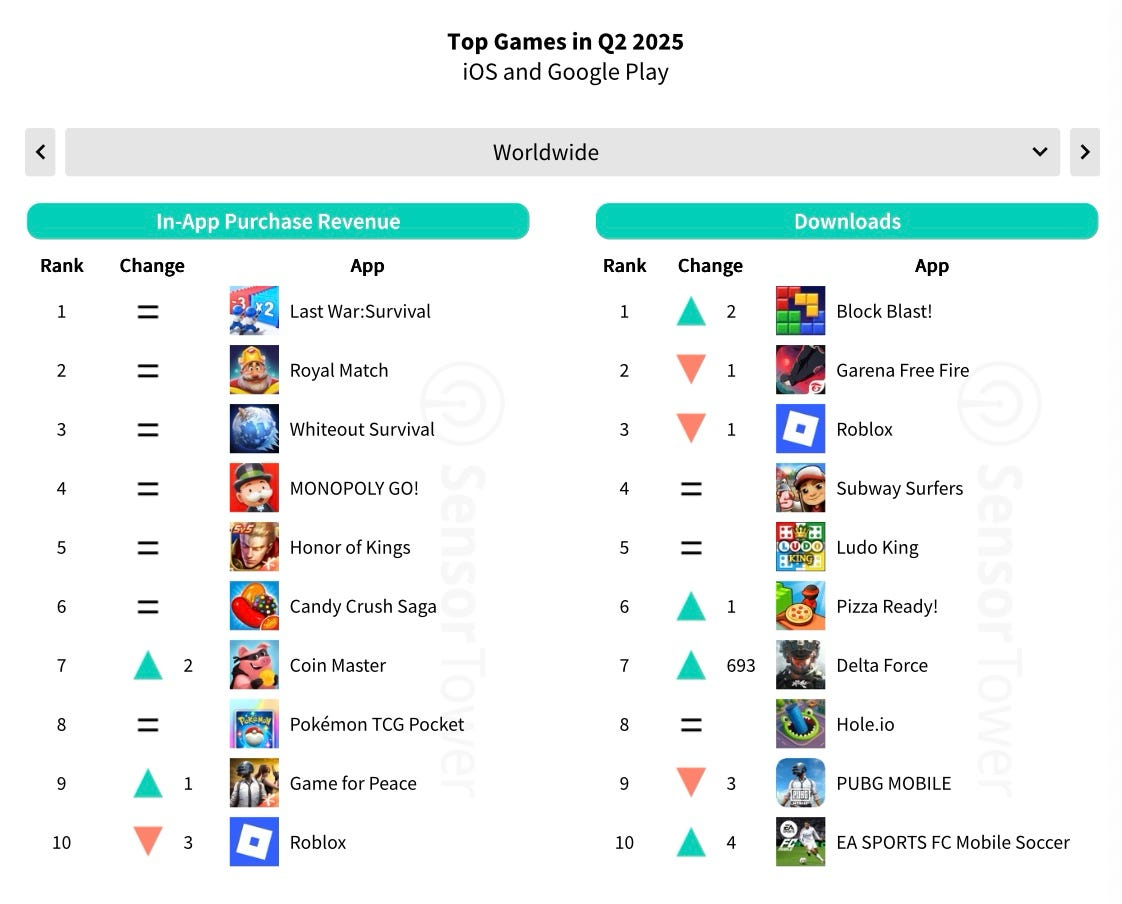
For downloads, note Delta Force, which climbed to 7th place. The top 5 were Block Blast!, Garena Free Fire, Roblox, Subway Surfers, and Ludo King.
The best projects in Q2'25 by revenue growth over the previous quarter were SD Gundam G Generation Eternal, Kingshot, and Seven Knights Re: BIRTH.
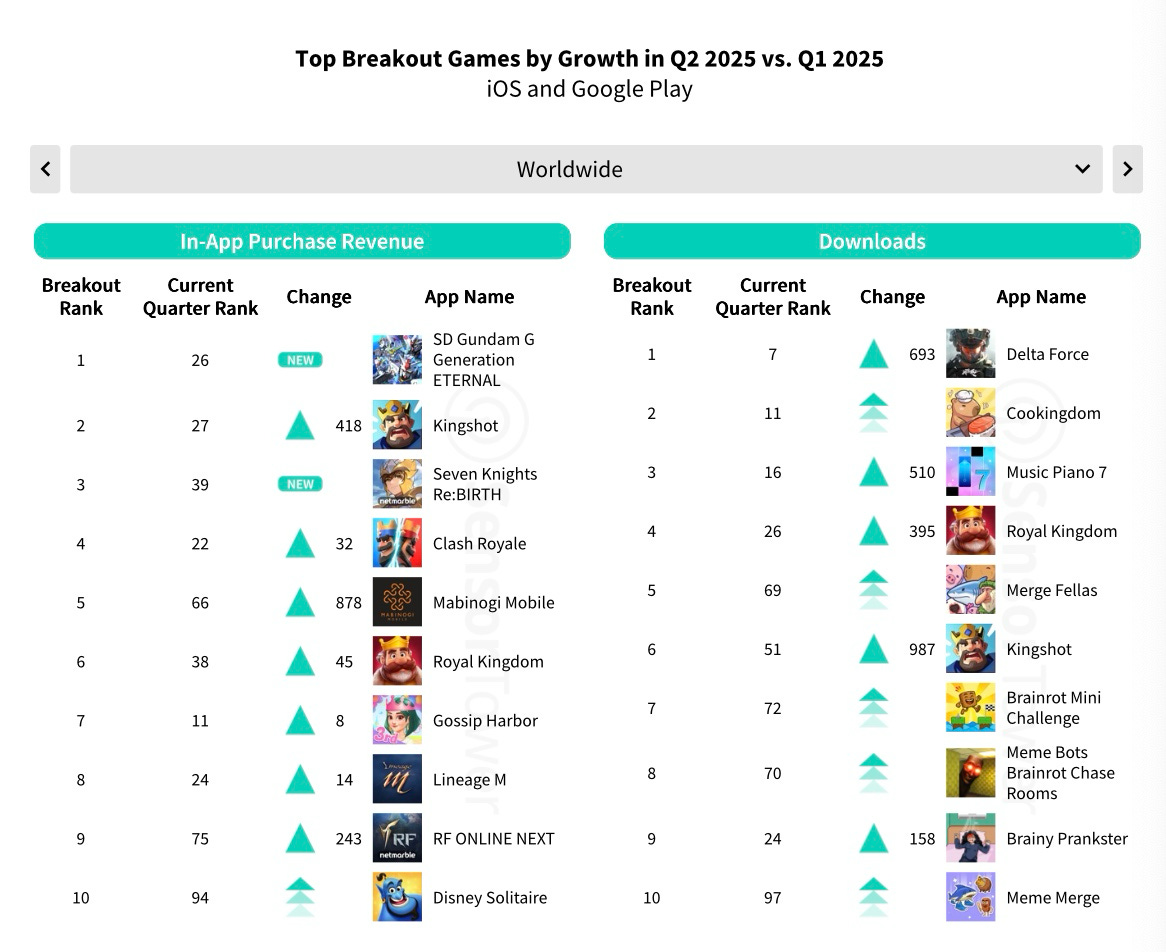
By download growth (Q2’25 vs Q1’25), Delta Force led, followed by Cookingdom and Music Piano 7.
GameDiscoverCo: Top Steam/Console Games in July 2025 by Revenue & Copies

Gross revenue is used. Don’t forget to subscribe to GameDiscoverCo!
Major Launches
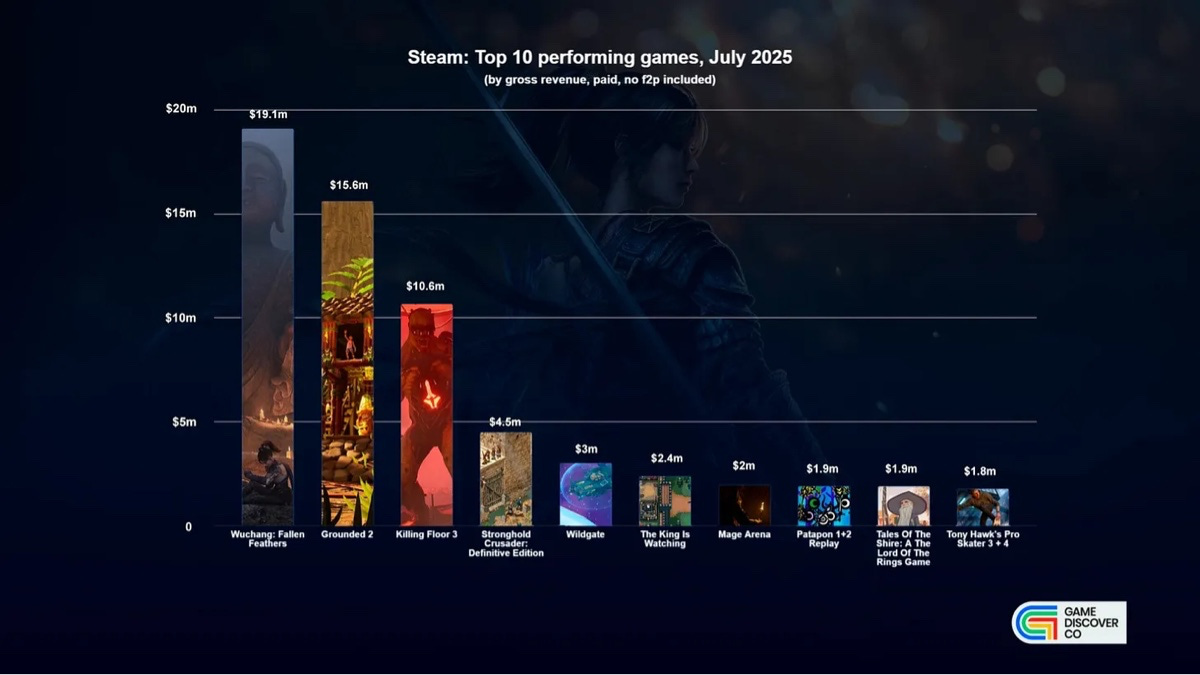
Wuchang: Fallen Feathers made $19.1M in July, which was the biggest launch of the month. But the game only has 50% positive reviews, which will likely affect future sales. 82% of buyers are from China.
Grounded 2 had a solid launch, too, with $15.6M earned. 66% of players also purchased the first game.
Killing Floor 3 also started quite well, with $10.6M in revenue. Still, Embracer already commented that the game "fell a bit short of expectations."
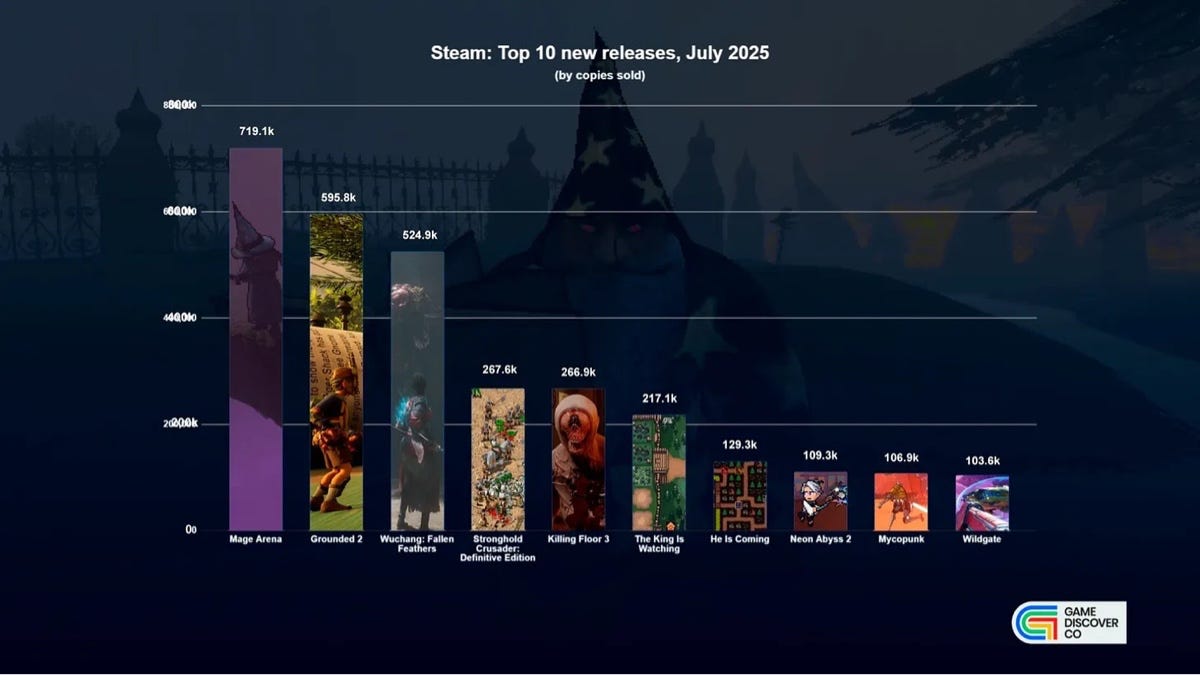
If we look at copies sold, July’s leader is Mage Arena. This is a team-based PvP game where the key feature is casting spells by voice. The idea resonated with players, and over 719,000 copies were sold. The game’s price is $2.99.
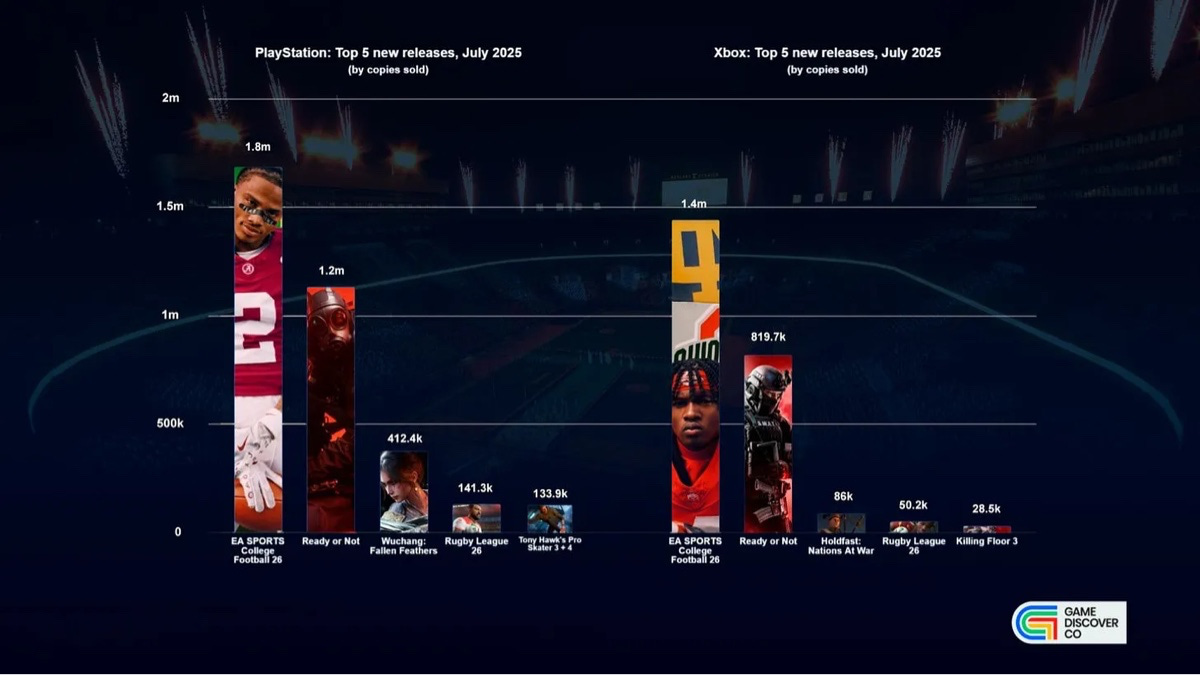
On consoles, the leaders by copies sold are EA Sports College Football 26 (1.8M on PlayStation and 1.4M on Xbox) and Ready or Not (1.2M on PlayStation and just over 800K on Xbox).
Wuchang: Fallen Feathers sold over 400,000 copies on PlayStation in July.
Steam top charts
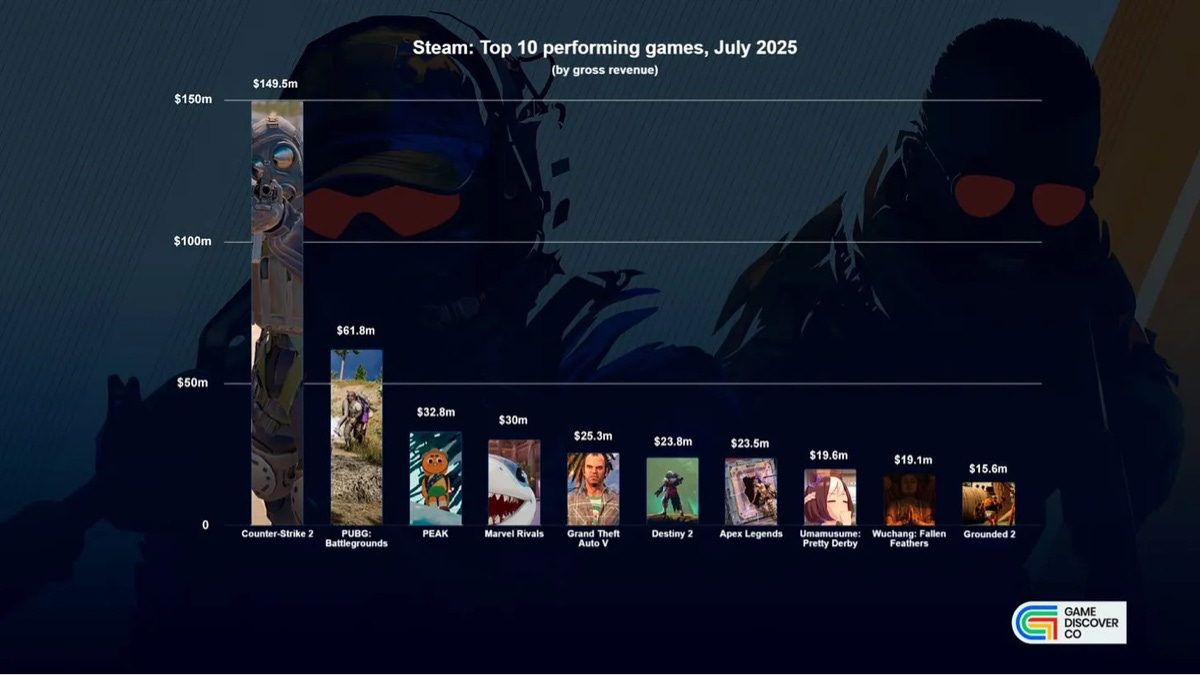
Looking at July revenue across all games, the leaders are Counter-Strike 2 ($149.5M), PUBG: Battlegrounds ($61.8M), and PEAK ($32.8M).
One unexpected entry in the top is Uma Musume: Pretty Derby, according to service estimates, it made $19.6M in July.