Weekly Gaming Reports Recap: August 12 - August 16 (2024)
Newzoo shared the global gaming markets for 2024 and until 2027; SocialPeta, together with Tenjin, covered the mobile marketing insights in H1'24; and Singular did the same, but for Q2'24.
Reports of the week:
Mistplay: The Influence of social factors on the mobile gaming audience
Amir Satvat: The situation with layoffs in the Gaming market is improving
Singular: Mobile Market Trends in Q2'24
Newzoo: Gaming Market in 2024 and beyond
GSD & GfK: The UK PC/Console Market Declined Slightly Again in July
Famitsu: Physical sales of console games in Japan in July 2024
SocialPeta & Tenjin: Mobile Marketing in H1'24
PlayStation 5 sold 4M units in the UK
Mistplay: The Influence of social factors on the mobile gaming audience
The data is based on a survey of 2,300 mobile gamers over the age of 18 in North America. The entire sample consists of the Mistplay audience, and the survey was conducted in June 2024.
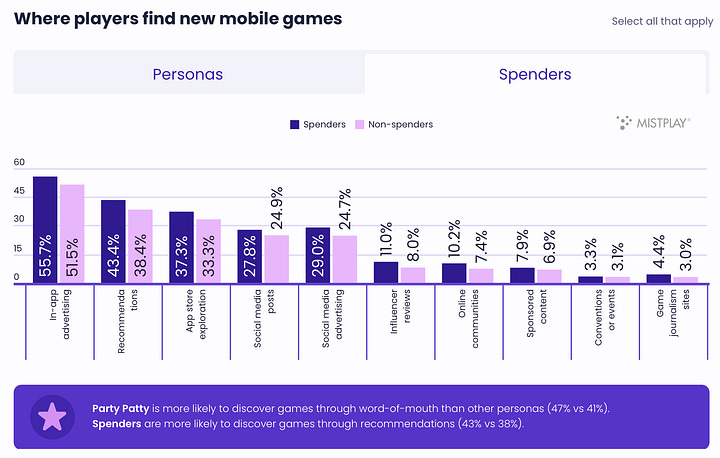
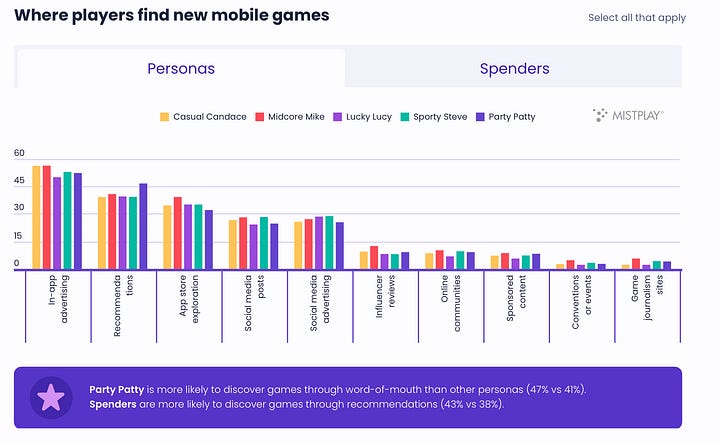
How people discover games
In-game ads (54%), recommendations from friends (41%), and searching in the App Store (36%) are the most popular ways to discover new games. 27% of people learn about games through social media.
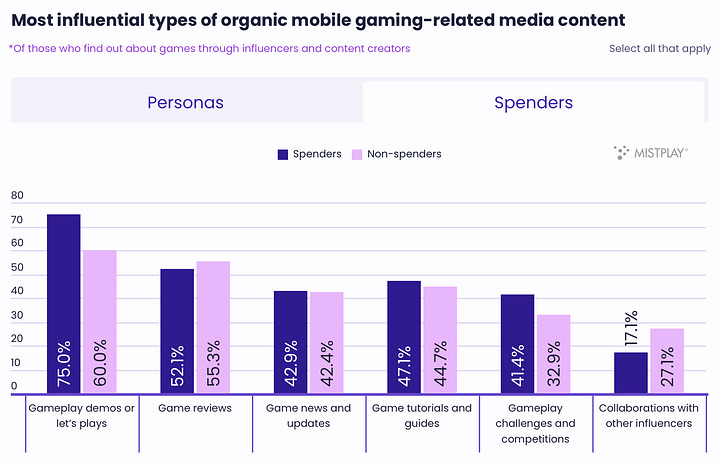
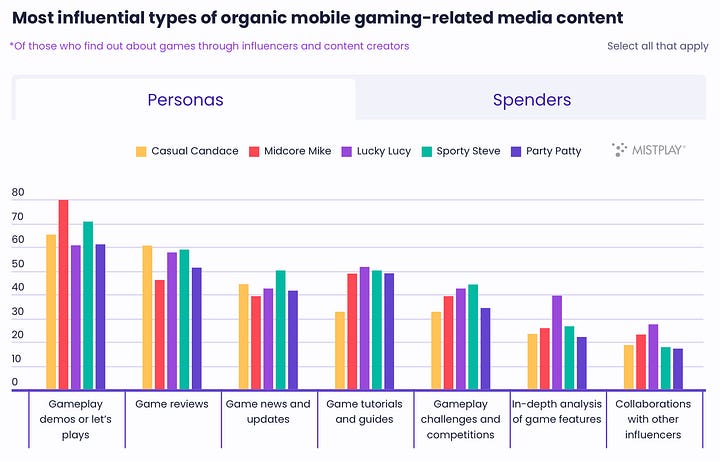
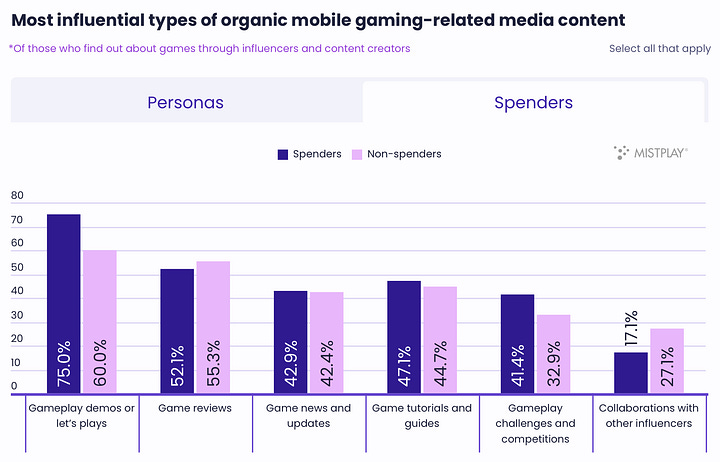
Gameplay videos, reviews, news, and game updates are the most popular types of gaming content among those who discover new games through influencers and social media.
What Influences a people’s decision before Installation
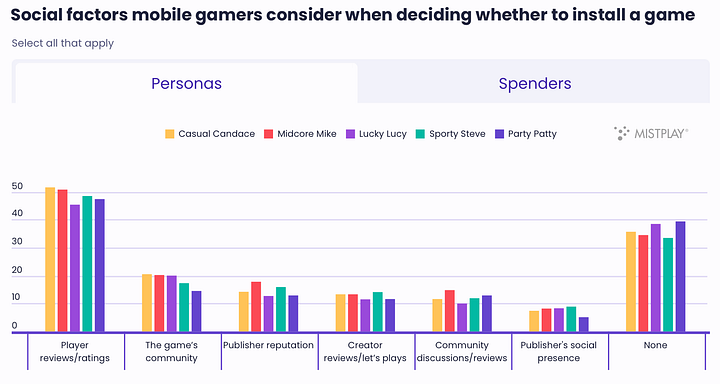
Half the users (exactly 50%) pay attention to ratings and reviews before installation. 24% of them consider these factors very important. 16% don’t care.
19% of users consider the community around a project before downloading. 36% don’t care about this at all.
Before downloading, the top three most important aspects for users are visuals, descriptions, and ratings.
Community and Engagement
23% of users actively participate in gaming communities. 44% take part passively; 33% do not participate at all.
The most popular platforms are Facebook (69%); YouTube (33%); Discord (28%); Instagram (21%).
53% of users use gaming communities to find information about the game. 22% follow related content creators. 18% interact with other gamers.
Consider subscribing to the GameDev Reports Premium tier to support the newsletter. Get access to the list of curated articles & archive of Gaming Reports that I’ve been collecting since 2020.
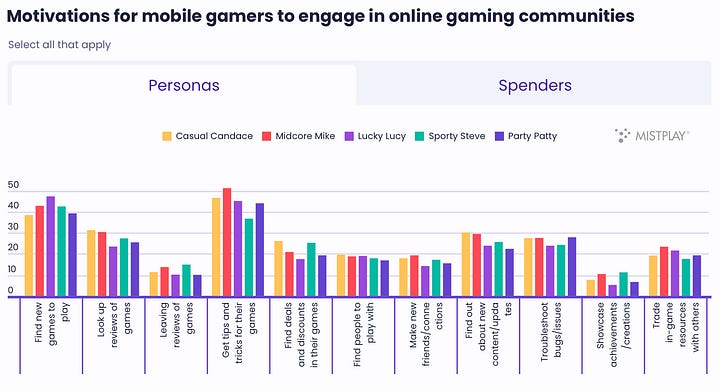
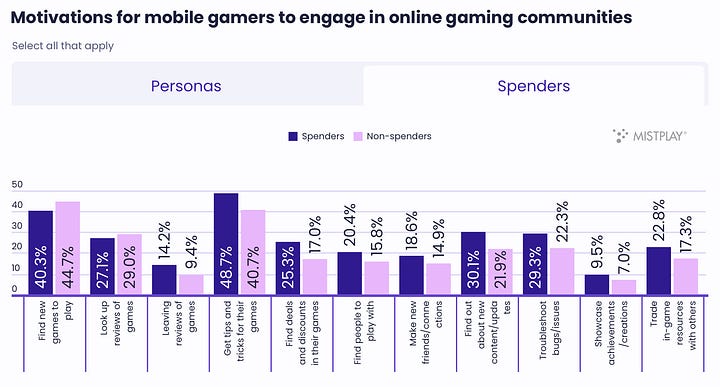
In communities, people search for tips (45%), new games (42%), read reviews (28%), try to solve problems (26%), and get news about the latest updates (26%).
People expect developers to share interesting tips and secrets in communities (55%); run giveaways (47%); share discounts (37%), and provide updates (32%). Only 6% are interested in UGC (user-generated content).
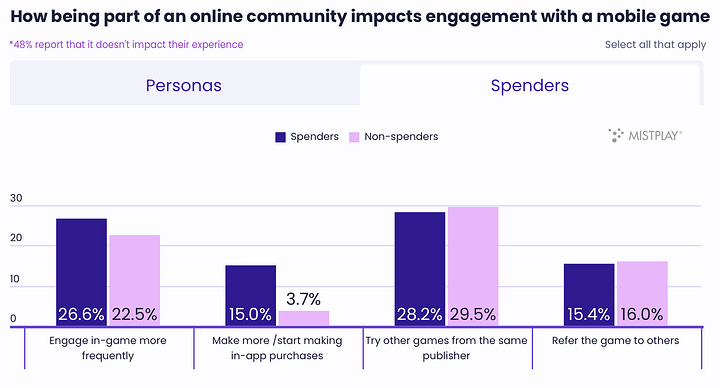
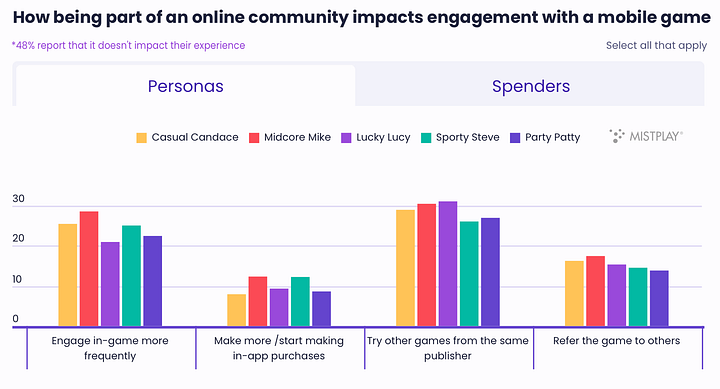
29% of users noted that they are likelier to try a game from the same publisher. 25% said they play a game more often if they are part of a community. And 15% of paying users mentioned that they spend more on in-app purchases (IAP) if they are part of a community.
Reviews and Support
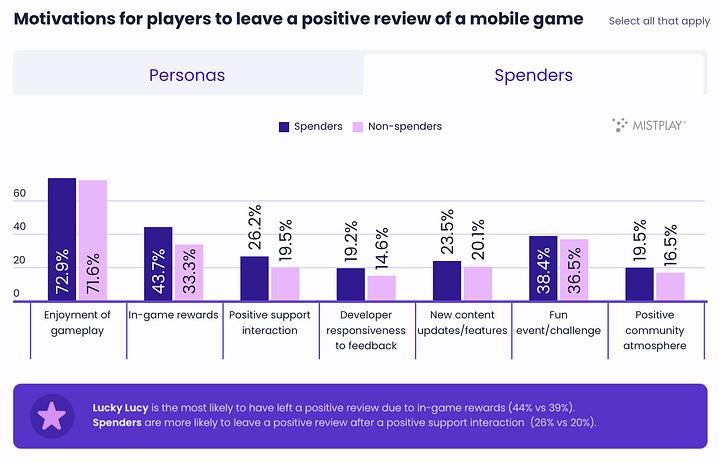
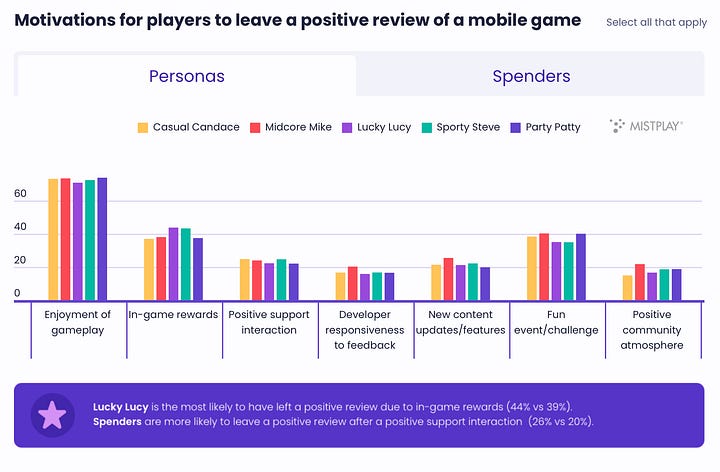
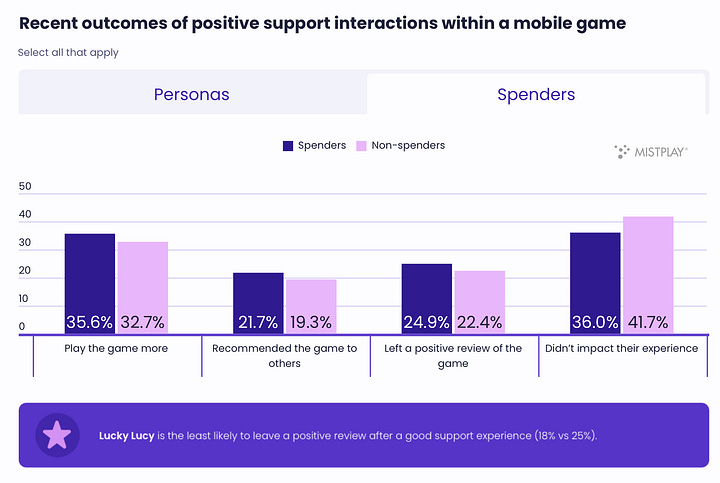
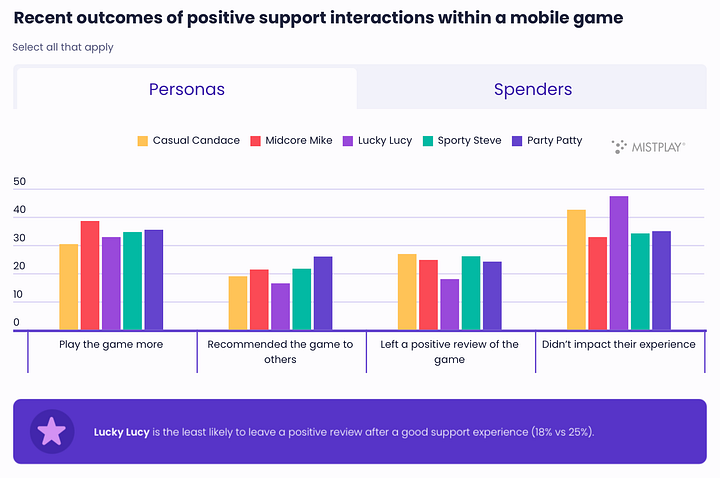
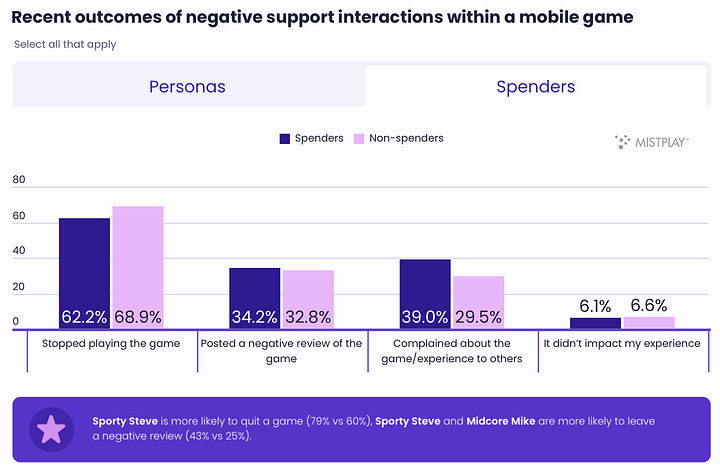
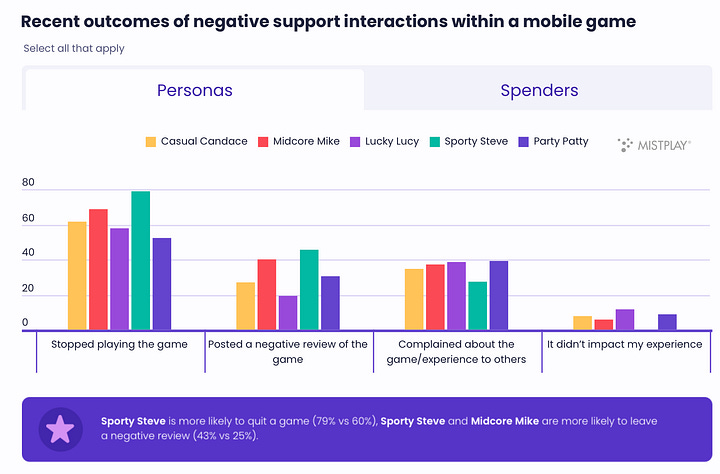
A good experience with customer support leads to people spending more time in the game (36%) and leaving positive reviews (25%). On the other hand, a negative experience drives users away from the game (62%), makes them complain to friends (39%), and leave negative reviews (34%).
❗️This example clearly shows that people are more likely to share negative experiences.
50% of mobile gamers who left a bad review did so due to technical issues. 47% - due to an abundance of ads or IAP. 36% because the game content didn’t meet their expectations.
Amir Satvat: The situation with layoffs in the Gaming market is improving
In his LinkedIn account, Amir reported forecasts for layoffs in 2024 have been lowered. In July, there were significantly fewer layoffs than expected.
The total number of layoffs in 2024 so far is 11,455. It is expected that another 2,687 people will lose their jobs by the end of the year. While this is a large number, the previous forecast was almost twice as high—4,463 people. In total, it is expected that 14,142 people will be forced to seek new employment in 2024.
In 2023, 10,137 people lost their jobs in the gaming industry. In 2022, the number was 8,098.
❗️Amir Satvat has been helping people find jobs for several years. His website offers all the necessary resources dedicated to finding new employment opportunities.
Singular: Mobile Market Trends in Q2'24
ATT Opt-in Rates
The number of users in the mobile market in Q2'24 who consented to the use of their personal data dropped to 13.85%. In the previous quarter, this figure was 18.9%.
The situation is better in games, where 18.58% of players agree to share their user data.
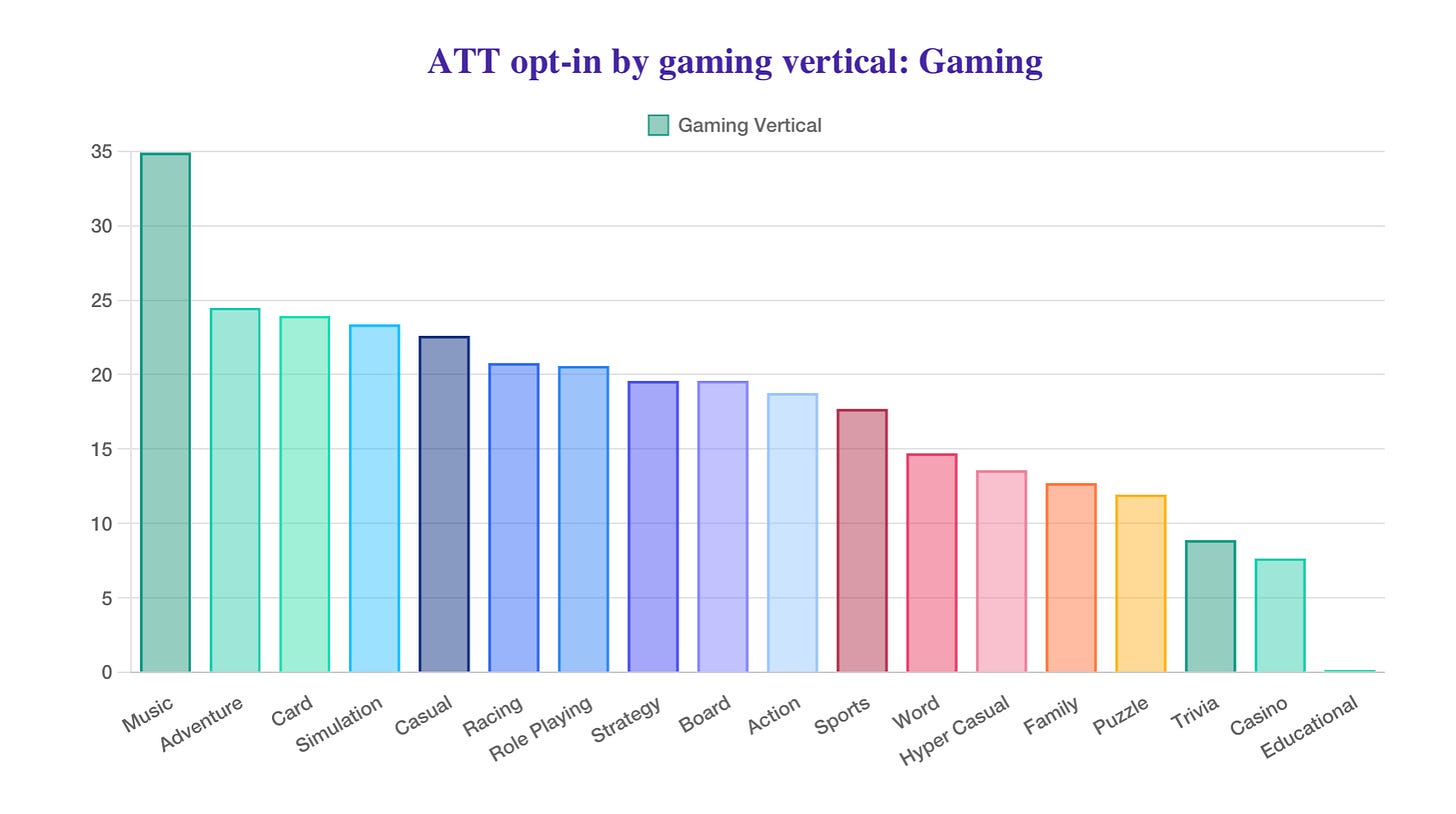
The best ATT opt-in rates are seen in music games (34.88%), adventure games (24.47%), and card games (23.92%). The lowest rates are in casino games (7.63%), trivia games (8.85%), and puzzles (11.92%).
CPI Benchmarks
Games on iOS:
CPI (Cost Per Install) - $2.9 (an increase of $0.16 QoQ)
CTR (Click-Through Rate) - 4.27% (an increase of 0.19 percentage points QoQ)
IPM (Installs Per Mile) - 0.78 (a decrease of 0.02 QoQ)
❗️IPM - Installs Per Mile, the number of installs per 1,000 impressions. The higher this metric, the better.
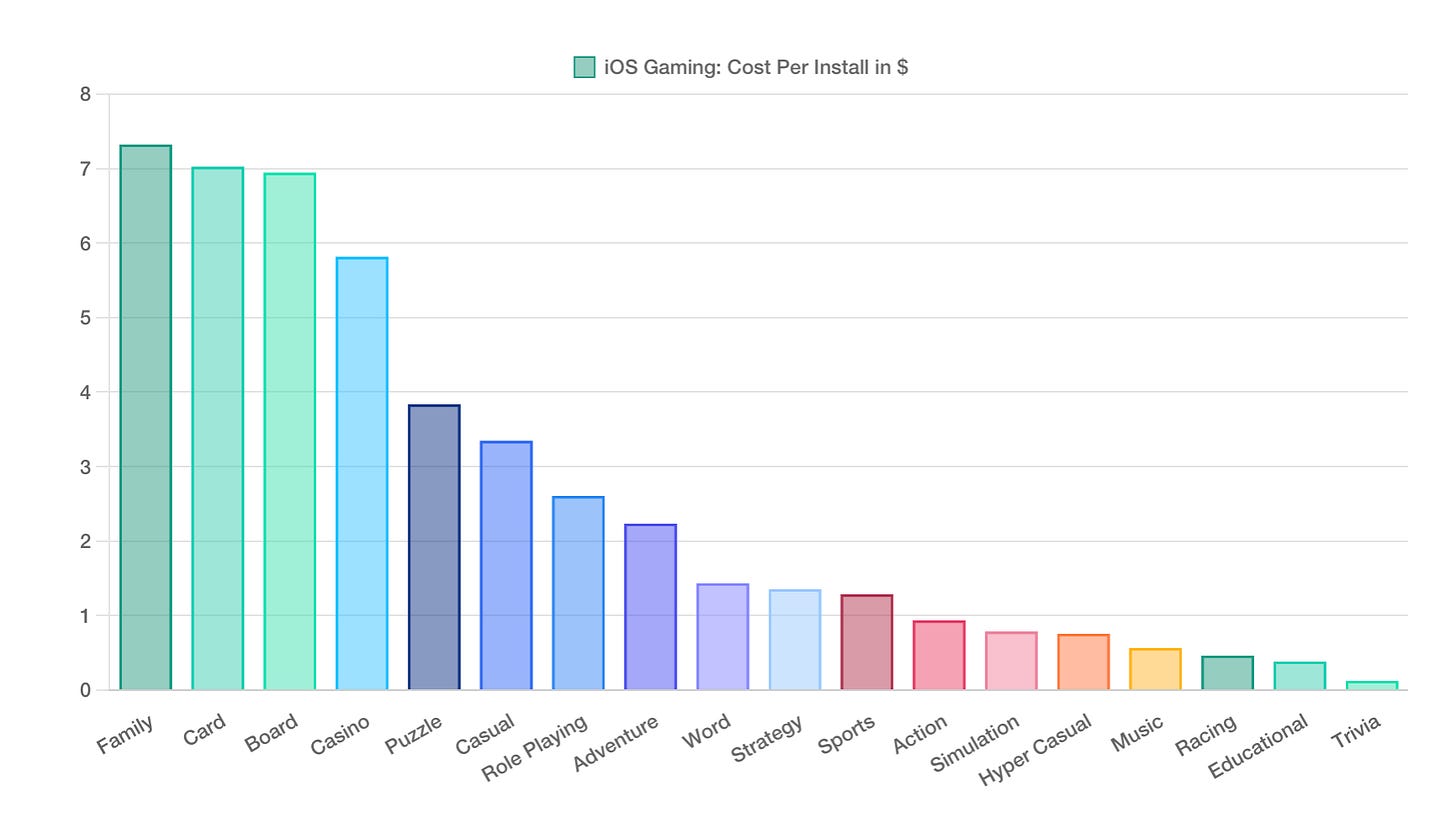
The most expensive CPI on iOS is seen in family games ($7.32), card games ($7.02), and board games ($6.94).
The cheapest CPI is in trivia games ($0.12), educational games ($0.38), and racing games ($0.46).
Games on Android:
GameDev Reports is a reader-supported publication. To receive new posts and support my work, consider becoming a free or paid subscriber.
Subscribed
CPI - $0.67 (a decrease of $0.07 QoQ)
CTR - 2.43% (an increase of 0.64 percentage points QoQ)
IPM - 4.58 (an increase of 0.29 QoQ)
Consider subscribing to the GameDev Reports Premium tier to support the newsletter. Get access to the list of curated articles & archive of Gaming Reports that I’ve been collecting since 2020.
The most expensive CPI on Android is in casino games ($5.36), card games ($3.58), and board games ($2.3).
The lowest CPI is in racing games ($0.05), trivia games ($0.1), and hyper-casual projects ($0.12).
Downloads - Genre Trends
iOS
Casual games on iOS accounted for 18% of all downloads in Q2'24 (up from 13% last quarter).
Casual games lead in the share of installs (18.3%), followed by hyper-casual projects (15.49%) and the simulation genre (11.28%).
Android
Casual games ranked first in downloads in Q2'24 (25.04%); second place went to hyper-casual projects (24.45%); third place to action games (8.81%).
Singular notes that the share of hyper-casual games in downloads has decreased. In Q4'23, they accounted for 36% of all installs, in Q1'24 - 21%, and in Q2'24 - 24%. Meanwhile, casual games are growing in downloads.
Key Marketing Metrics for Games
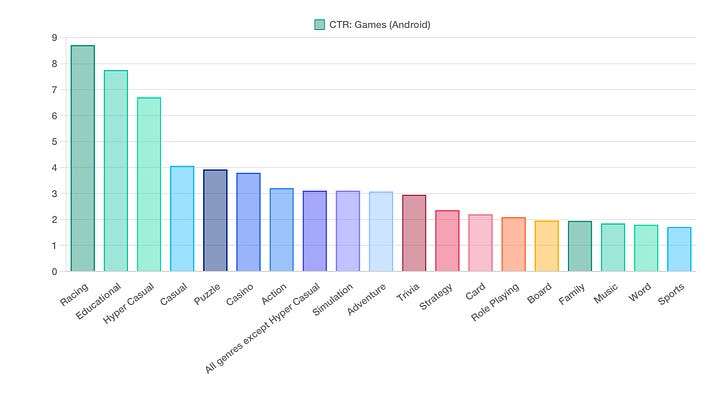
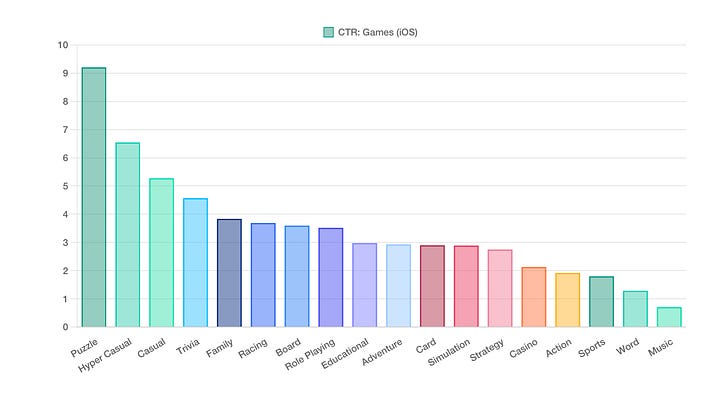
In Q2'24, CTR in games increased, while it decreased in non-gaming apps. The leaders in CTR on Android are racing games (8.71%), educational games (7.75%), and hyper-casual projects (6.7%). On iOS - puzzles (9.2%), hyper-casual games (6.54%), and casual projects (5.27%).
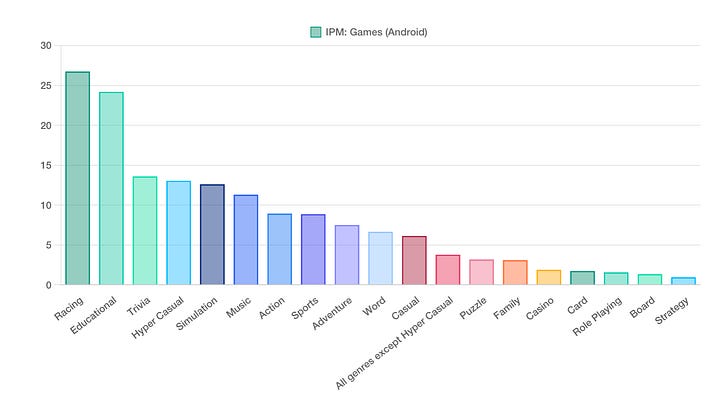
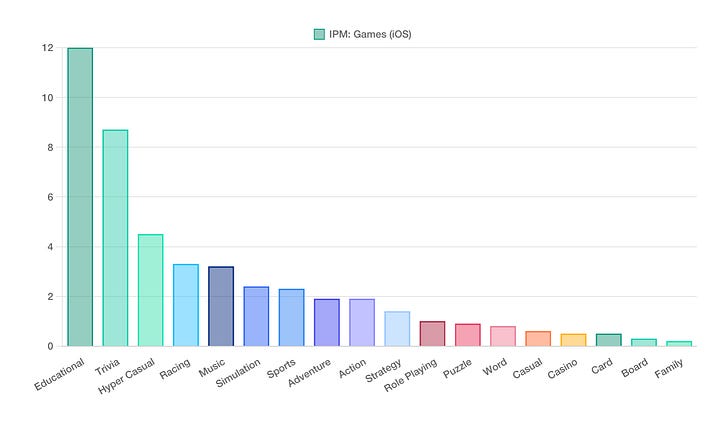
IPM in games on Android is highest in racing games (26.71), educational games (24.17), and trivia games (13.56). On iOS, it's highest in educational games (12), trivia projects (8.7), and hyper-casual projects (4.5).
Advertising Spend
In Q2'24, iOS accounted for 38.74% of all ad spend (down from 39.97% in Q1'24); Android accounted for 37.91% (up from 36.36% in Q1'24); and Web accounted for 23.36% (a slight decrease from 23.43% in Q1'24).
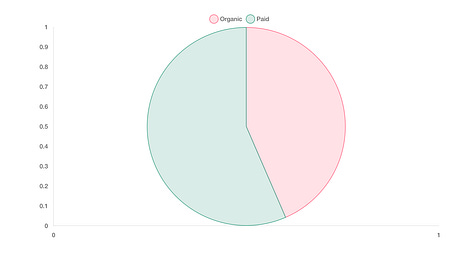
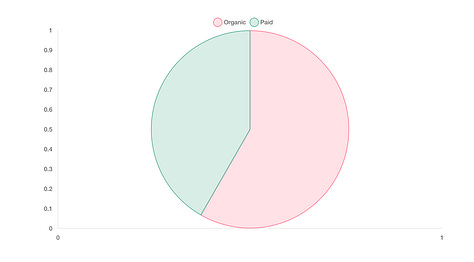
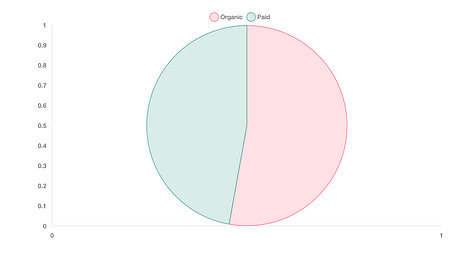
According to Singular, 52.84% of traffic in Q2'24 was organic; 47.16% was paid. On Android, there is more organic traffic (58.3%); on iOS, there is less (43.5%).
Newzoo: Gaming Market in 2024 and beyond
Revenue
Newzoo estimates that the gaming industry's total revenue for 2024 will reach $187.7И, growing by 2.1% YoY. The PC segment will grow by 4% YoY to $43.2B (23% of the market); the mobile segment will see a growth of 3% YoY to $92.6B (49% of the market); while the console segment will decrease by 1% YoY to $51.9B (28% of the market).
Newzoo forecasts that by 2027, the gaming market will reach a revenue of $213.3B. The average annual growth rate from 2022 to 2027 will be 3.1%. It is expected that the PC market will grow steadily, and the console market, after a decline this year, will return to dynamic growth.
Shooters are the largest genre in terms of revenue on PC - its volume in 2024 will be $7.4B (17% of the total segment revenue; +9.6% YoY). However, Newzoo does not include Battle Royale in this category. The second place goes to adventure games (13% of the total segment revenue; $5.8B in revenue; +21.2% YoY).
The situation is similar on consoles. Shooters account for 16% of total revenue ($8.1B; +6% YoY). Adventure games account for 15% of total revenue ($7.7B; -13.6% YoY).
Gaming Audience
The number of players in 2024 will reach 3.422B (+4.5% YoY). The highest growth is in the PC segment (+3.9% YoY - up to 900M players); followed by mobile (+3.5% YoY - up to 2.85B); the console segment has the lowest growth (+2.3% YoY). The increase in the number of players is largely due to developing markets.
53% of players in 2024 will be in the Asia-Pacific region (1.809B; +4% YoY). Next are the MENA region (559M; +8.2% YoY); Europe (454M; +2.4% YoY); Latin America (355M; +5.6% YoY); North America (244M; +2.9% YoY).
Newzoo forecasts that by 2027, the number of players worldwide will grow to 3.759 billion.
Consider subscribing to the GameDev Reports Premium tier to support the newsletter. Get access to the list of curated articles & archive of Gaming Reports that I’ve been collecting since 2020.
Trends
Cross-platform play. Releasing games on different platforms benefits PCs the most. Both PlayStation and Xbox consider PCs a "neutral" platform where they can release their games.
Developers are reducing the scale of their projects to lower development costs and meet the needs of the modern market.
The mobile ecosystem is starting to open up. The European DMA lays the foundation for diverse stores and payment methods on iOS and Android. However, real results will be seen in a few years.
The importance of community management is growing.
The future of F2P games on PC and consoles is uncertain. New games are struggling to capture an audience, while older projects are growing.
Almost all popular AAA games in recent years are based on established gaming IPs or major franchises. Success in the PC and console market is coming to indie developers and AA-level projects. These projects require fewer resources, and creators can experiment more as they are not under the pressure of large budgets.
Gen-AI continues to penetrate development more deeply. However, there are still few real use cases, and it is evident that the technology needs time to develop.
The preferences of young players are changing. For generations Alpha and Z, UGC (User-Generated Content) is becoming increasingly important.
GSD & GfK: The UK PC/Console Market Declined Slightly Again in July
Game Sales
2.35 million games for PC and consoles were sold in the UK in July, which is 2.9% less than in July last year.
The top 6 games in the top 10 were all released before 2024.
EA Sports College Football 25 debuted in 7th place. The situation is interesting because American football is mostly popular in the US. The game's sales in the UK during the first two weeks were double those of Madden NFL 24 for the same period.
EA Sports FC 24 was the top seller in July, with sales 46% higher than FIFA 23 in July last year, influenced by the UEFA EURO 2024 tournament.
Sales of Final Fantasy 14: A Realm Reborn surged significantly with the release of the Dawntrail expansion.
Hardware Sales
77,000 consoles were sold in the UK in July, which is 30% less than in July 2023 and 22% less than in June 2024.
PlayStation 5 sales dropped by 31% MoM, but it still maintained the top spot in sales. Nintendo Switch sales grew by 9% compared to the previous month, while Xbox Series S|X saw a 19% decline compared to June figures.
PlayStation 5 has surpassed 4 million units sold in the UK, trailing the PS4 by 31 weeks.
540,000 accessories were sold in July 2024, which is 4% less than last year and 17% less than the previous month.
PlayStation Portal is the top-earning accessory in the UK market.
Famitsu: Physical sales of console games in Japan in July 2024
Famitsu only tracks physical copy sales.
Game Sales
Powerful Pro Baseball 2024-2025 by Konami was the top-selling game in Japan in July. The game sold 260,000 physical copies within the first two weeks after launch. The previous game in the series (eBaseball Powerful Pro Baseball 2022) sold 202,000 copies in the same period.
In second place was Luigi's Mansion 2 HD (71,000 copies); in fourth place was Mario Kart 8 (37,000 copies); in fifth place was Nintendo World Championships: NES Edition (36,000 copies).
Nintendo accounted for 33.5% of all physical game sales in the country in July. In money terms, this amounts to ¥2.4 billion ($16.3 million). Konami was in second place with 29% of the physical market (¥2 billion - $13.6 million).
Nintendo Switch accounted for 84% of all physical game sales.
Hardware Sales
The Nintendo Switch was the best-selling console on the Japanese market, with 229,300 units sold in July.
The PlayStation 5 sold 125,000 units in July; the Xbox Series S|X sold 13,700 units.
SocialPeta & Tenjin: Mobile Marketing in H1'24
Market Trends
In the first half of 2024, the number of advertisers in the mobile market increased by 33.7% to 56.6 thousand. The average number of creatives per advertiser decreased by 22.8% to 105.
The mobile gaming market is in decline when it comes to marketing activity. The percentage of advertisers with new creatives in the first half of 2024 dropped by 5.8% to 65.1%. However, the share of new creatives per month increased by 2.4% to 51.4%.
The highest number of gaming advertisers is in Western Europe (31.6 thousand), the USA (26 thousand), and Southeast Asia (22.8 thousand). The highest number of creatives per advertiser is in the markets of Hong Kong, Macau, and Taiwan (104), Oceania (102), and the USA (101).
The largest number of advertisers is in casual games (28.59% of the total), puzzles (13.87%), and simulation games (9.32%). In terms of the share of creatives, casual games lead (32.43% of the total), followed by puzzles (12.14%) and RPGs (11.64%).
71.4% of all advertisers are on Android; 28.6% are on iOS. However, in some genres, iOS either surpasses or is equal to Android, such as adventure games (53% of advertisers are on iOS), sports games (49.5%), and card games (47.5%).
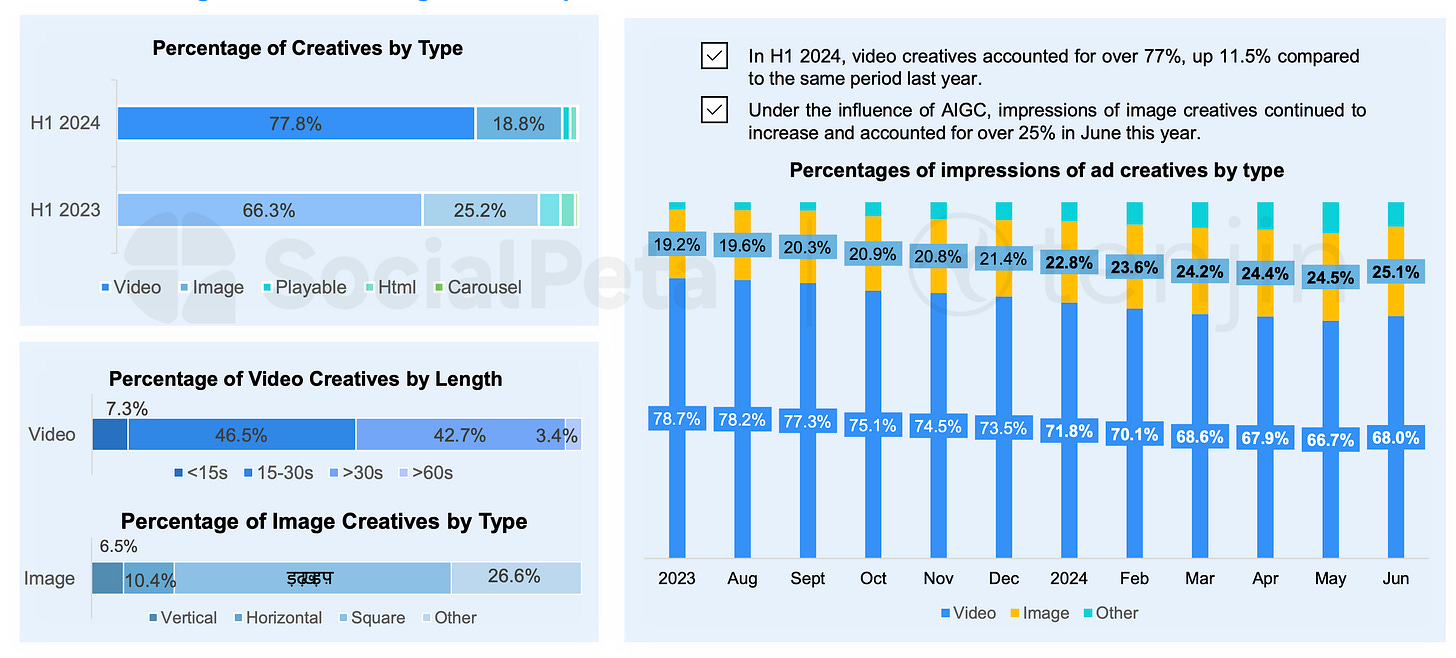
77.8% of creatives in the first half of 2024 were videos. 18.8% were images. Despite the growth in the share of video, views of static ads actually increased in the first half of 2024.
❗️SocialPeta is connecting the increased impressions of image creatives with AI-generated creatives.
Advertising Leaders
The most creatives in H1'24 on Android came from Jewel Abyss, Tycoon Casino Vegas Slot Games, and Block Blast!. On iOS, the leaders were MONOPOLY GO!, Legend of Mushroom, and Hero Clash Battle (マジックカード).
Consider subscribing to the GameDev Reports Premium tier to support the newsletter. Get access to the list of curated articles & archive of Gaming Reports that I’ve been collecting since 2020.
Rollic Games, Bingchuan Network, and Yotta Games were the most effective companies in the advertising market, producing the most creatives. Among the top 20, there were 10 companies from China, 2 from the USA, 2 from France, 2 from Cyprus, and one each from Turkey, Singapore, Israel, and Switzerland.
Marketing Spend Trends
According to Tenjin, 60% of budgets in H1'24 went to Android, and 40% to iOS.
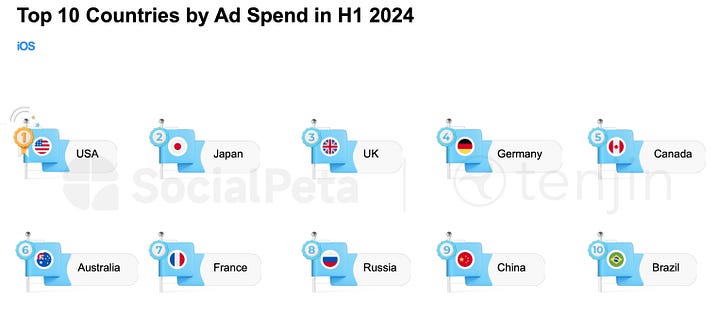
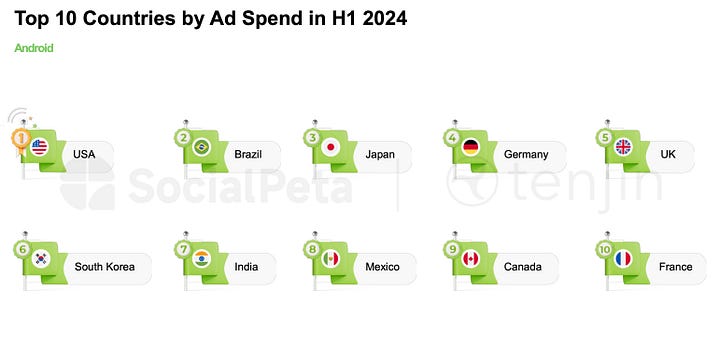
The USA, Brazil, and Japan were the leaders in spending on Android. On iOS, the leaders were the USA, Japan, and the UK.
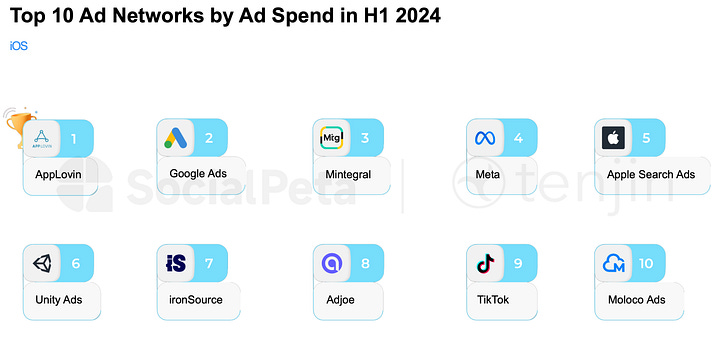
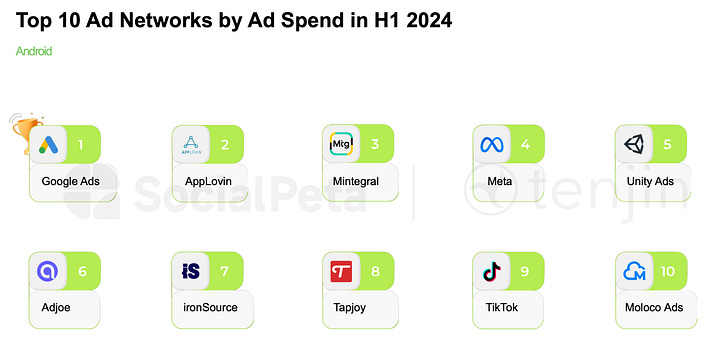
Google Ads, AppLovin, and Mintegral were the leaders in spending on Android. On iOS, the same leaders were present, but in a slightly different order: AppLovin, Google Ads, and Mintegral.
Interesting Marketing Trends in H1'24
SocialPeta and Adjust note that the approach to marketing differs between East and West. In the East, there is more investment in advertising before the project launch, while in the West, the focus shifts toward a calmer launch with subsequent support.
The number of AI-generated creatives is growing significantly, especially among RPG and strategy games. In H2'23, the share of AI-generated creatives in strategy games on Android was 25%; by H1'24, this percentage had risen to 44%.


