Weekly Gaming Reports Recap: February 17 - February 21 (2025)
EGS 2024 results; marketers survey by Liftoff, and other numbers of the week.
Reports of the week:
GameAnalytics: Mobile gaming benchmarks in 2025
Games & Numbers (February 5 - February 18, 2025)
Liftoff: Mobile App marketers survey - 2024 results & 2025 forecast
Epic Games Store: 2024 in Numbers
GameAnalytics: Mobile gaming benchmarks in 2025
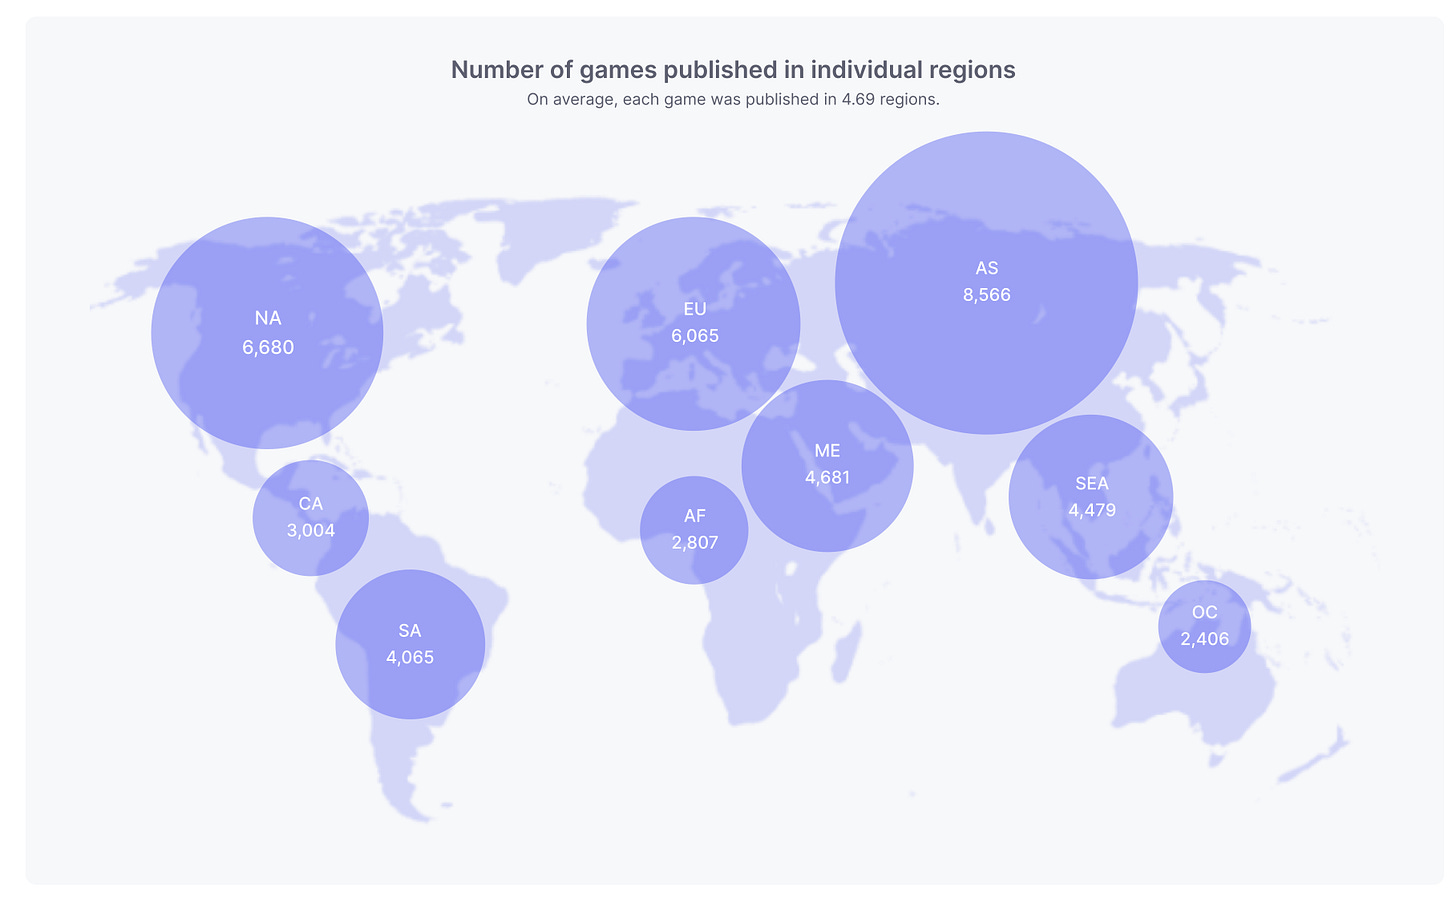
The report is based on data from 11,600 gaming applications across 9 regions on 2 platforms (iOS and Android) in 16 different genres. The MAU of all projects used for the report exceeds 1.48 billion.
Retention Benchmarks
❗️The report uses classic, not Rolling Retention.
By the end of 2024, the average D1 Retention for the top 25% of games ranges from 26.48% to 27.69%. This is worse than the 2023 results (28-29%). For the least successful 25% of projects, D1 Retention is at 10-11.5%.
On iOS, the top 25% of projects have a higher average D1 Retention - 31-33% compared to 25-27% on Android.
The median D7 Retention across all projects ranges from 3.42% to 3.94%. This is, again, lower than the 2023 results (4-5%). For the top 25% of projects, this indicator is at 7-8%, while for the weakest 25% of projects, it barely reaches 1.5%.
75% of projects have a D28 Retention lower than 3%.
Playtime Benchmarks
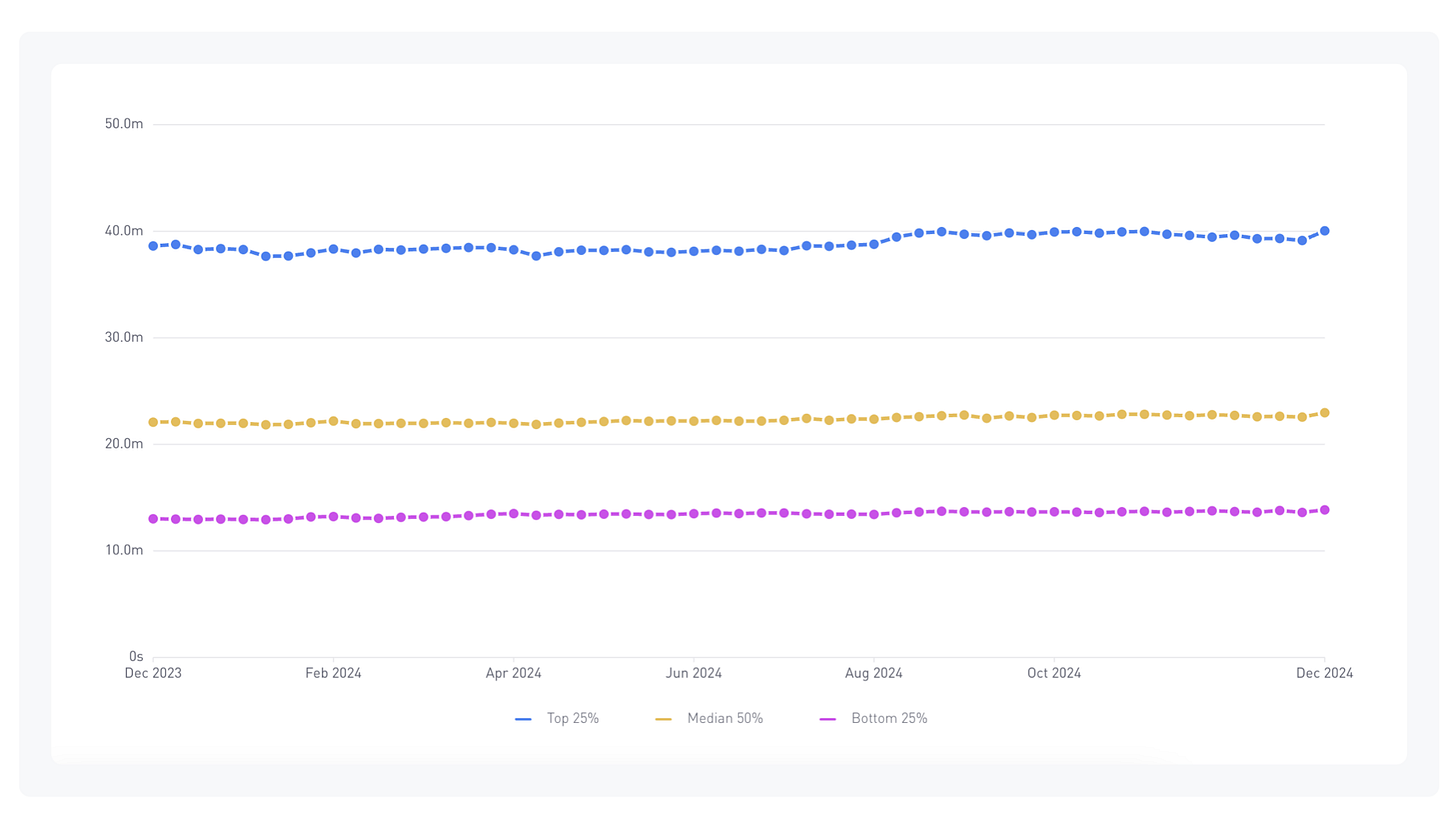
The median daily playtime across all games in 2024 is 22 minutes. However, for the top 2% of projects, this figure can reach 4 hours.
Projects like Roblox contribute significantly to the overall playtime. The Guardian notes that Australian children aged 4 to 18 spent an average of 137 minutes per day on Roblox.
Consider subscribing to the GameDev Reports Premium tier to support the newsletter. Get access to the list of curated articles & archive of Gaming Reports that I’ve been collecting since 2020.
Session Length Benchmarks
In 2024, the average session length for the top 25% of projects in the market was 8-9 minutes. The median is 5-6 minutes.
Session Count Benchmarks
On average, a player has 4 sessions per day. Android players have more sessions than iOS users - the opposite of the Retention figures.
Midcore projects have the highest number of sessions per day - 6-7.
Regional retention benchmarks
The highest average D1-D7-D28 Retention indicators are in the Middle East - 22.64%, 4.91%, and 1.49%, respectively. Europe and Oceania also show good figures.
User retention is worst in Africa and Asia.
Regional playtime benchmarks
The highest average playtime - contrary to the Retention figures - is in Africa, at 26.85 minutes. The situation is worst in Asia - from 21-22 minutes.
Regional session length benchmarks
The longest average session length is in Oceania - 6.85 minutes. The lowest are in Africa and Asia (around 5 minutes).
Regional session count benchmarks
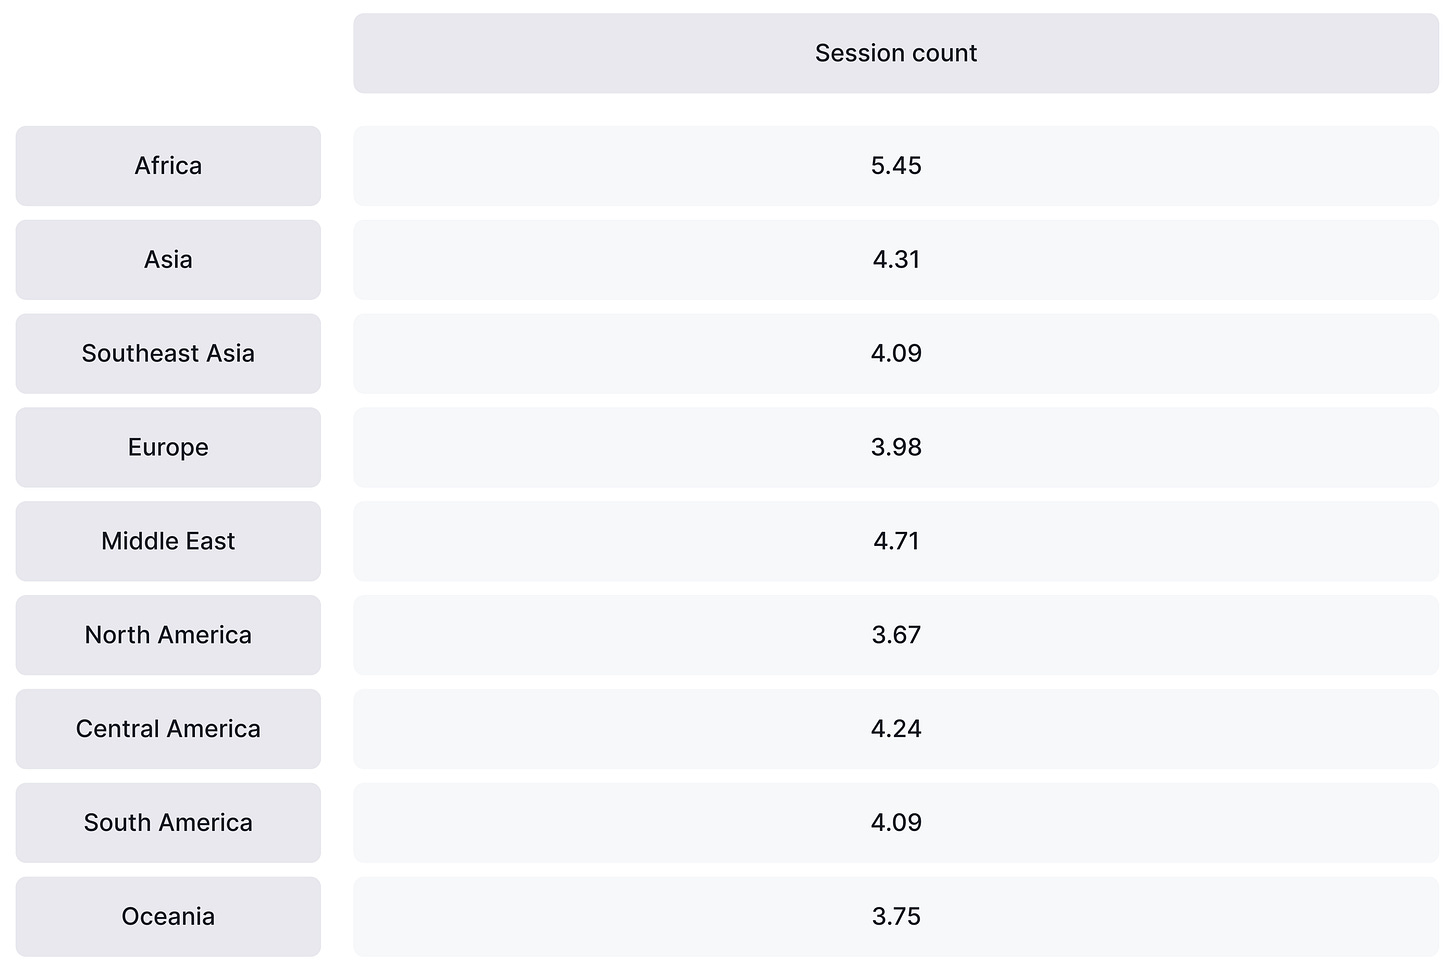
The highest number of sessions is in Africa (5.45 per day) and in Middle Eastern countries (4.71 per day). The lowest is in North America (3.67 sessions per day).
Genre Benchmarks
Arcade games lead among genres in short-term (D1 Retention) retention. However, they have problems with long-term retention.
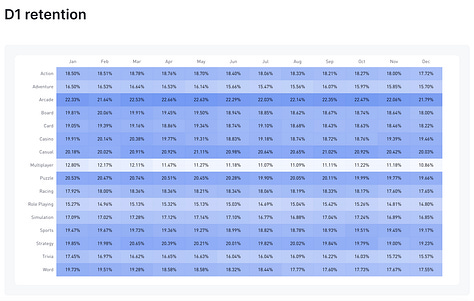
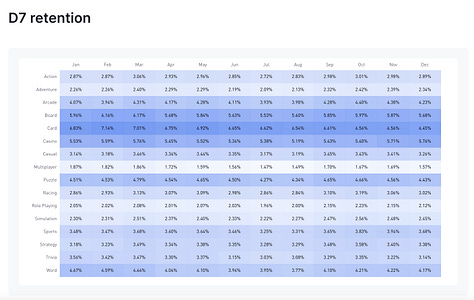
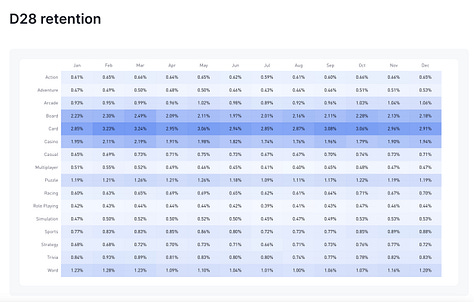
The best genres for medium and long-term retention are board games, card games, puzzles, and casino games.
Interestingly, multiplayer projects are leaders only in session length. But they are far from the leading genres in both overall playtime and number of sessions.


Games & Numbers (February 5 - February 18, 2025)
PC/Console Games
Grand Theft Auto V has been purchased 210 million times. Red Dead Redemption II sales stand at 70 million copies. These figures were shared by Take-Two in their latest report.
Phasmophobia has sold over 2 million copies on consoles. The game's total sales have surpassed 22 million copies.
One Piece Pirate Warriors 4 has been bought 4 million times.
Farming Simulator 25 continues to harvest success effectively - the game has already sold over 3 million copies. In total, games in the series have been purchased more than 40 million times.
Consider subscribing to the GameDev Reports Premium tier to support the newsletter. Get access to the list of curated articles & archive of Gaming Reports that I’ve been collecting since 2020.
Kingdom Come Deliverance II sold 2 million copies in less than 2 weeks. The studio called the release a "triumph". The first million copies were sold in less than 24 hours.
Alan Wake II sales have exceeded 2 million copies. The project has fully recouped its costs, and the studio has finally started profiting from it.
Dynasty Warriors: Origins has sold 1 million copies. The game's demo version has been downloaded by over 2 million people.
A Game About Digging A Hole, where players (guess what?) dig a hole in their garden plot, has been purchased more than 250,000 times in a week. Gameplay videos are garnering millions of views on social media (particularly on TikTok).
Mobile Games
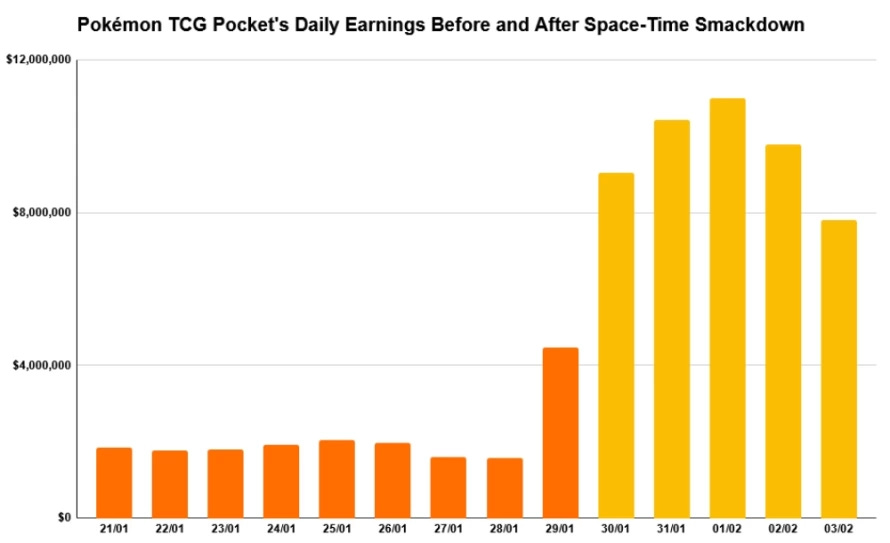
Pokemon Trading Card revenue has exceeded $500 million. The game is only 22 days behind Pokemon GO in terms of speed to reach this milestone (97 days vs 75). While new updates are receiving mixed reactions from the audience, they are significantly boosting revenue.
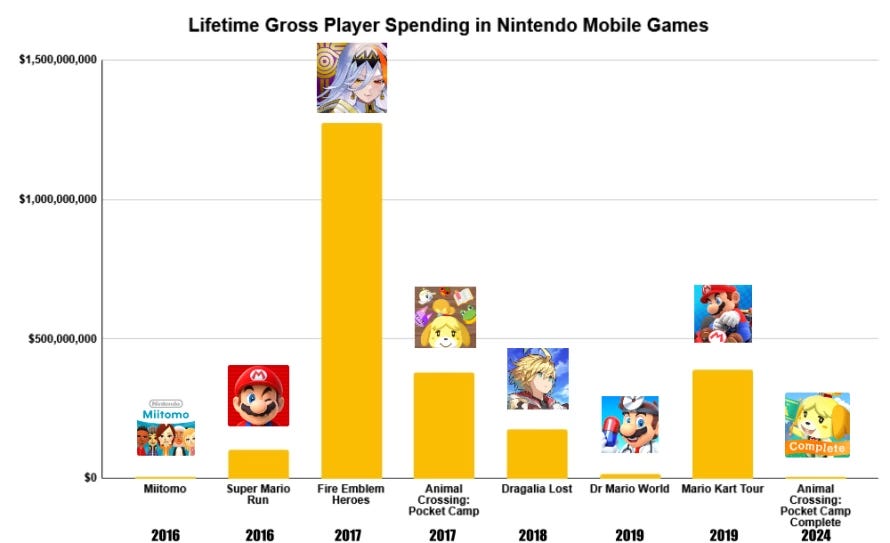
Fire Emblem Heroes - Nintendo's most successful mobile game - has earned $1.3 billion over 8 years.
War Robots has earned over $1 billion across all platforms since its release. 94% of all revenue came from mobile devices.
Capybara Go has surpassed the $100 million revenue mark. It took the game 5 months to achieve this.
Users have spent over $50 million in Royal Kingdom by Dream Games, according to AppMagic. This figure includes money earned during the soft launch period.
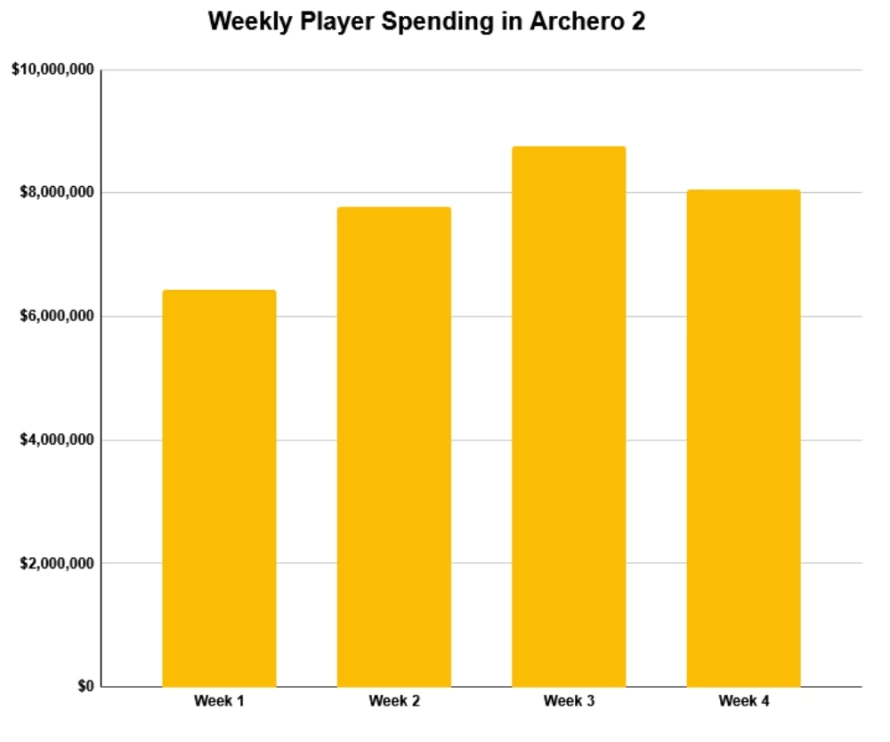
In the first month after release, Archero II earned $32.8 million from IAPs. This is before taxes and commissions.
Gaming Systems
PlayStation 5 has been purchased more than 75 million times - this was officially announced by Sony.
Liftoff: Mobile App marketers survey - 2024 results & 2025 forecast
The Liftoff report uses figures provided by AppsFlyer and Sensor Tower.
Over 700 marketers from different regions participated in the Liftoff survey.
48% of respondents are from the gaming industry, and 52% are from non-gaming segments.
Liftoff surveyed companies of different sizes - 24% of respondents operate marketing budgets of more than $1 million monthly. 63% have a budget less than this amount.
Overall market conditions
According to AppsFlyer, app downloads increased by 7% in 2024. Non-gaming app downloads grew by 12%. Time spent by users in apps either increased or remained unchanged.
According to Sensor Tower, people spent 4.2 trillion hours in apps in 2024. Most of the growth comes from non-gaming apps.
The increase in time spent by users in apps leads to an increase in spending on them. Again, this mainly applies to non-gaming apps.
The USA, China, Germany, and the UK are the main beneficiaries of the growth in user spending on non-gaming apps.
The situation in the gaming market is not as rosy. After explosive growth in 2020-2021, downloads declined in 2024.
IAP revenue in games decreased by 1% in the gaming market. Casino games showed growth, while casual and midcore projects were in the negative zone.
Survey results - Industry in 2024 vs 2023
About 80% of respondents believe that the state of the mobile market is either at the same level or better than in 2023.
Respondents from North and Latin America are the most optimistic. Representatives of the EMEA region are less optimistic. Those who started spending more in 2024 are more optimistic about market prospects.
Consider subscribing to the GameDev Reports Premium tier to support the newsletter. Get access to the list of curated articles & archive of Gaming Reports that I’ve been collecting since 2020.
Gaming market representatives are the most pessimistic. 30% believe the market condition has worsened - compared to 14% in the non-gaming segment.
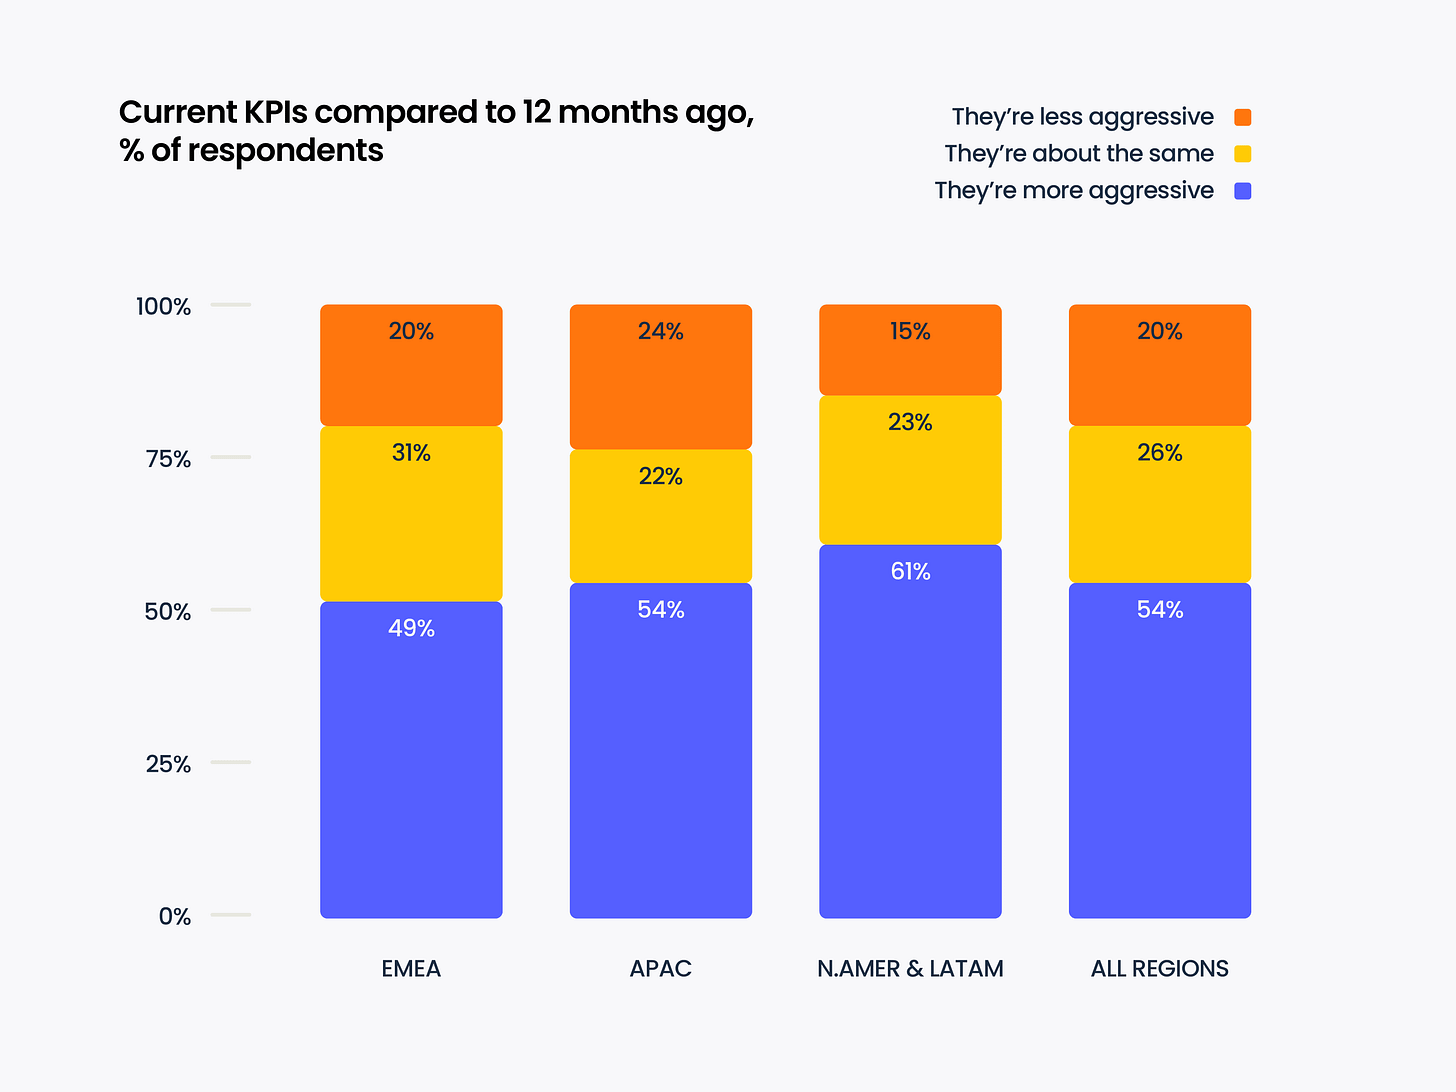
However, more than half of the market signals that KPIs have become more aggressive.
Interestingly, despite the growth of the non-gaming segment, its representatives more often report stricter KPIs.
Despite ambitious goals, non-gaming companies either hit their targets or are close to them. The percentage of those who miss is the same across segments.
About half of the respondents noted growing budgets. Those operating budgets of more than $1 million per month more often report growth, which indicates ongoing market consolidation.
Survey results - Innovations and Changes
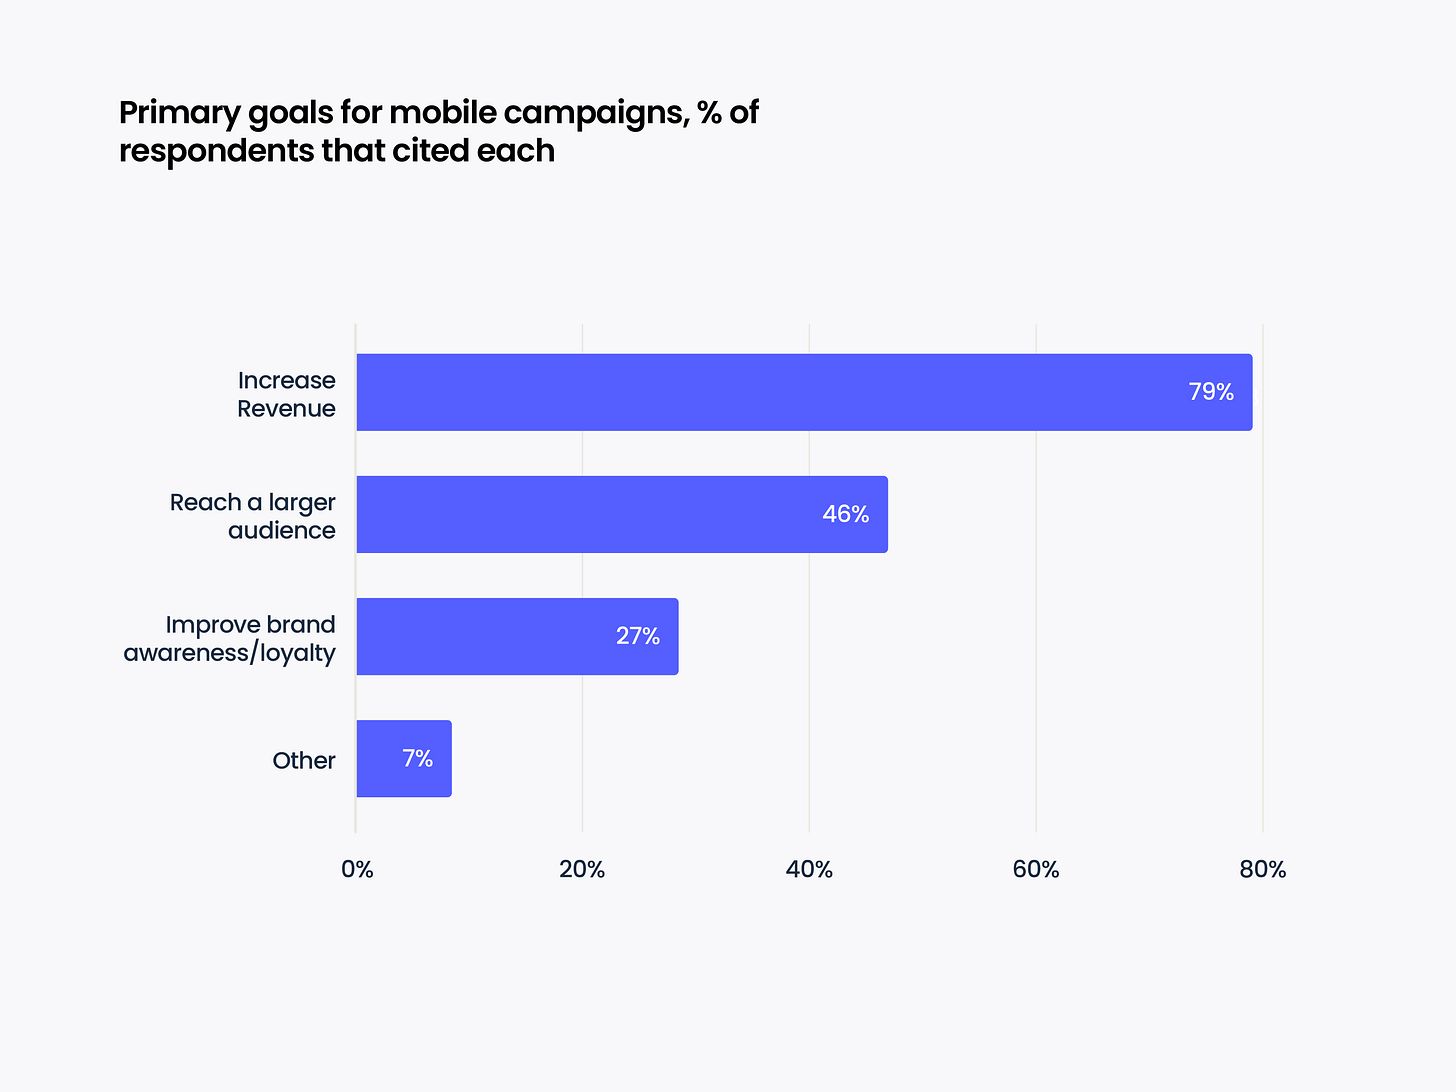
79% of respondents noted that growing company revenue is their main goal. 46% noted that they are working on increasing the audience of their projects. 27% are working on improving the brand and its positioning in the market - mainly representatives of the financial and educational segments.
When it comes to KPIs, most game developers (60%) focus on ROAS. They also set CPI (16%), LTV/ARPU (15%), CPA (6%), and CPC (2%) as KPIs. Among non-gaming marketers, CPA KPIs are set much more often (4 times more often).
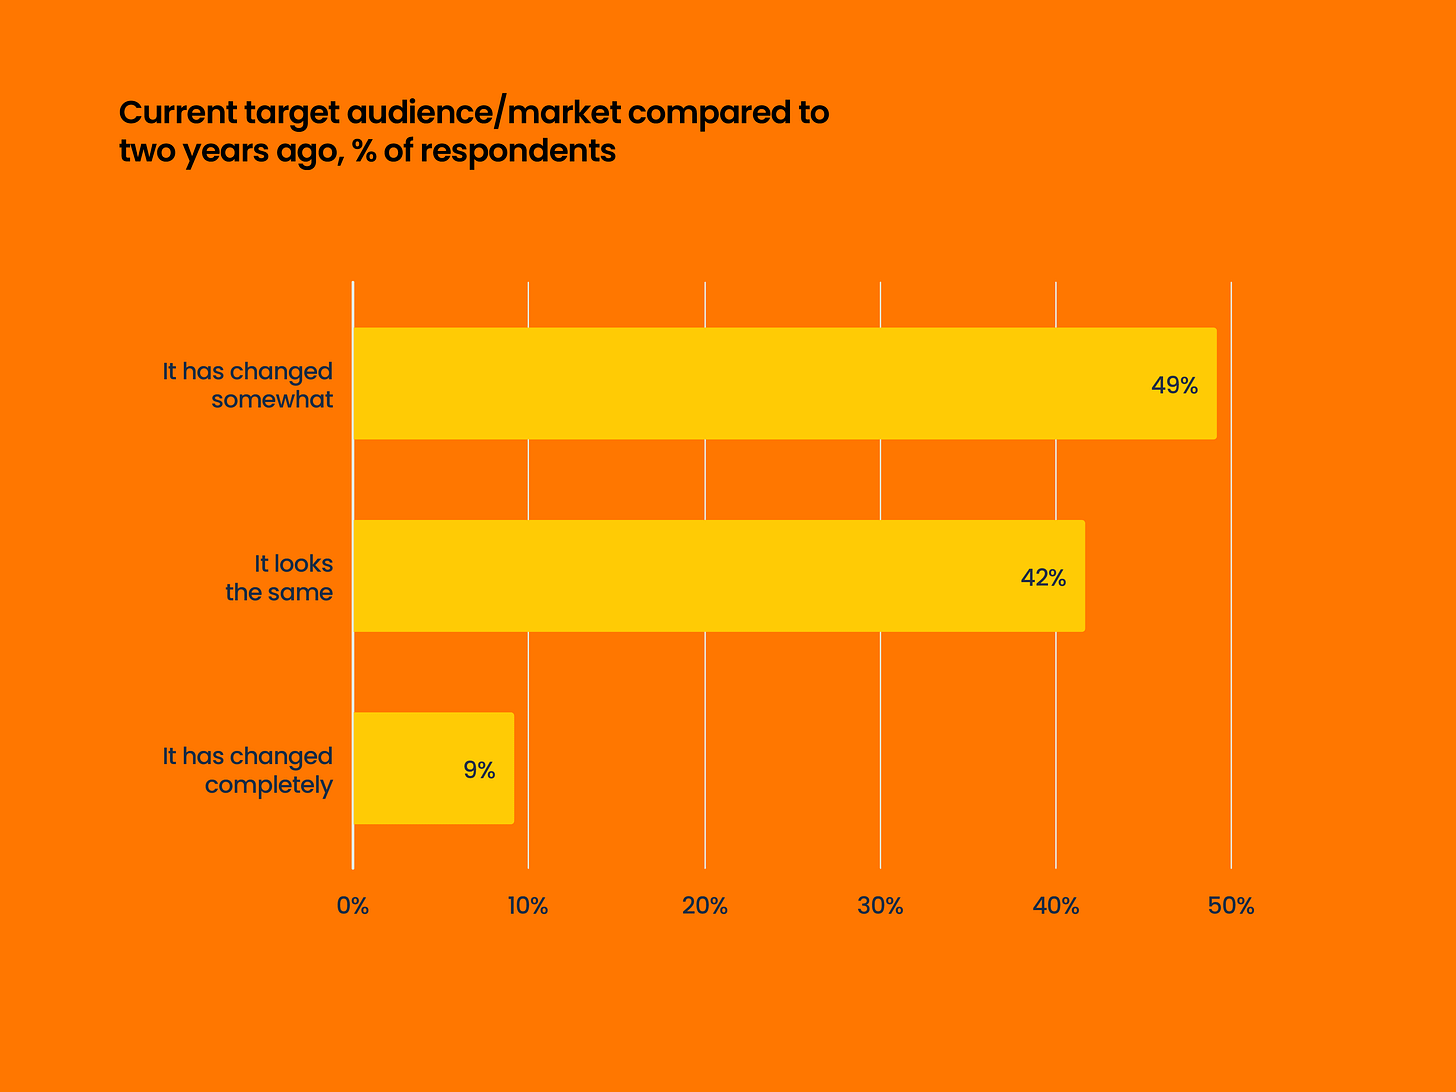
Most market representatives feel that the mobile app audience has changed. 58% of respondents reported this.
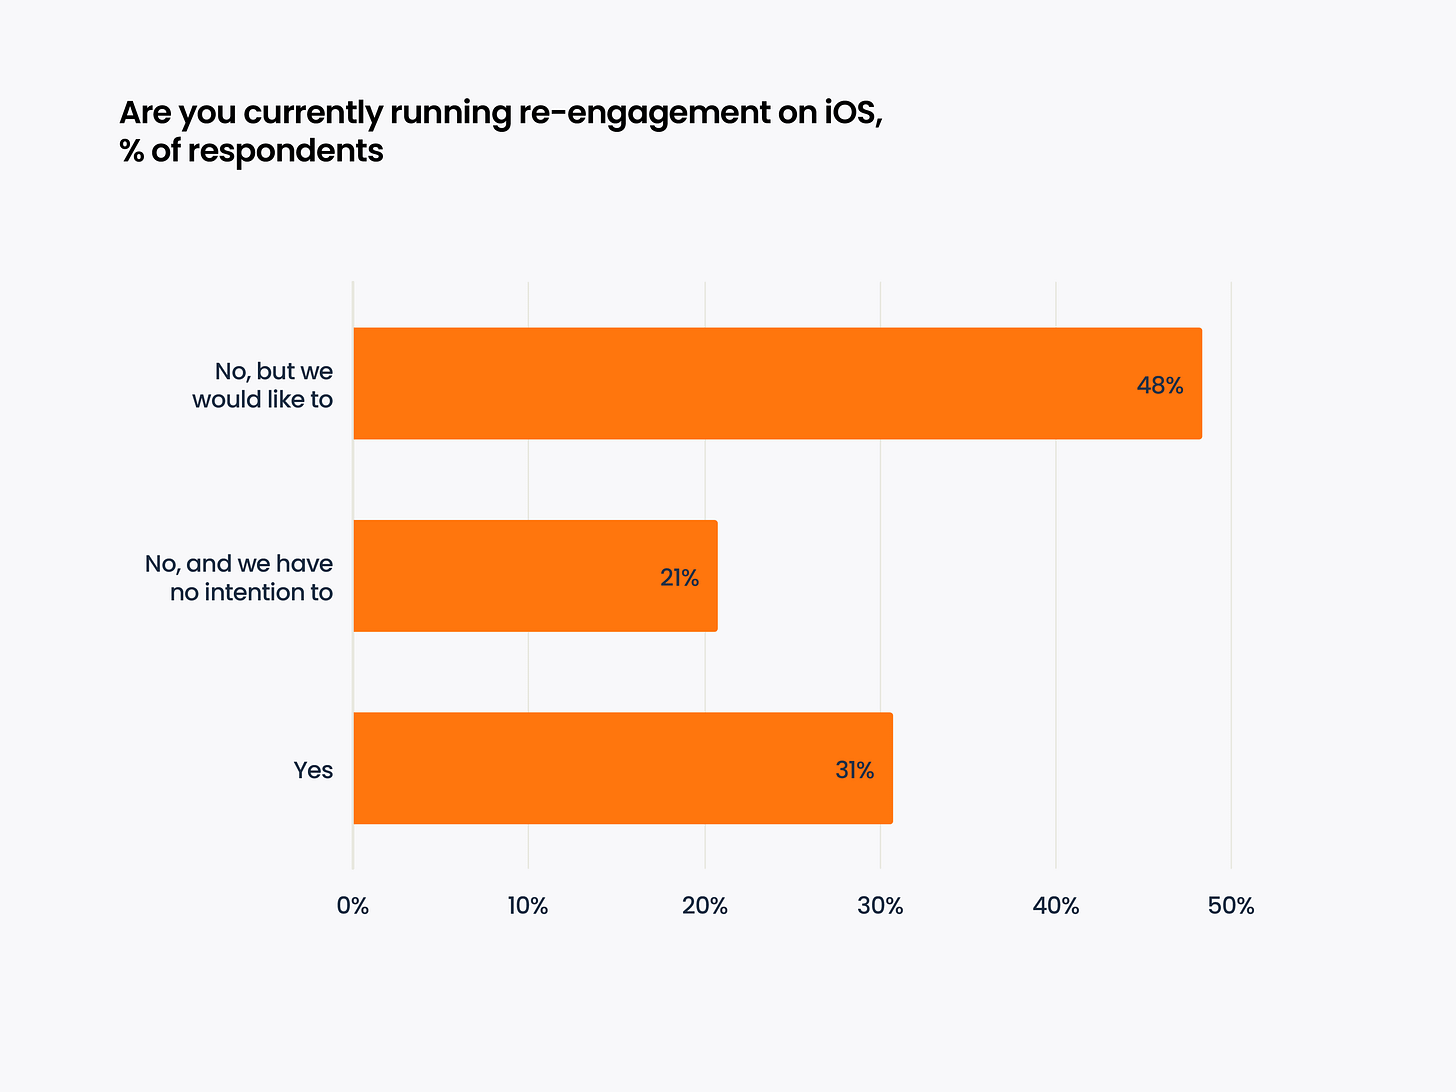
Only 31% of marketers use re-engagement campaigns on iOS. However, 48% would like to engage in them but for various reasons are not doing so yet.
Most respondents see the benefit of AI in creative production. 34% use AI for creative production, 20% use it for creative optimization. AI is less involved in code writing, operational work, and sales.
Survey results - SKAN & GAID
Only 67% of respondents are familiar with AAK (AdAttributionKit).
30% believe that the introduction of SKAN negatively affected their UA activity. 32% saw no changes. And 24% noted positive changes.
It cannot be said that the market is ready for GAID. Only 6% have prepared, and 32% of the market has done some preparatory work. The majority has not yet prepared for changes from Google. Among the respondents, companies with marketing budgets exceeding $1 million are more prepared for the changes.
Survey results - Expectations for 2025 and priorities
Overall, the situation in the mobile market is considered positive. But one-fifth believe that the situation will worsen in 2025.
In terms of plans, 88% of respondents want to spend either the same or more in 2025 than last year.
Most spending is planned in advertising networks (priority for 41% of respondents) and SAN (Self-Attributed Network - such as TikTok, Google Ads and others, priority for 36%).
However, compared to 2024, the popularity of advertising networks has increased, while all other advertising channels have slightly decreased.
Companies are also interested in investing in the development of organic/viral traffic (62%), influencer marketing (51%), and community building (29%).
Most respondents noted that in 2024, they started working with a larger number of partners. This is likely related to market difficulties and the desire to explore alternative opportunities.
Improving ROAS/ROI, access to new audiences and inventory, growth in new regions are the main factors when working with new partners.
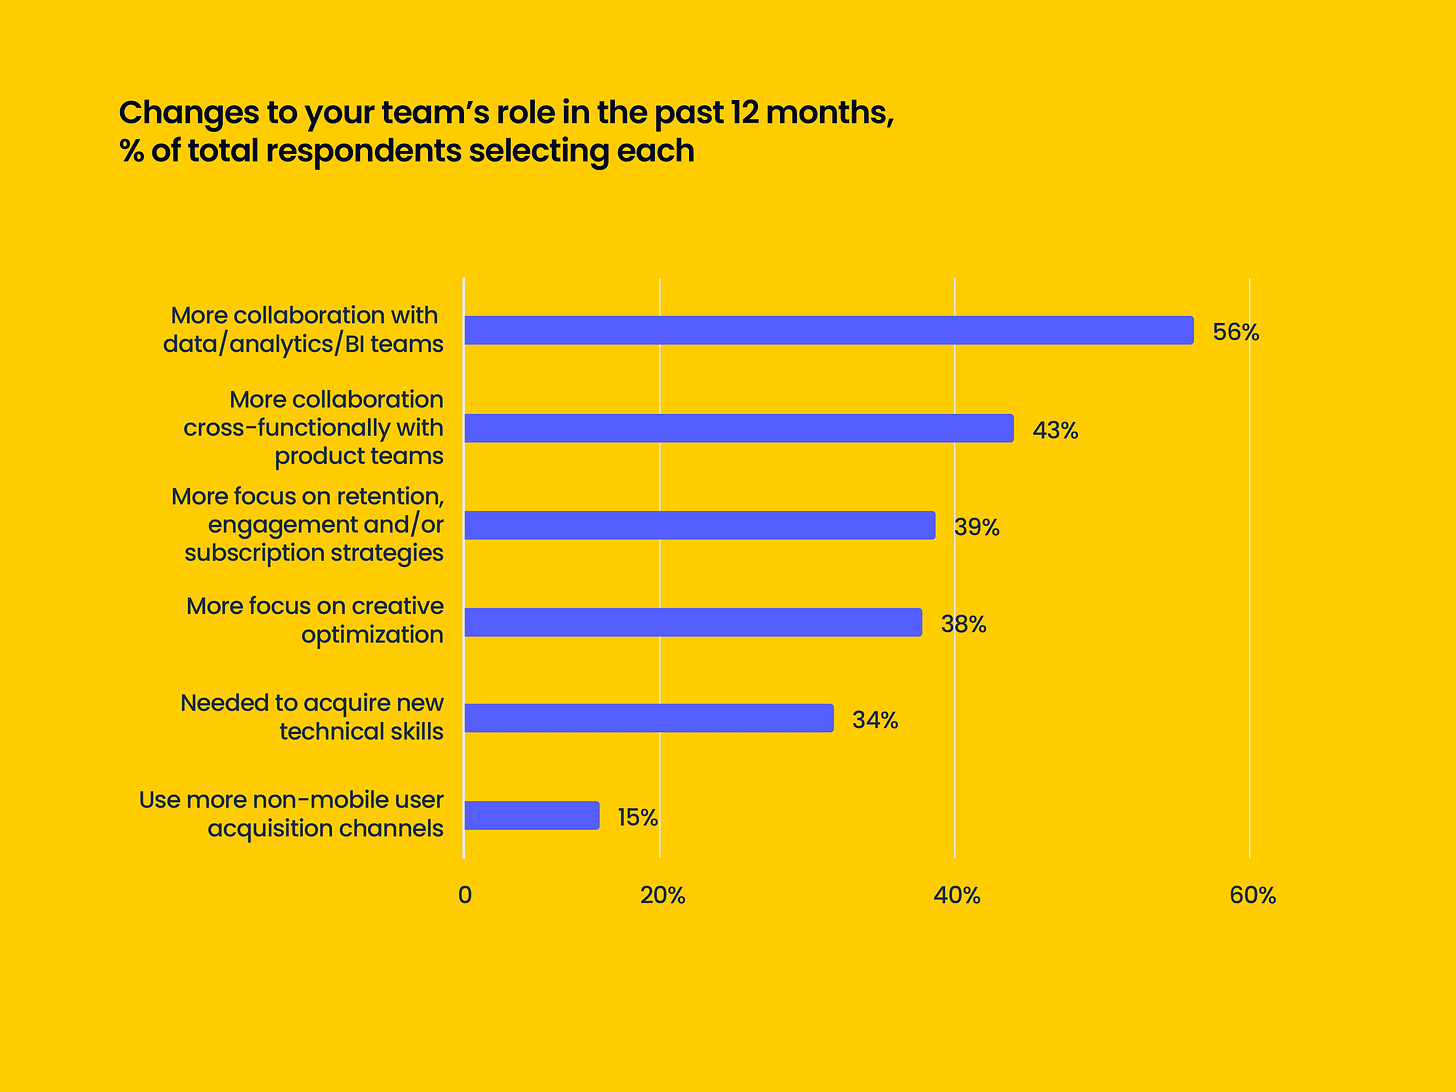
Survey results show that over the past year, marketers have started working more often with analytics teams and product teams. They have become more focused on metrics and creative optimizations.
Epic Games Store: 2024 in Numbers
PC users exceeded 295 million, up by 25 million from 2023.
Total accounts in the Epic Games ecosystem reached 898 million, increasing by 94 million in 2024. This figure includes mobile platforms.
Peak MAU was 74 million users, 1% less than the previous year. Peak DAU hit 37.2 million users.
Average MAU in 2024 was 67 million users (+6% YoY).
Average DAU in 2024 was 32 million users (+6% YoY).
Users spent a total of 7.72 billion hours in games on EGS (+10% compared to 2023).
Of this, 2.68 billion hours were spent on third-party games (11% increase from 2023).
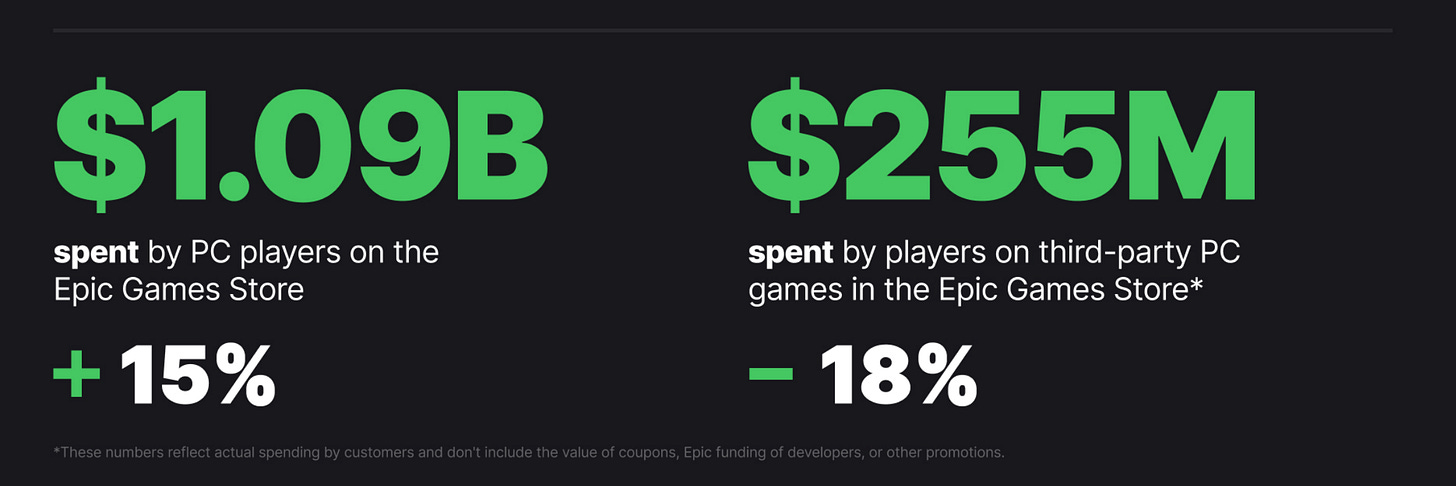
PC gamers spent $1.09 billion on purchases in EGS, 15% more than last year.
1,100 games were released on EGS in 2024, expanding the total catalog to 4,000 projects.
3rd-party developers earned $255 million from users on the platform. This figure was 18% higher in 2023.
EGS allows developers to use third-party payment methods, noting that Marvel Rivals, Valorant, Naraka: Bladepoint, and EA Sports FC 25 use such solutions.
In 2024, Epic Games gave away 89 games with an average rating of 76%. Users claimed free games 595 million times.
The total value of free games was $2,229 (based on US market prices).
Genshin Impact, Rocket League, Honkai: Star Rail, Grand Theft Auto V, and Fortnite were the platform's highest-earning projects.
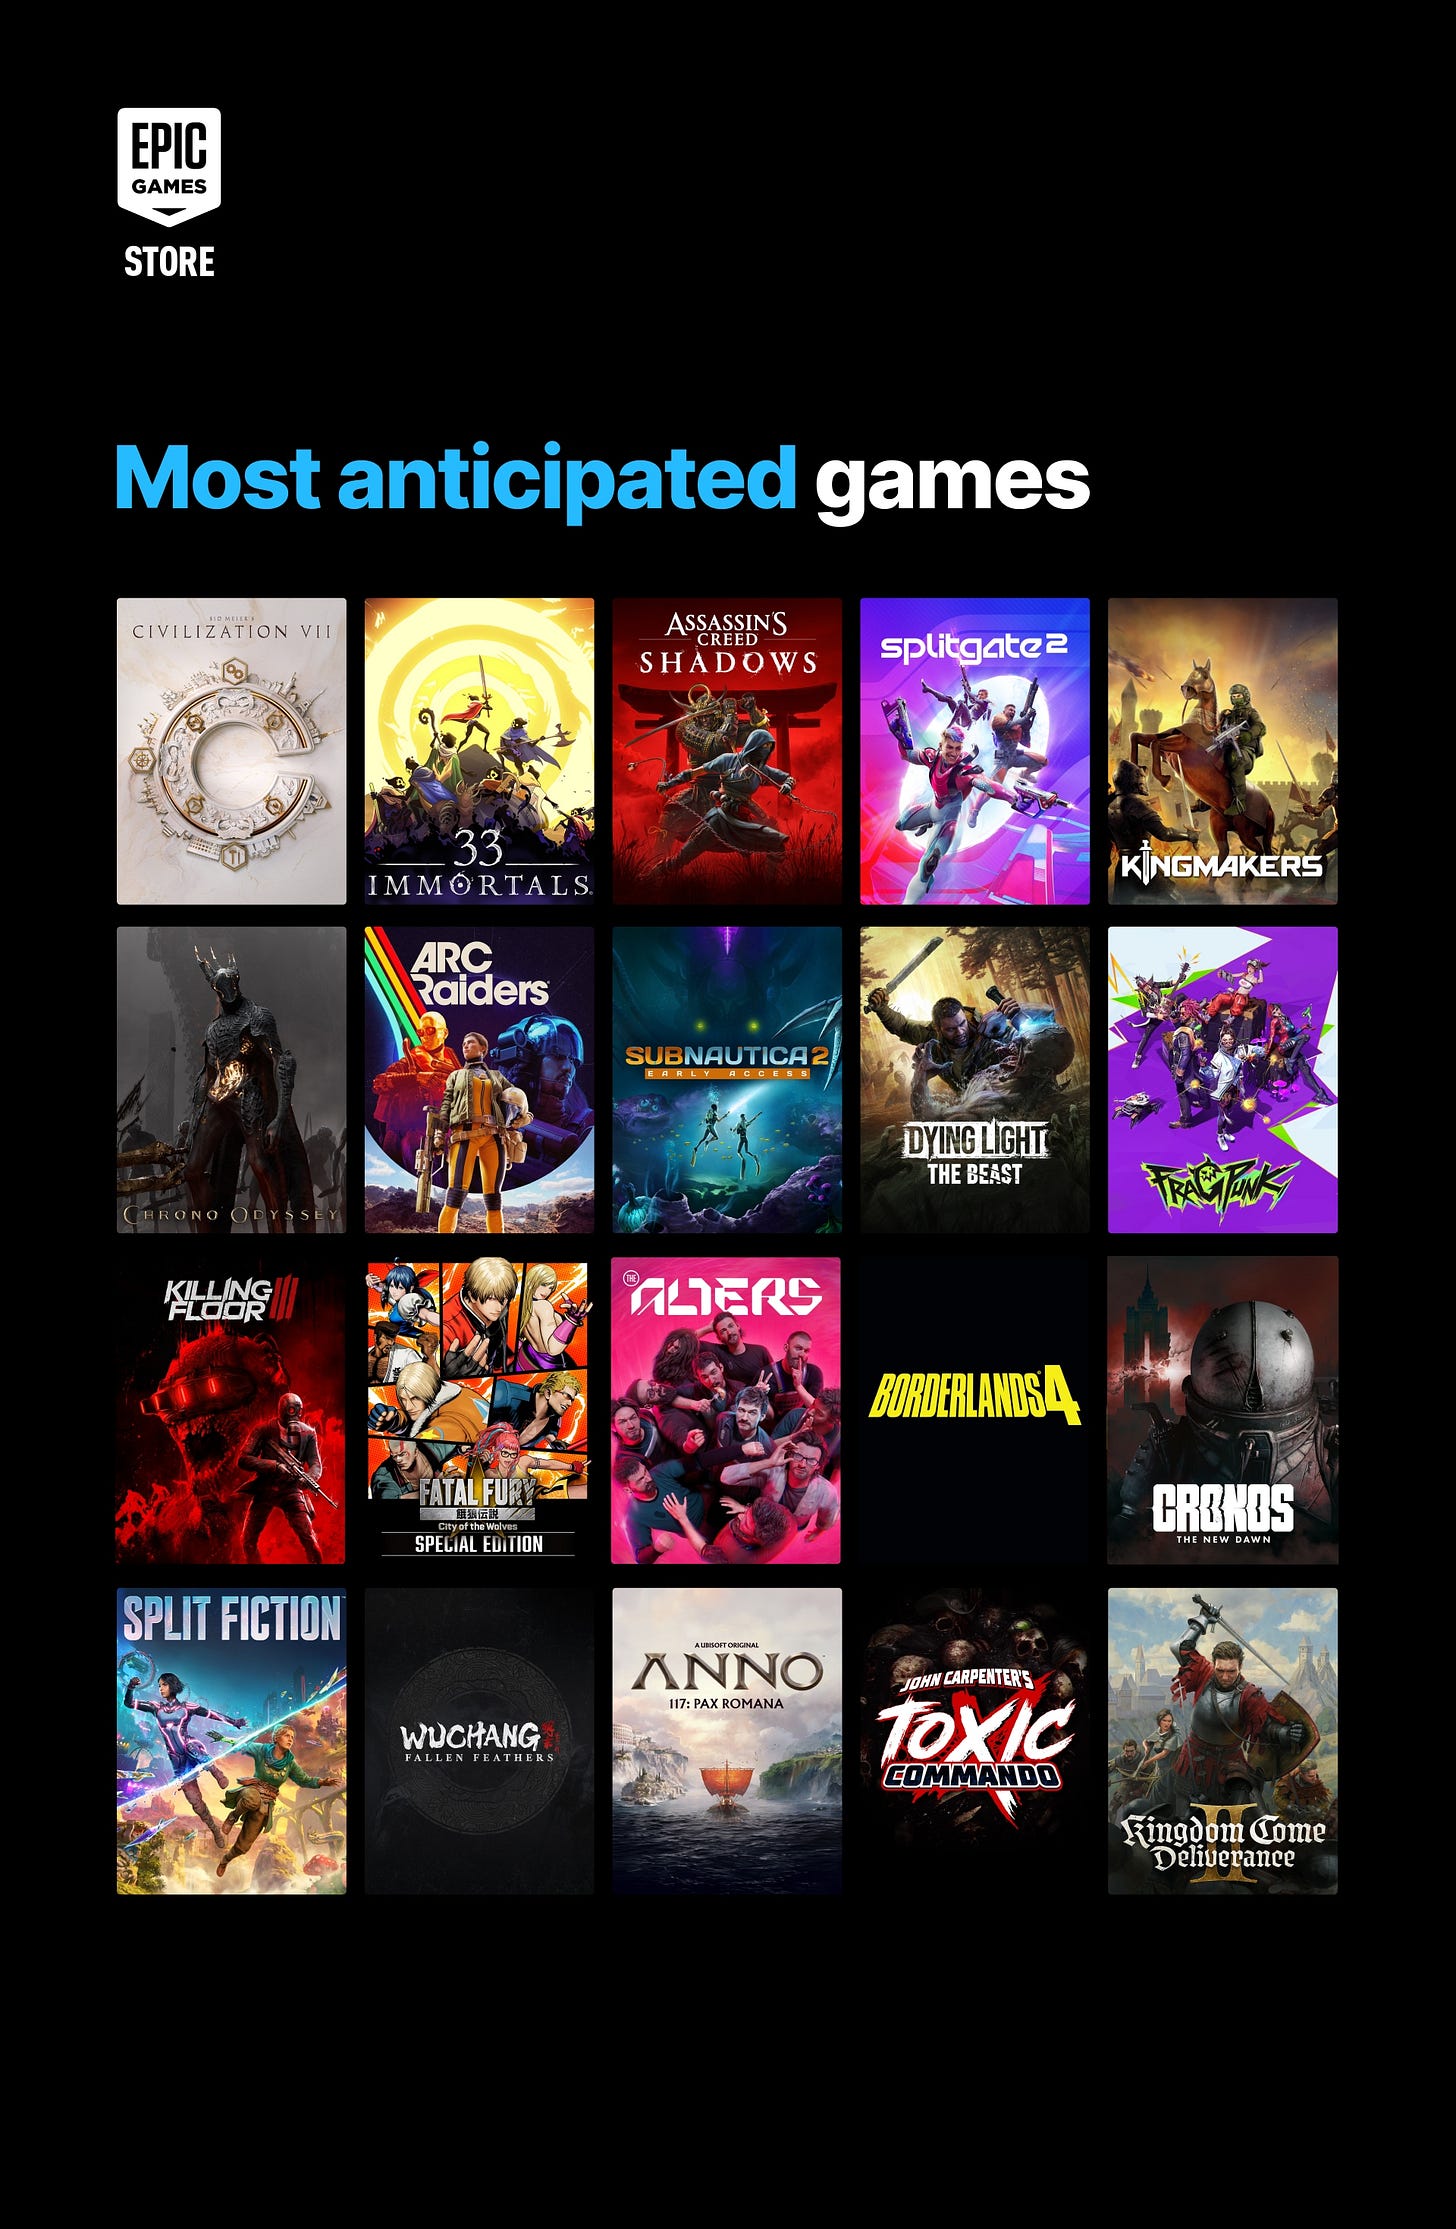
The company also shared a list of the most anticipated projects.


