

Weekly Gaming Reports Recap: March 11 - March 15 (2024)
Mobile marketing trends by SocialPeta; AppMagic shared the results of 5 casual genres in 2023; almost half of gaming industry employees are living from paycheck to paycheck.

Reports of the week:
SocialPeta: Trends in Mobile Gaming Marketing in 2023
AppMagic: Lessons of 2023 for casual games
GSD & GfK: The UK gaming market (PC & Console) declined in February 2024
Famitsu: Persona 3 Reload tops Japanese retail chart in February 2024
Monopoly GO! has earned over $2B
StreamElements & Rainmaker.gg: State of the Streaming Market in February 2024
80 Level: 45.6% of the game industry workers are living from a paycheck to a paycheck
SocialPeta: Trends in Mobile Gaming Marketing in 2023
General figures

In 2023, there were about 40 thousand active advertisers in the gaming market per month. This is 49.6% more than in 2022.
The average number of creatives per month in 2023 decreased by 36.5% - to 155 per advertiser.
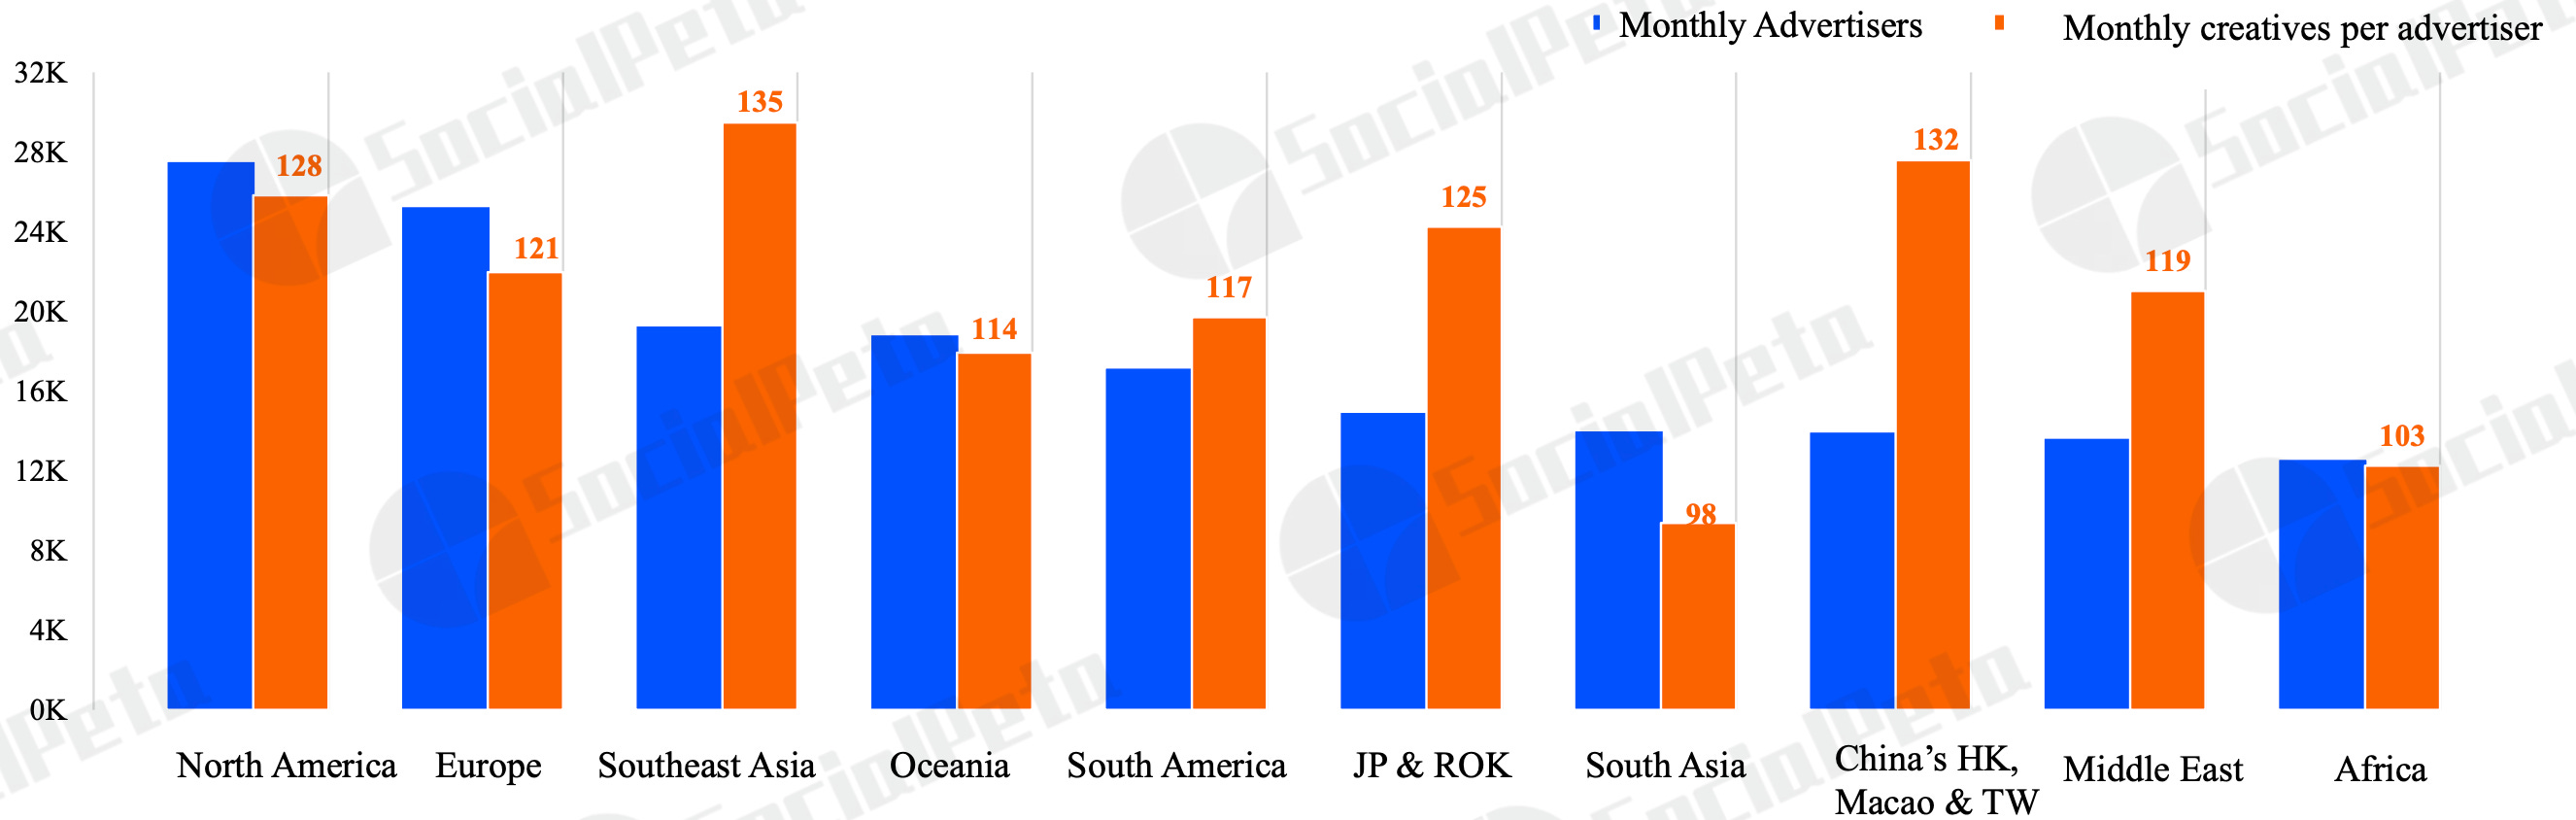
Southeast Asia has become the most competitive region in terms of marketing. On average, in this region, there are 135 creatives per advertiser per month.
However, it's not very clear what SocialPeta means here because according to the general statistics (above), the average number of monthly creatives per advertiser is higher.
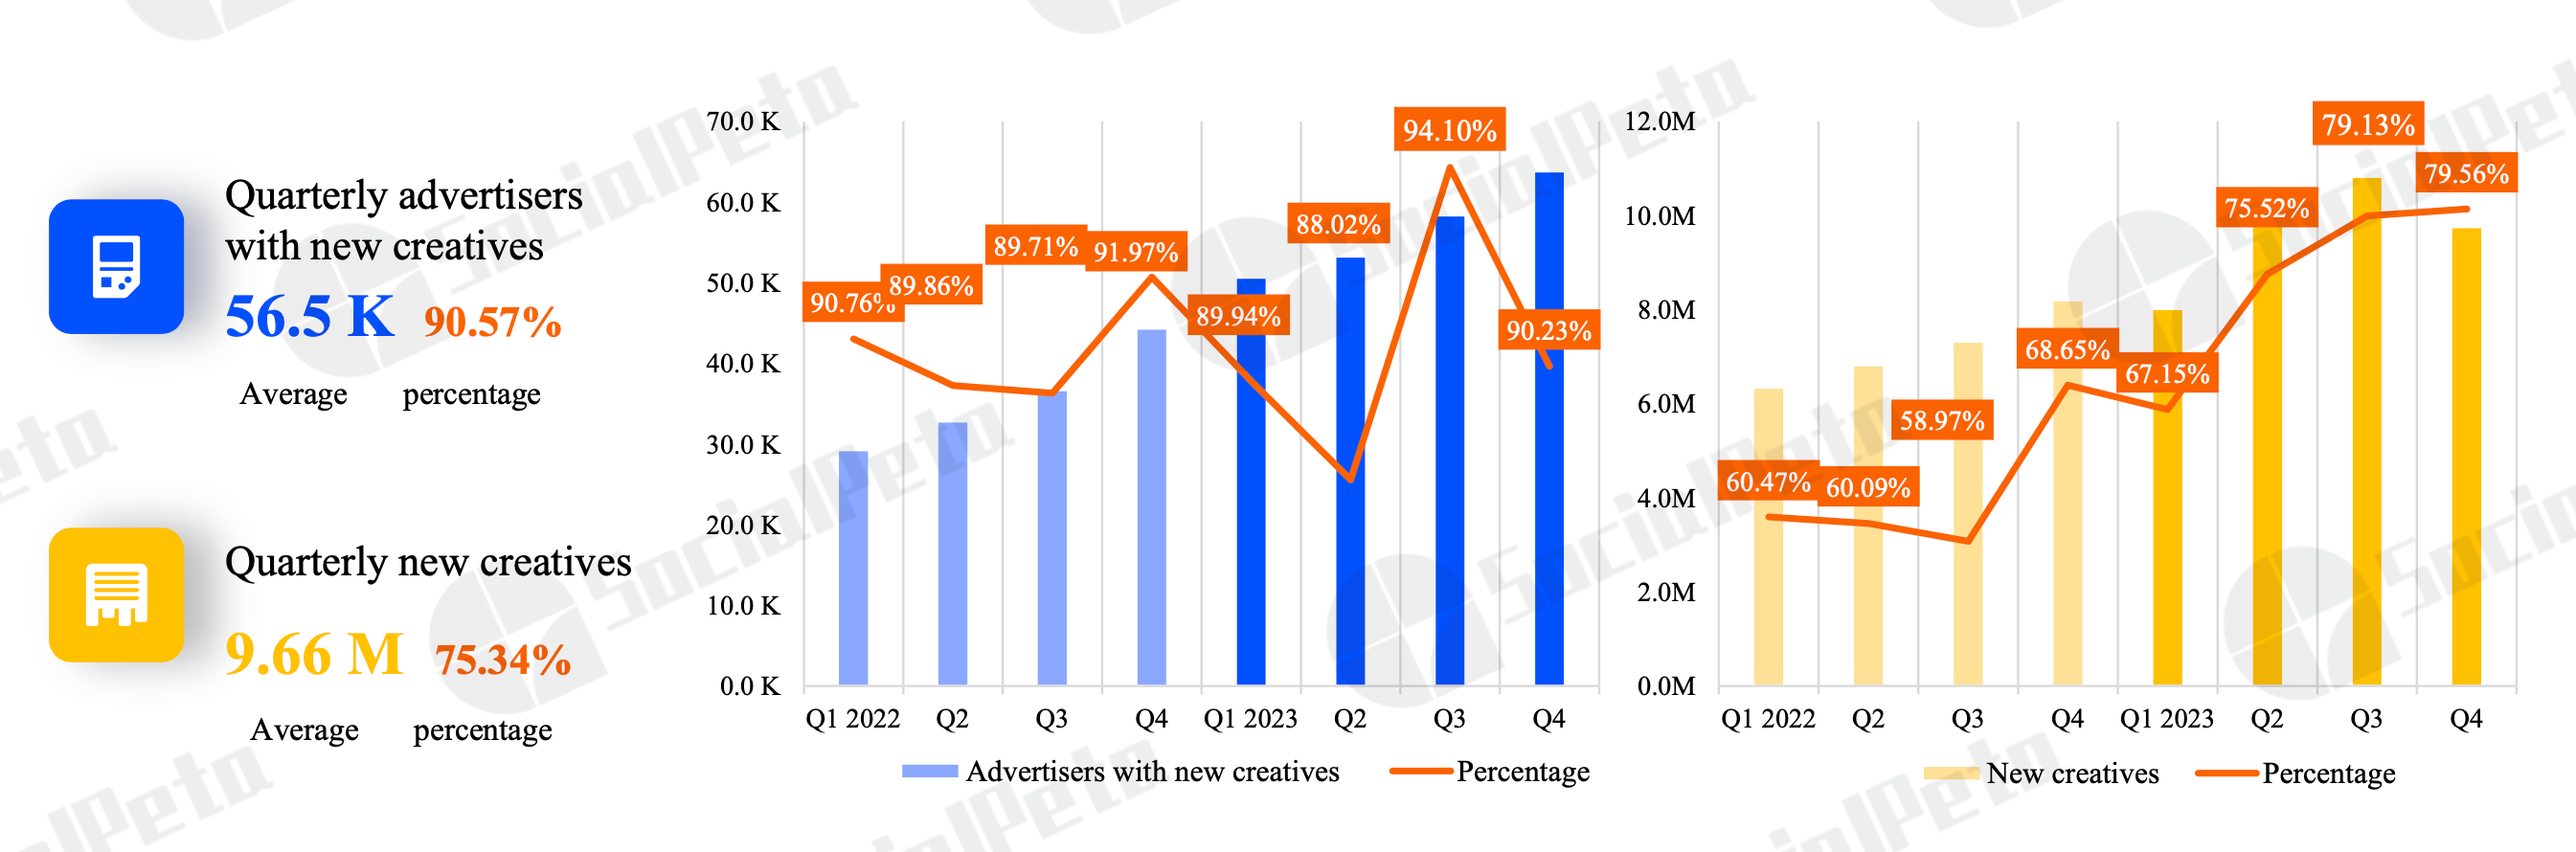
The percentage of new creatives (as well as their quantity) significantly increased in the 2nd-4th quarters of 2023. From 75 to 79% of all creatives were new. The average for 2022 was 62%.
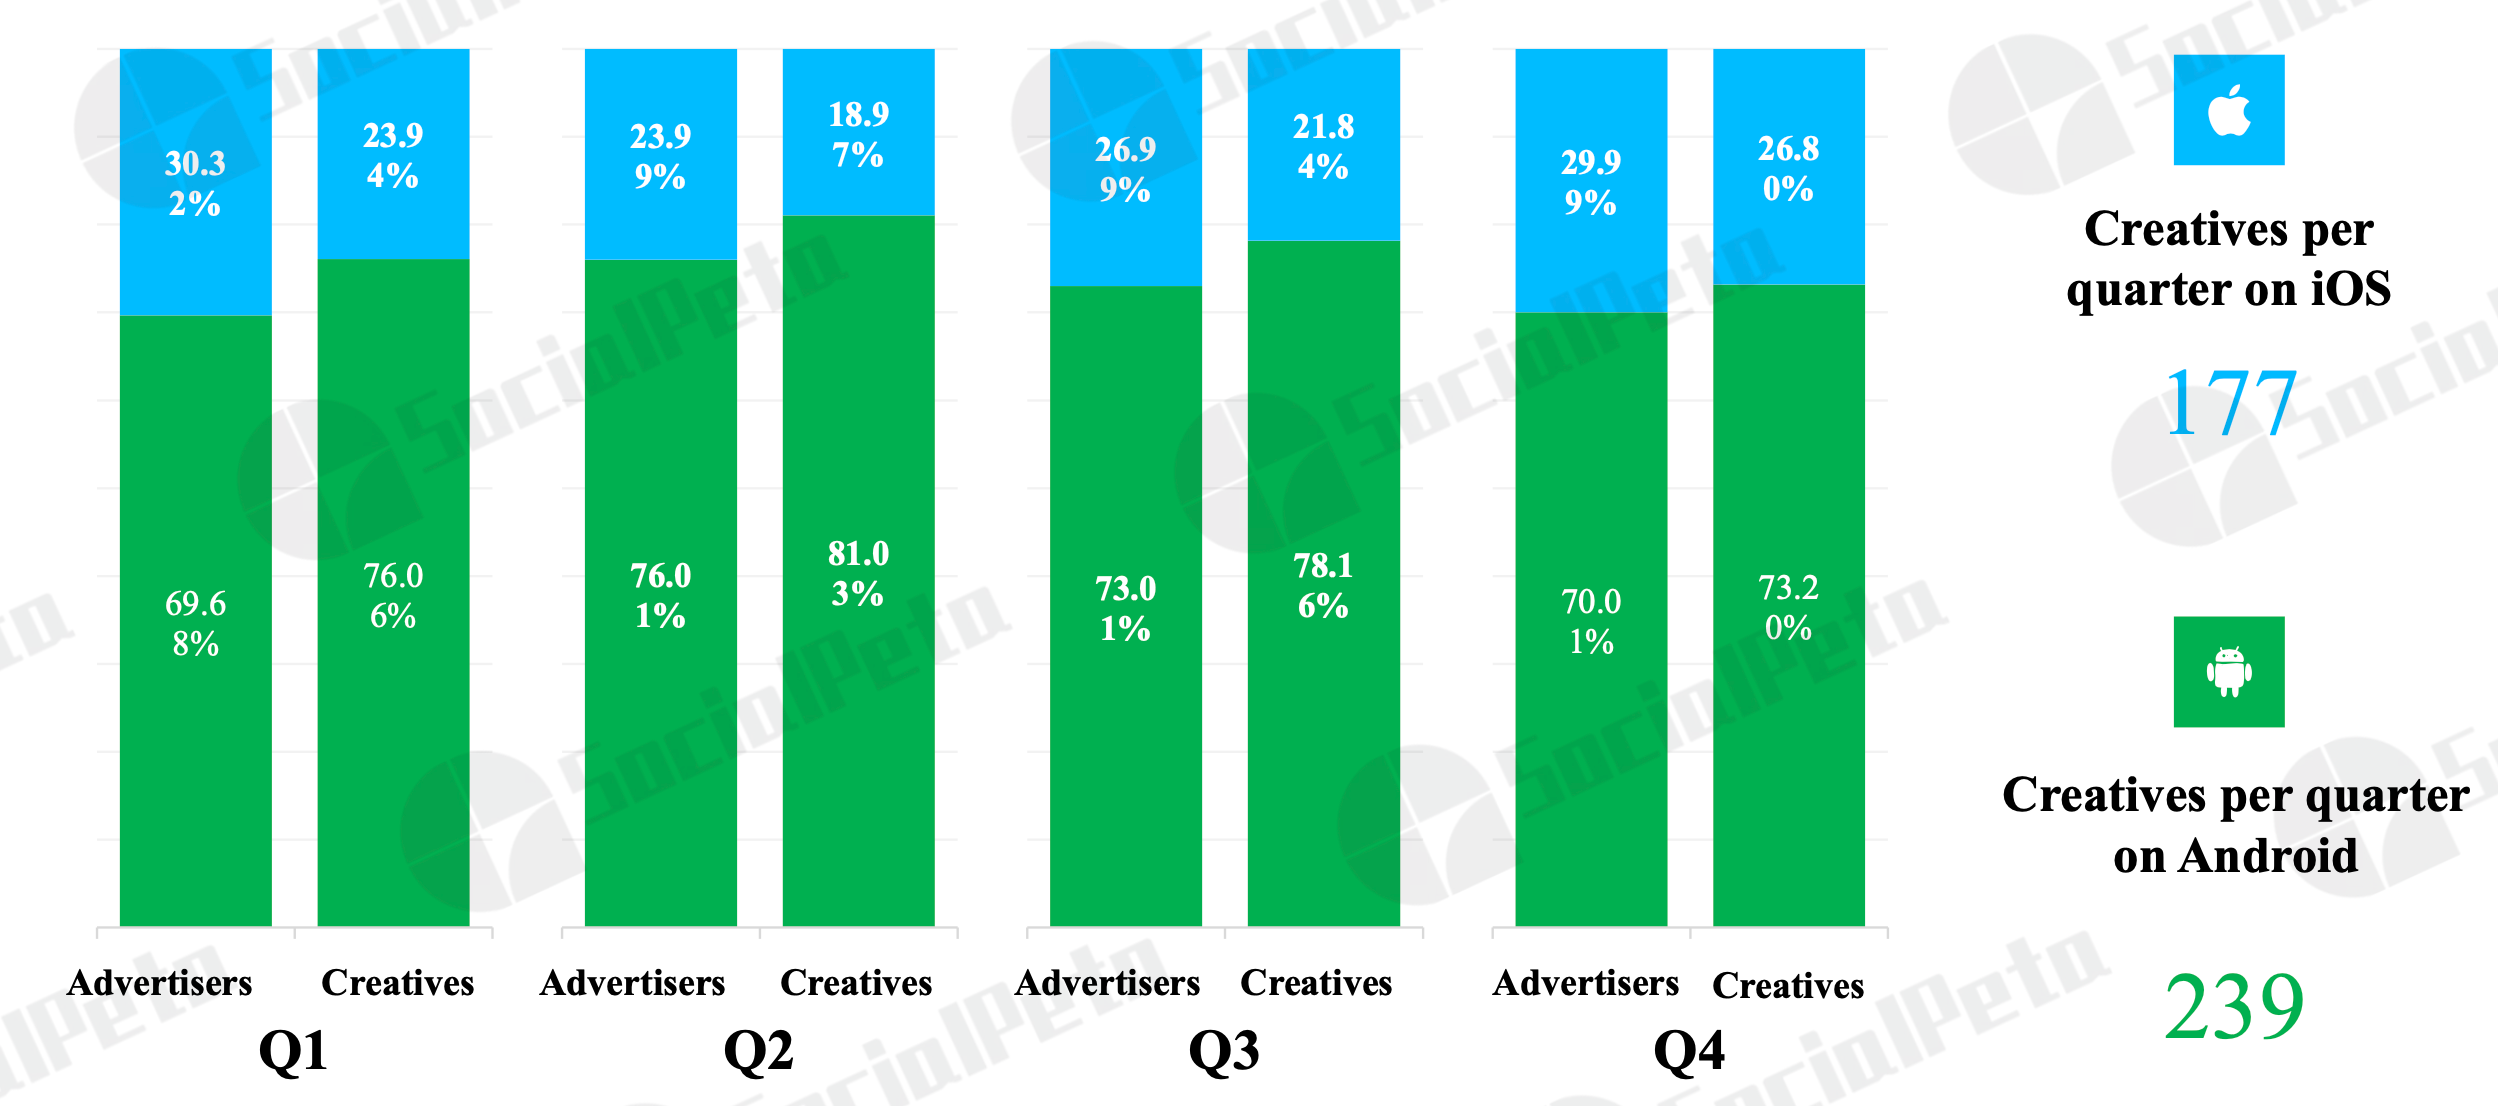
The average number of creatives on Android is higher than on iOS (239 versus 177).
76,46% of all creatives on mobile devices are videos. 19,83% are static images; 2,14% are Playable; 1,32% are HTML creatives (it's not entirely clear what the difference is from Playable); 0,25% are carousels (it's not very clear why it's highlighted as a separate segment, as it's still static images).

80% of video creatives were 30 seconds or shorter. The most popular (17.97%) are 30-second videos.
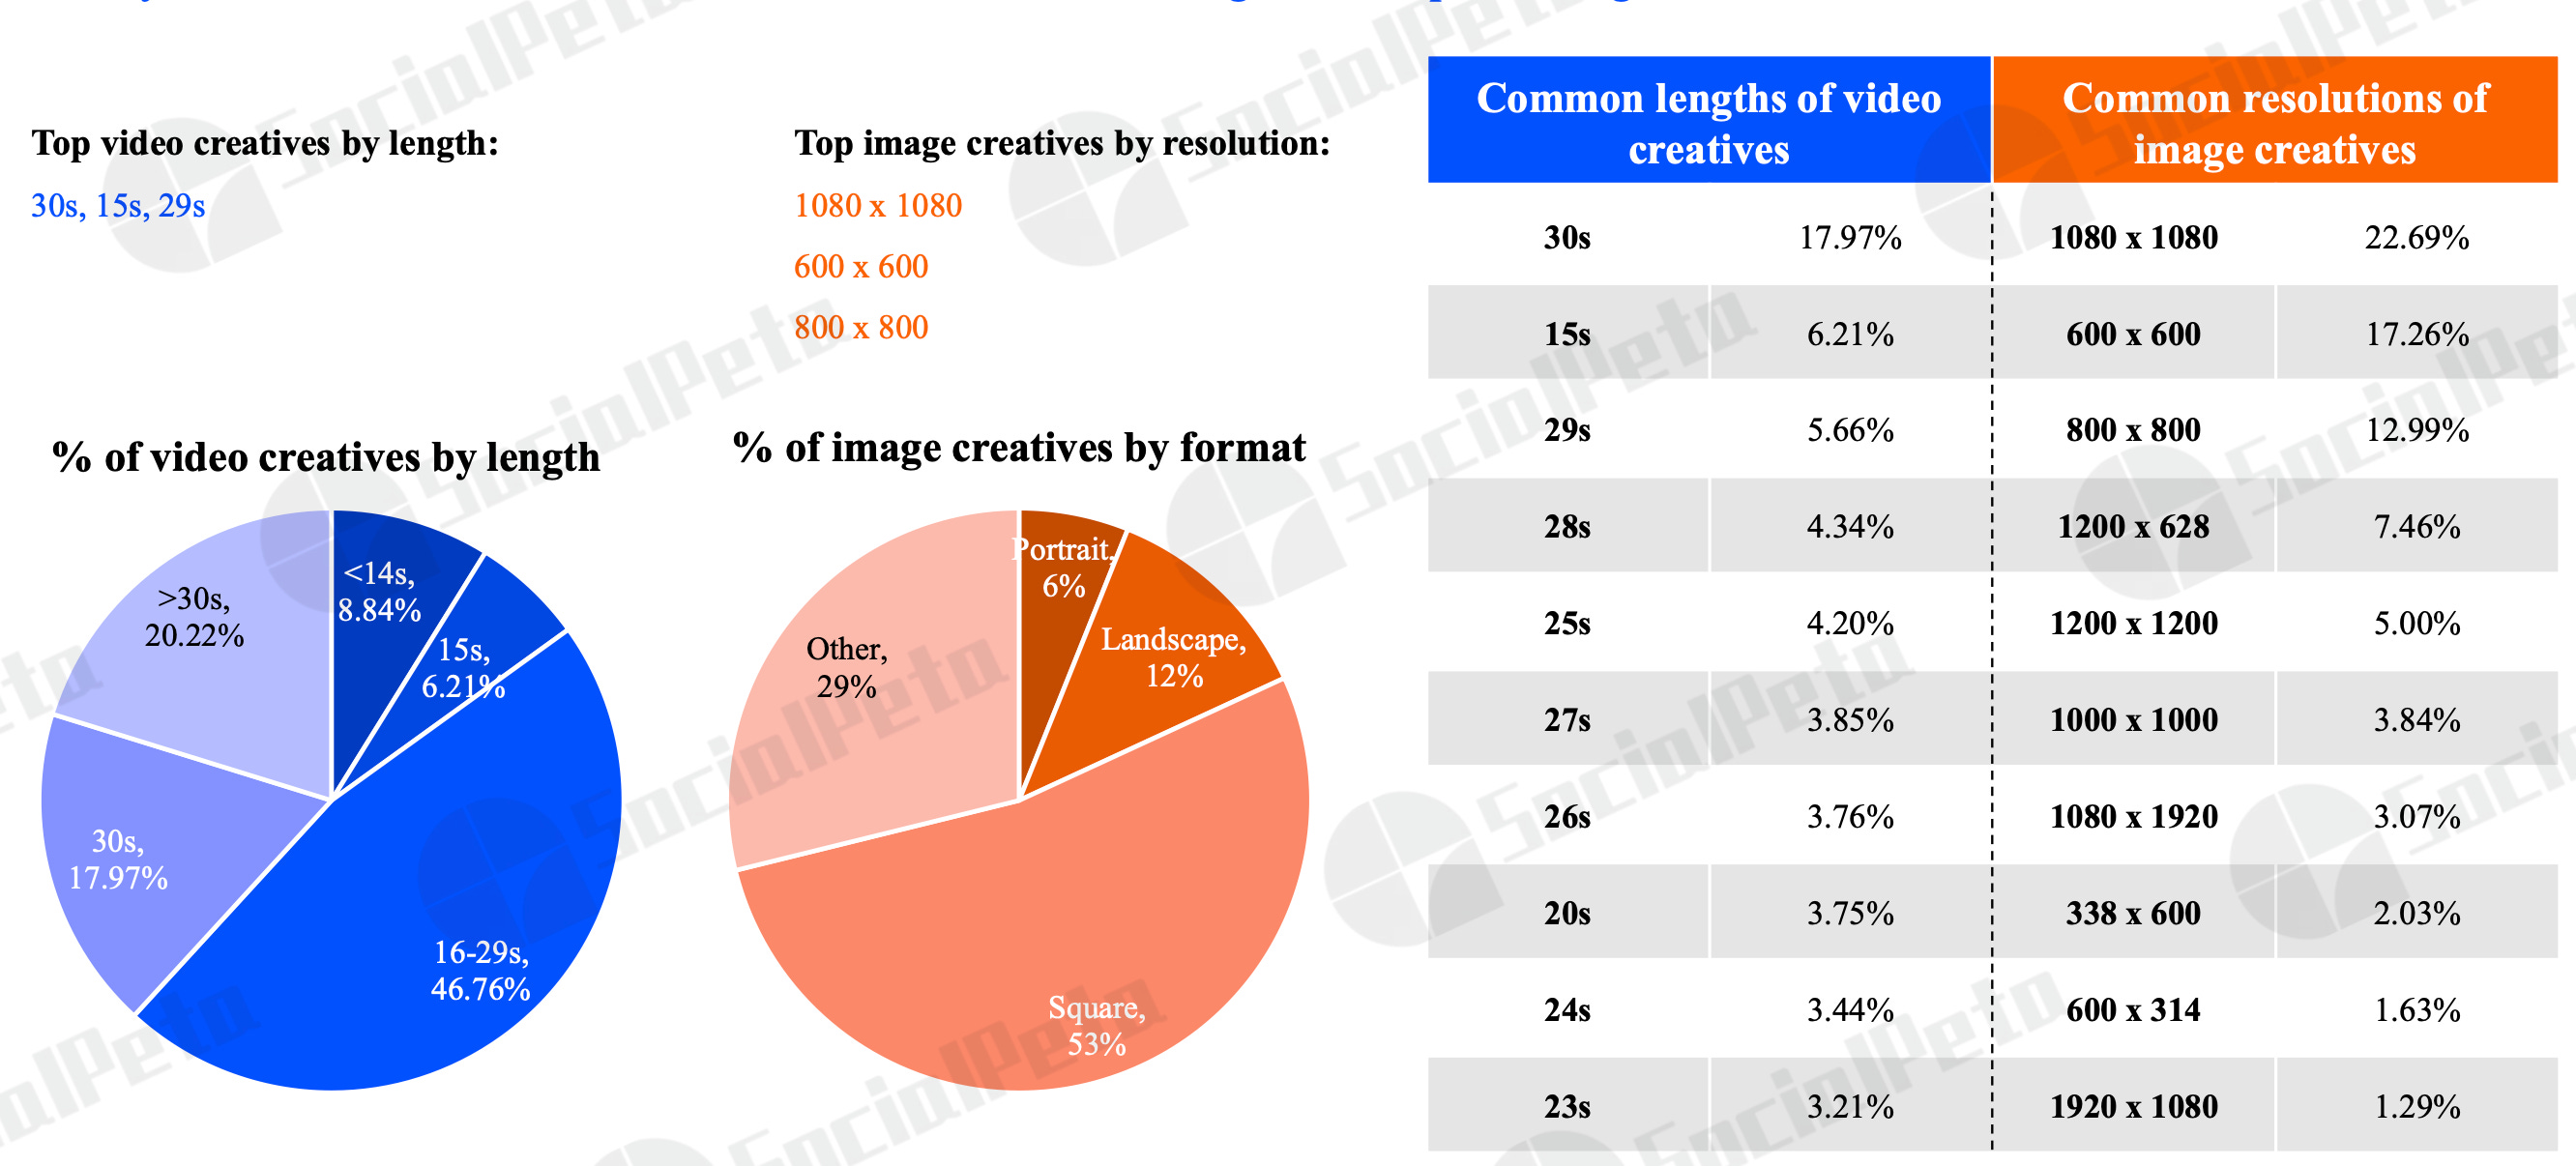
As for static images, square creatives account for 53% of the total number.
Genre Overview

In 2023, 29.38% of all advertisers worked with casual projects (+0.94% YoY); 12.52% - with puzzles (+0.8% YoY); 9.18% - with simulators (+0.03%). Casinos showed the largest growth in advertisers (+1.9% YoY); arcade projects experienced the largest decline (-0.97% YoY).
In the case of creatives, the situation is similar. Casual games account for 32.51% of all creatives (+9.5% YoY - record growth); puzzles - 11.18% (-1.18% YoY); RPGs - 10.2% (-1.23% YoY). SLG games saw the most significant drop in creatives (-2.08% YoY).
Market Details
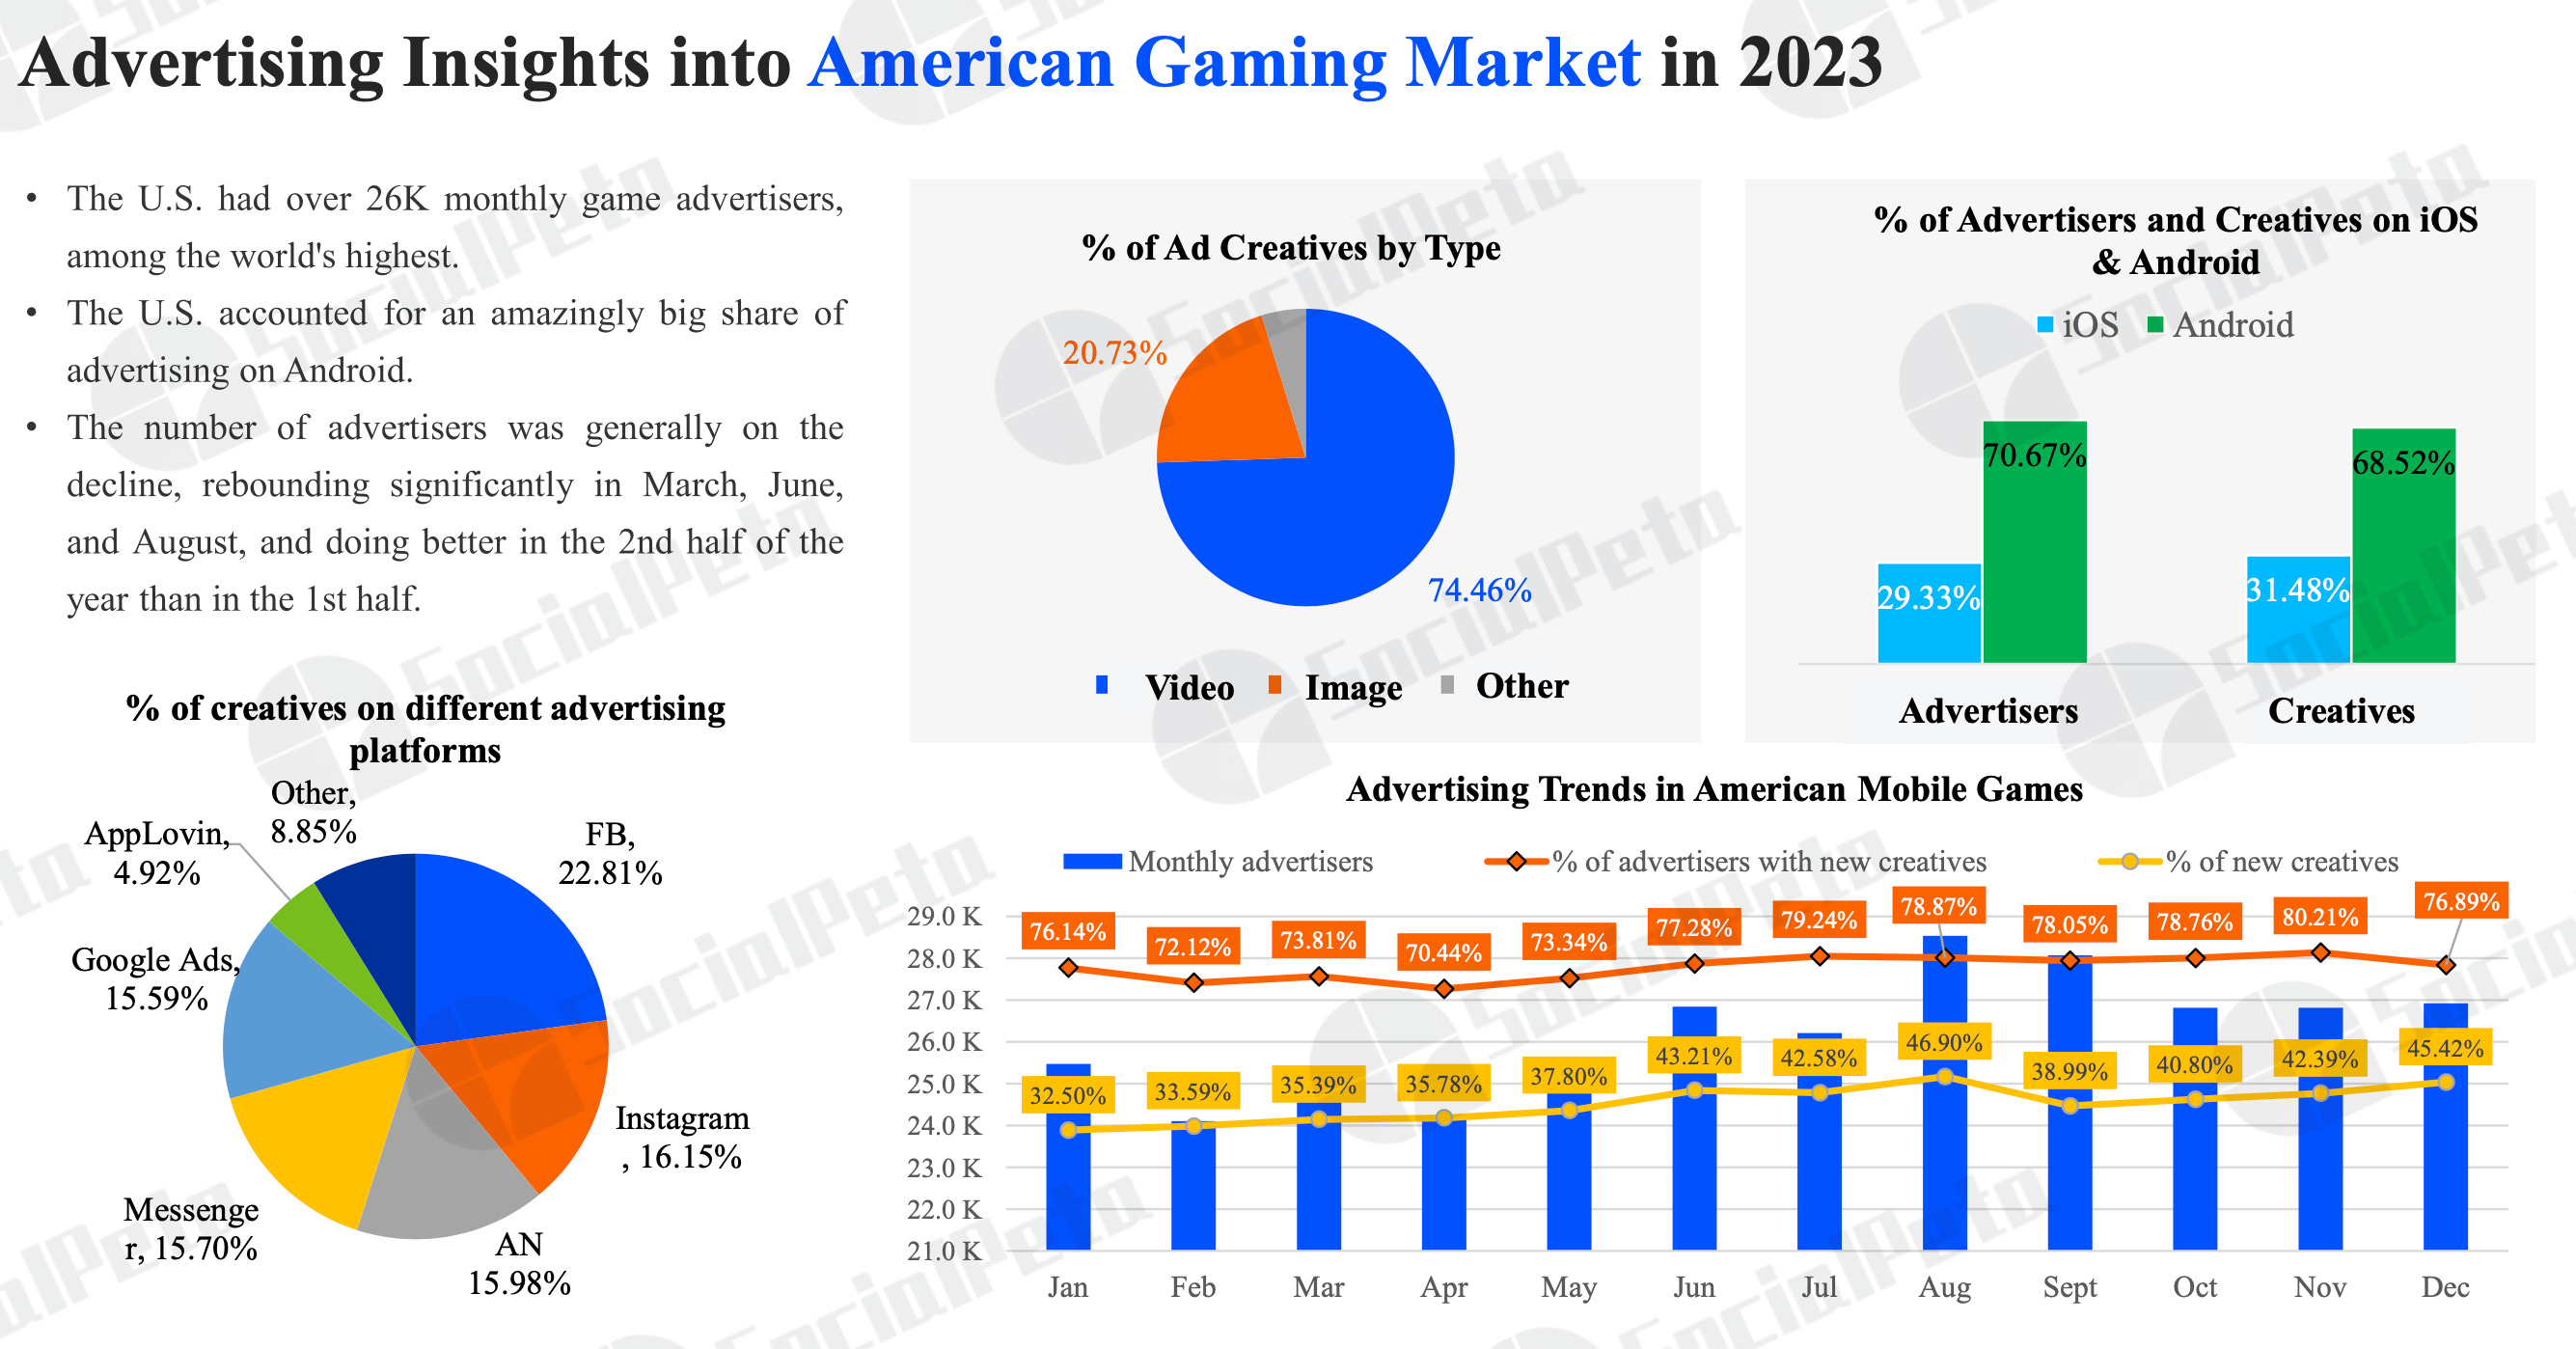
In the USA, there are over 26 thousand monthly advertisers. This is the largest market by this component.

In Japan, the largest share of advertising is on iOS (about 40%), due to the focus of many companies on the local market.

In South Korea, on the contrary, the share of Android advertisers and creatives is higher (around 73%). This is due to Samsung's significant presence in the country. The number of advertisers in the country increased throughout 2023.
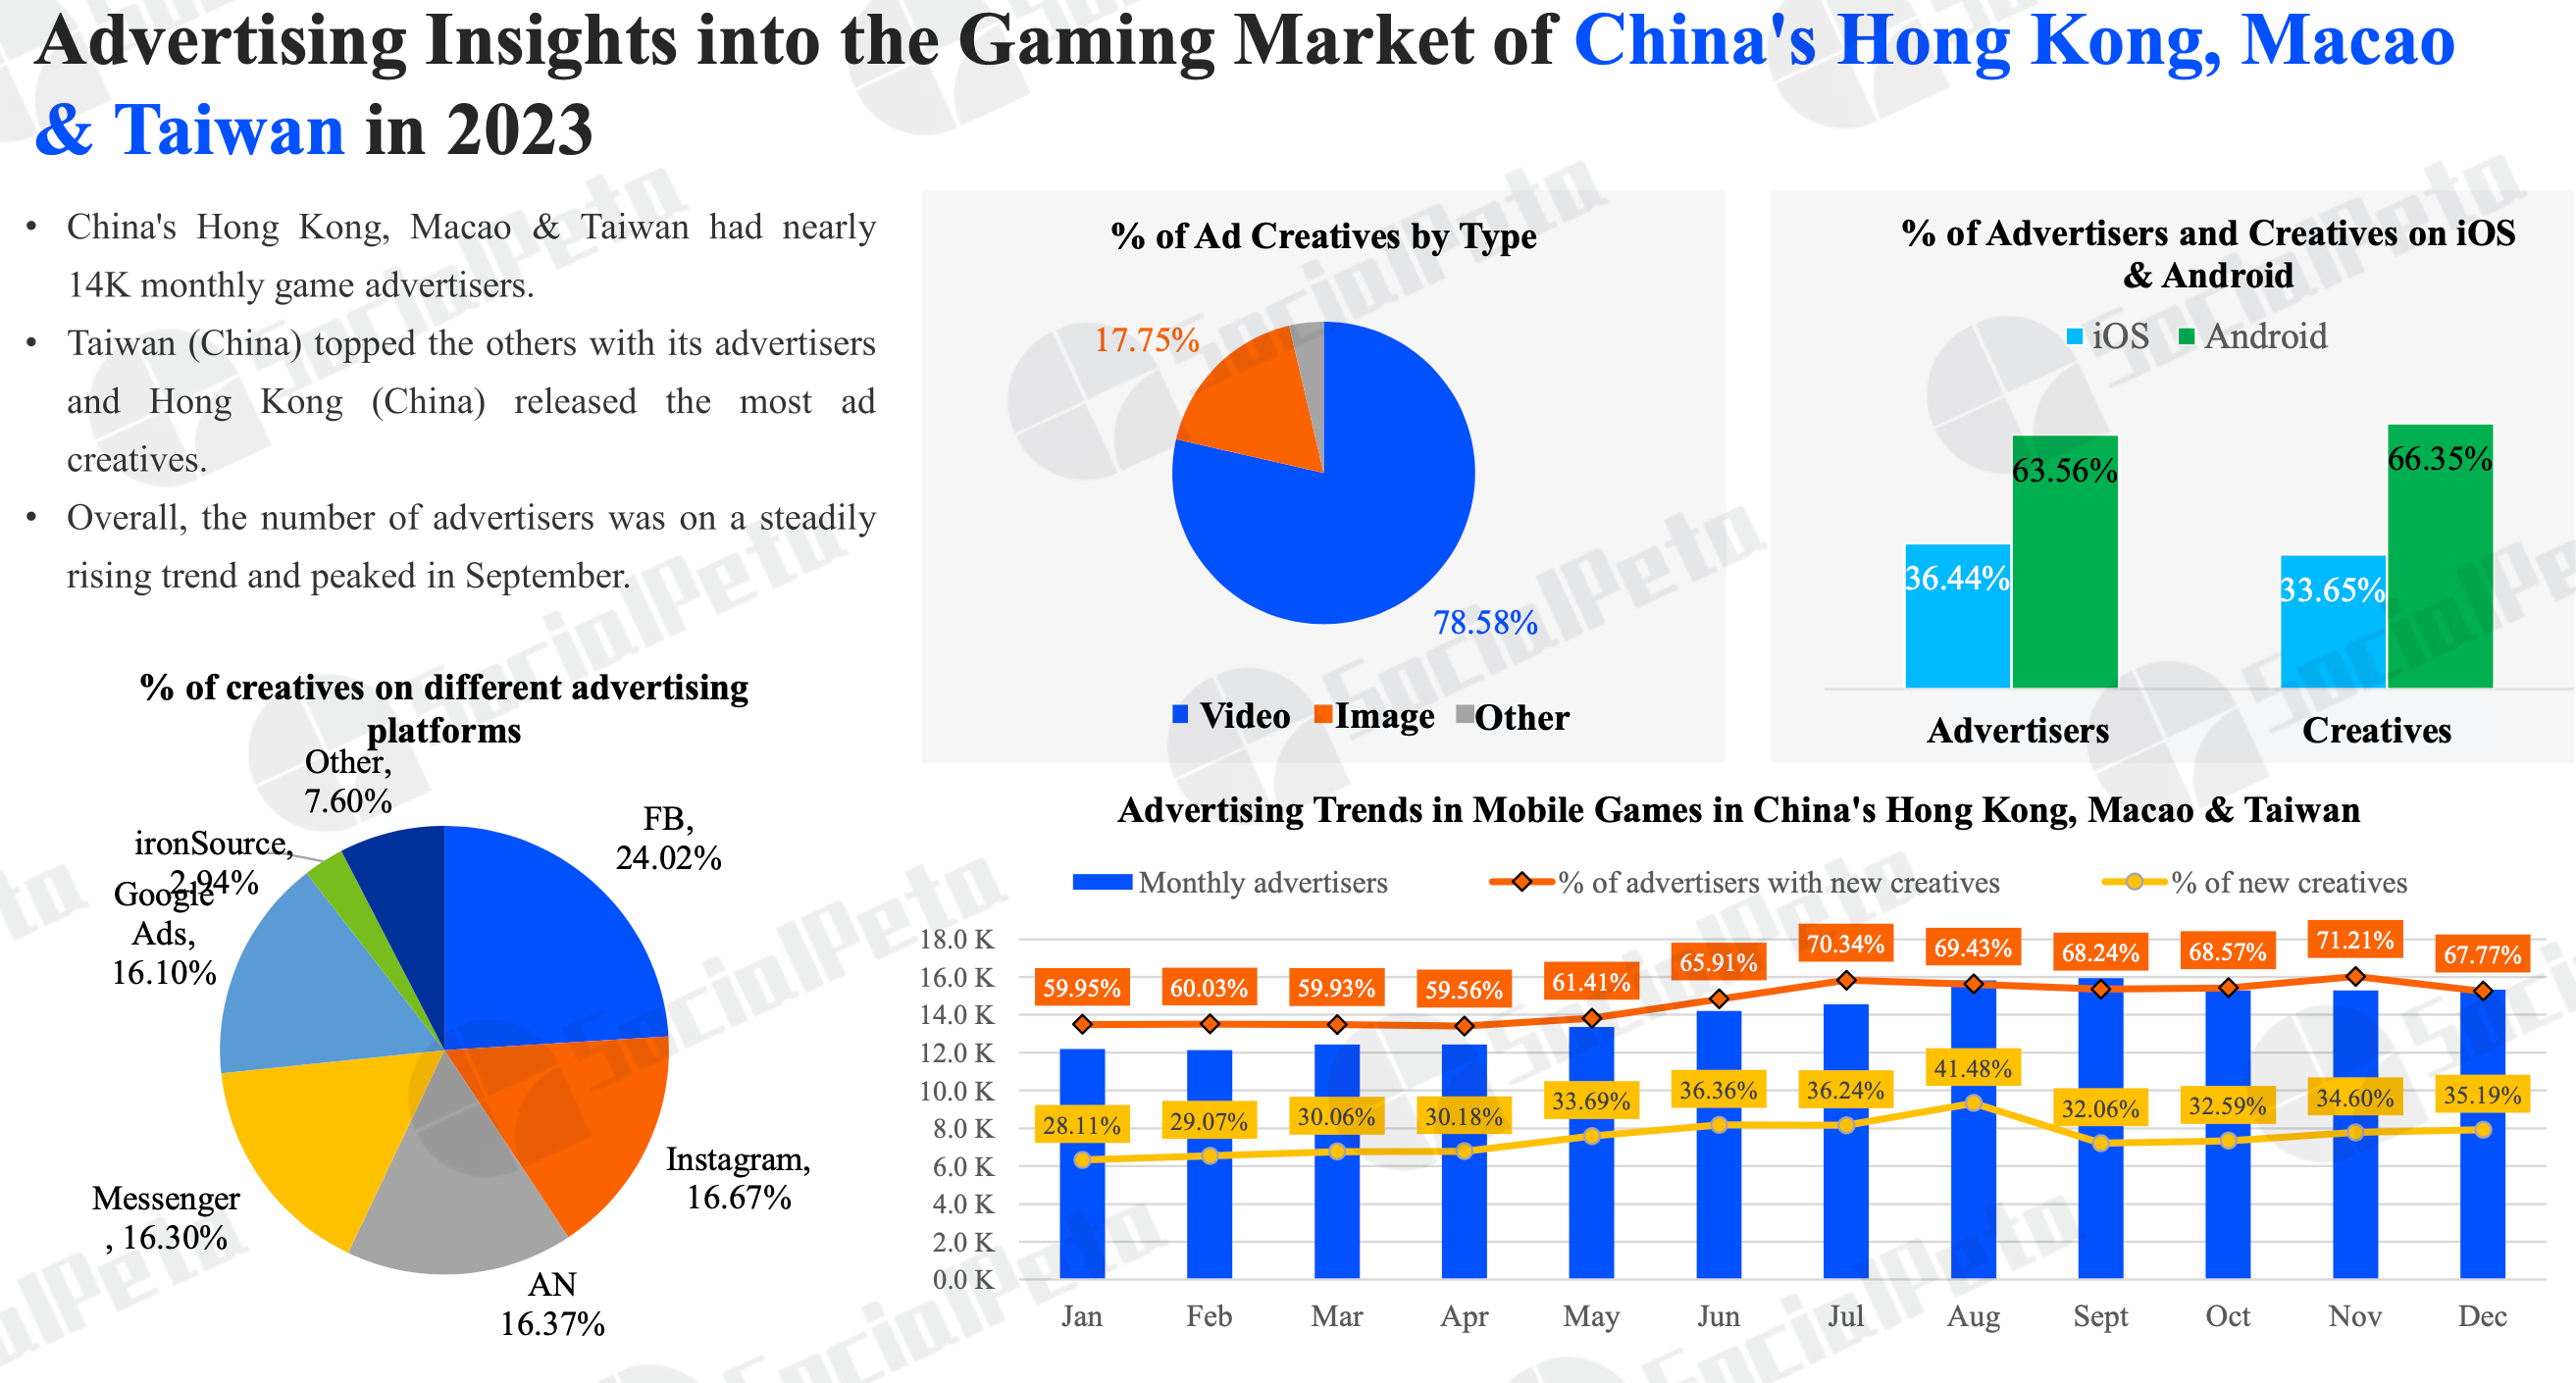
Taiwan and Hong Kong lead in the average number of creatives per advertiser.

In Southeast Asia, there are about 20 thousand advertisers. Interestingly, more than 50% of advertisers released ads for puzzles.

In South America, Brazil is the largest market both in terms of the number of creatives and advertisers. SocialPeta notes that Playables are very effective in the region.

The MENA region is the leading region in terms of the percentage of video creatives.
Genre Details

SLG games have the highest growth potential in Southeast Asia and the MENA region. Fake advertising, focusing on mini-games or sexualization of characters, leads to results.
Simulators (where SocialPeta includes idle games, life simulators, etc.) attract users through drama, guided by the fact that the majority of the audience are women.

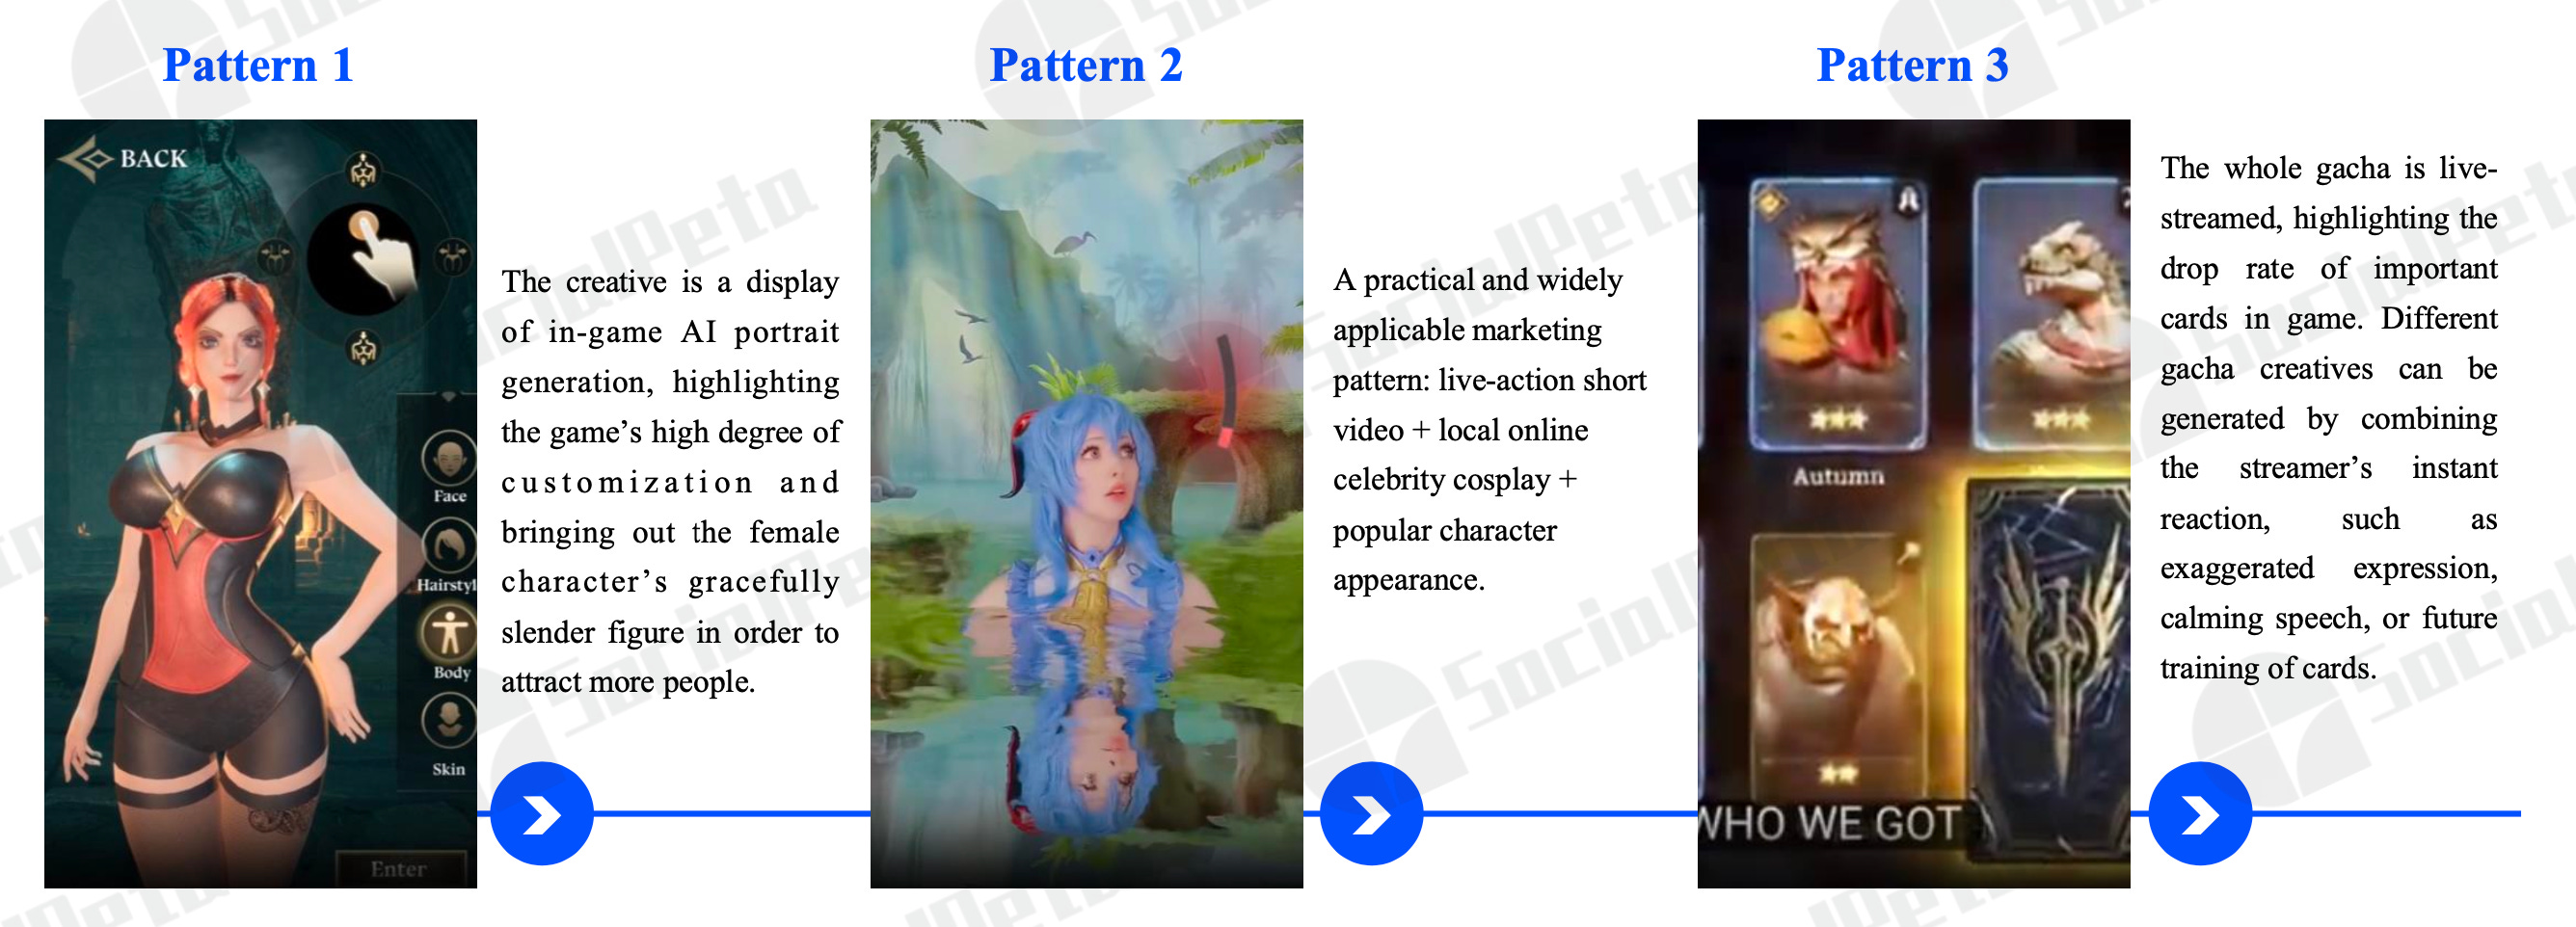
In the case of RPGs, unlike SLG projects, creatives demonstrating character creation are popular; UGC creatives; map demonstration; gacha, and other game features.
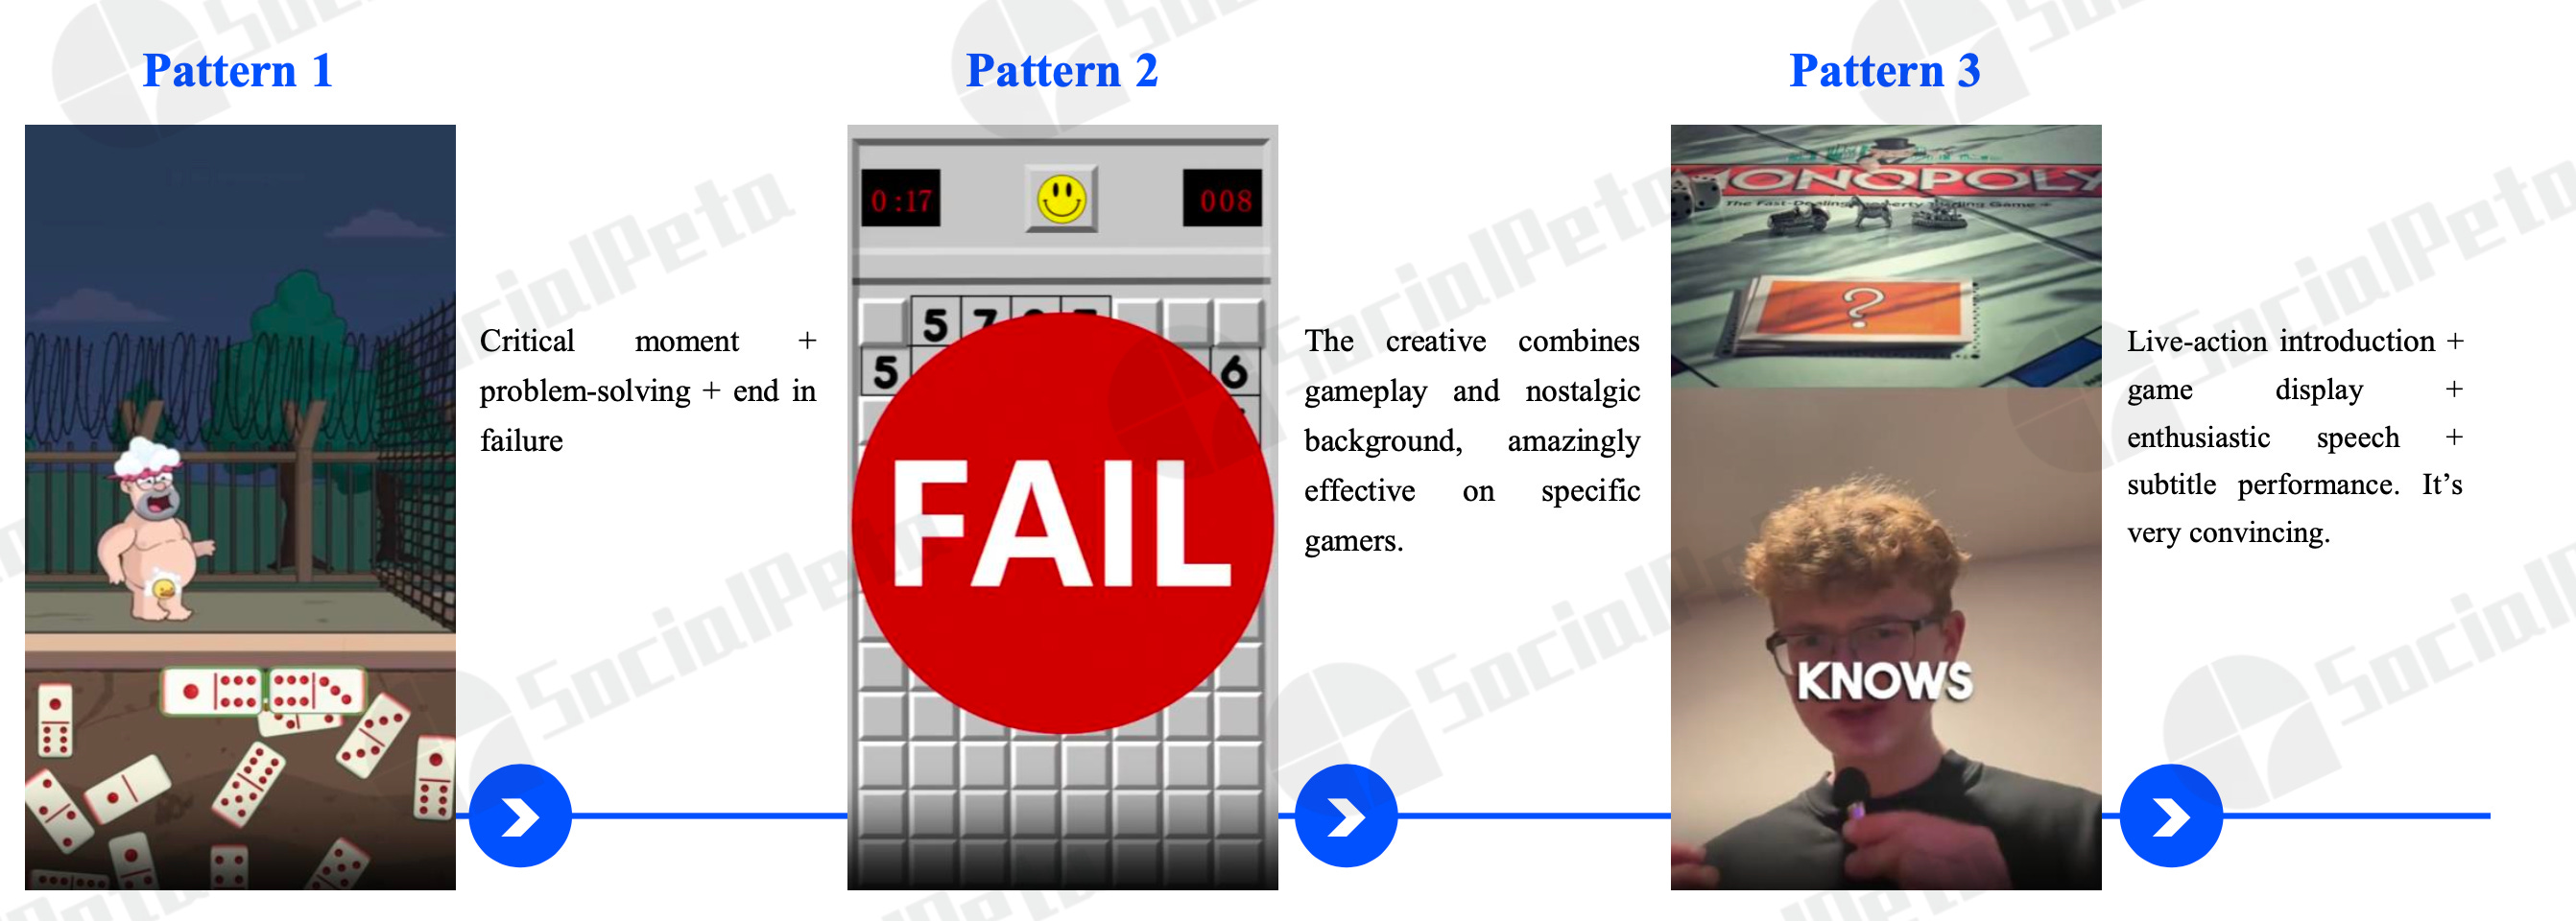
Board games are particularly popular in North America (largely due to MONOPOLY GO!) and Africa. Successful creatives focus heavily on social interaction & problem-solving creatives.
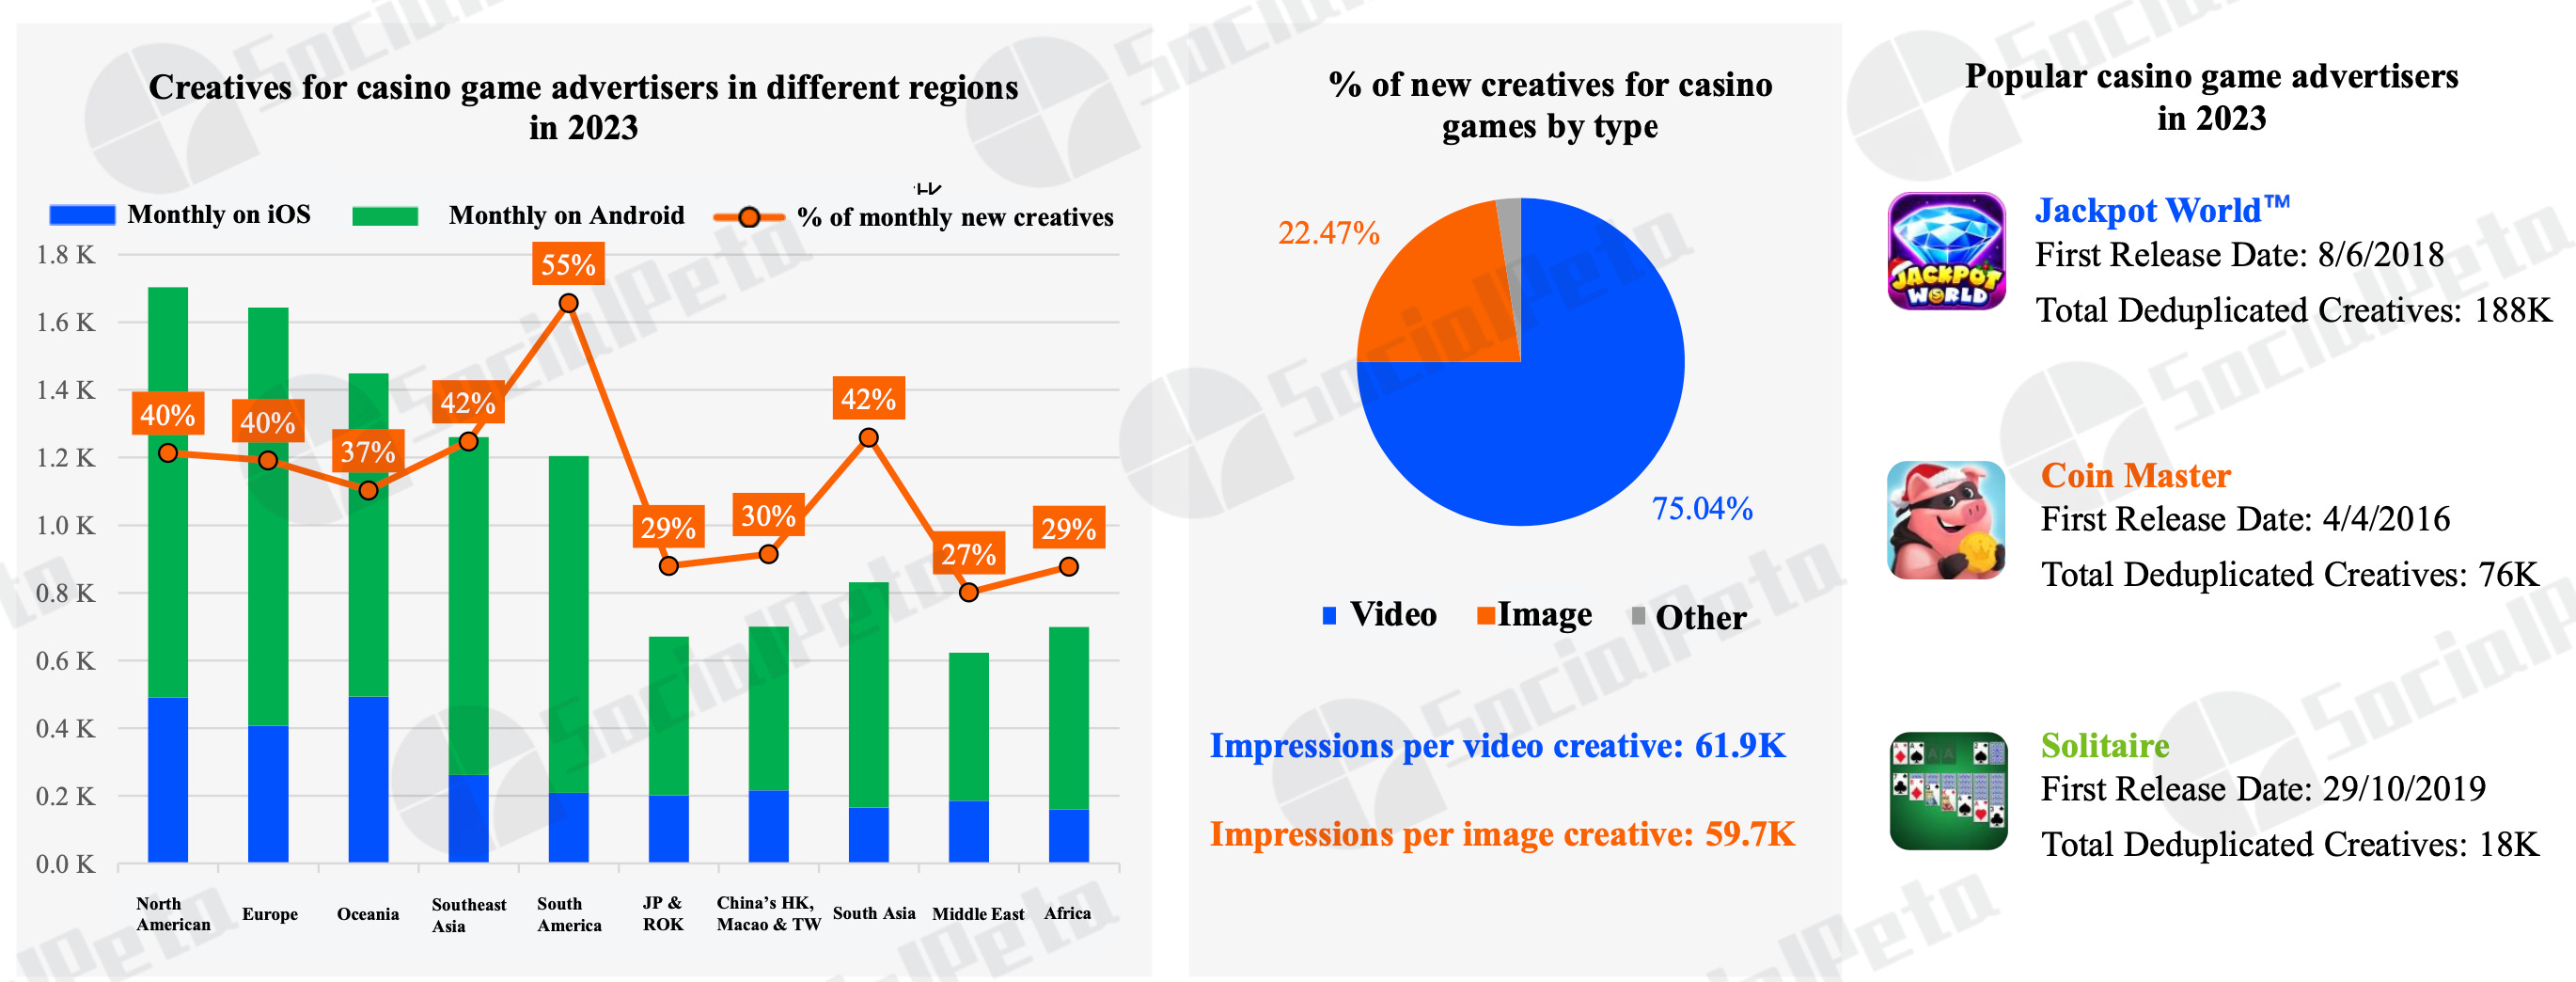
In the advertising structure of casino games, Android dominates. SocialPeta notes that old projects maintain their positions in this category for years. And successful creatives actively demonstrate money and the opportunity to win a big prize.
Hit Game Cases of 2023

For Honkai Star Rail, the main markets are the USA, Canada, and South Korea. 92.02% of all creatives are videos. Developers have released over 20 thousand creatives since the release.

For Whiteout Survival, the main focus is on the USA. In second and third places (with a large gap) are Canada and Germany. 75.56% of all creatives are videos, and it can be seen that the company increased the number of creatives (and probably spending) on iOS throughout the year. In total, over 33.1 thousand creatives were released.

For Arena Breakout, the main markets are Thailand, the USA, and Japan. The company actively worked with creatives and advertising in October-November 2023, but then reduced volumes. In total, over 13 thousand creatives were released.

MONOPOLY GO! - a project with a fairly evenly distributed advertising across countries. In first place, with a large margin, is the USA; but then followed by Canada, Australia, the Netherlands, France, Singapore. In total, Scopely released 26.3 thousand creatives for the project, 92.86% of which are videos.

Block Blast! - another notable release of 2023. Since the launch of the project, the company has made 60.5 thousand creatives, focusing on the USA, India, and Indonesia. 96.59% of these creatives are videos.
Mobile Marketing Trends in 2023
The most marketing budgets in 2023 were allocated to advertising with mini-games.
AI content began to be widely used in creative production. This is especially noticeable in the RPG genre, particularly MMORPG projects.
AppMagic: Lessons of 2023 for casual games
The analytical platform studied genres based on their performance in Tier-1 Western markets (USA, UK, Australia, Canada, France, Germany). Projects were considered successful if they earned over $50,000 per month in these markets (after deducting commissions and taxes). The data table is available via the link.
AppMagic highlighted 5 genres for detailed study: Merge-2 and Merge-3 with a meta; Match 3D; Match-3 with a meta; and Idle Tycoon.

Merge-2 with a meta
In 2023, 101 projects were released in this genre. None of them reached the $50,000 revenue mark per month or more on the selected markets. 0% Success Rate.
However, the genre itself grew by 73% compared to the previous year, fueled by existing projects. My Hamster Story started earning in Asia, but it's not considered in this study.

AppMagic categorizes projects within the genre into those based on quests (like Merge Mansion) and those based on orders (like Travel Town). The first category isn't doing well; only two projects were released in 2023, and Merge Mansion downloads dropped by 25%.

However, this didn't prevent Merge Mansion from leading the revenue chart by a large margin. The game earned $88.8 million in 2023. The closest follower, Gossip Harbor: Merge & Story, earned $43.9 million.

Despite no successful releases in 2023, the top 10 revenue-wise saw significant changes. Three new projects released in 2022 entered it. It's possible that projects in this genre require more time to demonstrate significant results.

Match 3D
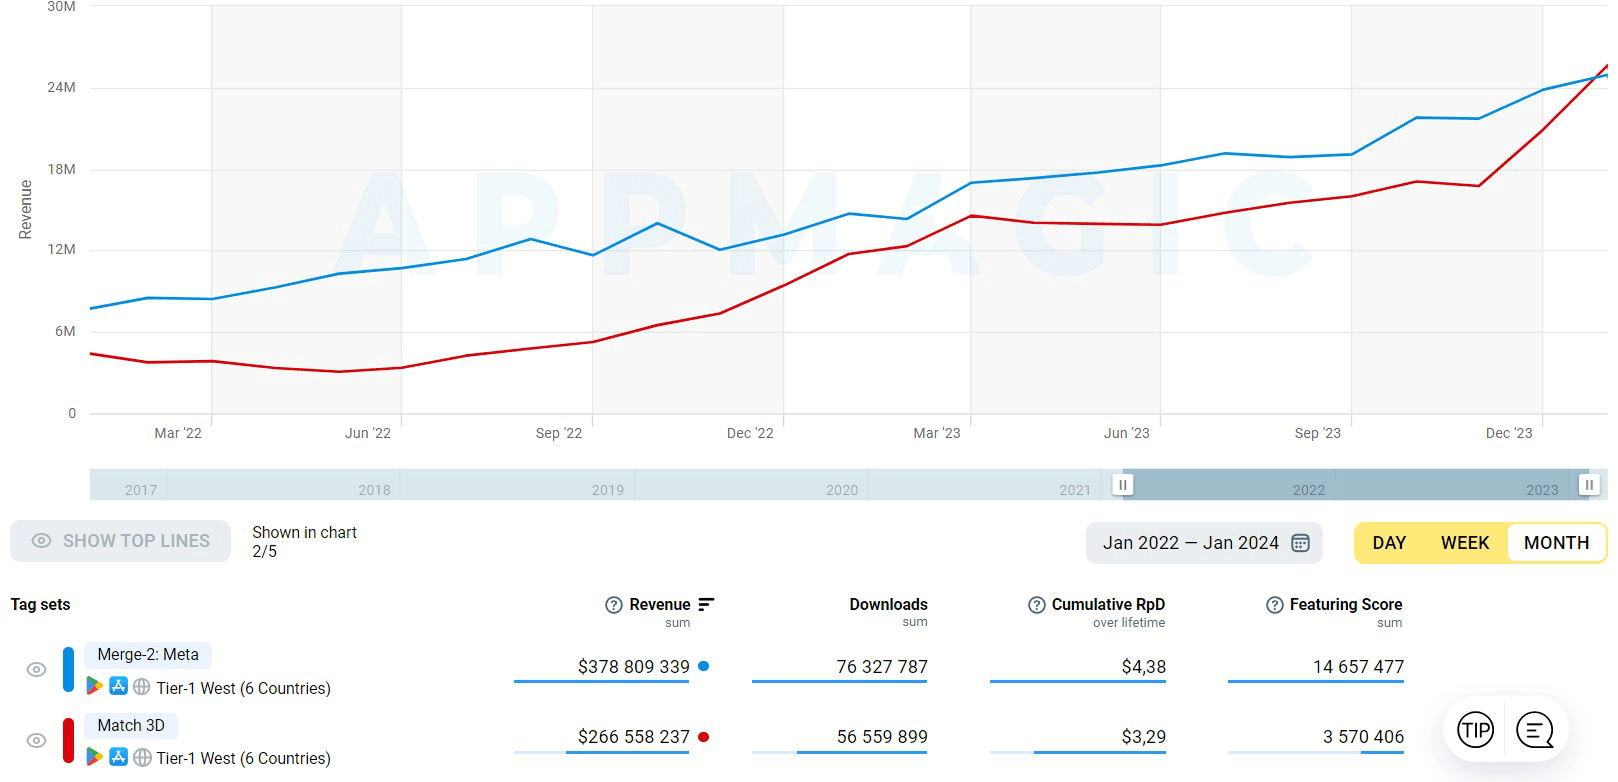
65 games in this genre were released in 2023. 5 projects were marked as successful, with a success rate of 8%.
Immediately, 4 projects released in 2023 earned over $1 million in December 2023. And Triple Match 3D crossed the $10 million mark.

Despite the niche's growth, AppMagic fears that the window of opportunity may soon close. Standing out among competitors may help by releasing games with more complex goals.
Idle Tycoon

412 games were released in 2023; 3 of them were successful. Success Rate - 0.7%.
Isekai: Slow Life earned 25% of the genre's total revenue in December 2023.

Frozen City reached its revenue peak in January 2023 and peak downloads in March. After that, the project declined, presumably because developers switched to more efficiently monetized Whiteout Survival.
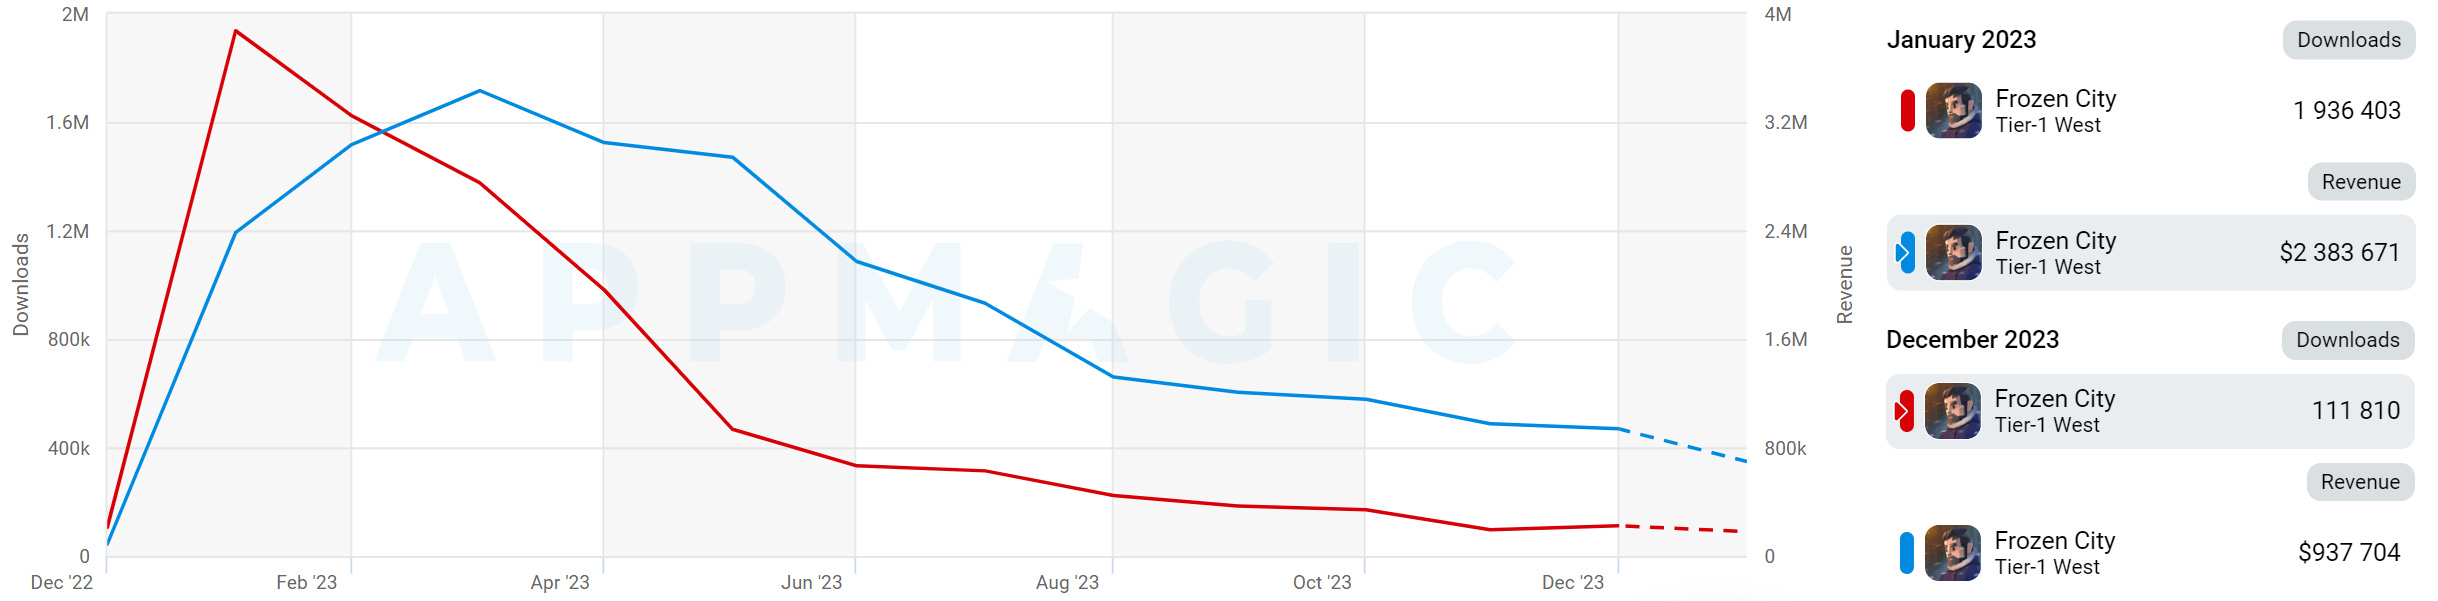
The genre, overall, is very competitive. Besides constant game improvements, attention to LiveOps and monetization is required.
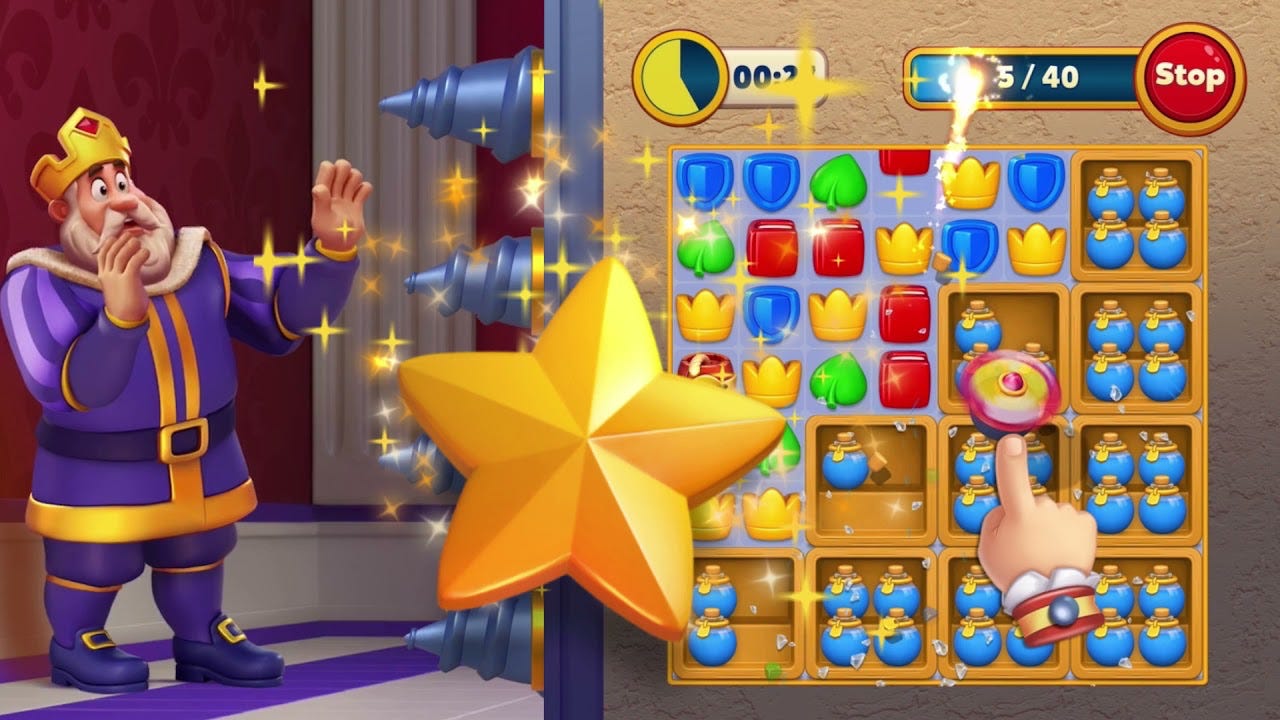
Match-3 with a meta
162 projects were released in 2023. 4 successful projects (6 if counting Asian markets). Success Rate - 2.5%.
Contrary to the market's general state, Match-3 with a meta grew in revenue in 2023, largely thanks to Royal Match and Gardenscapes.

Chrome Valley Customs is the only project in the genre that managed to enter the top 10 revenue-wise. Interestingly, another similar project - Forza Customs - Restore Cars - is attempting to target a male audience with Match-3, a genre historically considered female-oriented.
Merge-3 with a meta

41 projects were released in 2023; 3 of them were successful. Success Rate - 7.3%.
AppMagic notes that the genre has a very high entry barrier - expensive and complex in development.
None of the successful projects in the genre released in 2023 came close financially to EverMerge and Merge Dragons.
GSD & GfK: The UK gaming market (PC & Console) declined in February 2024
")
Analytical platforms report only actual sales figures obtained directly from partners. The mobile segment is also not taken into account.
Game Sales
2.77 million games were sold on PC and consoles in the UK in February 2024. This is 5.5% less than in February of the previous year.
Important note: Palworld was not taken into account in the calculation.
Analysts note that the 5.5% decline is actually a good result because Hogwarts Legacy was released in February last year.
Replacing the wizards, Helldivers II emerged as the sales leader by a significant margin. Moreover, in the second week, the game sold 115% better than in the first week, and in the third week, it sold 21% better than in the second week. 57% of the project's sales were for the PlayStation 5 version.
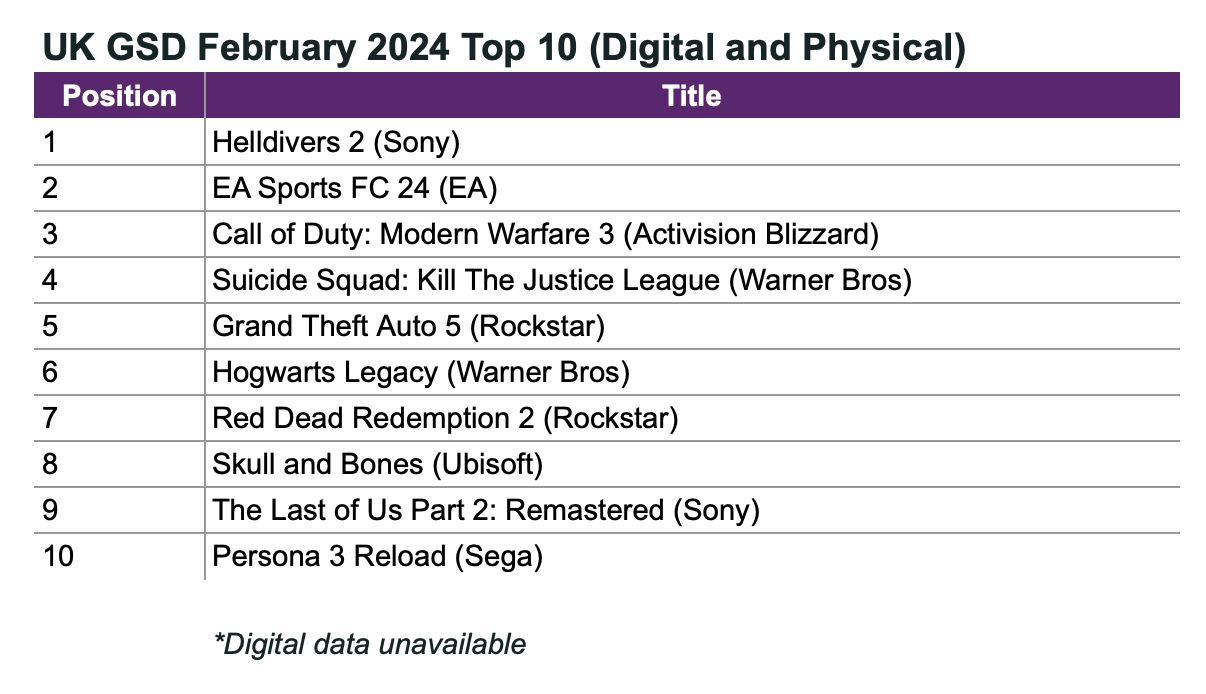
The sales of Helldivers II for the first 3 weeks are only 28% lower than those of Marvel’s Spider-Man 2 in the UK.
Suicide Squad: Kill the Justice League debuted at the 4th position on the chart. Sales after the first 4 weeks were 20% lower than those of Gotham Knights and Marvel’s Guardians of the Galaxy. The publisher is dissatisfied.
Skull and Bones debuted at the 8th position. The sales of Ubisoft's AAAA game after the first two weeks were 75% lower than those of Sea of Thieves in March 2018.
Hardware Sales
95,855 consoles were sold in the UK in February. This is 33% less than the previous year and 13% less than January.
PS5 is the sales leader. However, the trend is negative, with sales being 2% lower than January and 28% worse than the previous year.
Nintendo Switch takes the second place; Xbox Series S|X is third.
Overall, console sales in the UK at the end of February are 29% worse than the previous year. However, this is more likely due to deferred demand realized in 2023.
609.4 thousand accessories were sold in February. This is 12% less than January but 16% higher than February 2023. DualSense is the most successful accessory.
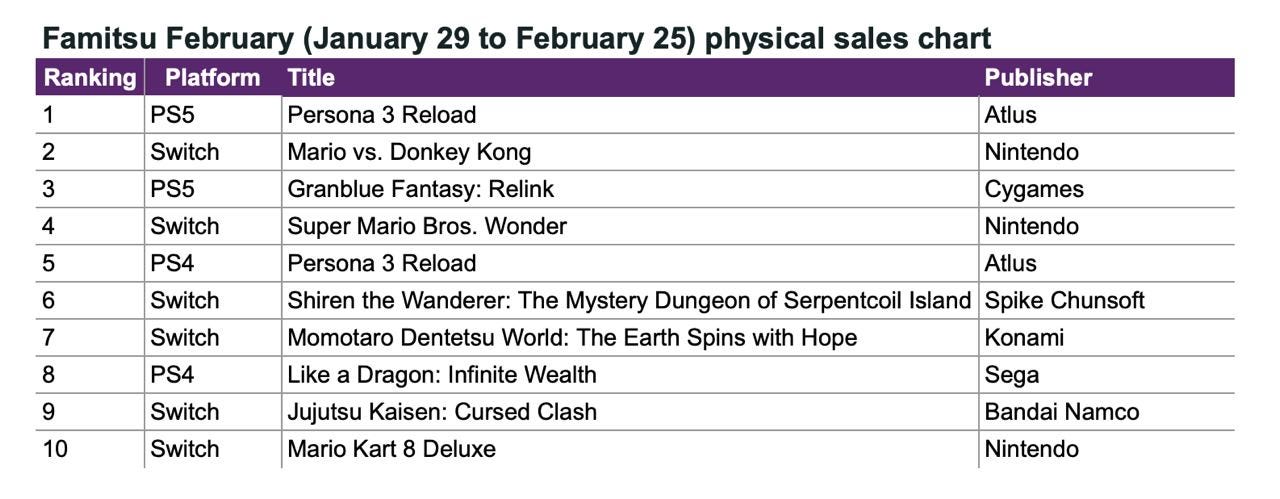
Famitsu: Persona 3 Reload tops Japanese retail chart in February 2024

Famitsu only takes physical sales into account.
Game Sales
For the first time in 8 months, a PlayStation game topped the Japanese chart - Persona 3 Reload. The game sold 95 thousand (physical) copies on PS5, with the PS4 version selling 52 thousand copies.
Second in sales was Mario vs. Donkey Kong (89k copies).
In third place is Cygames with their Granblue Fantasy: Relink - 63 thousand copies.
However, this did not prevent Nintendo from leading the chart of the most successful publishers by a large margin. Nintendo's physical games were bought 399 thousand times in February (30% of the total market); Atlus - 153 thousand times (12%); Cygames - 93 thousand times (7%).
Console Sales
The success of Persona 3 Reload did not help to move Nintendo Switch from the top position. The console was bought by 191 thousand people in February.
PlayStation 5 sold 147k systems in February.
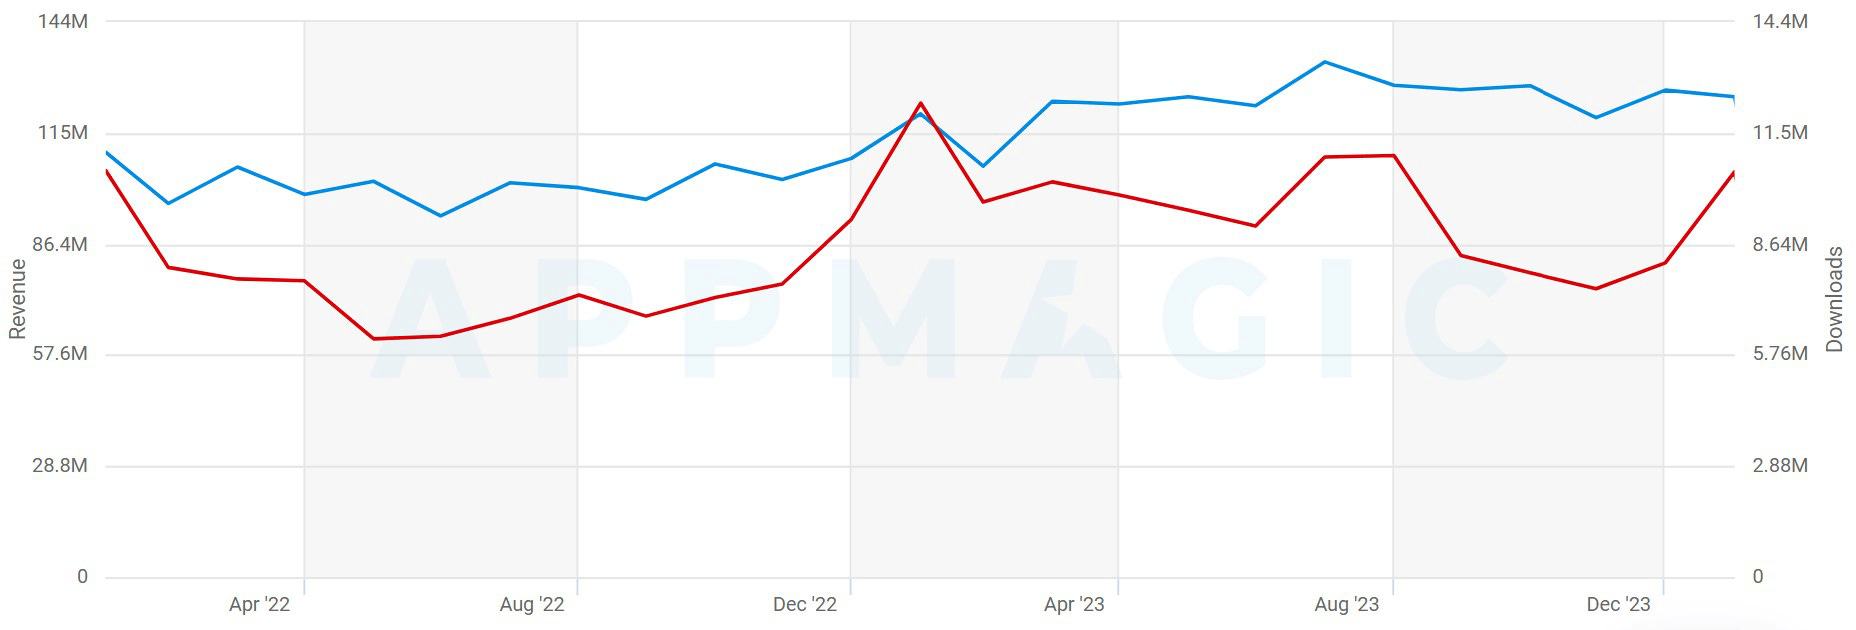
Monopoly GO! has earned over $2B
It took the game 10 months to reach this milestone.
Analytical services do not see a significant portion of the project's revenue. For example, according to AppMagic data, the game earned $919.6 million after deducting platform fees and taxes. Similar figures, around $897 million, are shown by data.ai.
SVP Scopely, Jamie Berger, noted at last week's Think Games conference in Istanbul that Monopoly GO! is a very profitable game.
StreamElements & Rainmaker.gg: State of the Streaming Market in February 2024
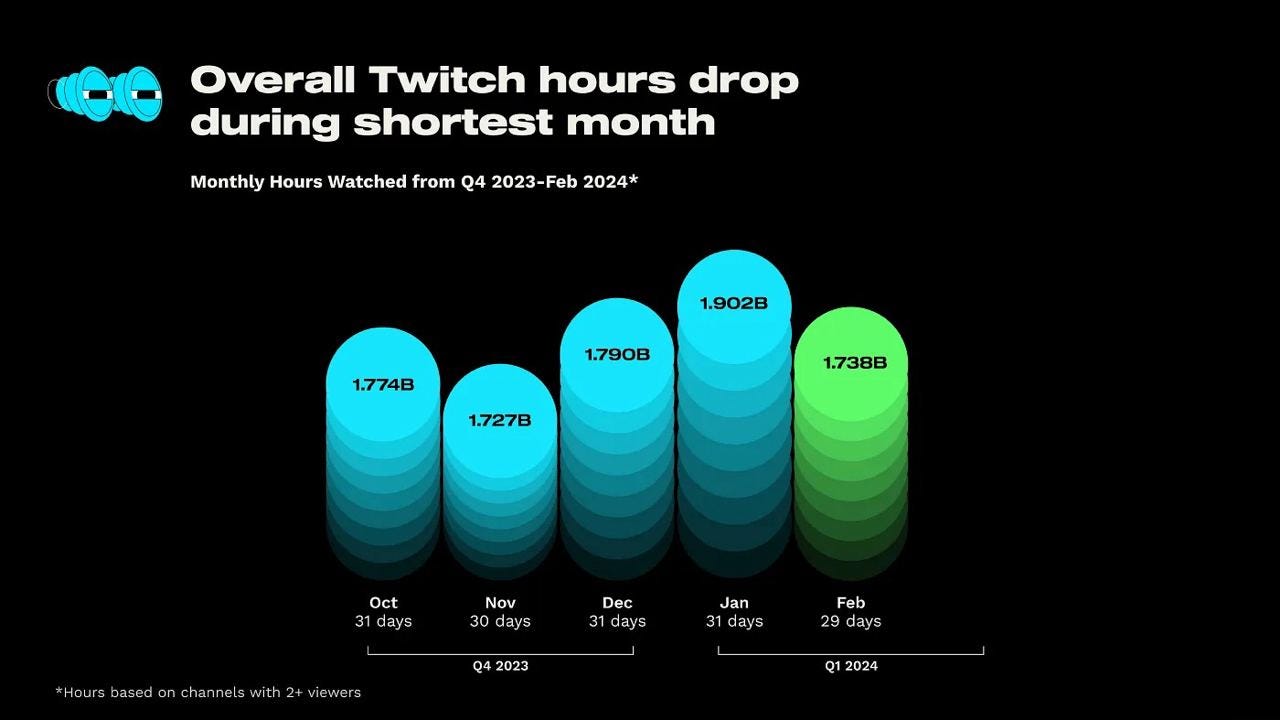
The total number of watched hours in February 2024 amounted to 1.73 billion. This is less than December and January, but the month is shorter. Moreover, the figure is higher than in November 2023.
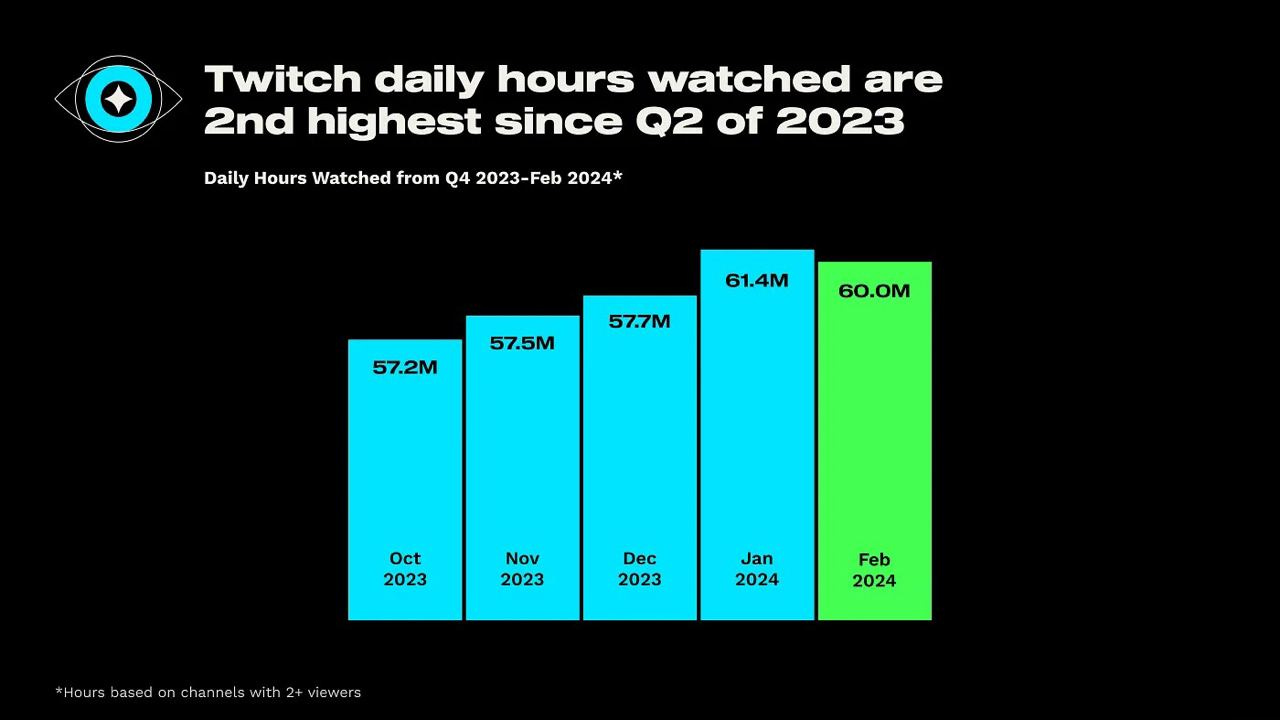
The average number of watched hours per day - 60 million - is the second highest since the second quarter of 2023. Only January 2024 had more.
Helldivers II failed to make it into the top 10 in terms of views. The game took the 14th position with 19 million watched hours.
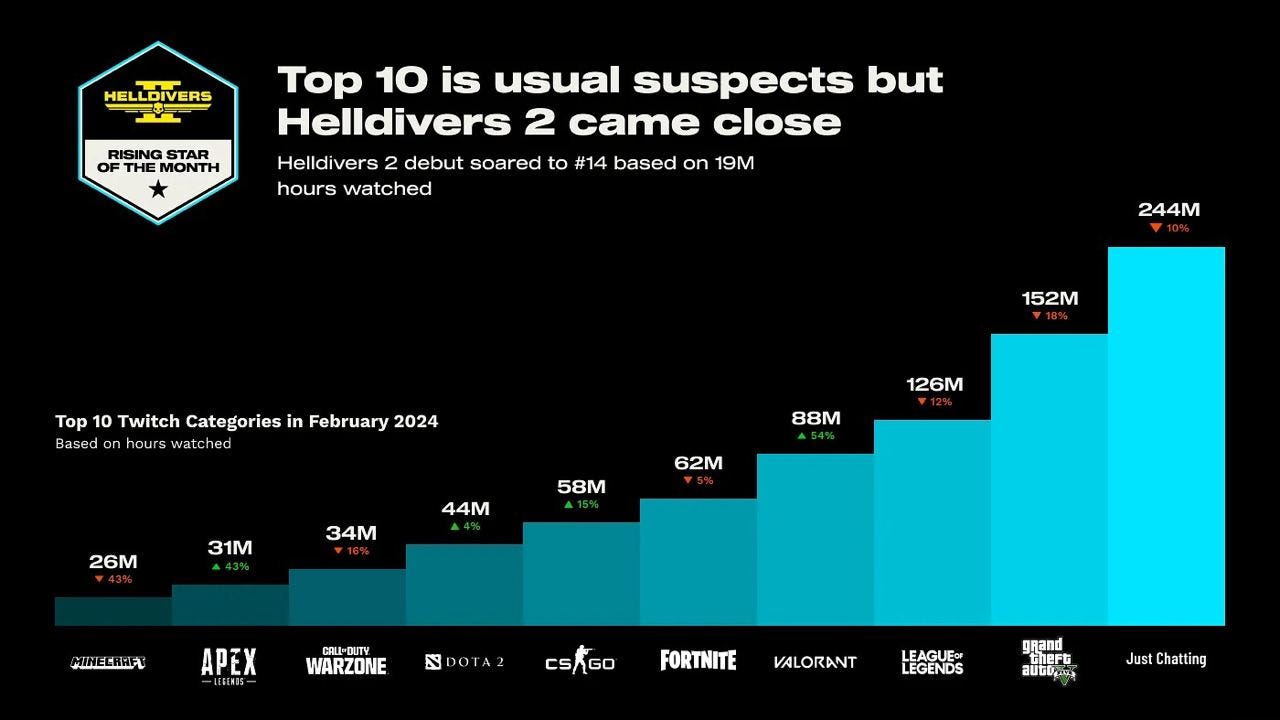
The leaders are Grand Theft Auto V (152 million hours), League of Legends (126 million hours), and Valorant (88 million hours).
80 Level: 45.6% of the game industry workers are living from a paycheck to a paycheck
The company surveyed over 1000 employees in various positions within the gaming industry.
❗️Given the portals audience, the survey sample predominantly included programmers, artists, and animators. There might have been a smaller sample among marketers, service department employees, business development personnel, and management.
39.6% of gaming industry employees earn less than $40,000 per year. 19.7% earn less than $20,000 per year.
34% earn between $40,000 and $80,000 per year.
15% have salaries ranging from $80,000 to $150,000 per year.
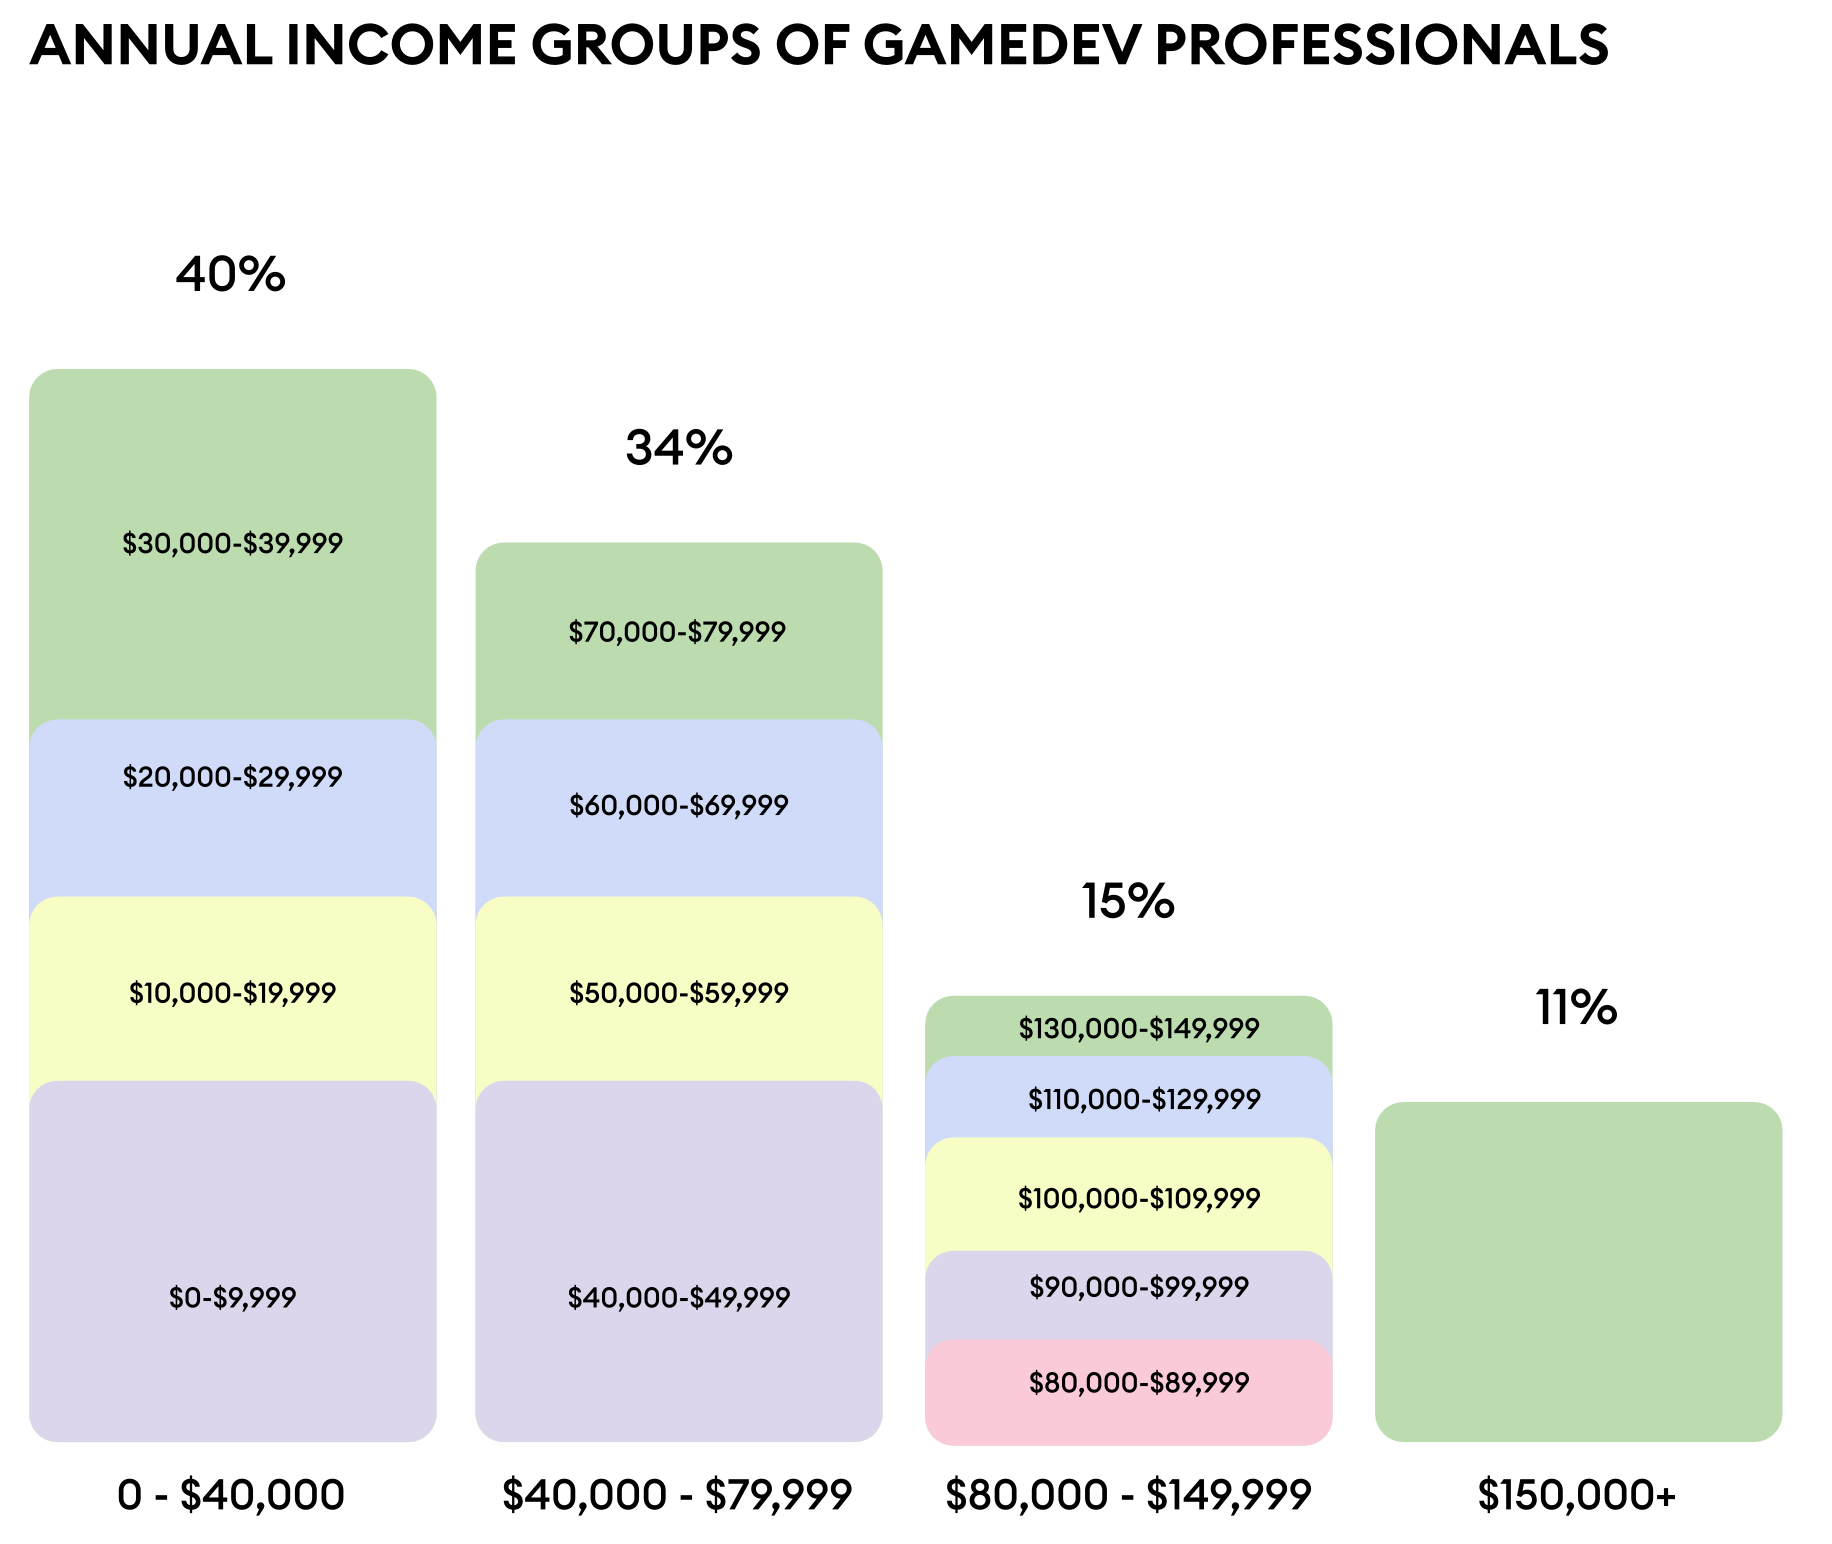
11% of gaming industry employees earn over $150,000 per year.
Costs of Living
7.7% of developers noted difficulties in meeting basic needs (such as buying food and paying bills).
6.2% have their basic needs covered but cannot afford clothing.

17.4% have these needs covered but struggle with purchasing more expensive household items.
The next category - 22% - can afford all of the above, but buying a car is out of reach for them.
24.4% of employees (who do not fall into the previous groups) have problems buying housing.
Only 16.6% can afford everything they want. The remaining percentage had difficulty answering.
This means that 45.6% of gaming industry employees are working "paycheck to paycheck." They can afford food, clothing, and housing expenses, but purchasing anything more significant is challenging for them.
Regional Differences

A large number of respondents from North America (USA and Canada) earn salaries of $100,000 and above.
In Western Europe (including the UK), the salary range is between $30,000 and $80,000. In France, for example, most industry workers have annual salaries ranging from $20,000 to $49,000.
Salaries in Spain and Poland are lower than the European average.

54% of game developers from India earn less than $10,000 per year.
Salary Expectations in Asia

Quite a few workers and employers from Asia do not expect salary changes in 2024.
The majority of employers believe that salaries should be increased by up to 6% in 2024.
However, employees' expectations are somewhat higher - they would like to see a greater increase.
Salaries and Experience
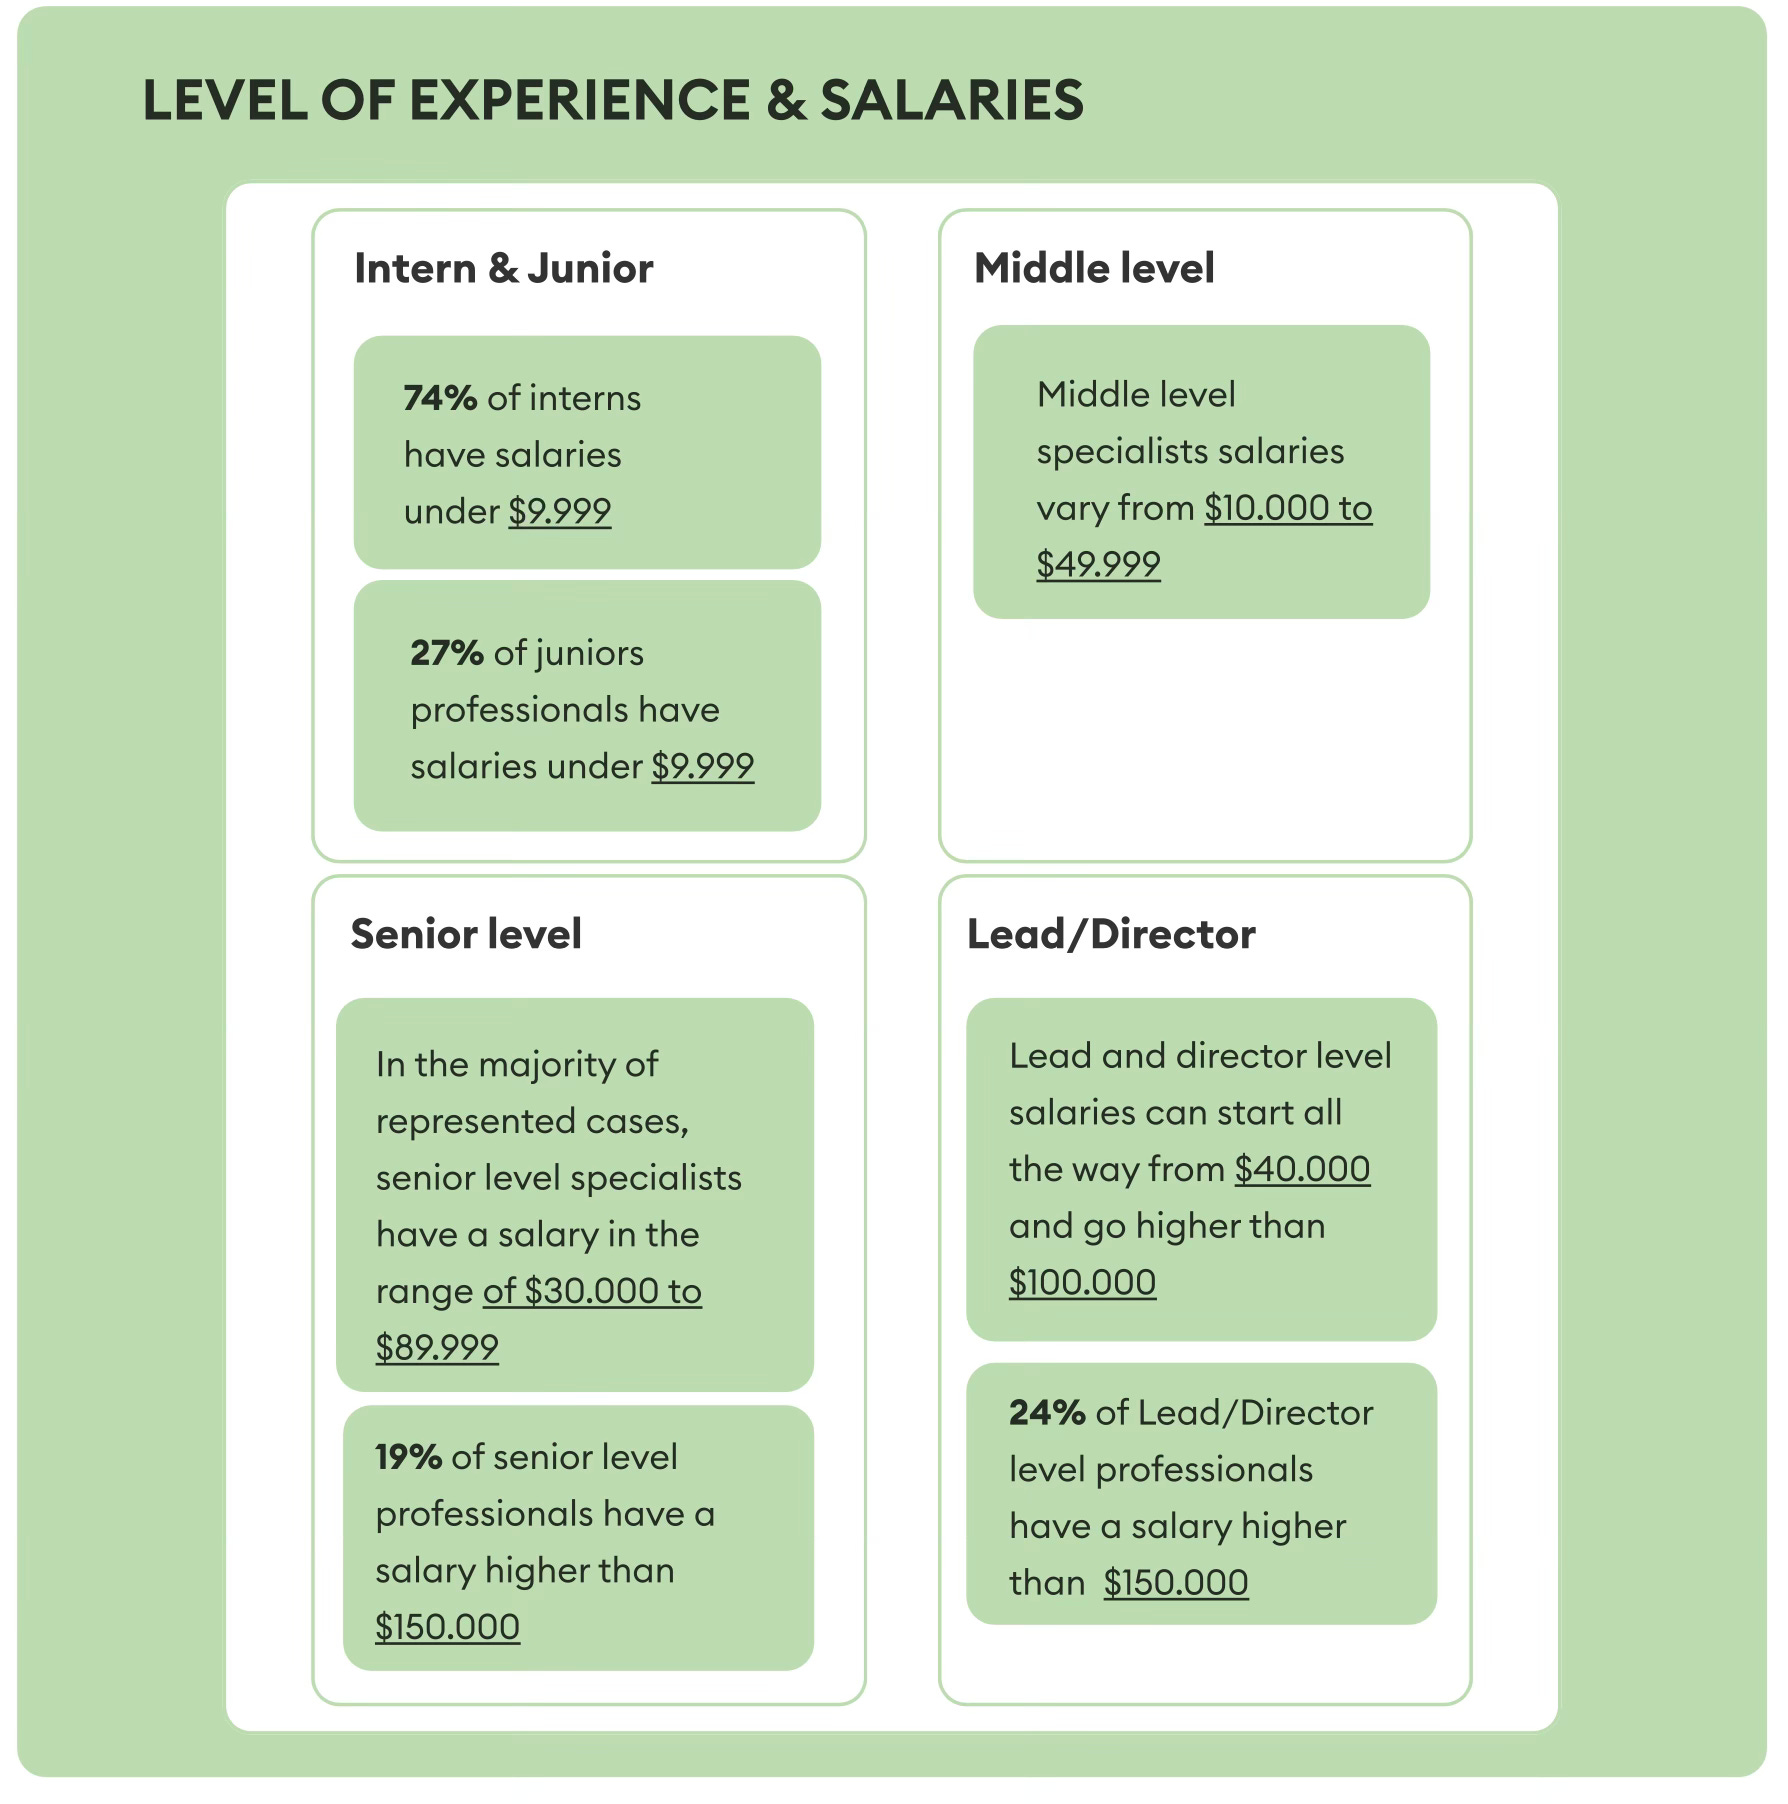
74% of interns and 27% of young professionals earn less than $10,000 per year.
Mid-level specialists earn between $10,000 and $50,000 per year.
In most cases, Senior-level employees earn between $30,000 and $90,000 per year. 19% of such specialists earn salaries above $150,000.
Team leads and managers earn between $40,000 and $100,000. 24% of them earn above $150,000.

41% of C-level specialists earn more than $150,000 per year. Surprisingly, even among specialists of this level, 19% noted that they struggle to make ends meet. 22% cannot afford to buy a house or apartment.