

Weekly Gaming Reports Recap: March 25 - March 29 (2024)
Three big reports - from Unity (Gaming in 2024); Mistplay (Paying users in 2024), and Circana (US market in February 2024).

Reports of the week:
Circana: The US Gaming Market in February 2024
Unity: Gaming in 2024 Report
Mistplay: Paying Users in Mobile Games in 2024
Circana: The US Gaming Market in February 2024

General numbers
The revenue of the US gaming market in February 2024 amounted to $4.714 billion, which is 2% higher than the previous year.
Game sales in February increased by 5% compared to last year ($4.146 billion); hardware sales decreased by 30% ($349 million); accessory sales grew by 25% ($219 million).
For the first 2 months of February 2024, the American gaming market shows dynamics 8% better than in 2023.
This is due to accounting peculiarities - for the first 2 months of 2024, there was one extra counted week in January 2024.

PlayStation 5 became the sales leader in the USA. Nintendo Switch ranks second in unit sales; Xbox Series S|X - in second place in terms of dollars.
PlayStation Portal became the most successful accessory in February by revenue.
PC/Console Charts

Helldivers II, Final Fantasy VII: Rebirth, and Call of Duty: Modern Warfare III were the best-selling projects in February 2024.
Among the new releases, Skull and Bones (4th position) and Mario vs. Donkey Kong (11th position) also made it to the chart.
At the moment, Helldivers II tops the list of the best-selling games of 2024 in the USA.

Helldivers II ranked 7th in the list of the best-selling Sony games in the USA. Approximately 60% of sales came from Steam.
Mobile Charts
MONOPOLY GO!; Royal Match, and Roblox - this is the top three revenue generators on mobile devices in February in the USA.
February revenue from mobile games in the USA grew by 17% YoY. Sensor Tower analysts believe this is due to MONOPOLY GO!.
Pokemon GO had a successful event in February, allowing the game to earn 60% more than in January.
Games by Platforms

The leaders in MAU (Monthly Active Users) on PS5 in the USA remain unchanged - Fortnite; Call of Duty, and GTA V. Helldivers II - ranks 7th.

When considering sales, Helldivers II; Final Fantasy VII: Rebirth, and Call of Duty: Modern Warfare III were the best-selling games on PS5 in February.

On Xbox, the situation is the same, with one difference - instead of GTA V, Palworld ranks third. The sales leaders were Call of Duty: Modern Warfare III; Skull and Bones, and Madden NFL 24.

The release of Dead Island 2 on Xbox Game Pass Ultimate helped the game rise from 121st place by MAU in January to 8th in February.
The largest games by MAU on Steam are Helldivers II, Palworld, and Counter-Strike 2.

The best-selling games on Nintendo platforms in February in the USA are Mario vs. Donkey Kong; Super Mario Bros. Wonder; Mario Kart 8. All - excluding digital versions.

Unity: Gaming in 2024 Report

Data was collected from Unity Engine; Unity Cloud, and ironSource. All platforms were taken into account. In addition, Unity conducted a survey with more than 7,000 respondents.
5 Key Trends
Developers are integrating AI into their processes to accelerate development.
Studios are changing their approaches to monetization. More attention is being paid to advertising amid the decline in IAP revenue.
Studios of all sizes are releasing more cross-platform projects.
Developers are prioritizing multiplayer projects despite the complexity in their development.
Developers are now trying to build strong franchises rather than just games.
AI Usage in Games
The average game development time has increased from 218 days in 2022 to 304 days in 2023. To speed up processes, studios are seeking new solutions - but they still face difficulties. 40% spend a lot of time in the R&D process; for 37%, a significant amount of time is spent on integrating new technologies; for 31%, it is challenging to maintain project deadlines and scope when applying new technologies.

The most common areas of AI application in development are improving animations (46%); writing code (37%); generating art and levels (36%); narrative design (36%); automated playtests (36%); difficulty adaptation (35%); moderation of voice and text chats (33%).

Prototyping takes less than 3 months for 96% of studios. For 42%, it takes less than one month. 68% of respondents noted that AI helps speed up this process. This is confirmed by the numbers - in 2022, 85% of studios prototyped in less than 3 months.

56% of studios that have integrated AI into their processes use the technology for world-building. Among the most popular use cases are creating NPCs, generating unique gameplay moments, speech recognition, and contextual NPC responses.

AI is most commonly used by AR/VR developers (29%), multiplayer game creators (28%), casual developers (27%), open-world projects (25%), and RPG games (25%).

The main challenges in integrating AI are lack of time (43%), lack of technical skills (24%), and unawareness of AI capabilities (20%).

51% of studios have fewer than 1000 assets; 35% have between 1001 to 5000; 9% have between 5001 to 50,000; and 5% have over 50,000. According to developer surveys, 20% spend more than 4 hours per week structuring asset bases. AI can help with this.

Mobile Market Status and Revenue Sources
According to Unity data, DAU (Daily Active Users) in mobile games increased by 4.5% in 2023 compared to 2022.

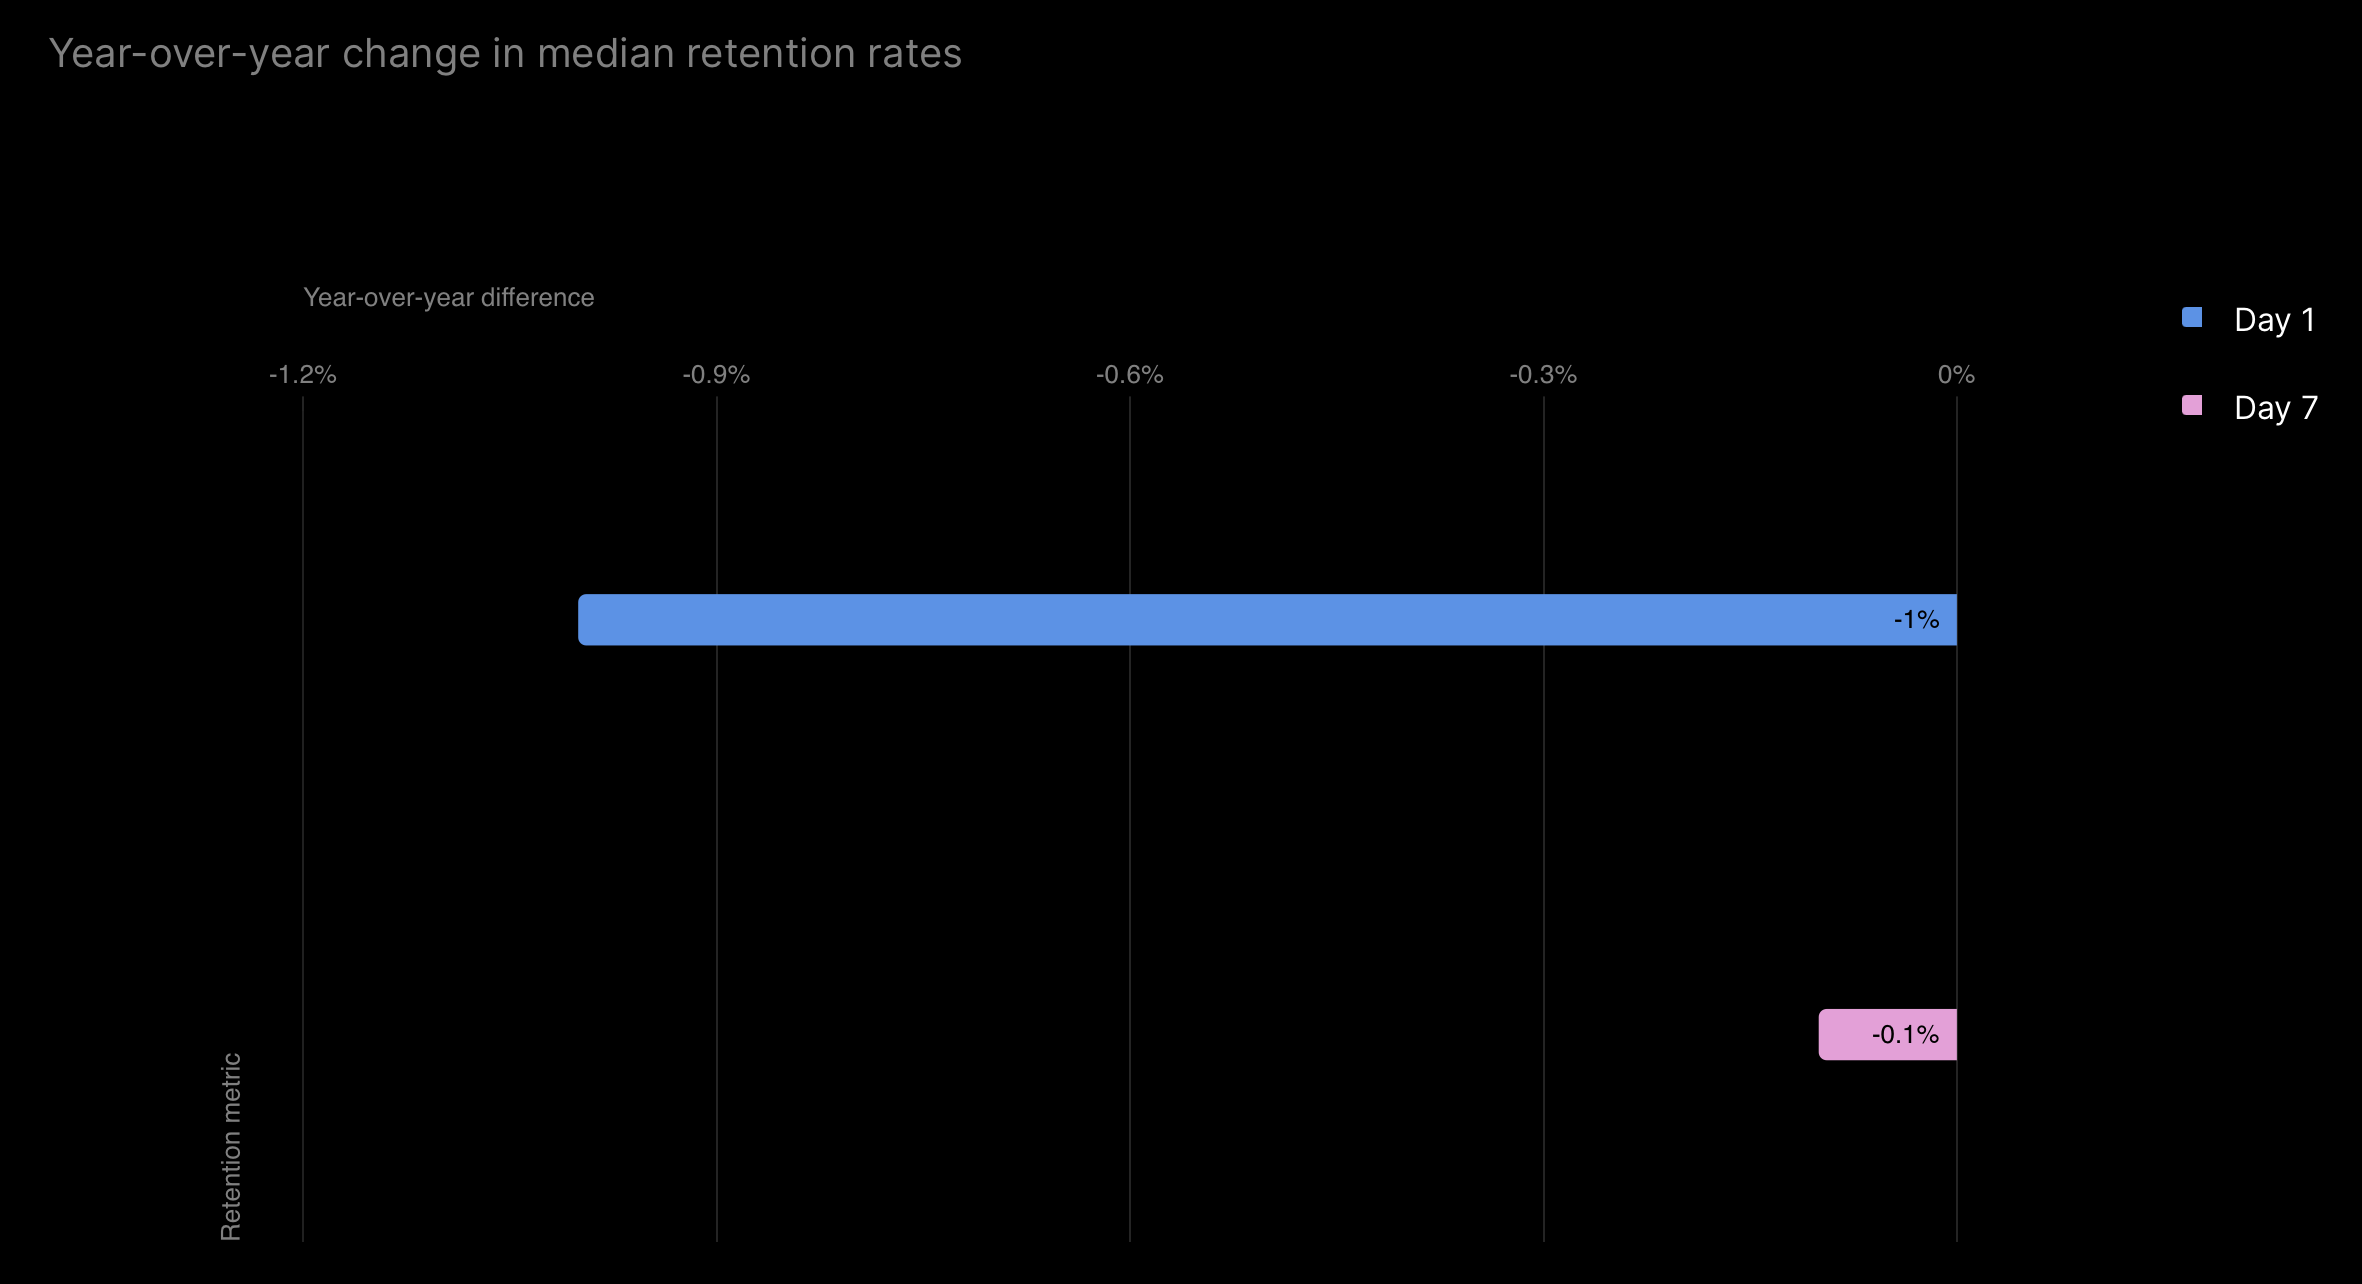
The average figures for D1 Retention decreased by 1%; D7 Retention decreased by 0.1%.
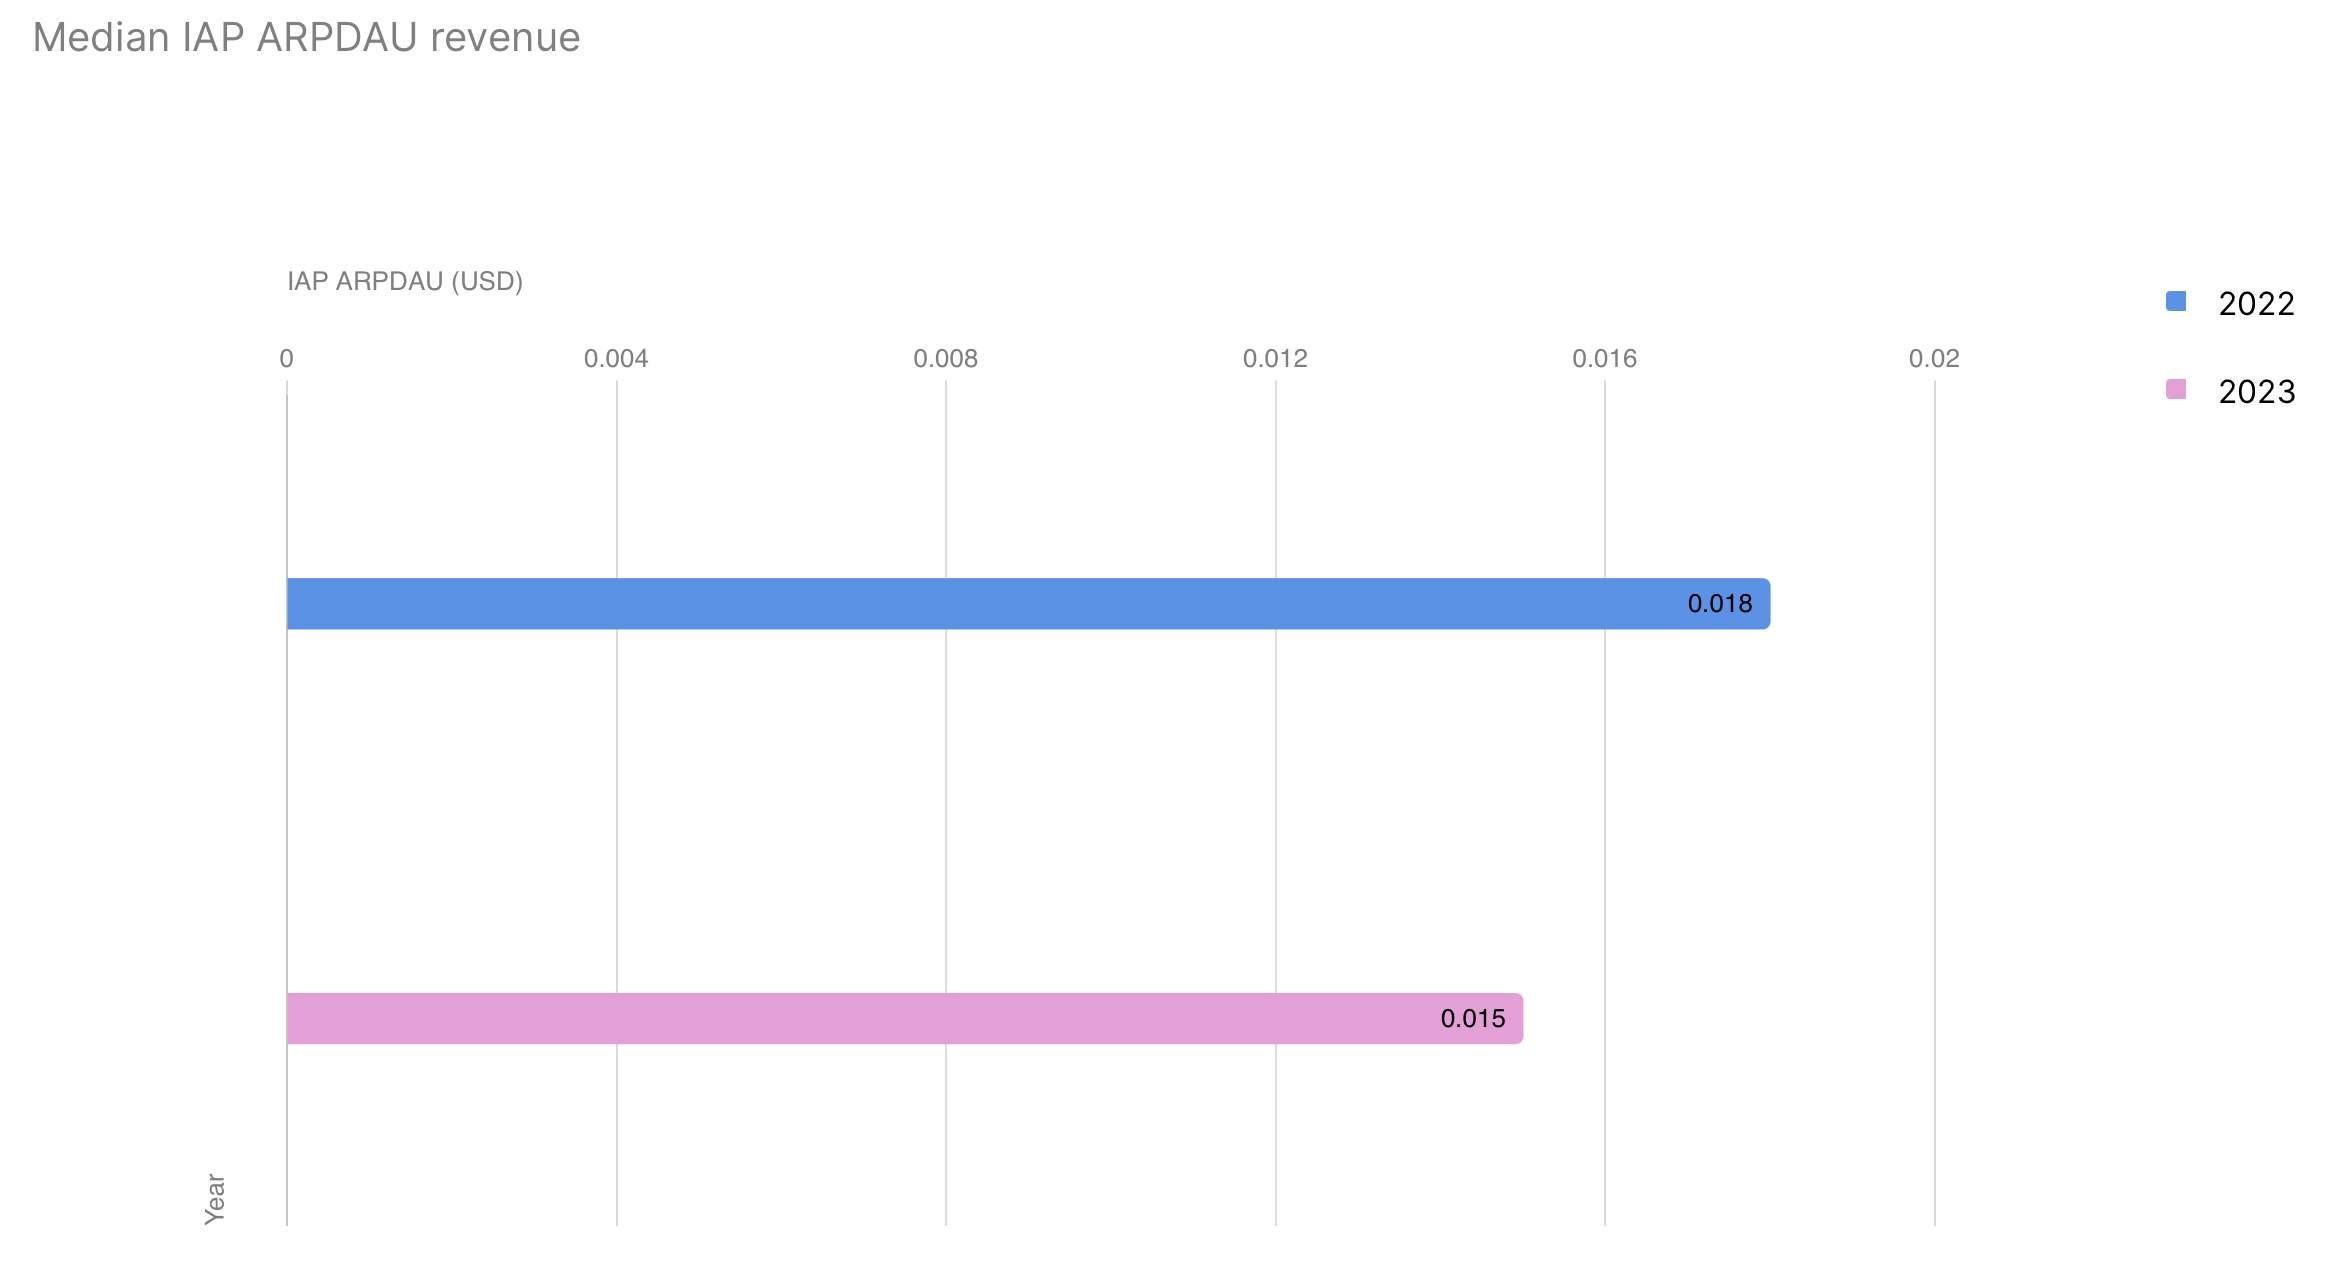
IAP revenue is declining. The median IAP ARPDAU (Average Revenue Per Daily Active User) was $0.015 in 2023 compared to $0.018 in 2022, a 13% decrease.
The median percentage of paying users in mobile games is also decreasing annually. In 2021, this figure was 0.7%; in 2022 - 0.6%; in 2023 - 0.5%.

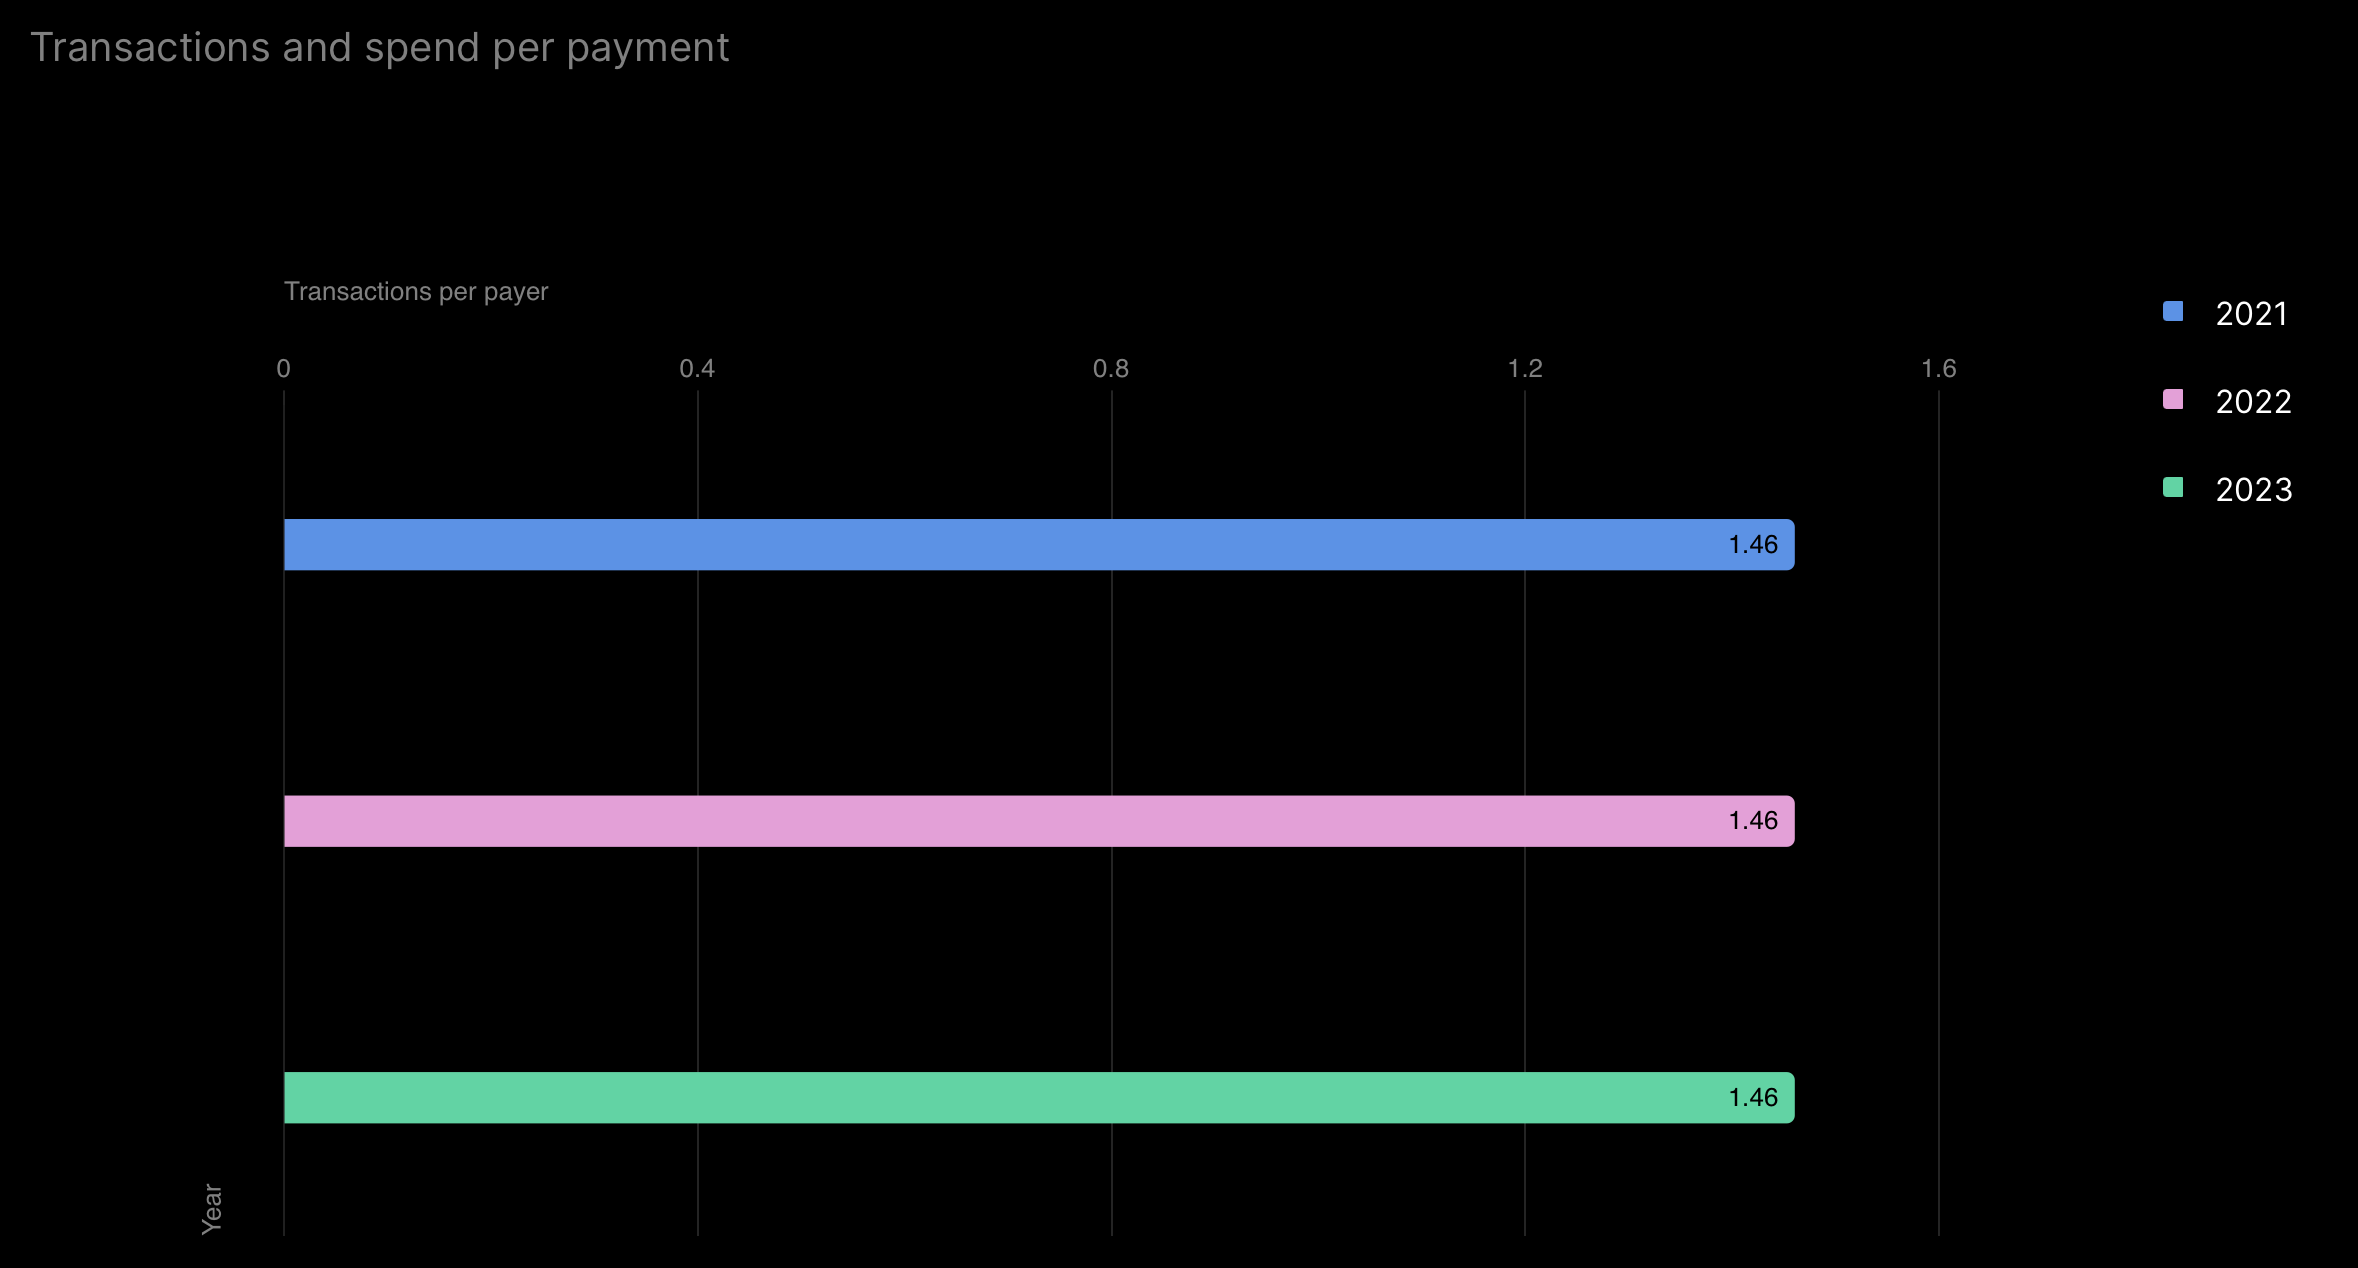
However, the behavior of paying users has remained unchanged over the years. On average, one paying user accounts for 1.46 transactions, and the average revenue per transaction increased from $7.89 in 2022 to $8.15 in 2023.

In contrast, advertising revenue showed significant growth - by 26.7%. In 2022, IAA (In-App Advertising) ARPDAU was $0.03, while in 2023, it reached $0.038.

Simulation games, casual projects, and puzzles saw the most significant growth in IAA revenue. IAP revenue increased only for RPGs and shooters, while all other genres were in the negative.

According to Unity data, projects with Rewarded Video and offerwalls have more daily sessions (3.12) than projects with only Rewarded Video (2.62), only offerwalls (2.58), or neither (2.1).

❗️There may be bias here because projects with more monetization mechanics are likely developed by large teams for big games. And besides monetization, these projects may have a large number of mechanics for audience retention.
Unity presents a similar picture regarding Retention. Projects without additional monetization systems generally have poorer retention. The best performance is seen in projects with comprehensive advertising monetization.

Cross-Platform Projects
Since 2022, small studios have released 71% more cross-platform projects.
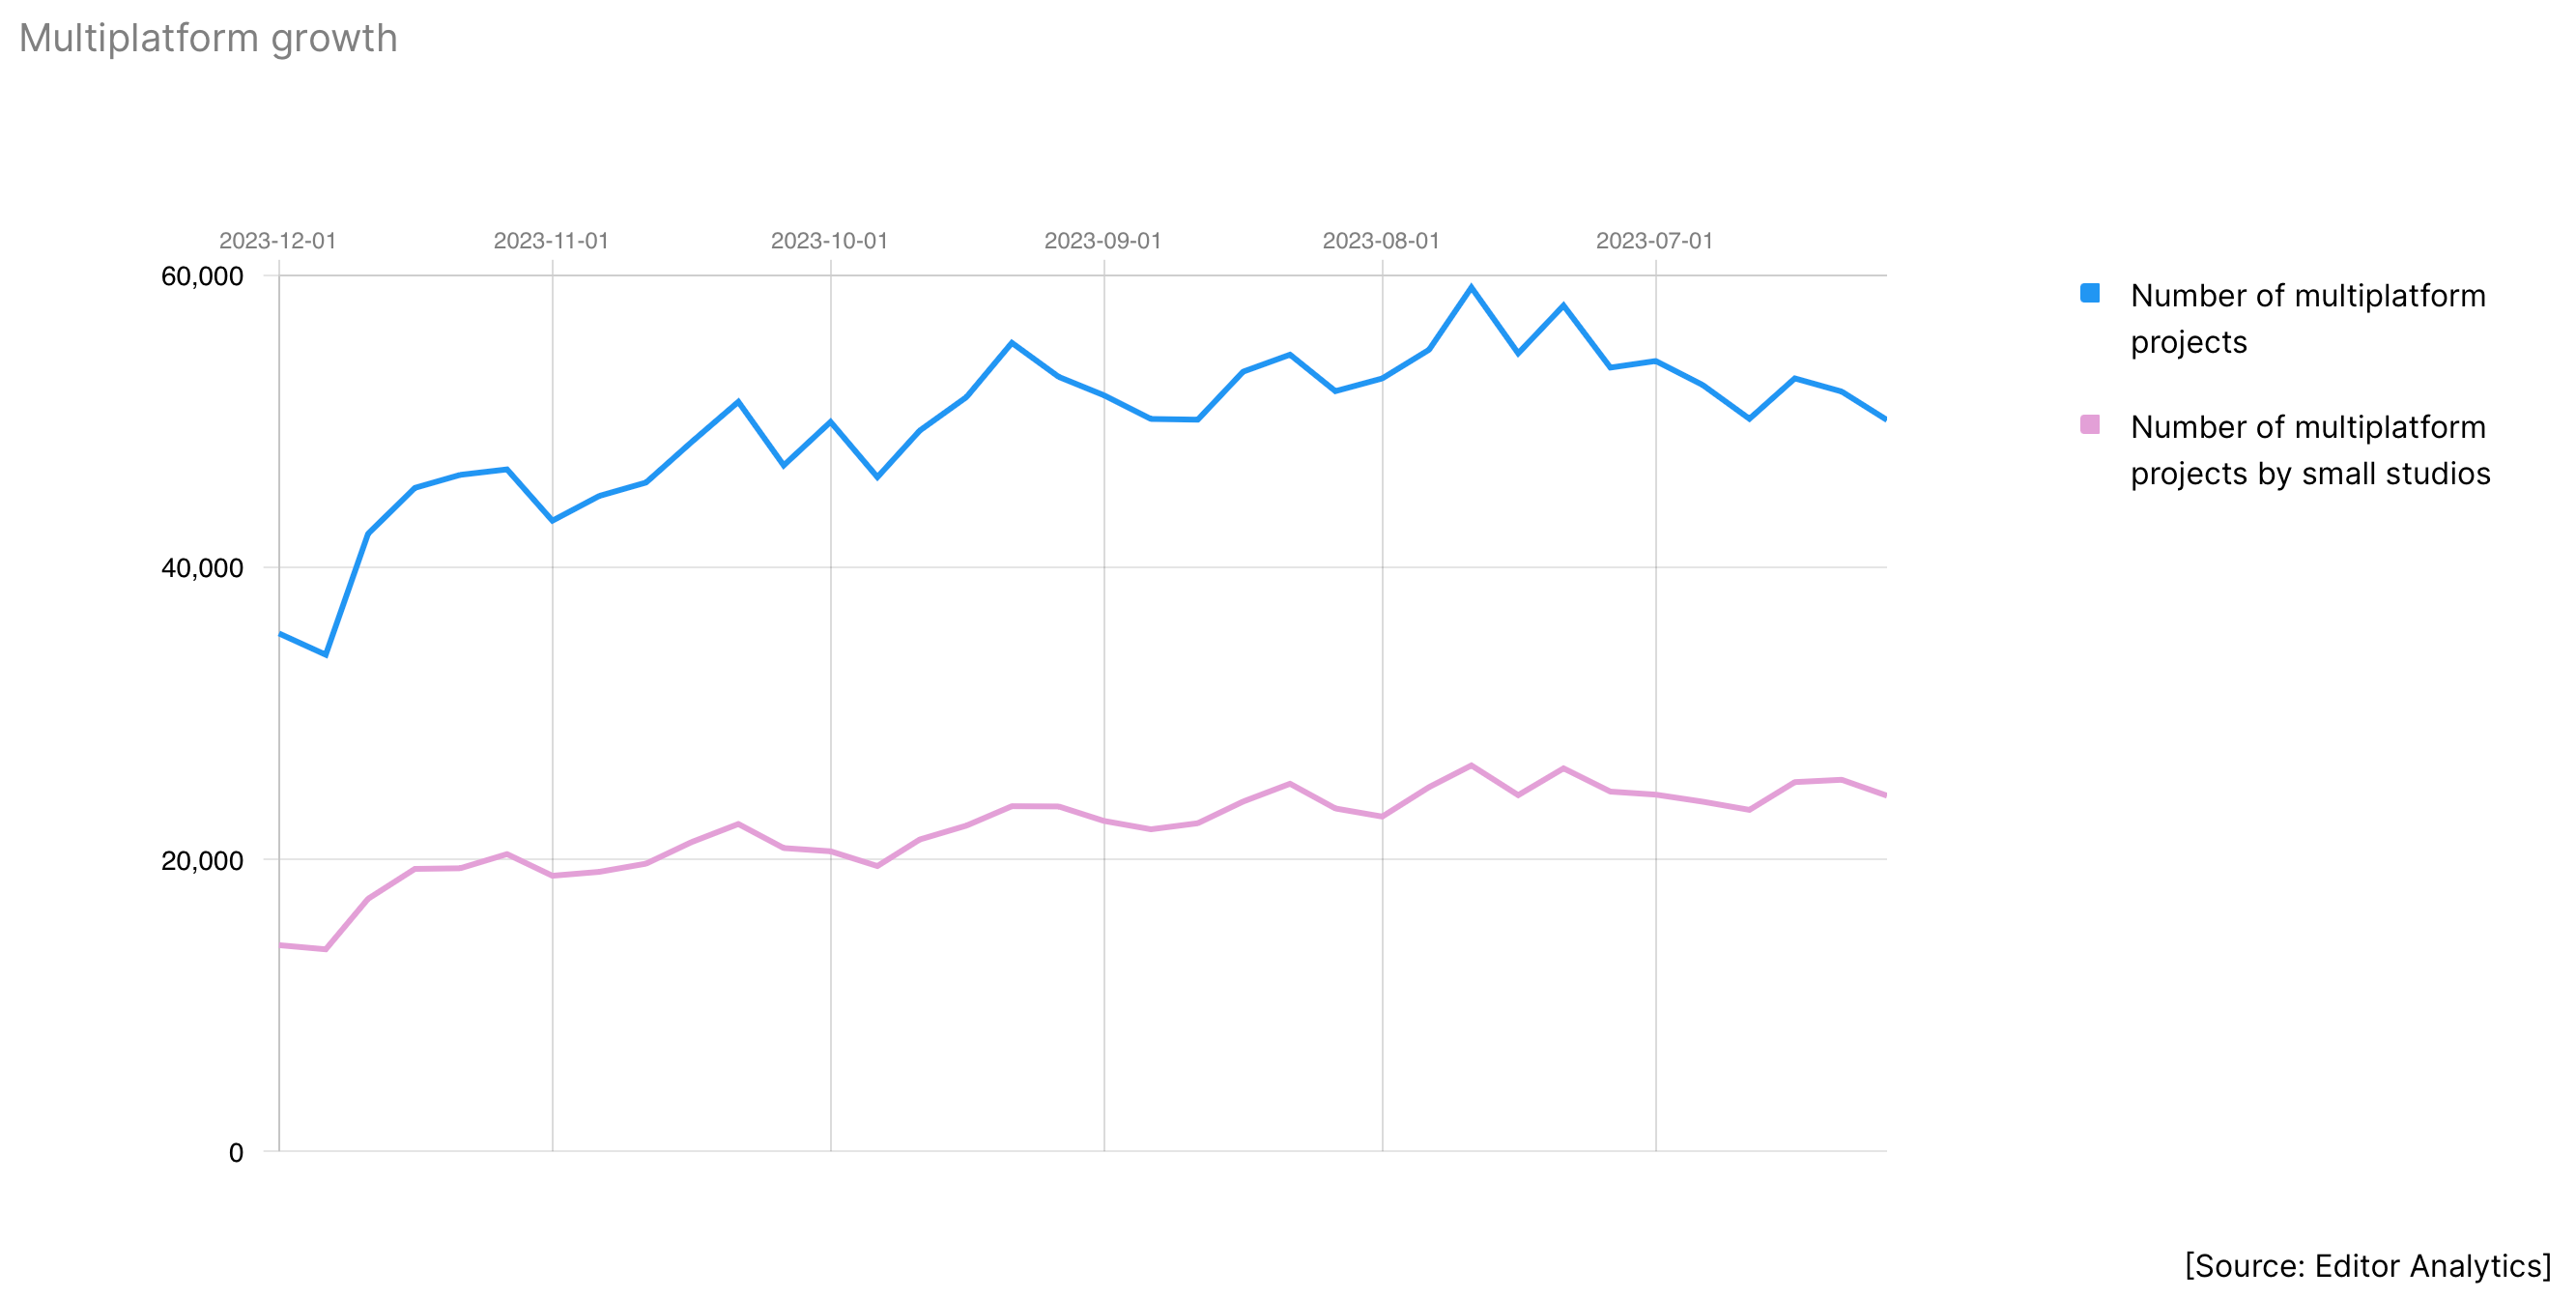
In 2023, there was a 34% increase in projects on three or more platforms compared to 2022.

Most studios incorporate cross-platform support at the pre-production stage.

The primary platforms for studios with fewer than 50 employees are mobile (66%), PC (62%), and consoles (47%).

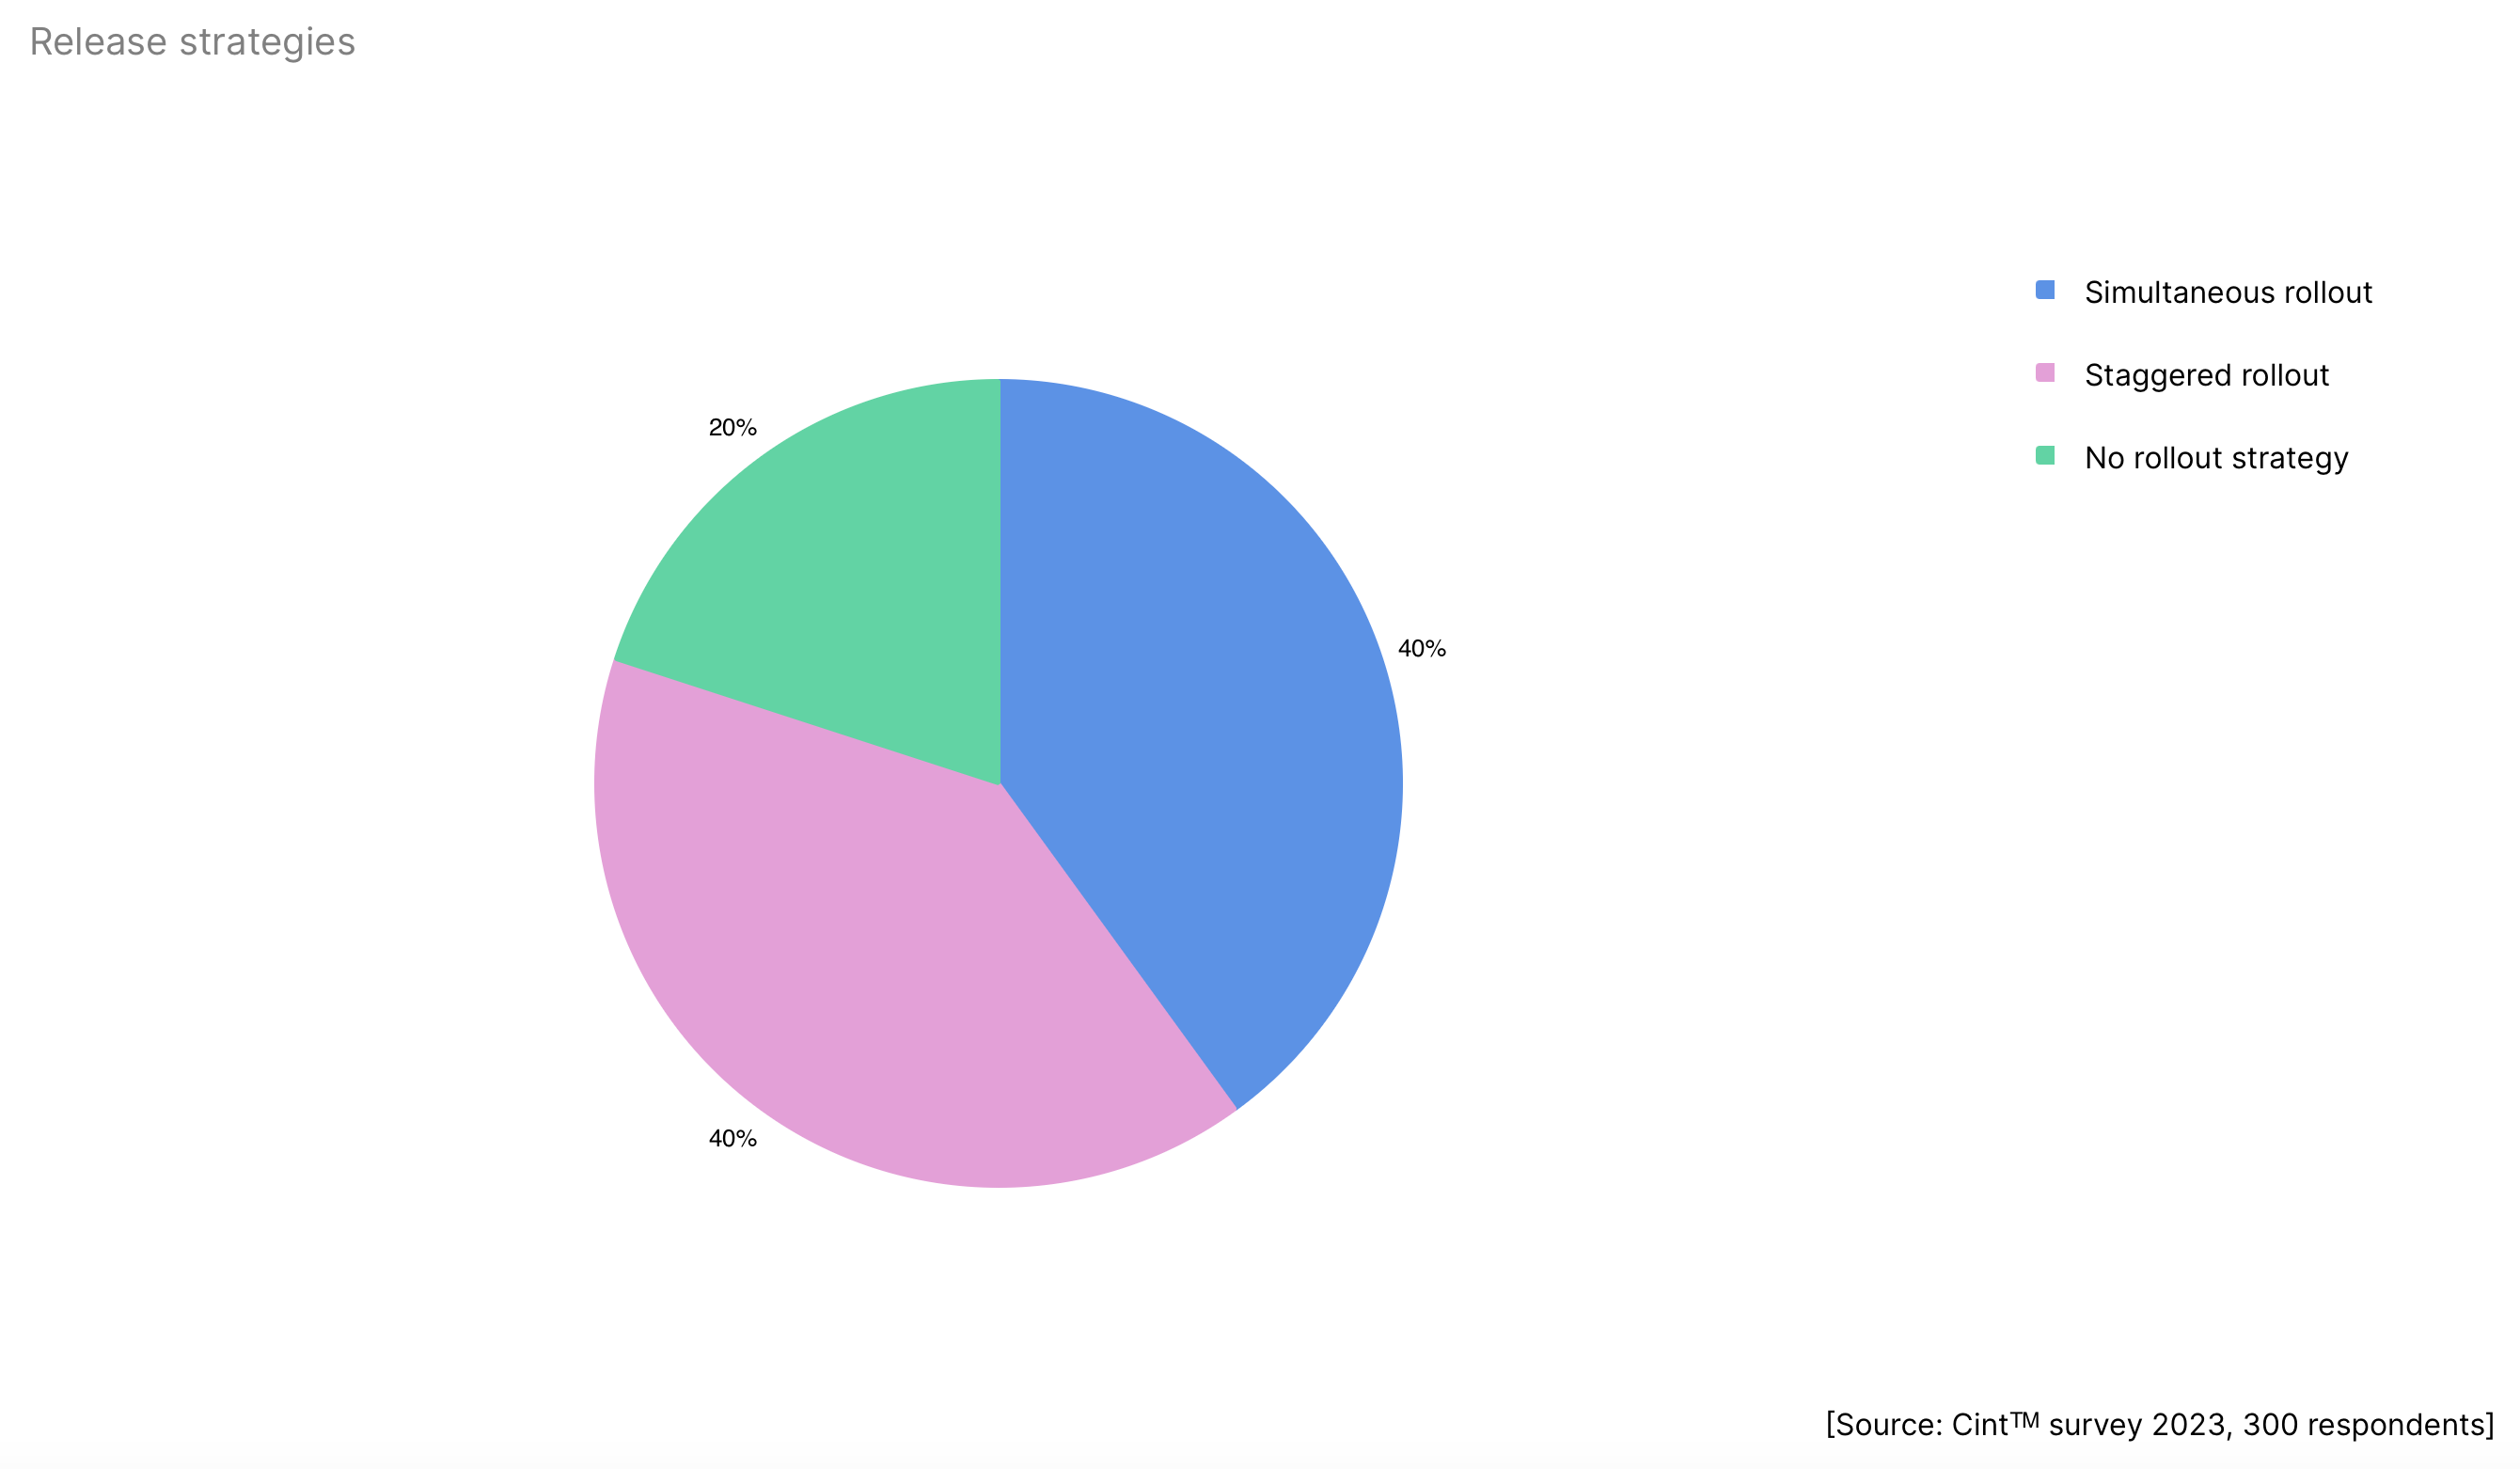
40% of studios release their projects on all platforms simultaneously; 40% do it gradually; and 20% have no specific strategy.
The most popular cross-platform genres are RPGs (38%), shooters (33%), fighting games (33%), and strategies (30%).

The larger the studio, the more likely they are to add cross-play. This is done by 95% of studios with over 50 employees.

Multiplayer Games
Mobile multiplayer games have a 40.2% higher MAU (Monthly Active Users) than single-player games.

68% of surveyed studios reported working on a multiplayer project. 6% of these are working on projects with cooperative gameplay on a single screen.

69% of cross-platform games are multiplayer. Another 7% offer local cooperative play.

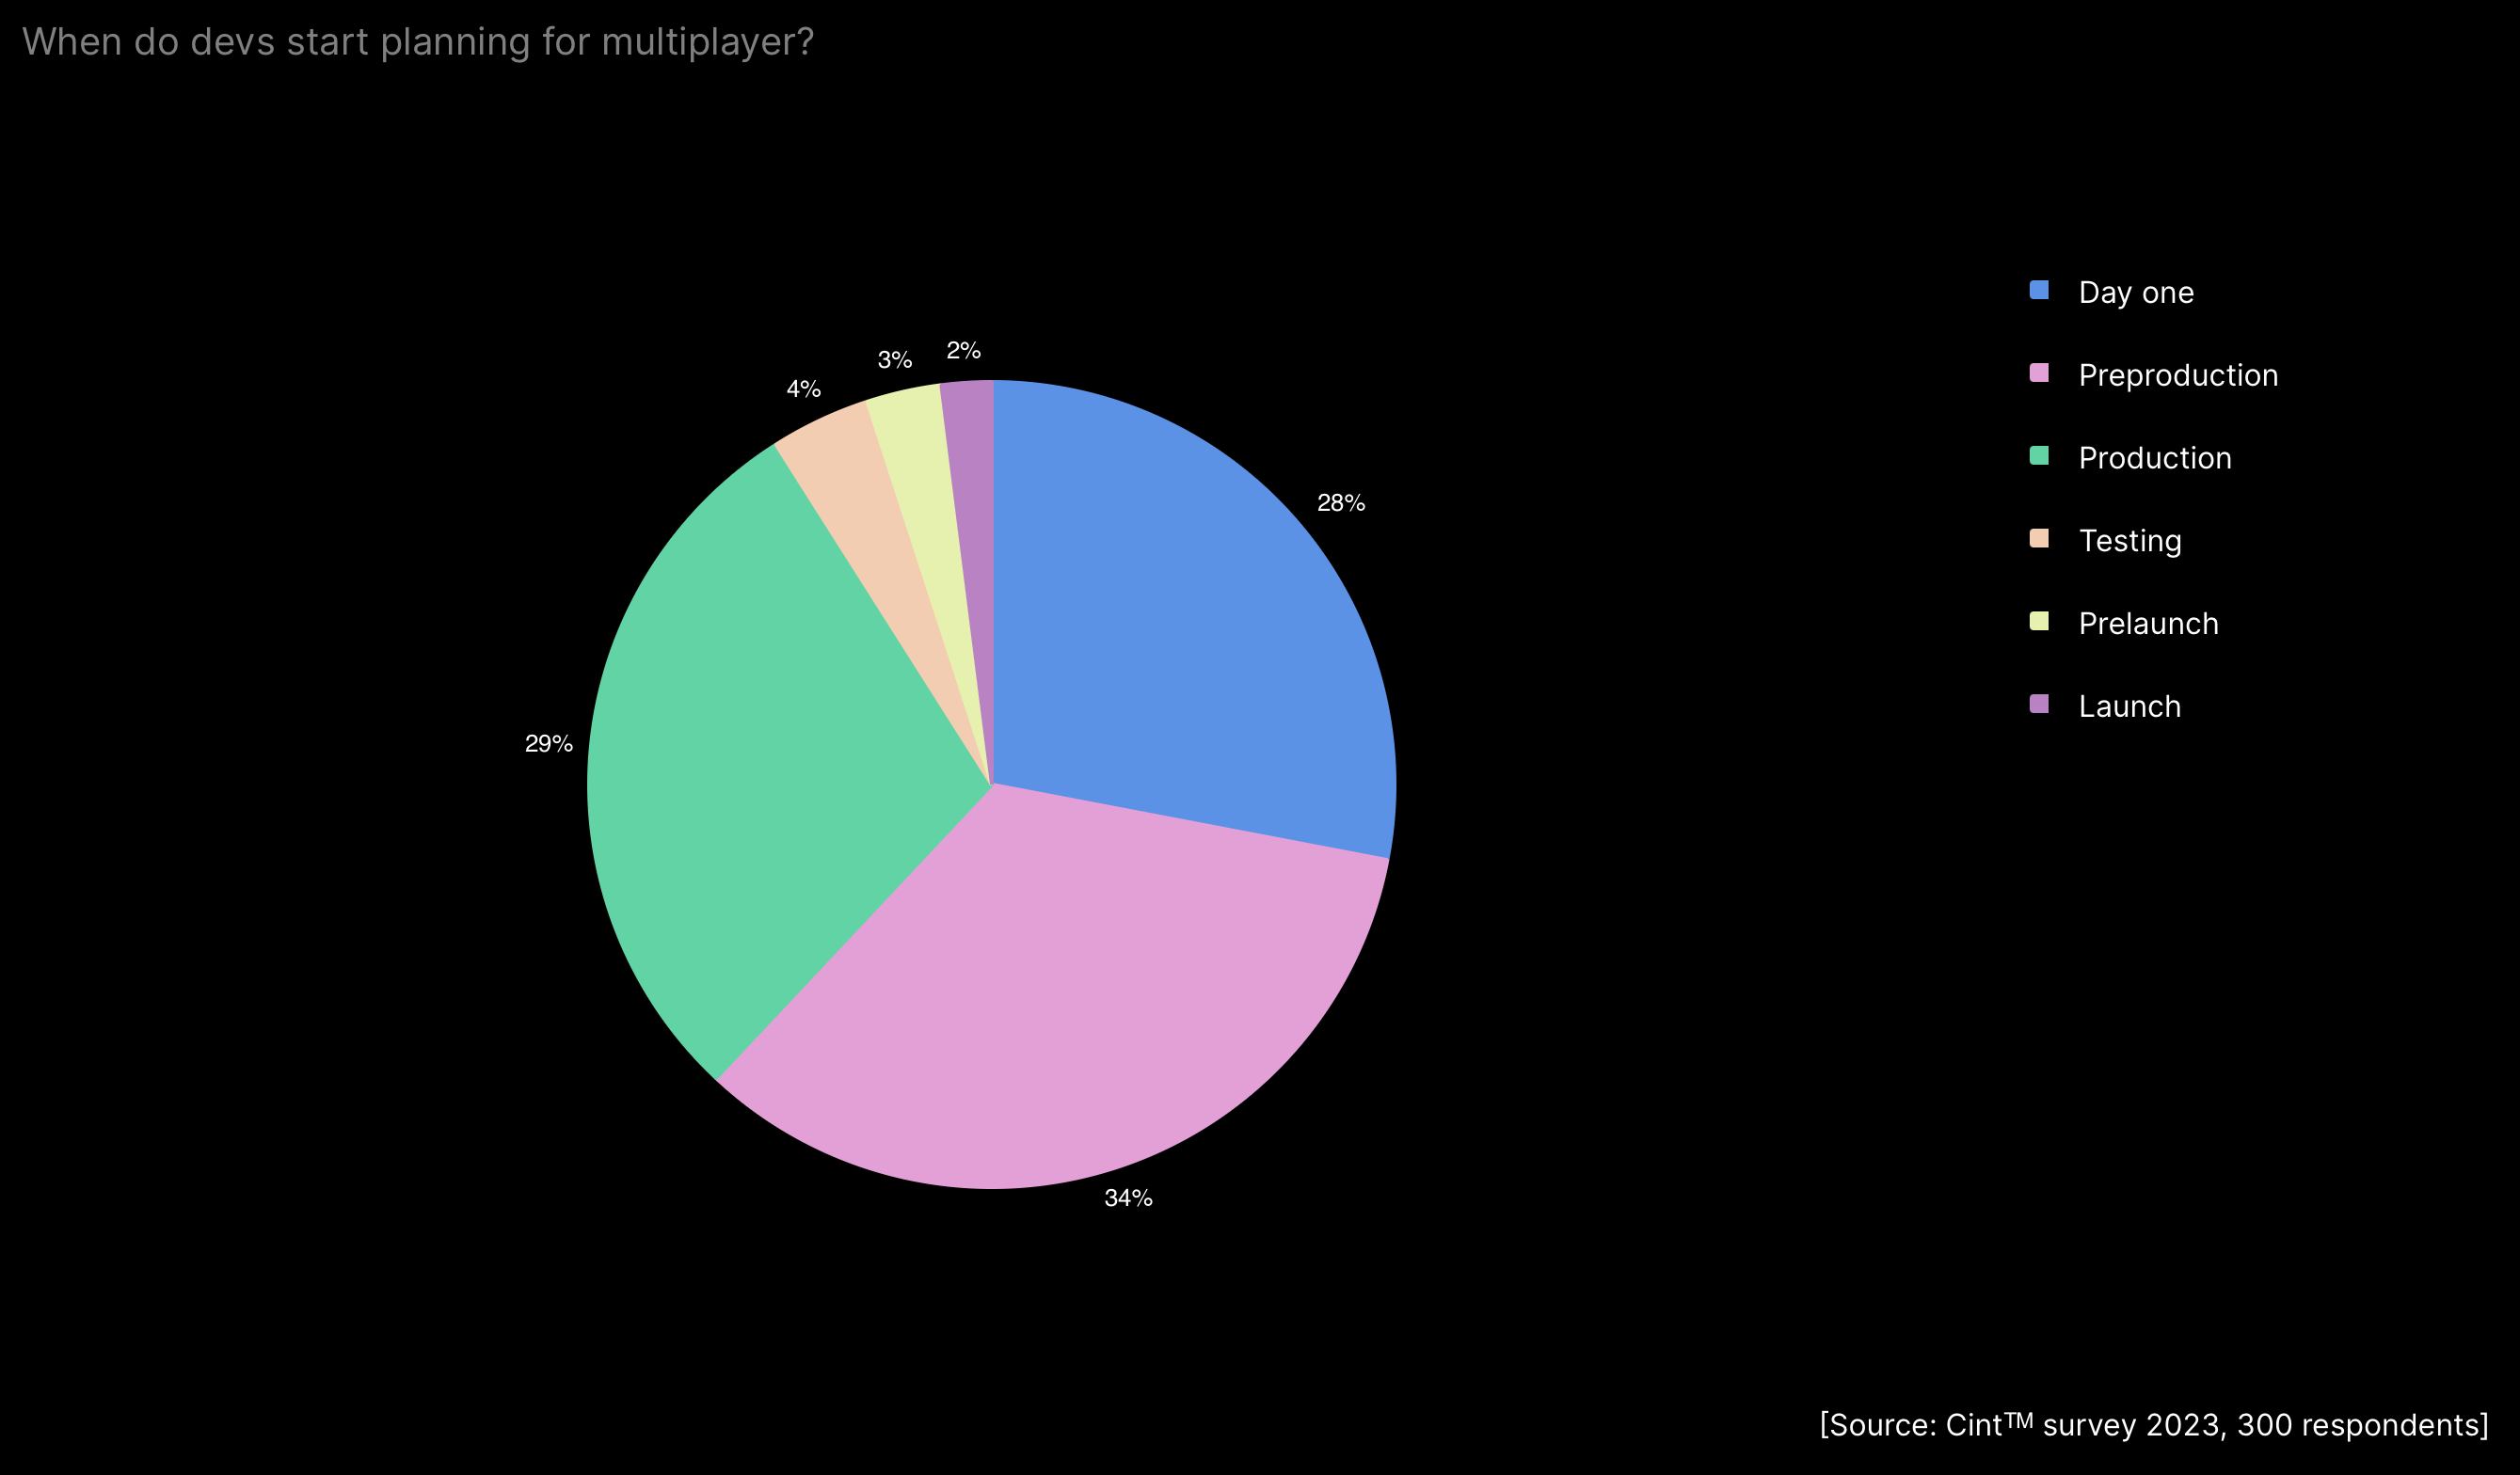
62% of developers plan multiplayer functionality at the idea or pre-production stage. Interestingly, 5% of developers decide to add multiplayer just before the game's launch.
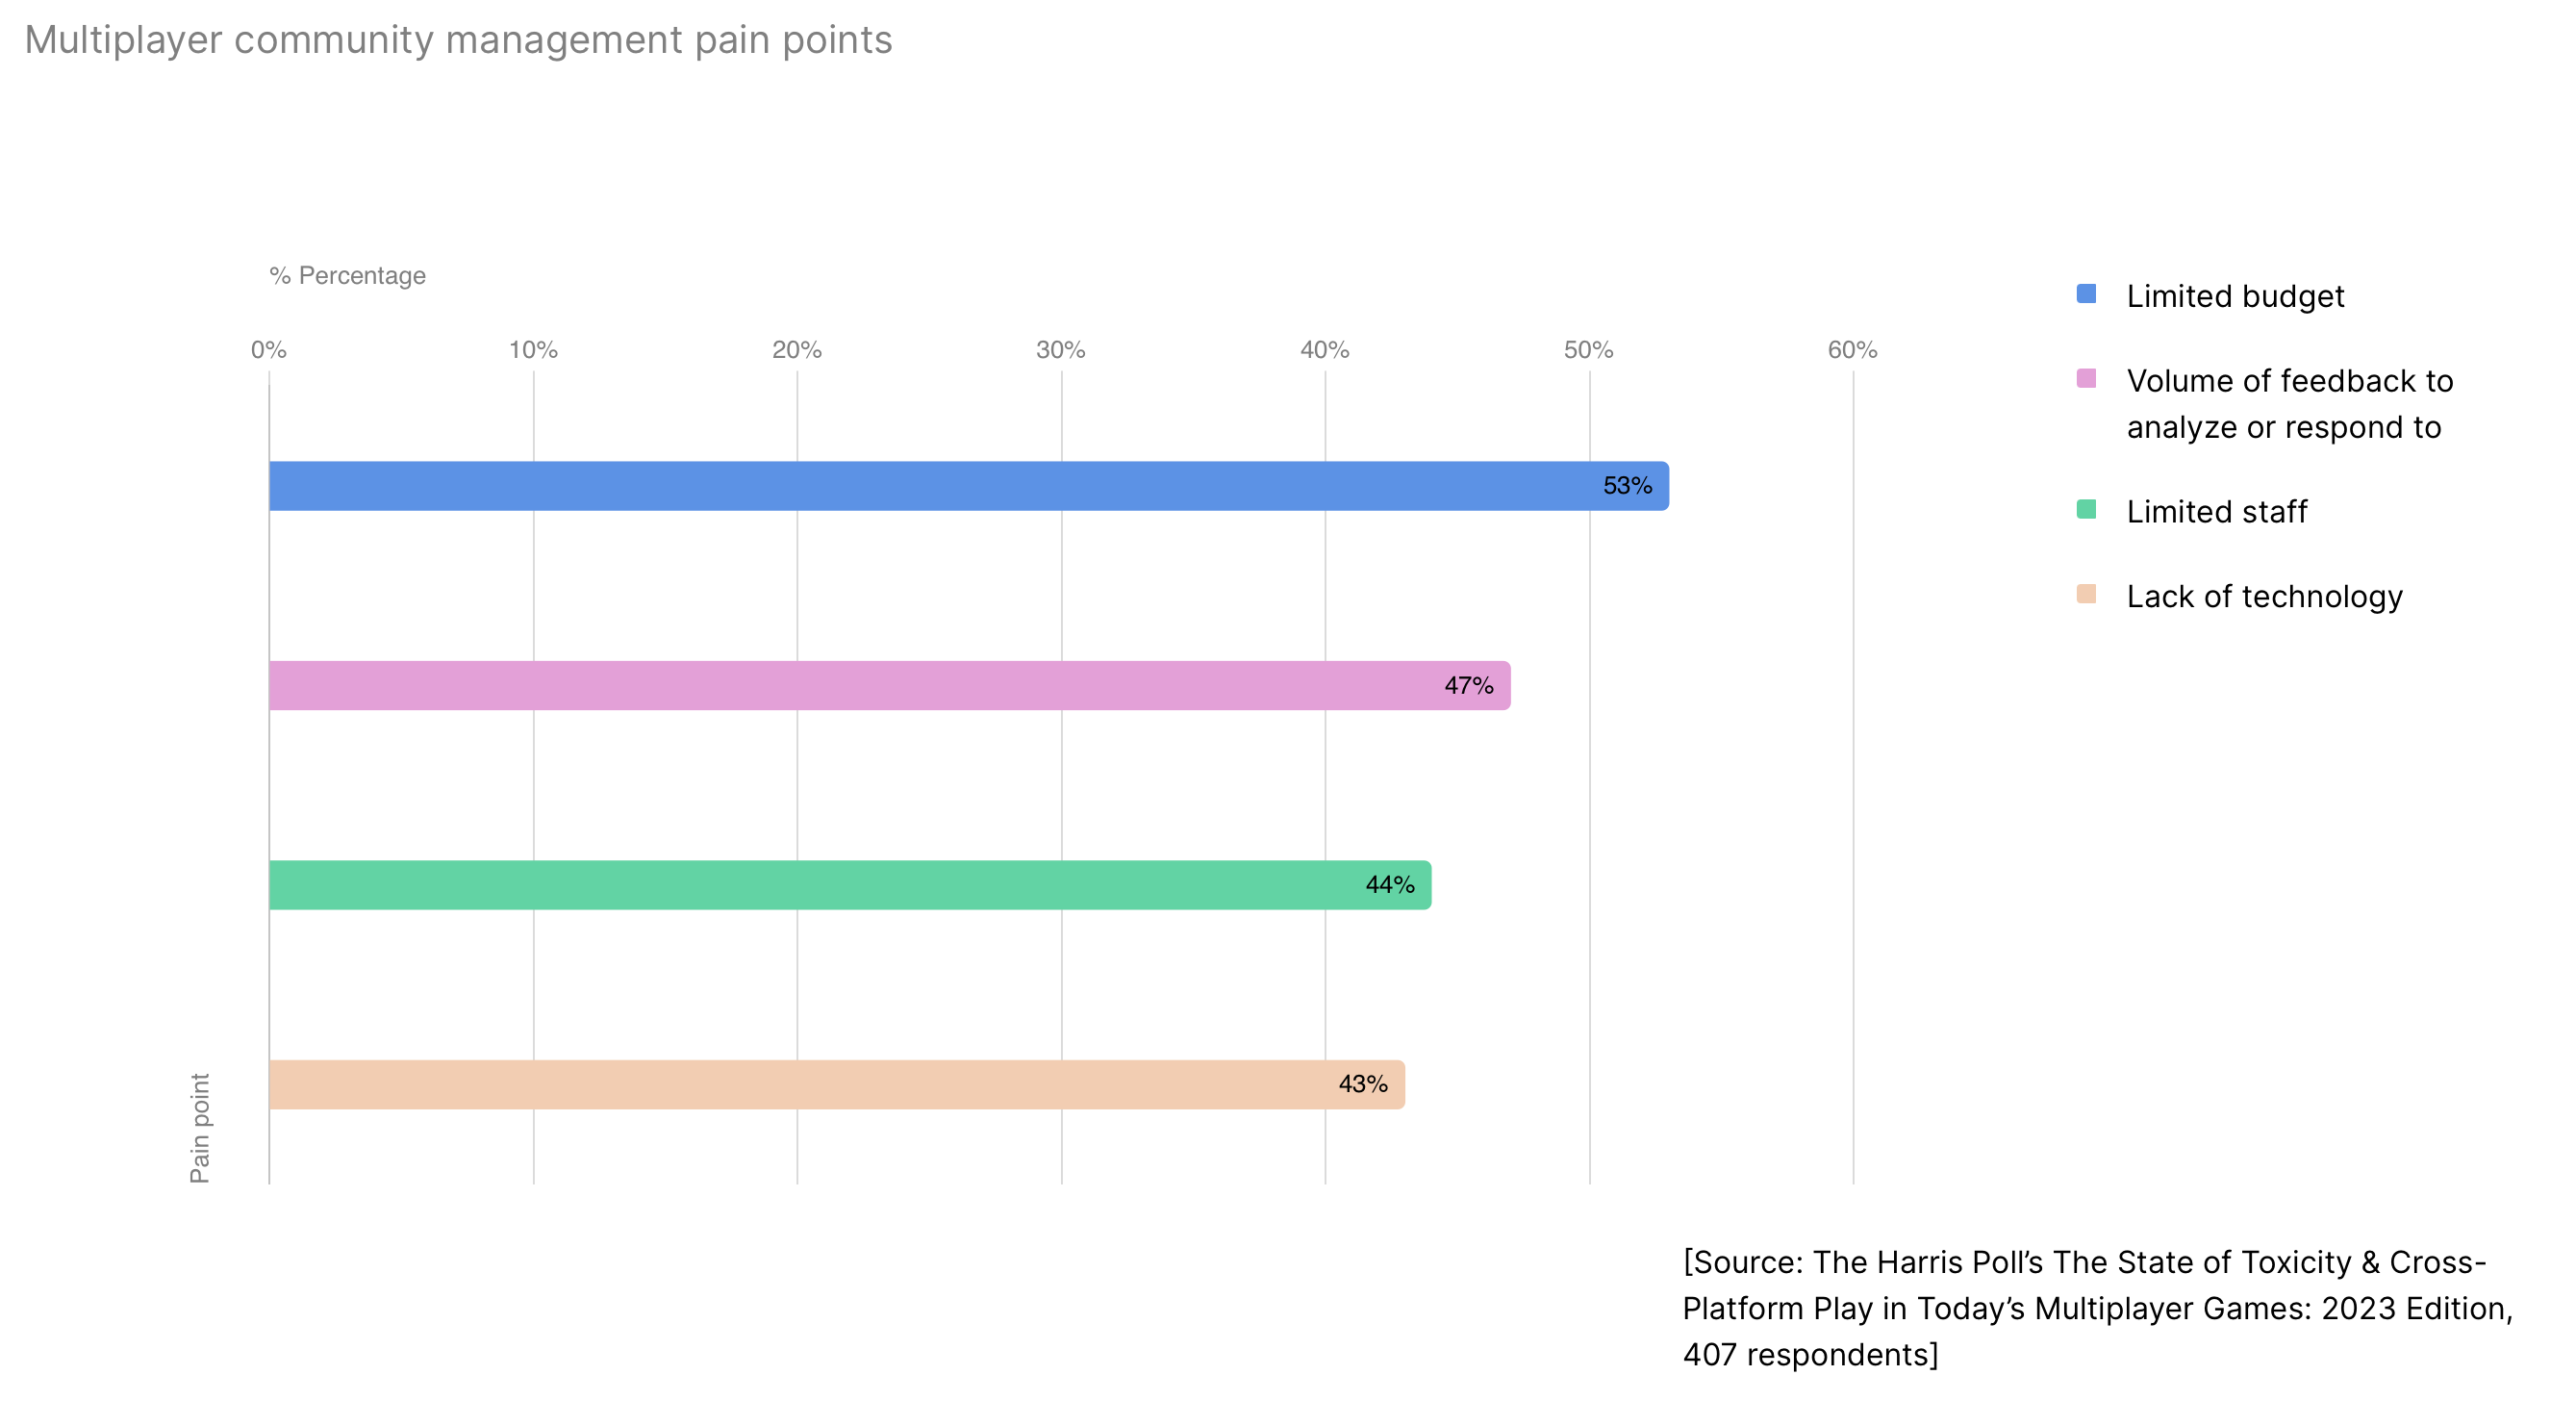
The main challenges in dealing with the audience of multiplayer projects are limited budgets (53%), managing a large amount of feedback (47%), staff limitations (44%), and lack of technology (43%).
Developers believe that users expect multiplayer games to allow free communication (38%), lack lag (37%), fair matchmaking (34%), and shared progress (31%).

The revenue from multiplayer games continues to grow. In 2022, it was $24 billion; in 2023 - $26 billion, and in 2024, it is forecasted to reach $28 billion.
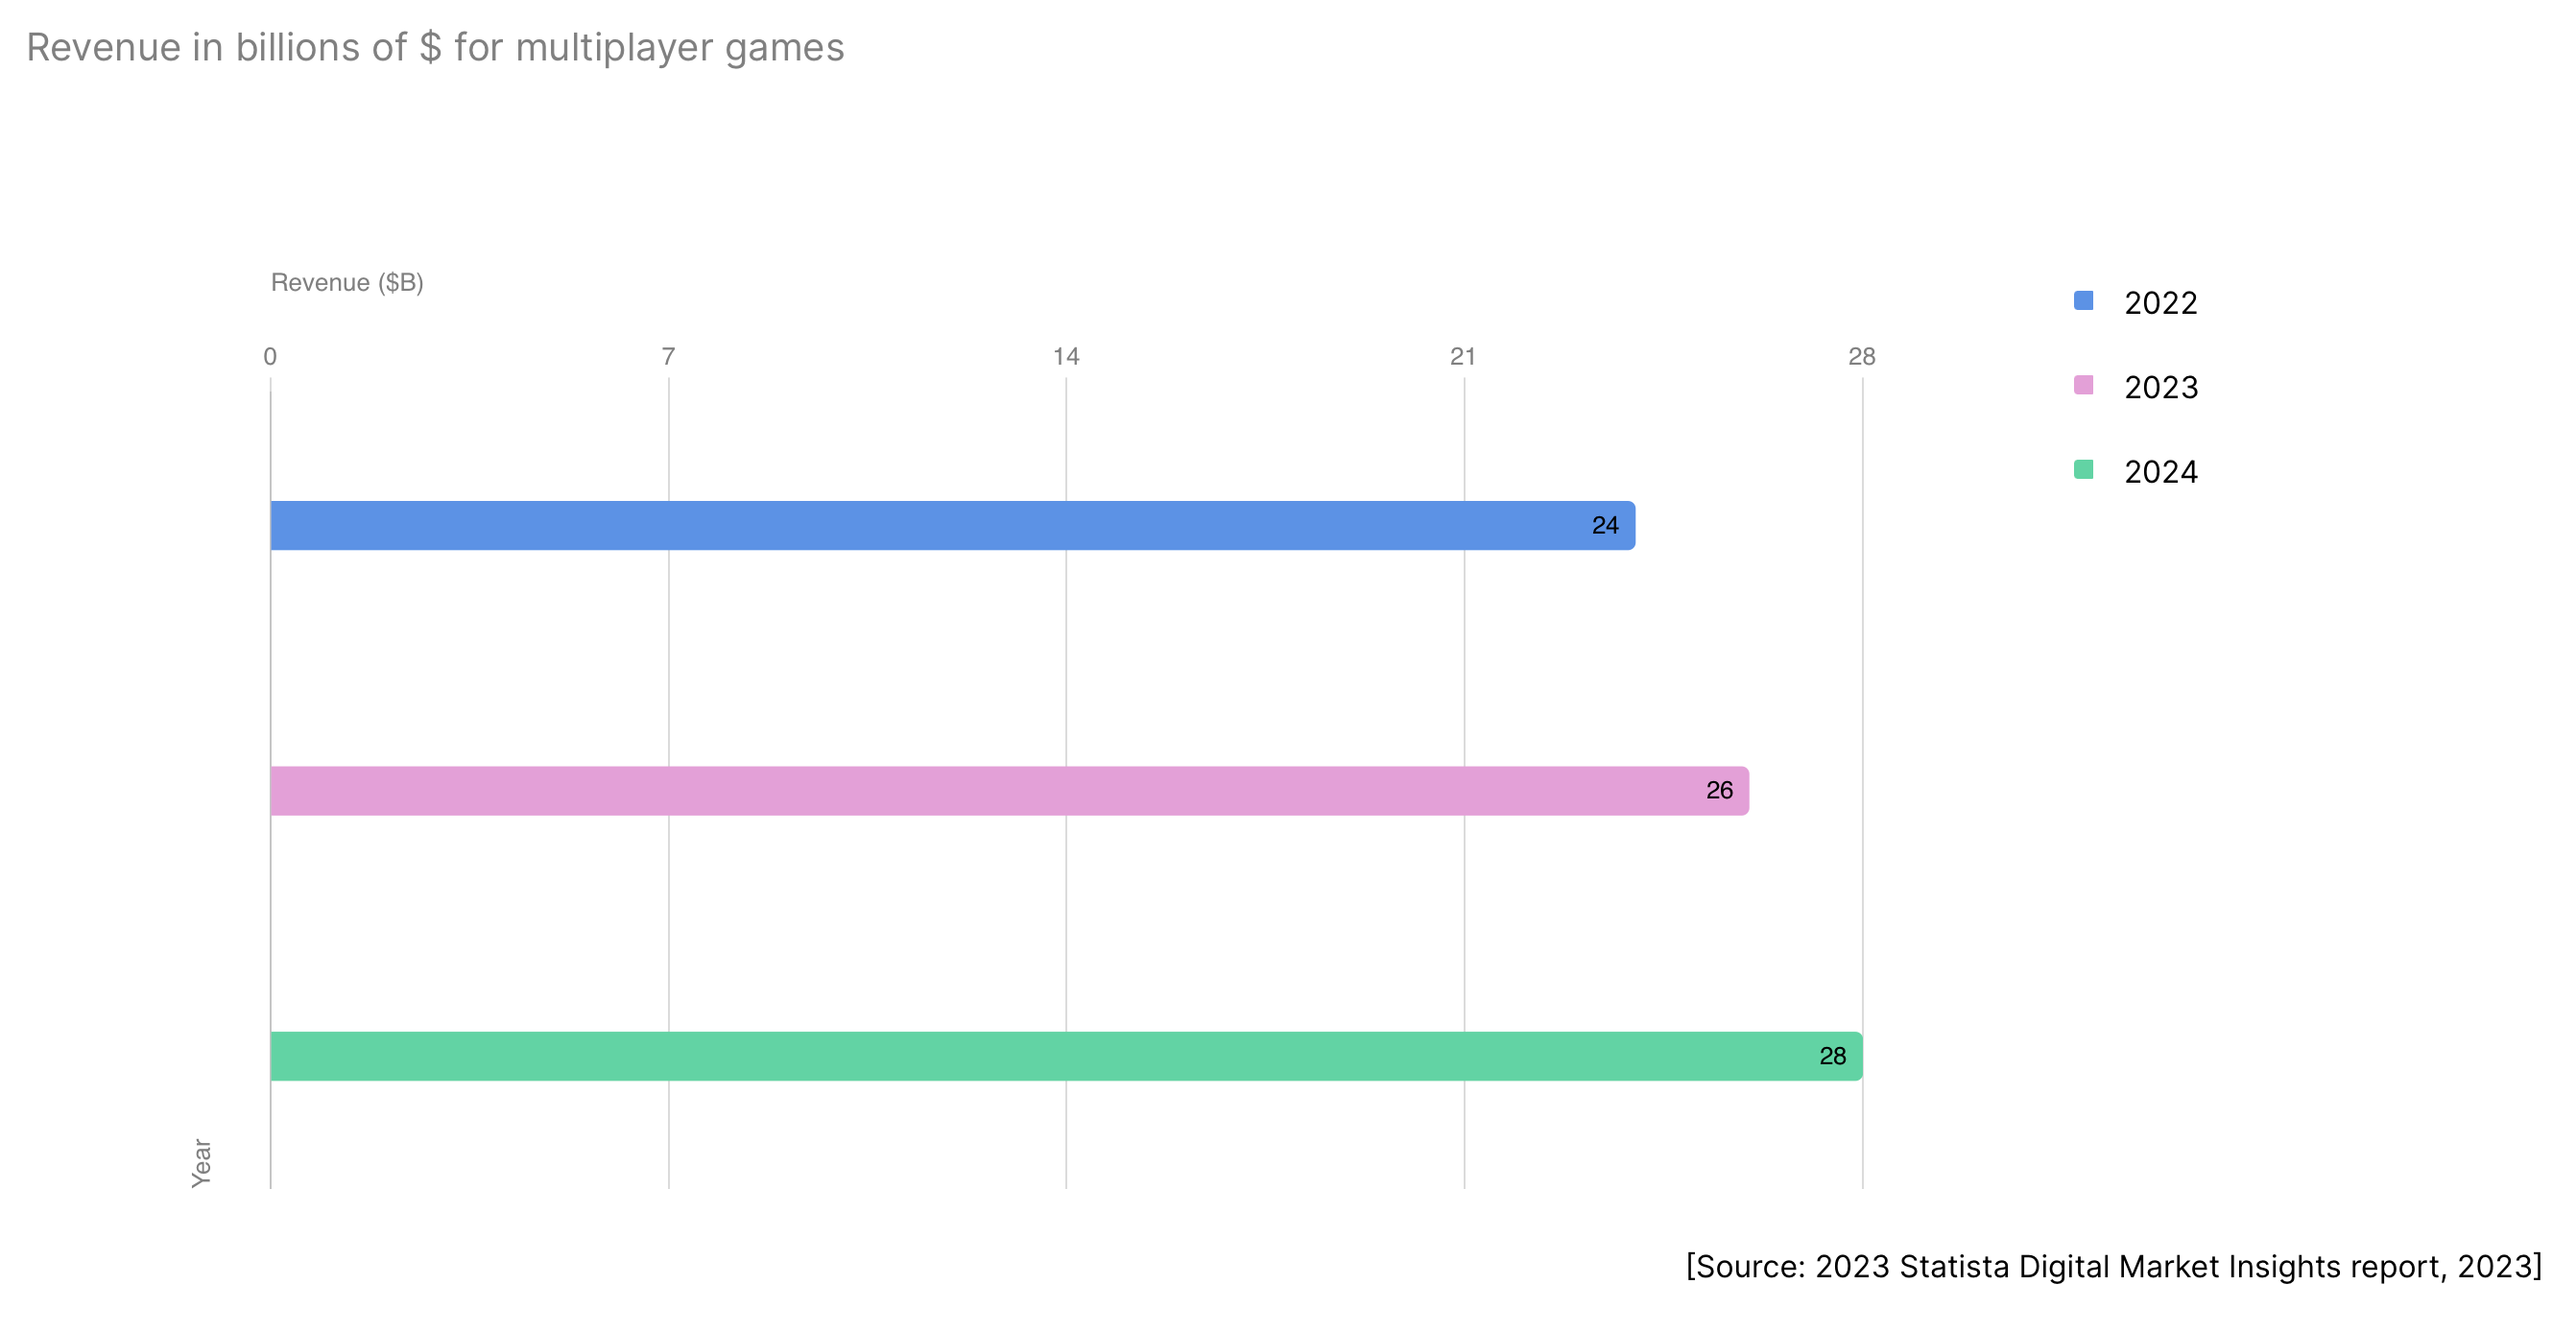
❗️Here, Unity refers to Statista data, but it's not very clear which specific games are included. Therefore, the figure is questionable.
Developers and their Live-Ops Approach
83% of developers understand how they will operate the game before releasing the first public versions.

To cope with market challenges, studios try to enter new markets with existing projects (53%); constantly create new content (52%); seek opportunities to work more efficiently (50%); diversify their game portfolios (47%); focus on player retention (35%); and invest in monetization and user acquisition (26%).

7% of games are supported for less than 6 months; 39% - from six months to a year; 49% - from one to two years; 5% - from three to five years.

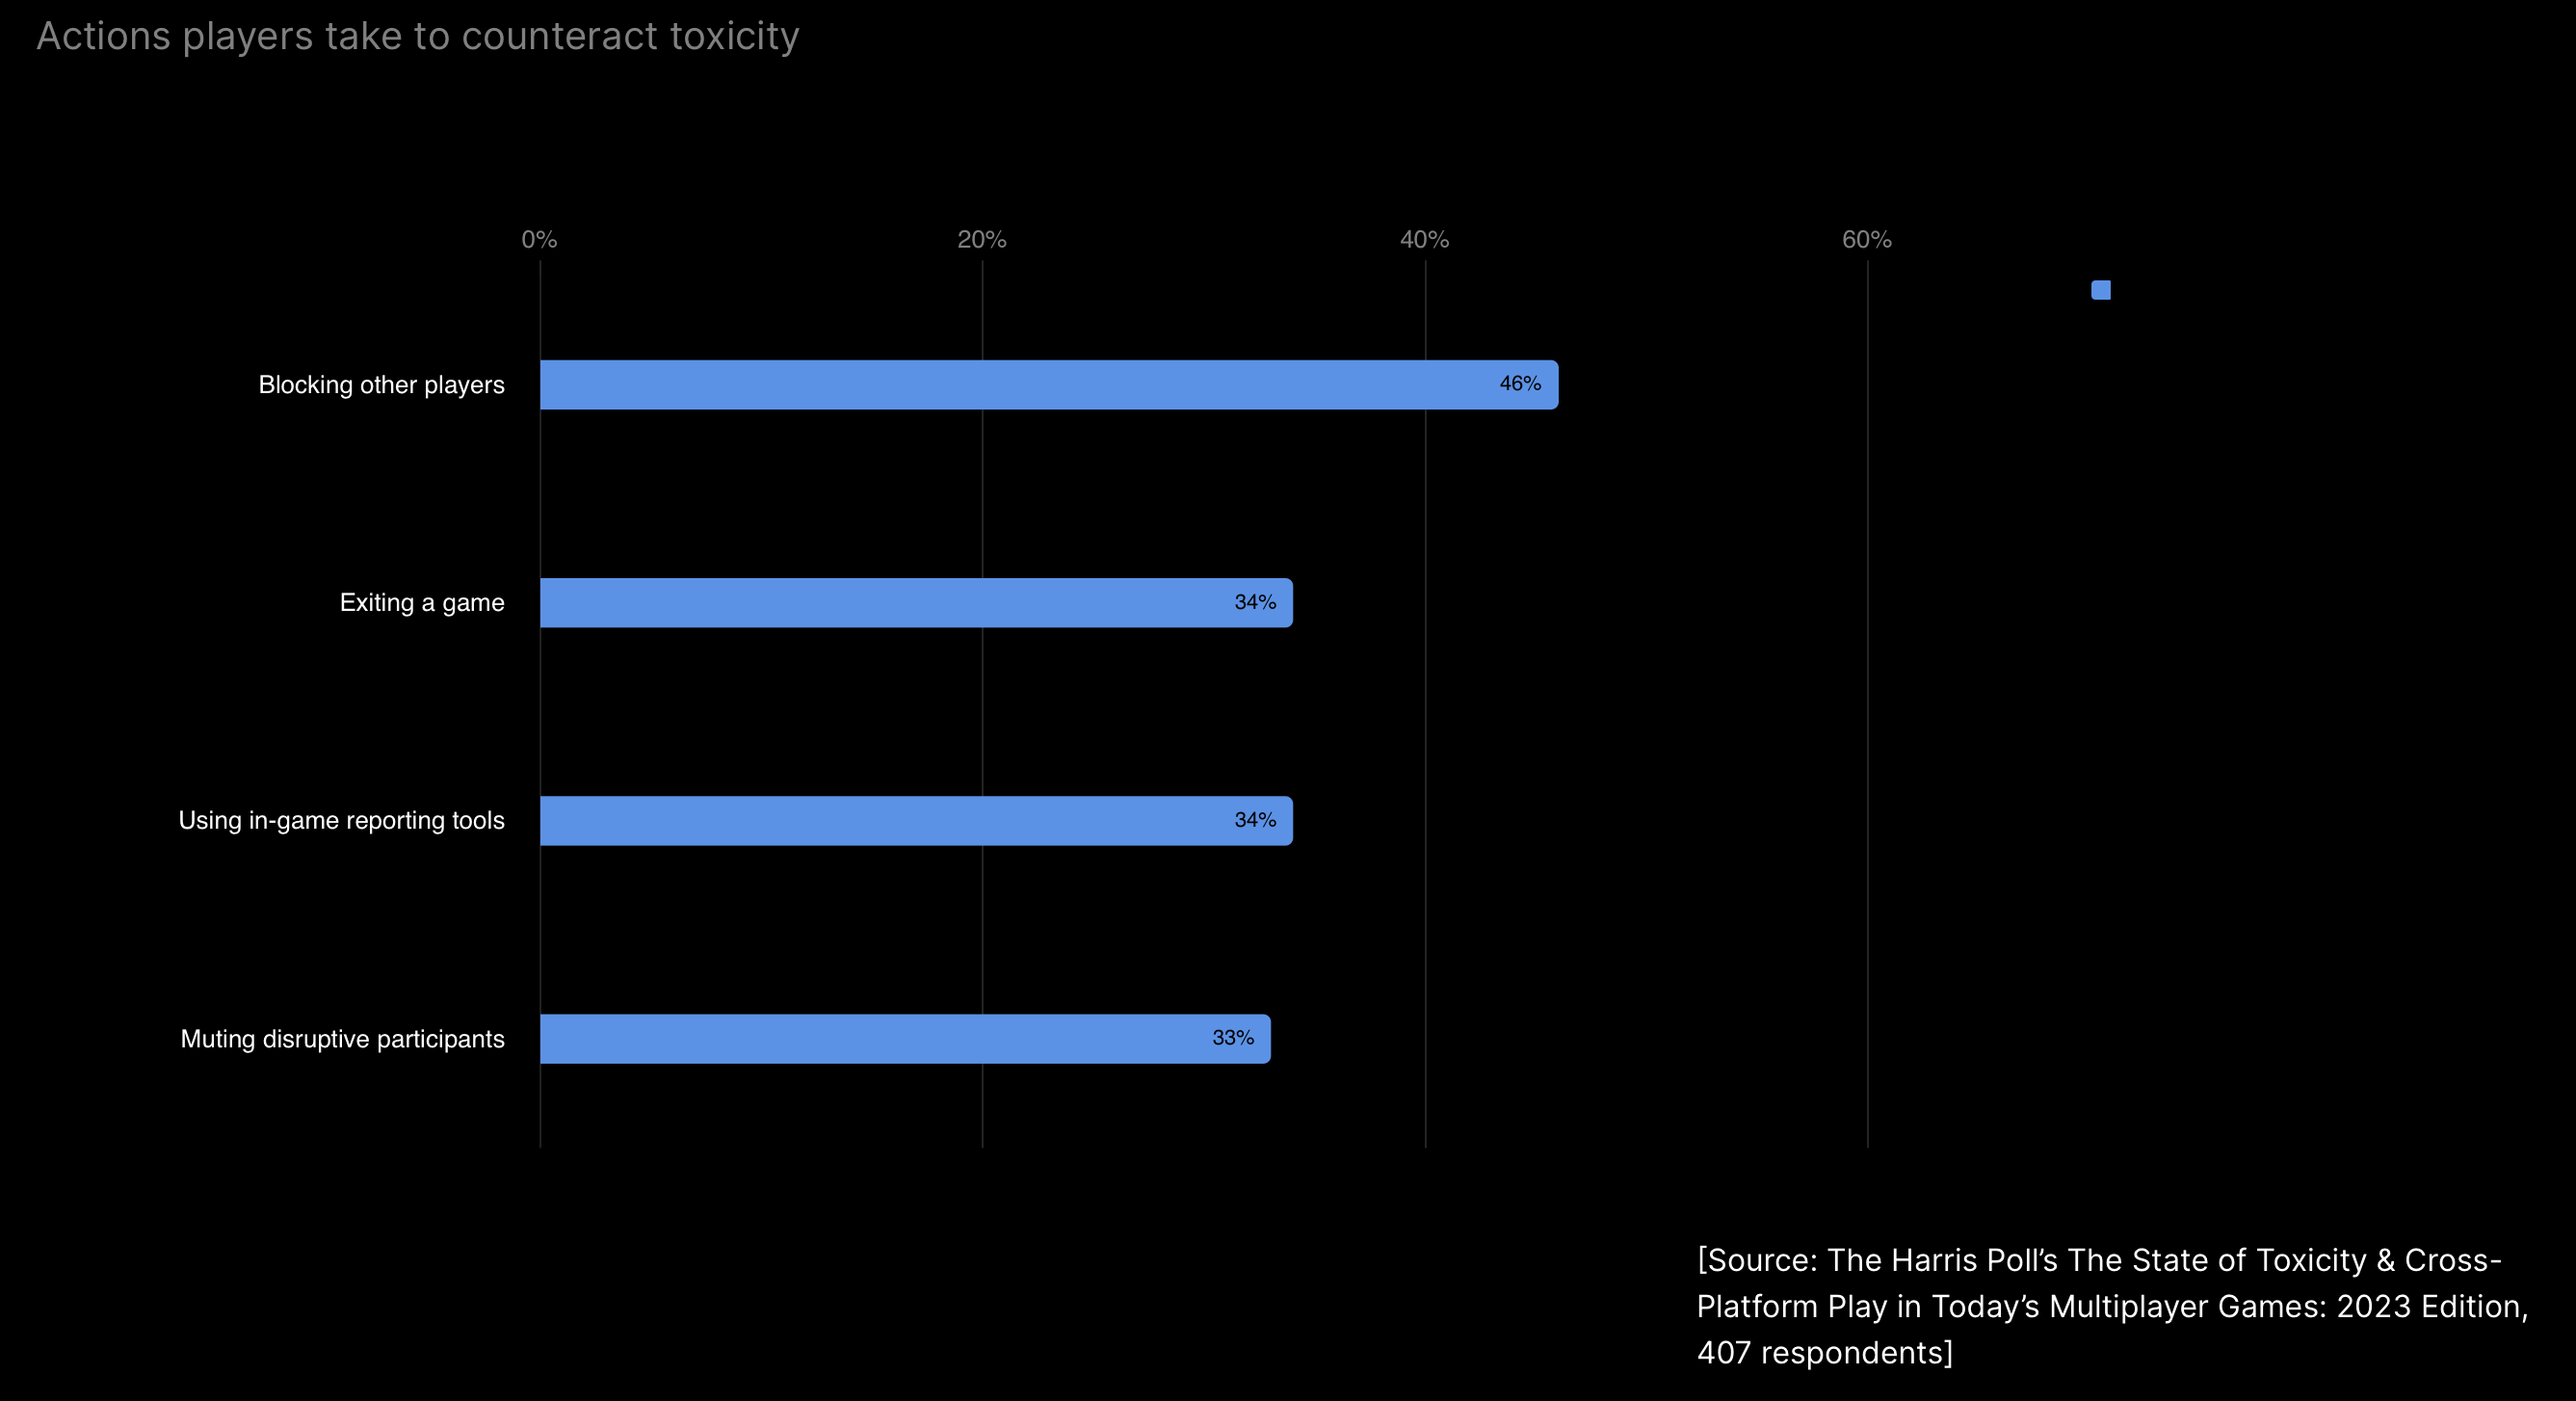
Users pay attention to toxic behavior in games. 46% of players block toxic users, and 34% simply leave the game.
Developers consider daily missions and rewards (67%), achievements and challenges (59%), Rewarded ads and in-app purchases (40%), leaderboards (33%), and PvP (31%) as the most effective mechanics for increasing retention.
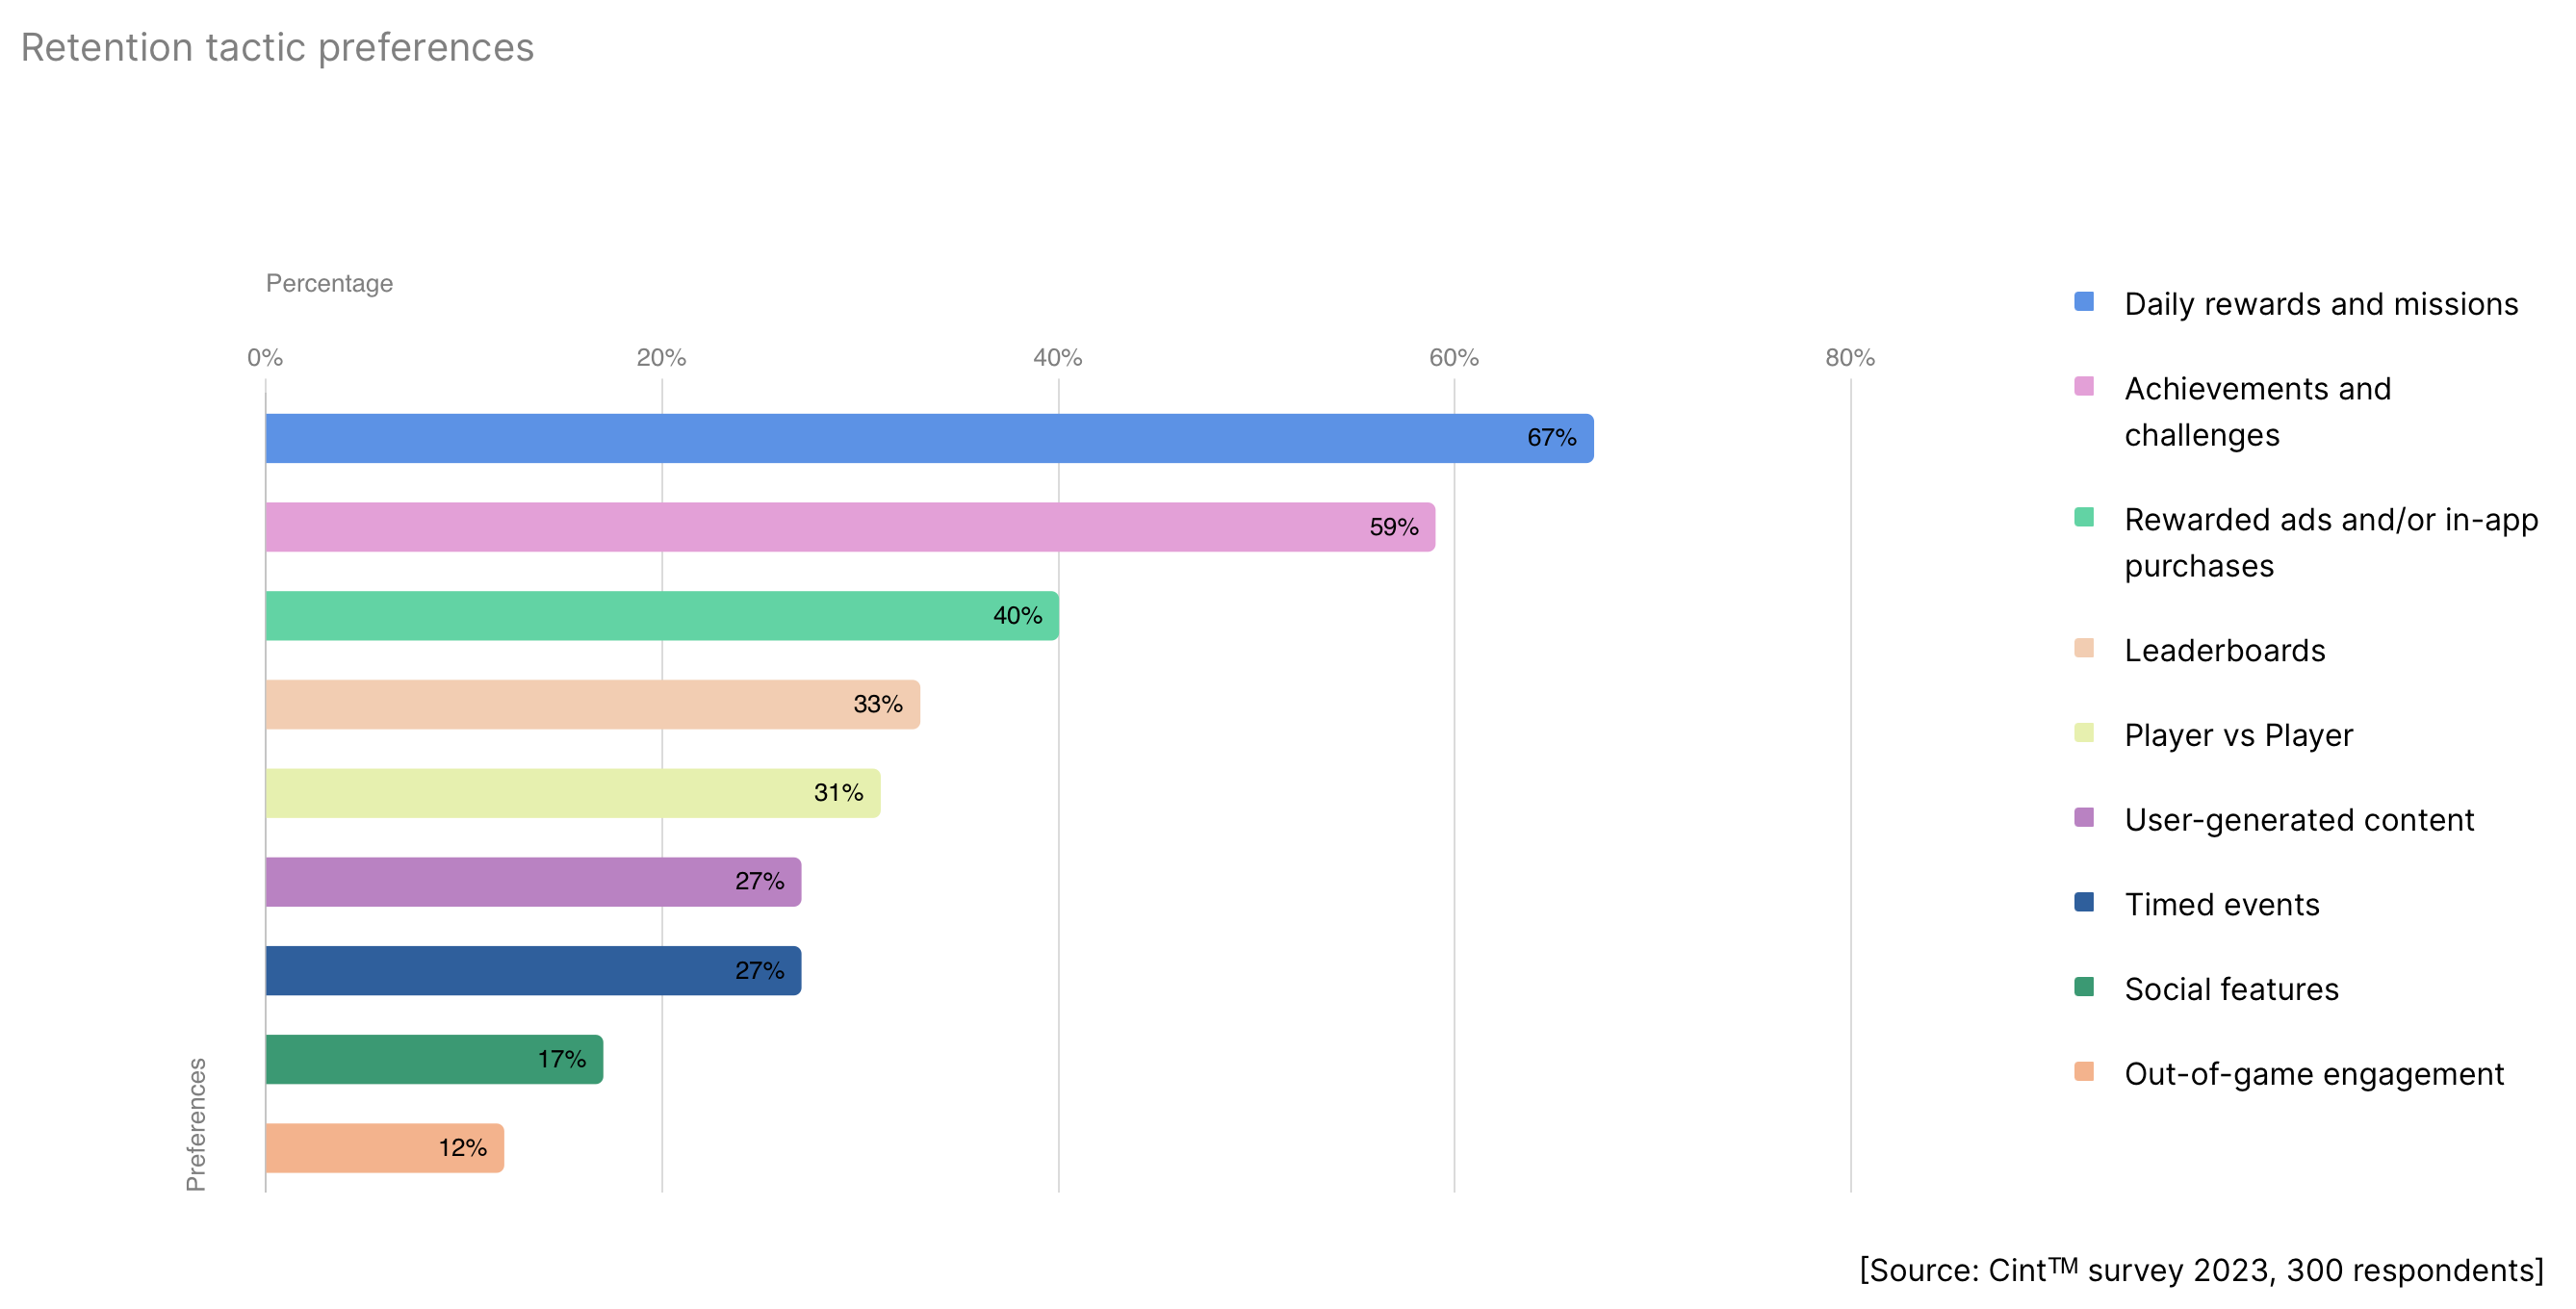
❗️Again, it's not very clear how the presence of Rewarded Ads and in-game purchases can directly impact retention.
39% of developers are considering adding user-generated content to their games; 27% have already done so. 34% do not plan to add player content.

Mistplay: Paying Users in Mobile Games in 2024
General Behavioral Patterns
39% of all paying users make purchases only in one game. Half spend in 2-3 games.

37% of all paying users, on average, make 1-2 purchases per month.

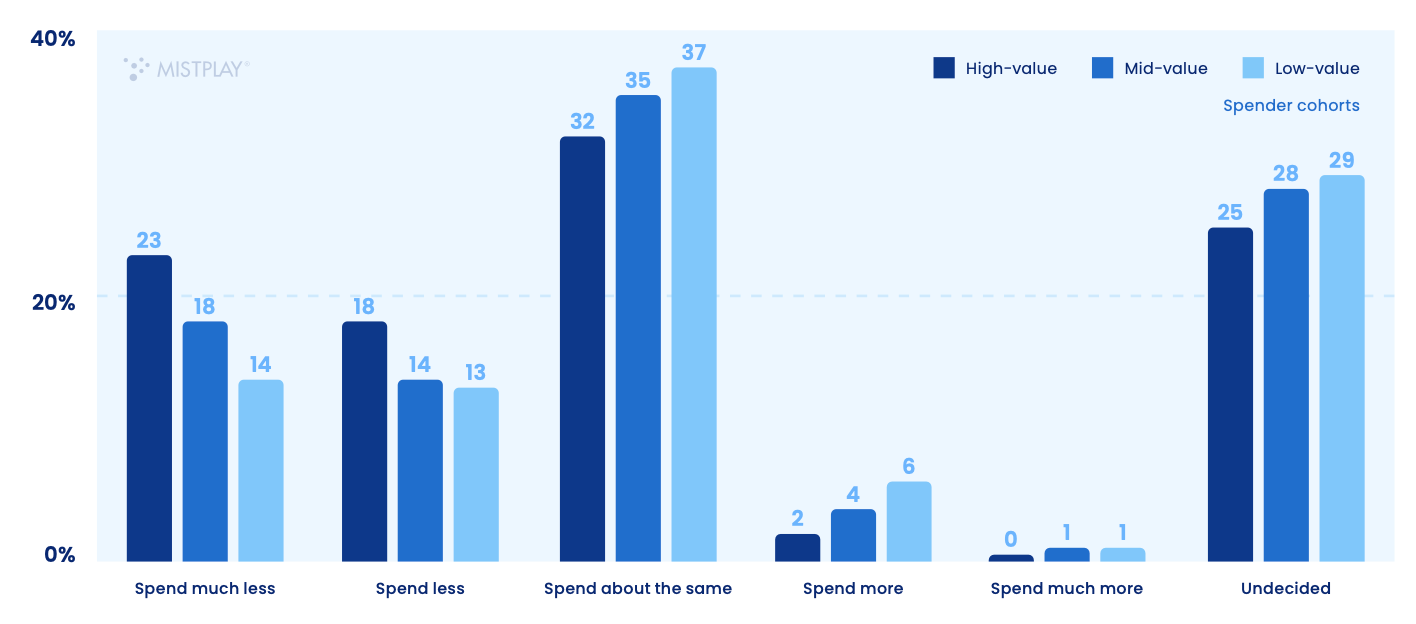
41% of the most valuable paying users plan to reduce their spending on games in 2024.
The most valuable payers, on average, make significantly more purchases than regular paying users.
Acquisition of Paying Users
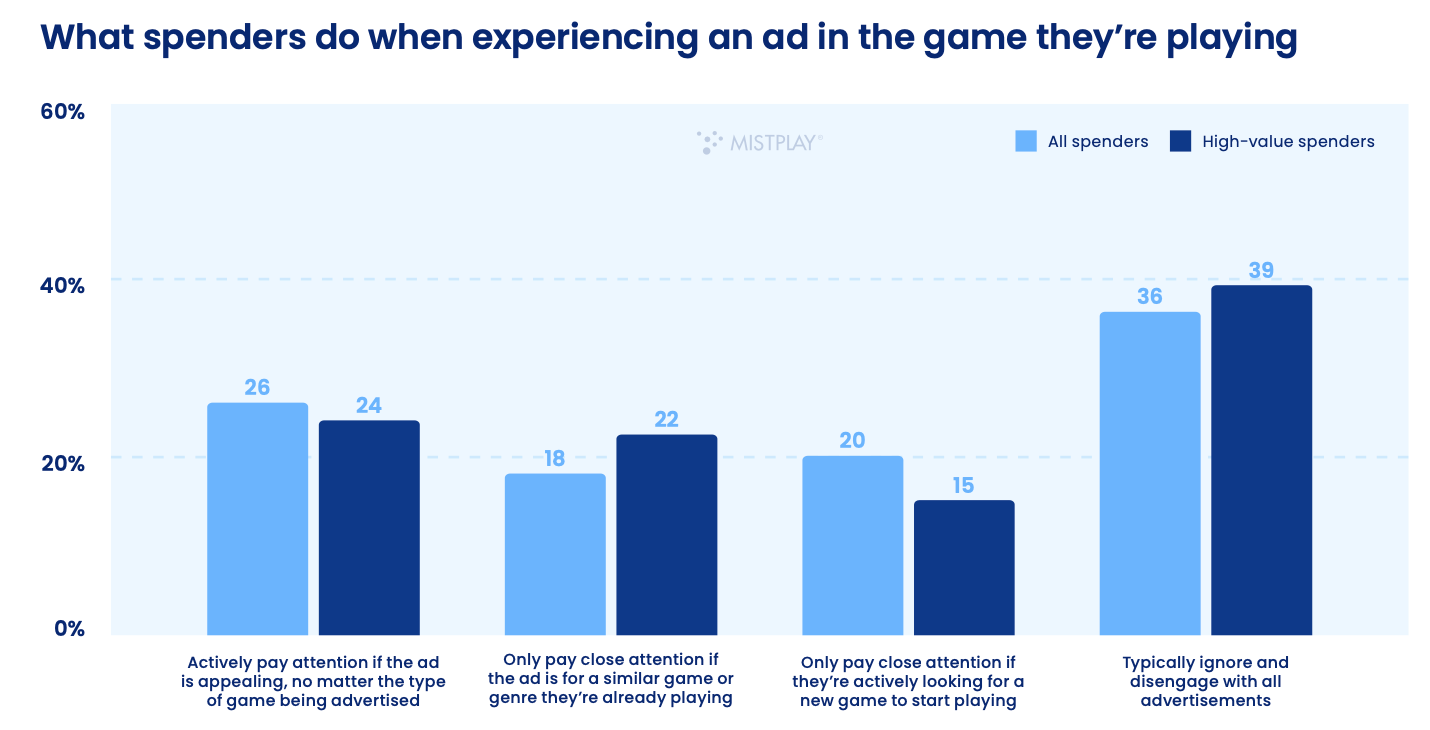
20% of paying users pay attention to advertising only when they are looking for a new project. However, it seems that users still actively engage with ads.
On average, 36% of paying users need to see ads for several days to install a new game. For 22%, it will take weeks; for 13%, a month or more.
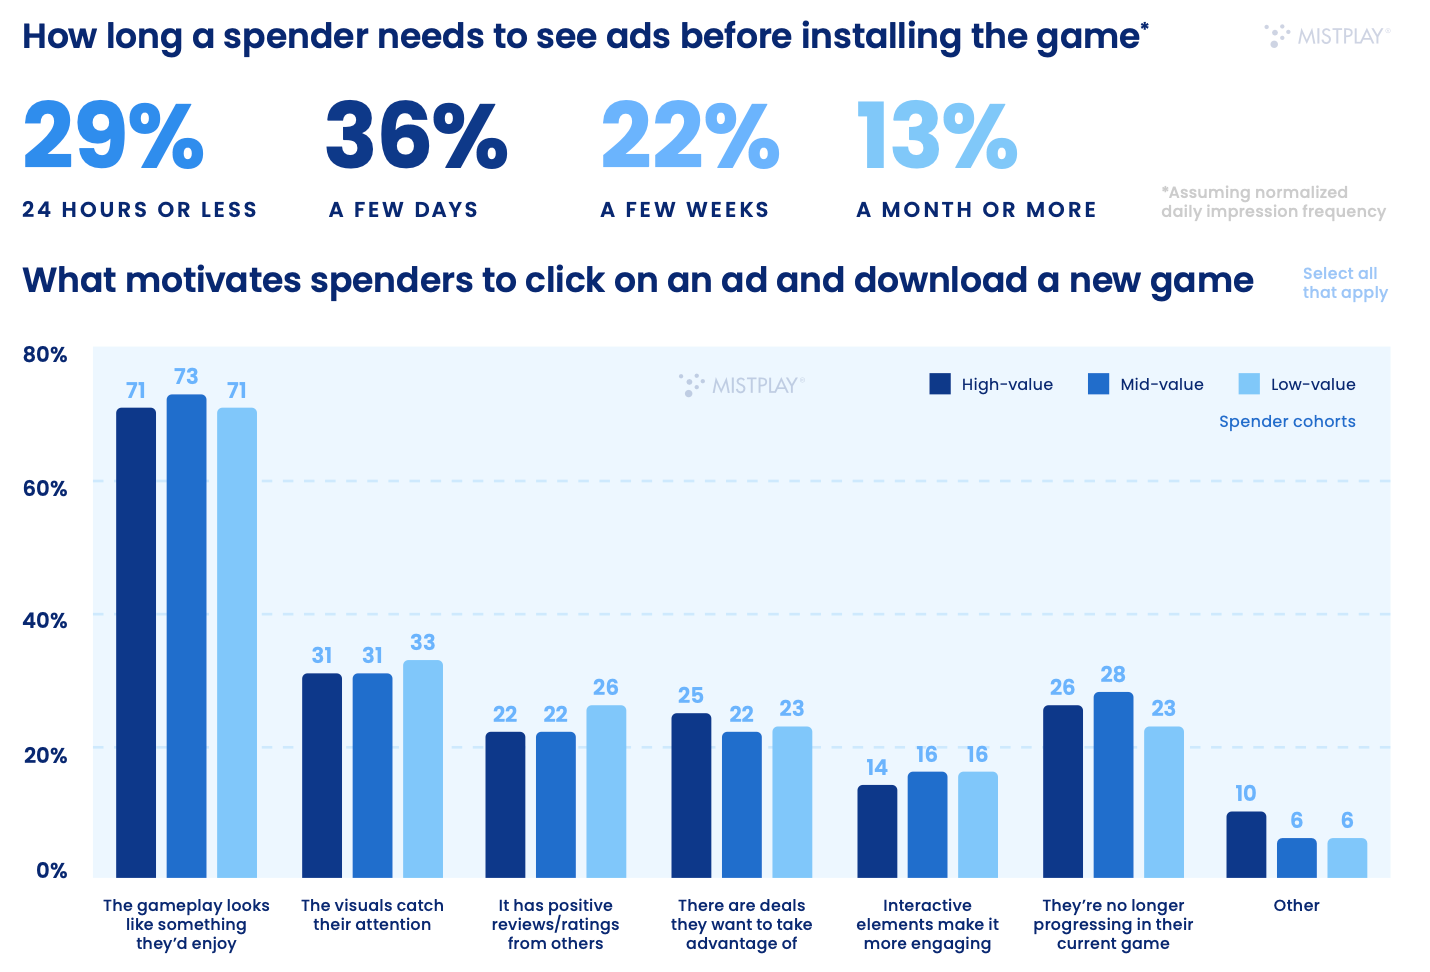
Interesting gameplay is the main reason why a paying user will try a new project.
Facebook, YouTube, TikTok, and Instagram are the main social networks where paying users learn about new games.


80% of paying players cited relaxation as the main motivator for playing.

73% of paying users installed at least one game through a referral program last year.

Behaviour of Paying Players
79% of mobile players make their first purchase within the first month.

Only 8% of paying users buy goods whenever they want. 33% wait for discounts; 25% make purchases only if they can't progress further in the game.

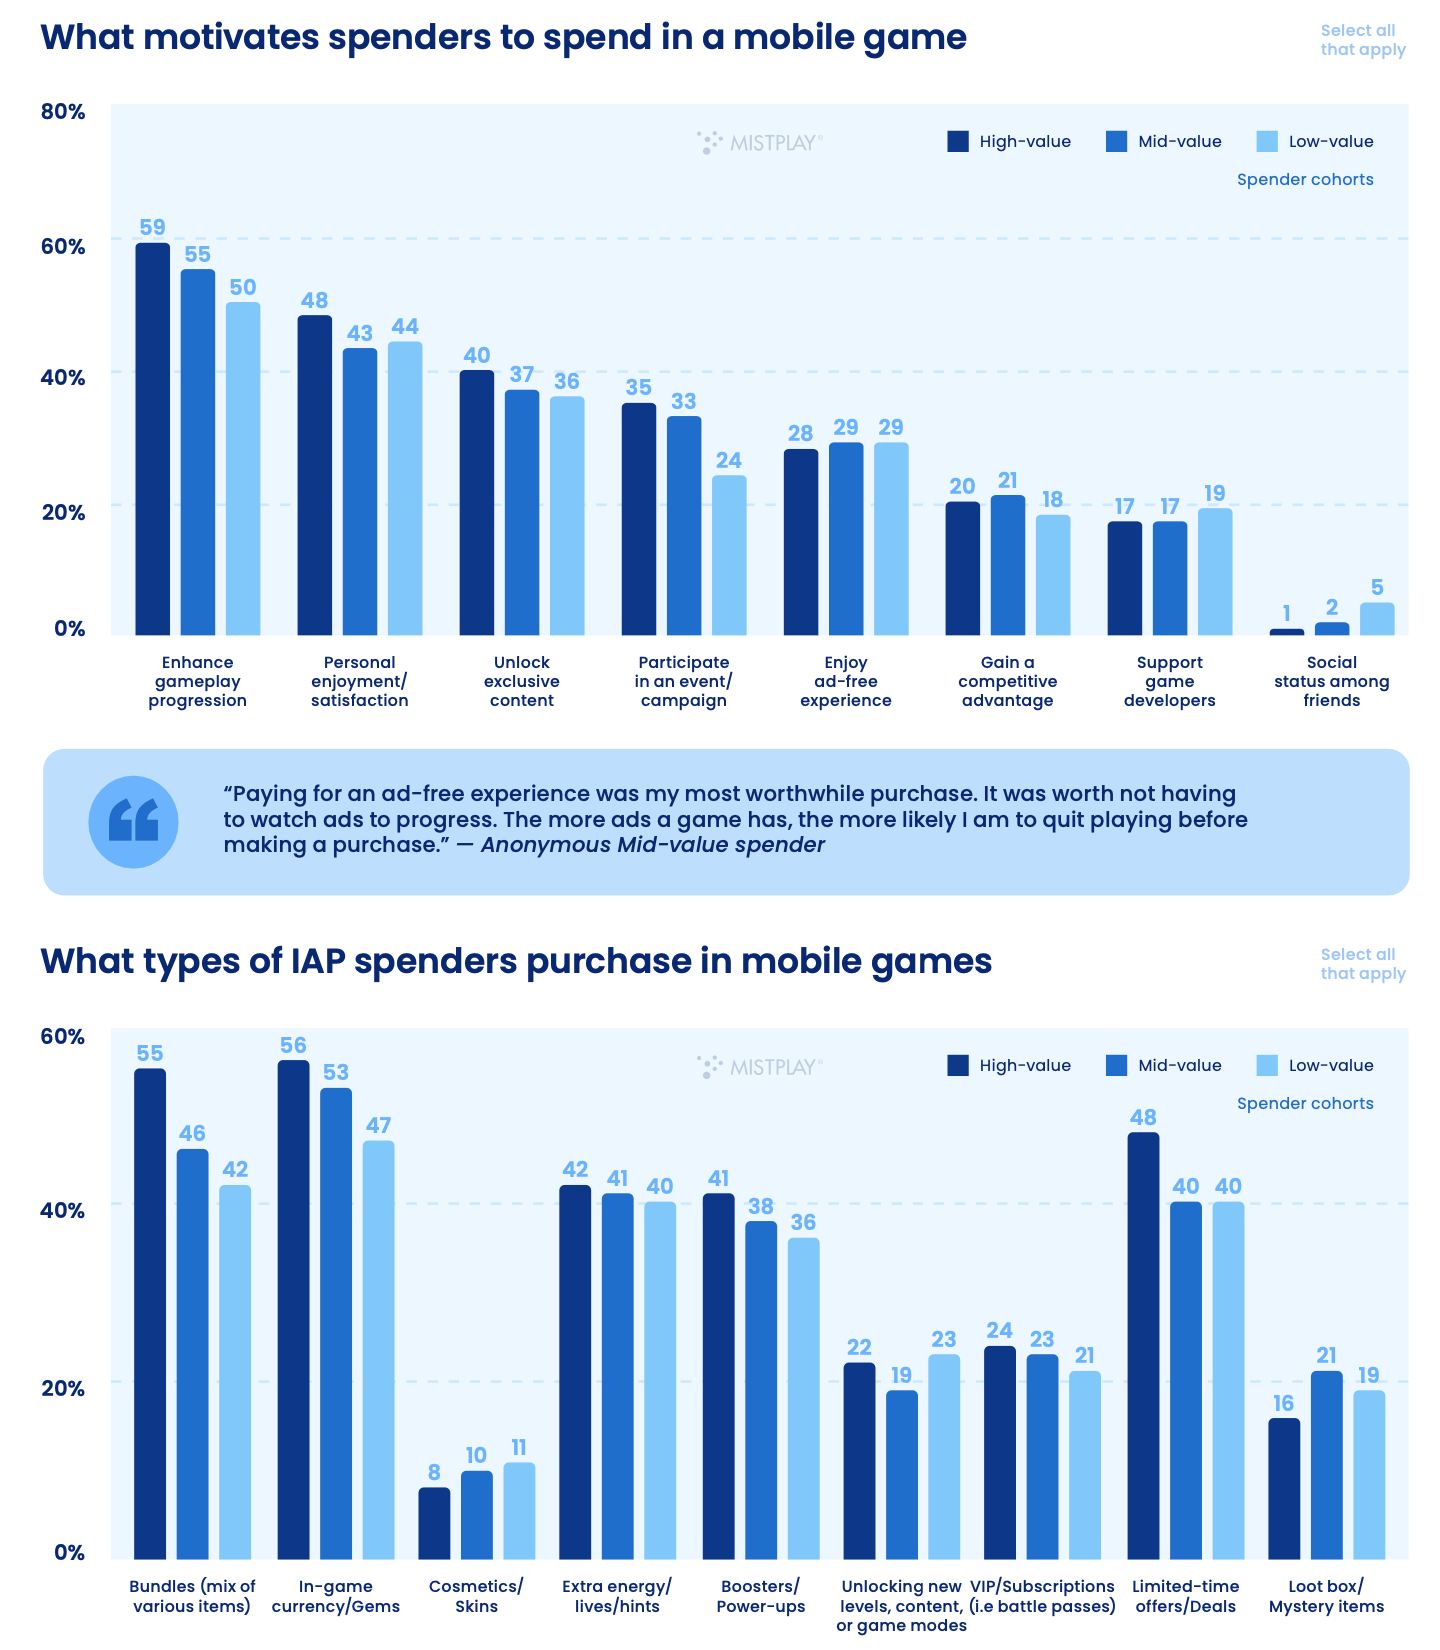
The main motivators for making purchases are progression (54%) and personal enjoyment (44%).
Personalized offers increase spending for 40% of paying users.

Engagement of Paying Users
In-game promos (39%); email (25%); and social media (18%) are the main channels for notifying players about promotions.

Approximately 60% of the highest-paying users noted that they would like to receive some additional rewards for their spending. They are interested in some loyalty program.
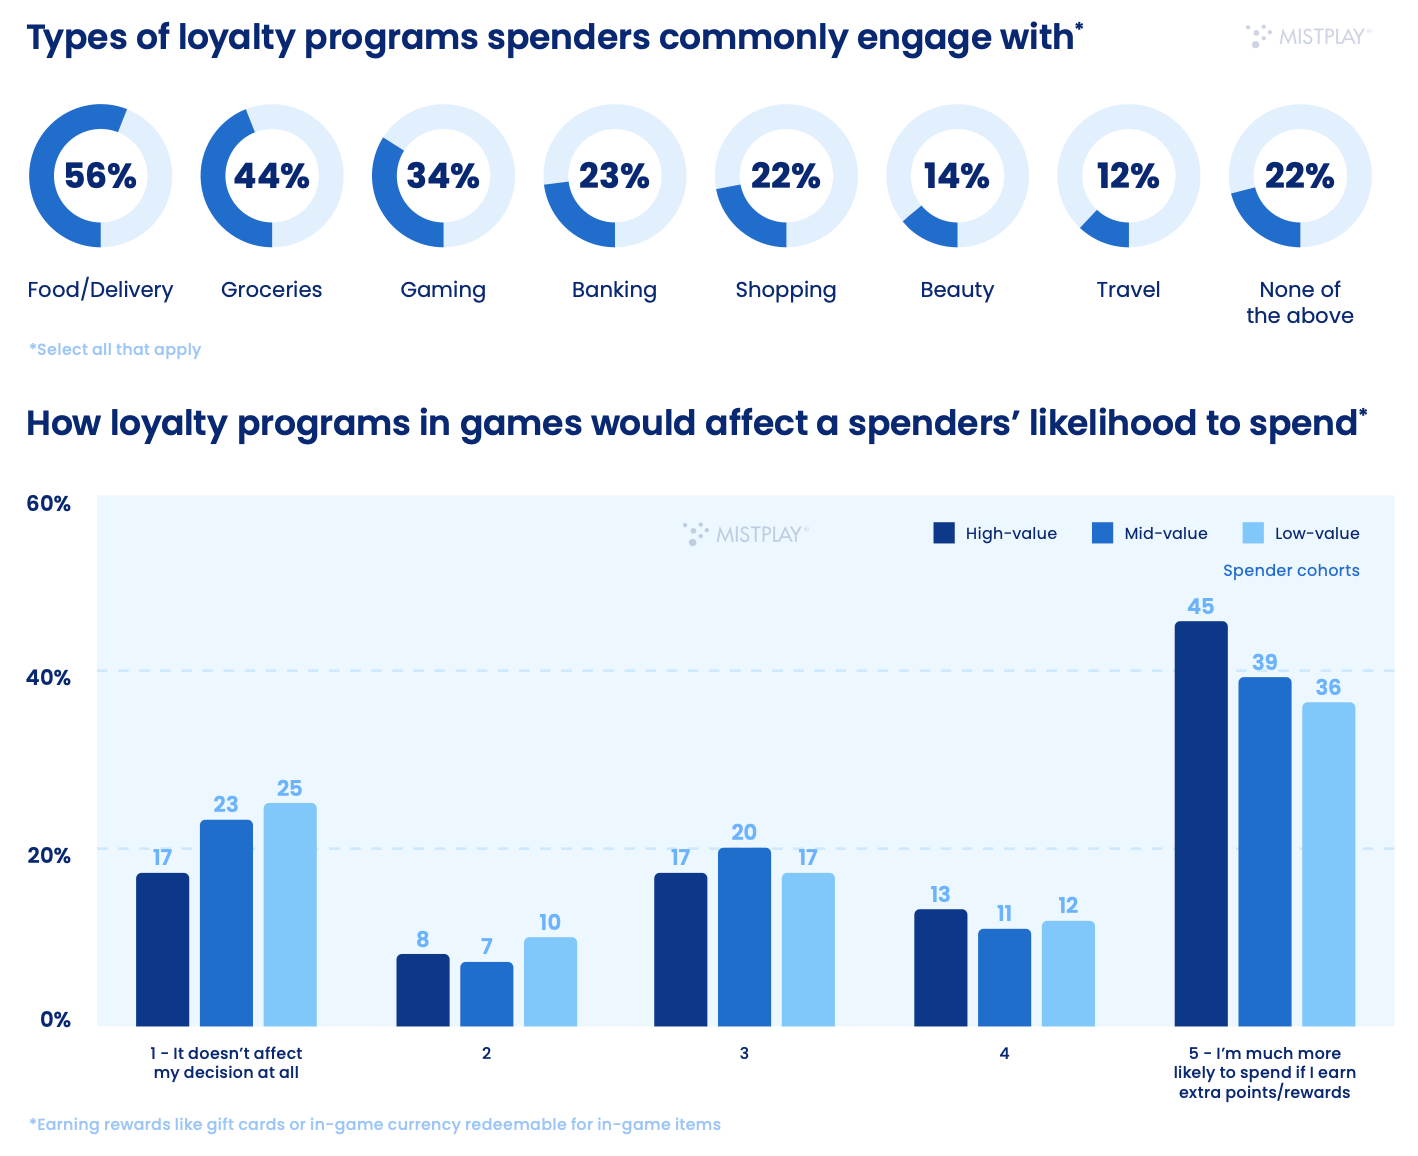
27% of paying users noted that purchases negatively affected their gaming experience. However, for most, the experience is positive.

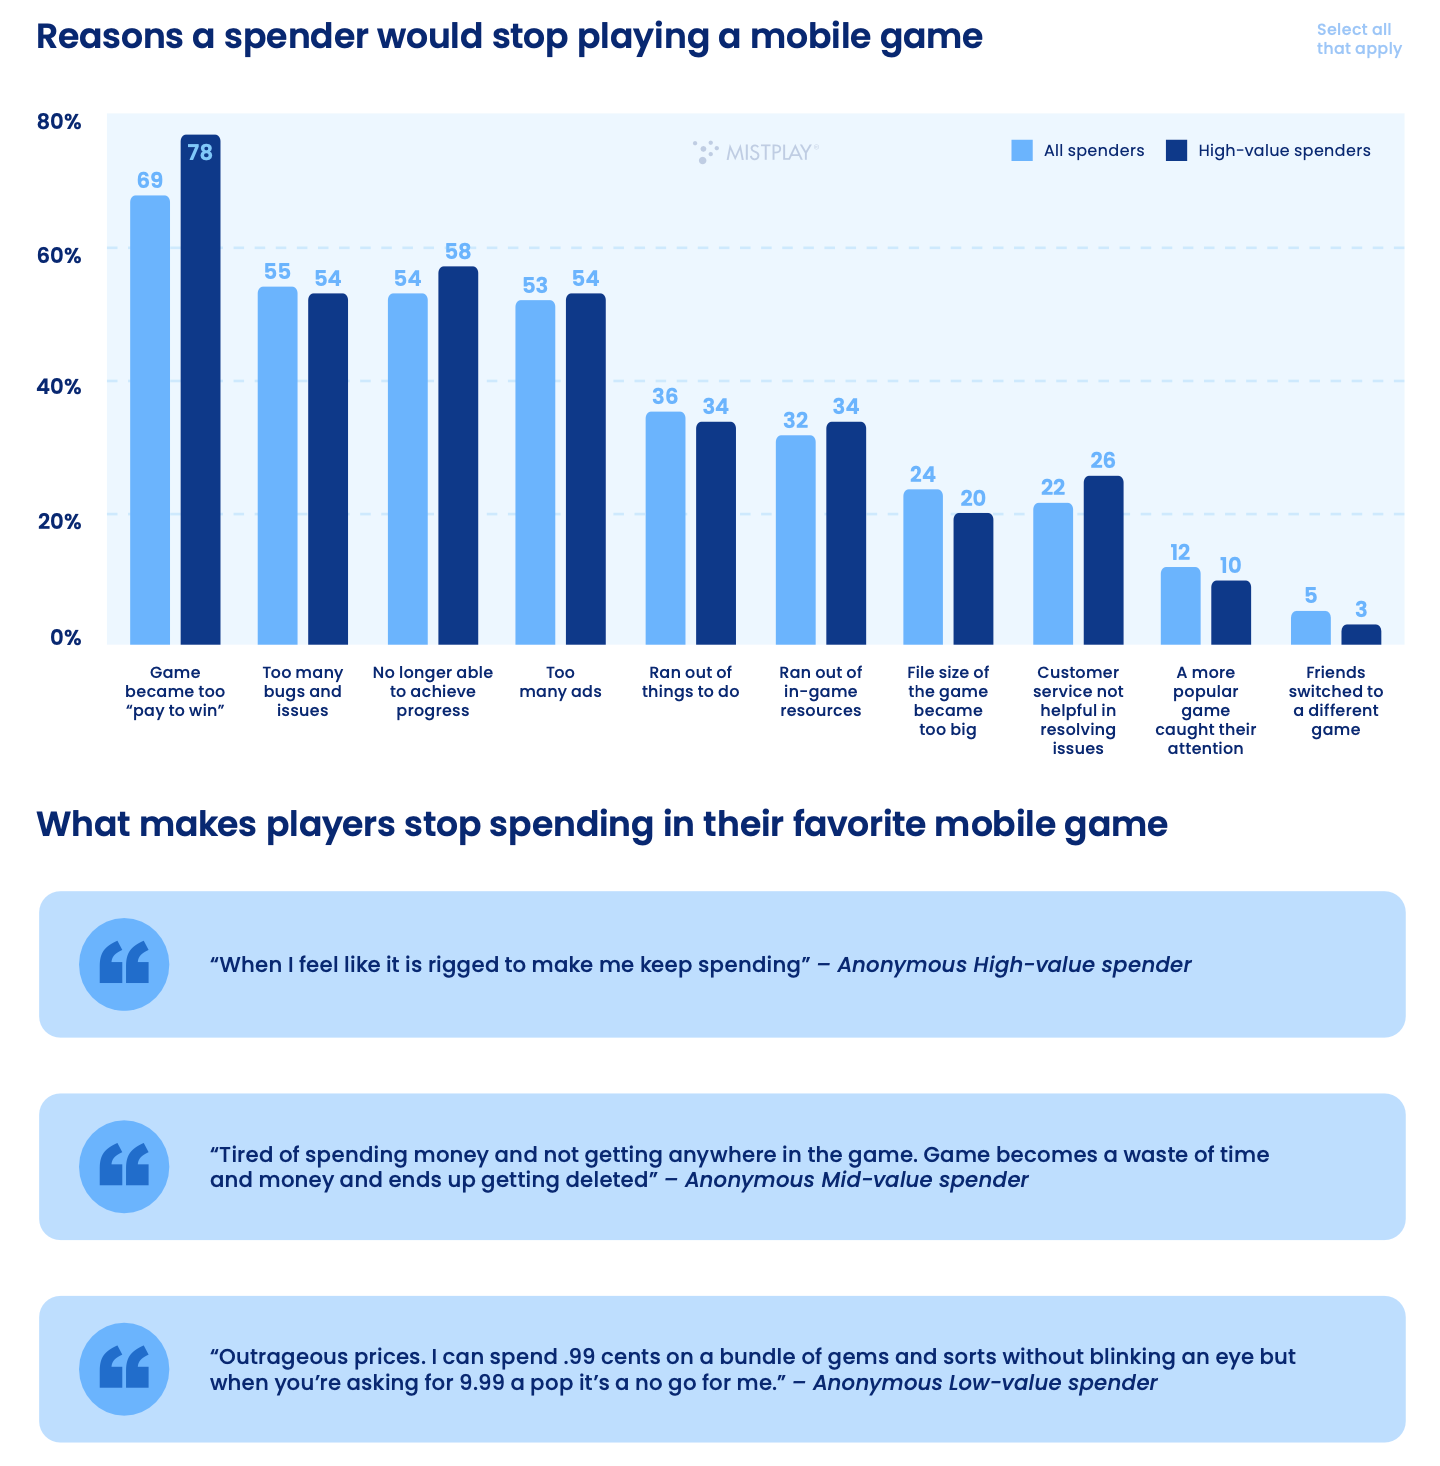
The main factors for paying users leaving the game are pay-to-win mechanics, abundance of bugs and technical issues, lack of progress, and excessive advertising.
Future of Spending in Mobile Games

32% of paying users plan to spend less money in 2024. 5% plan to spend more; 35% do not plan to change their habits. The rest have not yet decided.

Mistplay identifies three main types of paying players in mobile games - casual; midcore, and casino players.
Portrait of a Casual Paying Player
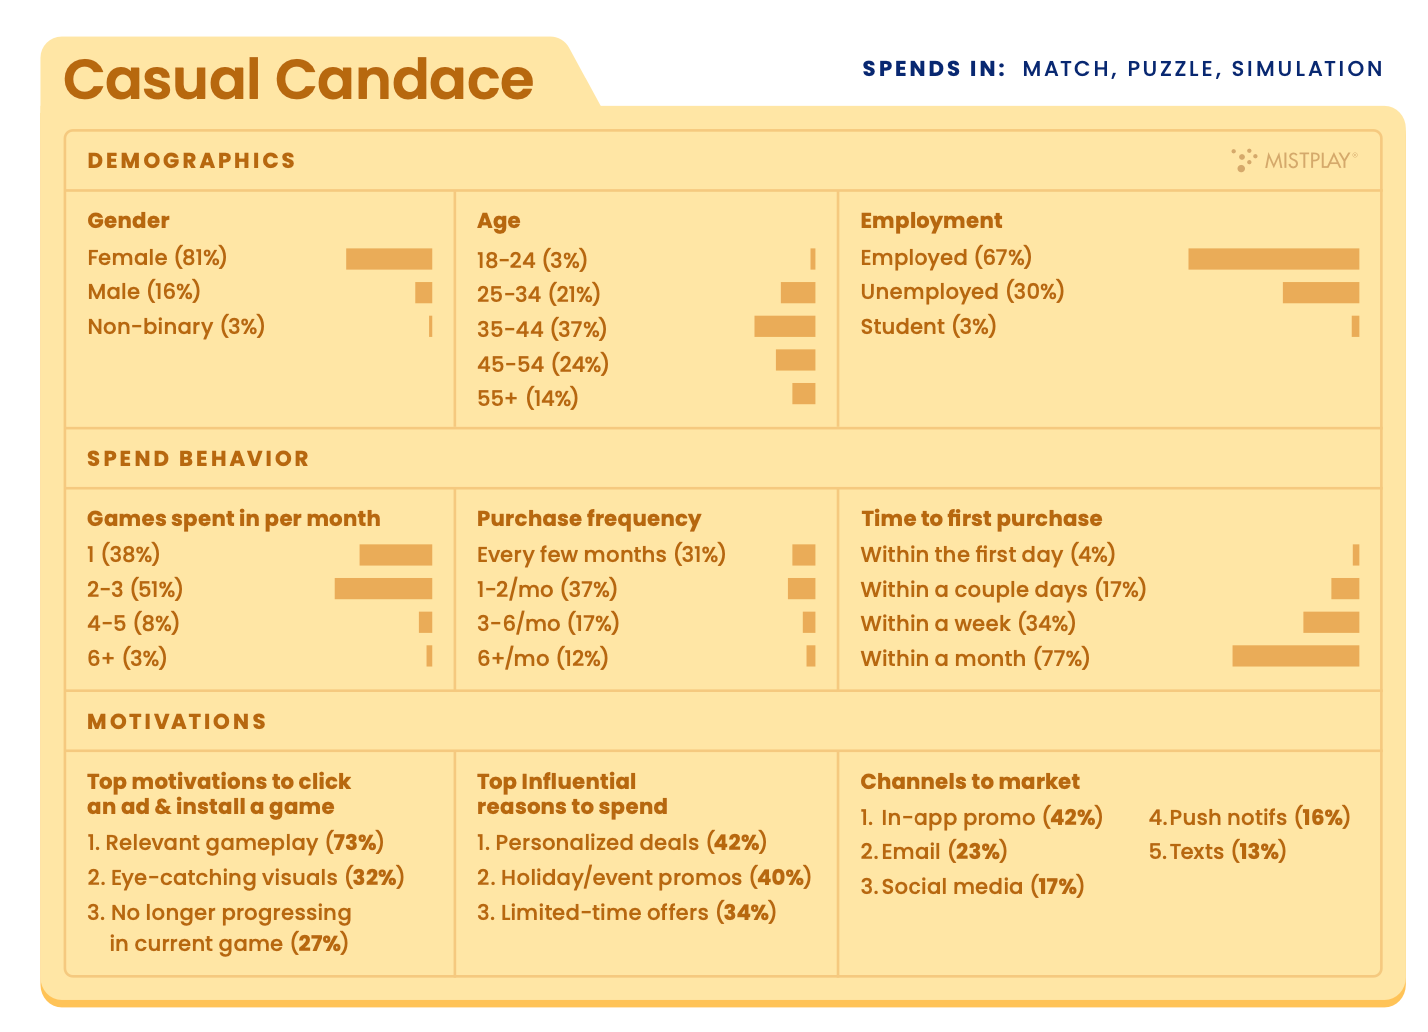
81% of such users are women. 16% are men. 3% are non-binary individuals.
37% are between the ages of 35 and 44; 24% are between 45 and 54 years old.
67% are employed; 30% are unemployed; 3% are students.
51% of these players spend money in 2-3 games. 38% spend only in one game. 37% make purchases 1-2 times a month; 31% once every few months. 17% - 3-6 times a month.
The first purchase for 77% of these players is made in the first month. 34% - within the first week; 17% - within the first couple of days; 4% - on the first day.
❗️Each subsequent cohort includes the previous one. That is, the percentage of those who buy within the first month includes those who buy on the first day.
The main motivators for these players to get acquainted with a new game are relevant gameplay (73%); interesting visuals (32%); unwillingness to continue playing the current game (27%).
The main motivator for spending is personalized offers (42%); holiday discounts (40%); and limited-time offers (34%).
The most effective promotion channels are in-game promos (42%); email (23%); social media (17%); push notifications (16%).
In 2024, 28% of such players plan to spend less on games. 17% plan to make purchases less frequently. 20% plan to make more purchases during discounts.
Portrait of a Midсore Paying Player
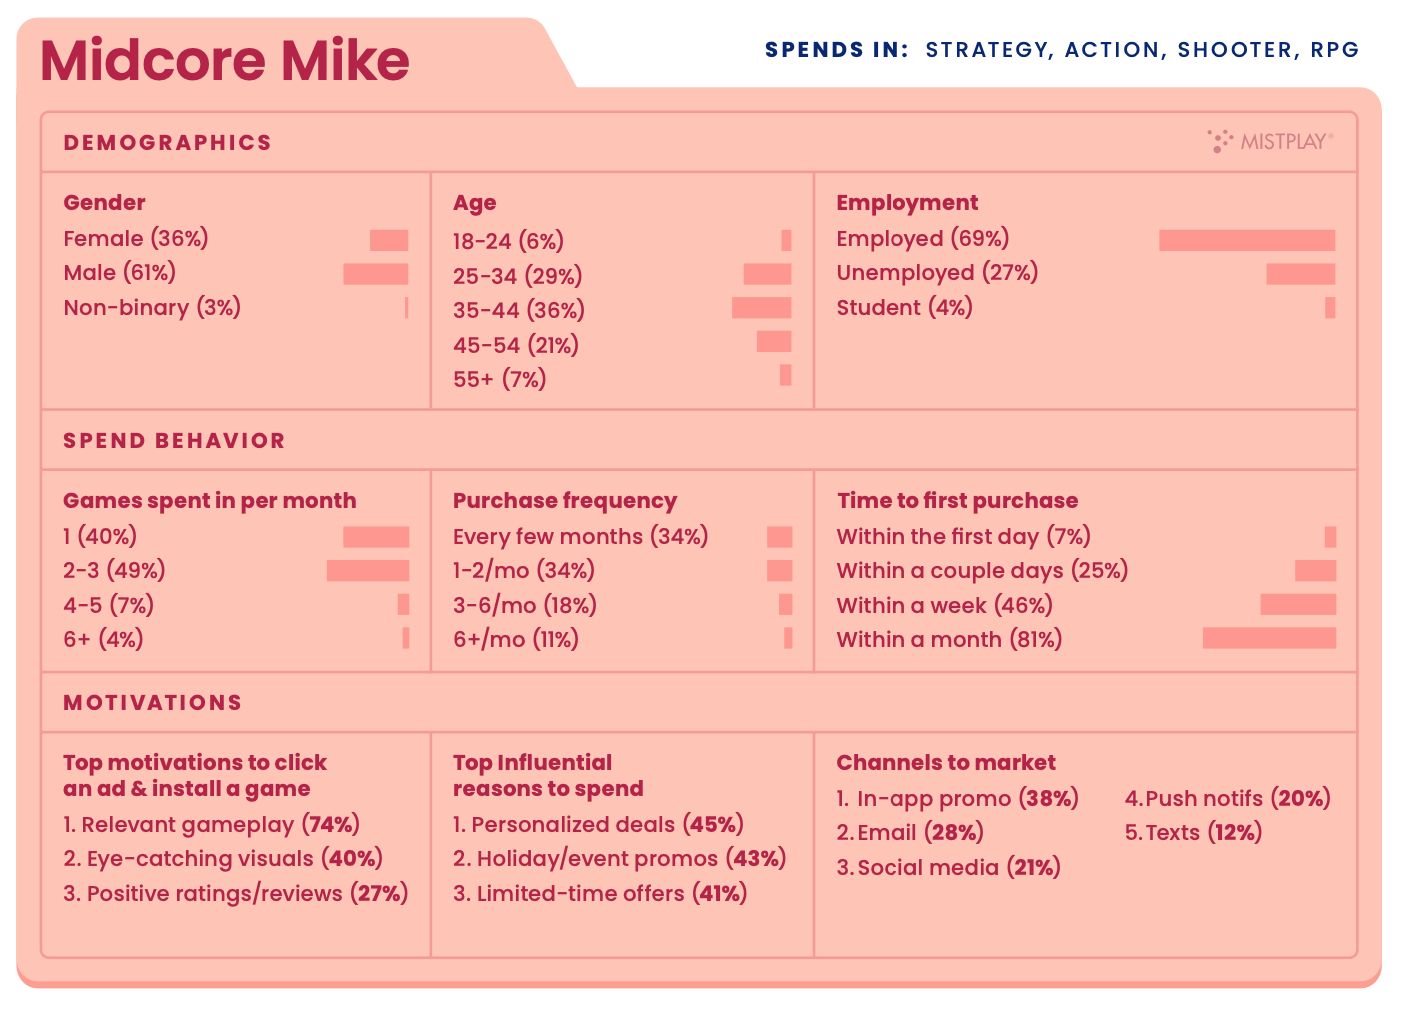
61% of such players are men; 36% are women; 3% are non-binary individuals.
36% of these users are aged 35-44; 29% are aged 25-34; 21% are aged 45-54.
69% are employed; 27% are unemployed; 4% are students.
49% of these users play 2-3 games per month; 40% play only one game. 34% make a purchase once every few months; the same percentage makes 1-2 purchases a month. 18% make purchases 3-6 times a month; 11% - more than 6 times a month.
81% of mid-core users make their first purchase within the first month. 7% only need 1 day for this.
The main motivators for this category to install a new game are relevant gameplay (74%); interesting visuals (40%); positive reviews and ratings (27%).
The main motivators for purchase are personalized offers (45%); holiday discounts (43%); limited-time offers (41%).
The main promotion channels are in-game promos (38%); email (28%); social media (21%); and push notifications (20%).
In 2024, 29% of users in this category plan to spend less. 18% plan to make purchases less frequently. And 26% plan to make more purchases during discounts.
Portrait of a Casino Player

71% are women; 22% are men; 1% are non-binary individuals.
41% of this category are aged 35-44; 23% are aged 45-54. 63% are employed; 34% are unemployed; 3% are students.
55% play 2-3 games per month; 26% play only 1 game.
31% make 1-2 purchases per month; 24% - less than 1 purchase per month; 23% - 3-6 purchases per month.
81% make their first payment within the first month.
These users are motivated to change games by relevant gameplay (70%); visuals (33%); unwillingness to continue in the current game (27%).
42% are motivated to purchase by personalized offers; 40% - holiday discounts; 34% - limited-time offers.
The most effective notification channels for this audience are in-game promos (37%); email (36%); push notifications (21%); social media (21%).
In 2024, 27% of this audience plans to spend less on games. 18% plan to buy less frequently. And 21% plan to redistribute their spending to discount seasons.