

Weekly Gaming Reports Recap: May 12 - May 16 (2025)
Anzu shared the state of the intrinsic in-game ads; Voyer Law shared conditions for the indie publishing agreements they observe; and InvestGame highlighted the state of gaming AI investments.

Reports of the week:
Voyer Law: Publishing Agreements in 2025
Alinea Analytics: Microsoft became the most successful publisher on PlayStation by copies sold in April
UKIE: UK Games Market fell by 1.8% in 2024
InvestGame & GDEV: VC Investments in Gaming AI
Anzu: Intrinsic In-Game Advertising Trends in Gaming
Voyer Law: Publishing Agreements in 2025

The company analyzed over 100 agreements between developers and publishers from 2017 to 2025.
❗️While the report may not fully reflect the current realities of publisher-developer relationships, there is almost no such information publicly available.
Voyer Law divided the agreements into three general categories: with an advance payment (where the publisher funds development), without an advance, and agreements for publishing only console versions of a game.

The average revenue share in agreements with an advance is 58.2% in favor of the developer. The median is 50%. The highest developer share in the sample is 90%, the lowest is 2.5%.
In agreements without an advance, the average developer share is higher - 67.9%. The median is 70%. The highest revenue share in the sample is 86% in favor of the developer, the lowest is 50%.
For console porting deals, the average revenue share is 63.1% in favor of the developer, the median is 60%. The highest revenue share is 85%, the lowest is 50%.

In 3.2% of agreements with an advance, the publisher’s mark-up was included. Other partnership agreements had no such wording.
Audit rights are present in most cases - 83.3% of agreements with an advance, 69.3% of console publishing agreements, and 47.1% of agreements without an advance.
Consider subscribing to the GameDev Reports Premium tier to support the newsletter. Get access to the list of curated articles & archive of Gaming Reports that I’ve been collecting since 2020.
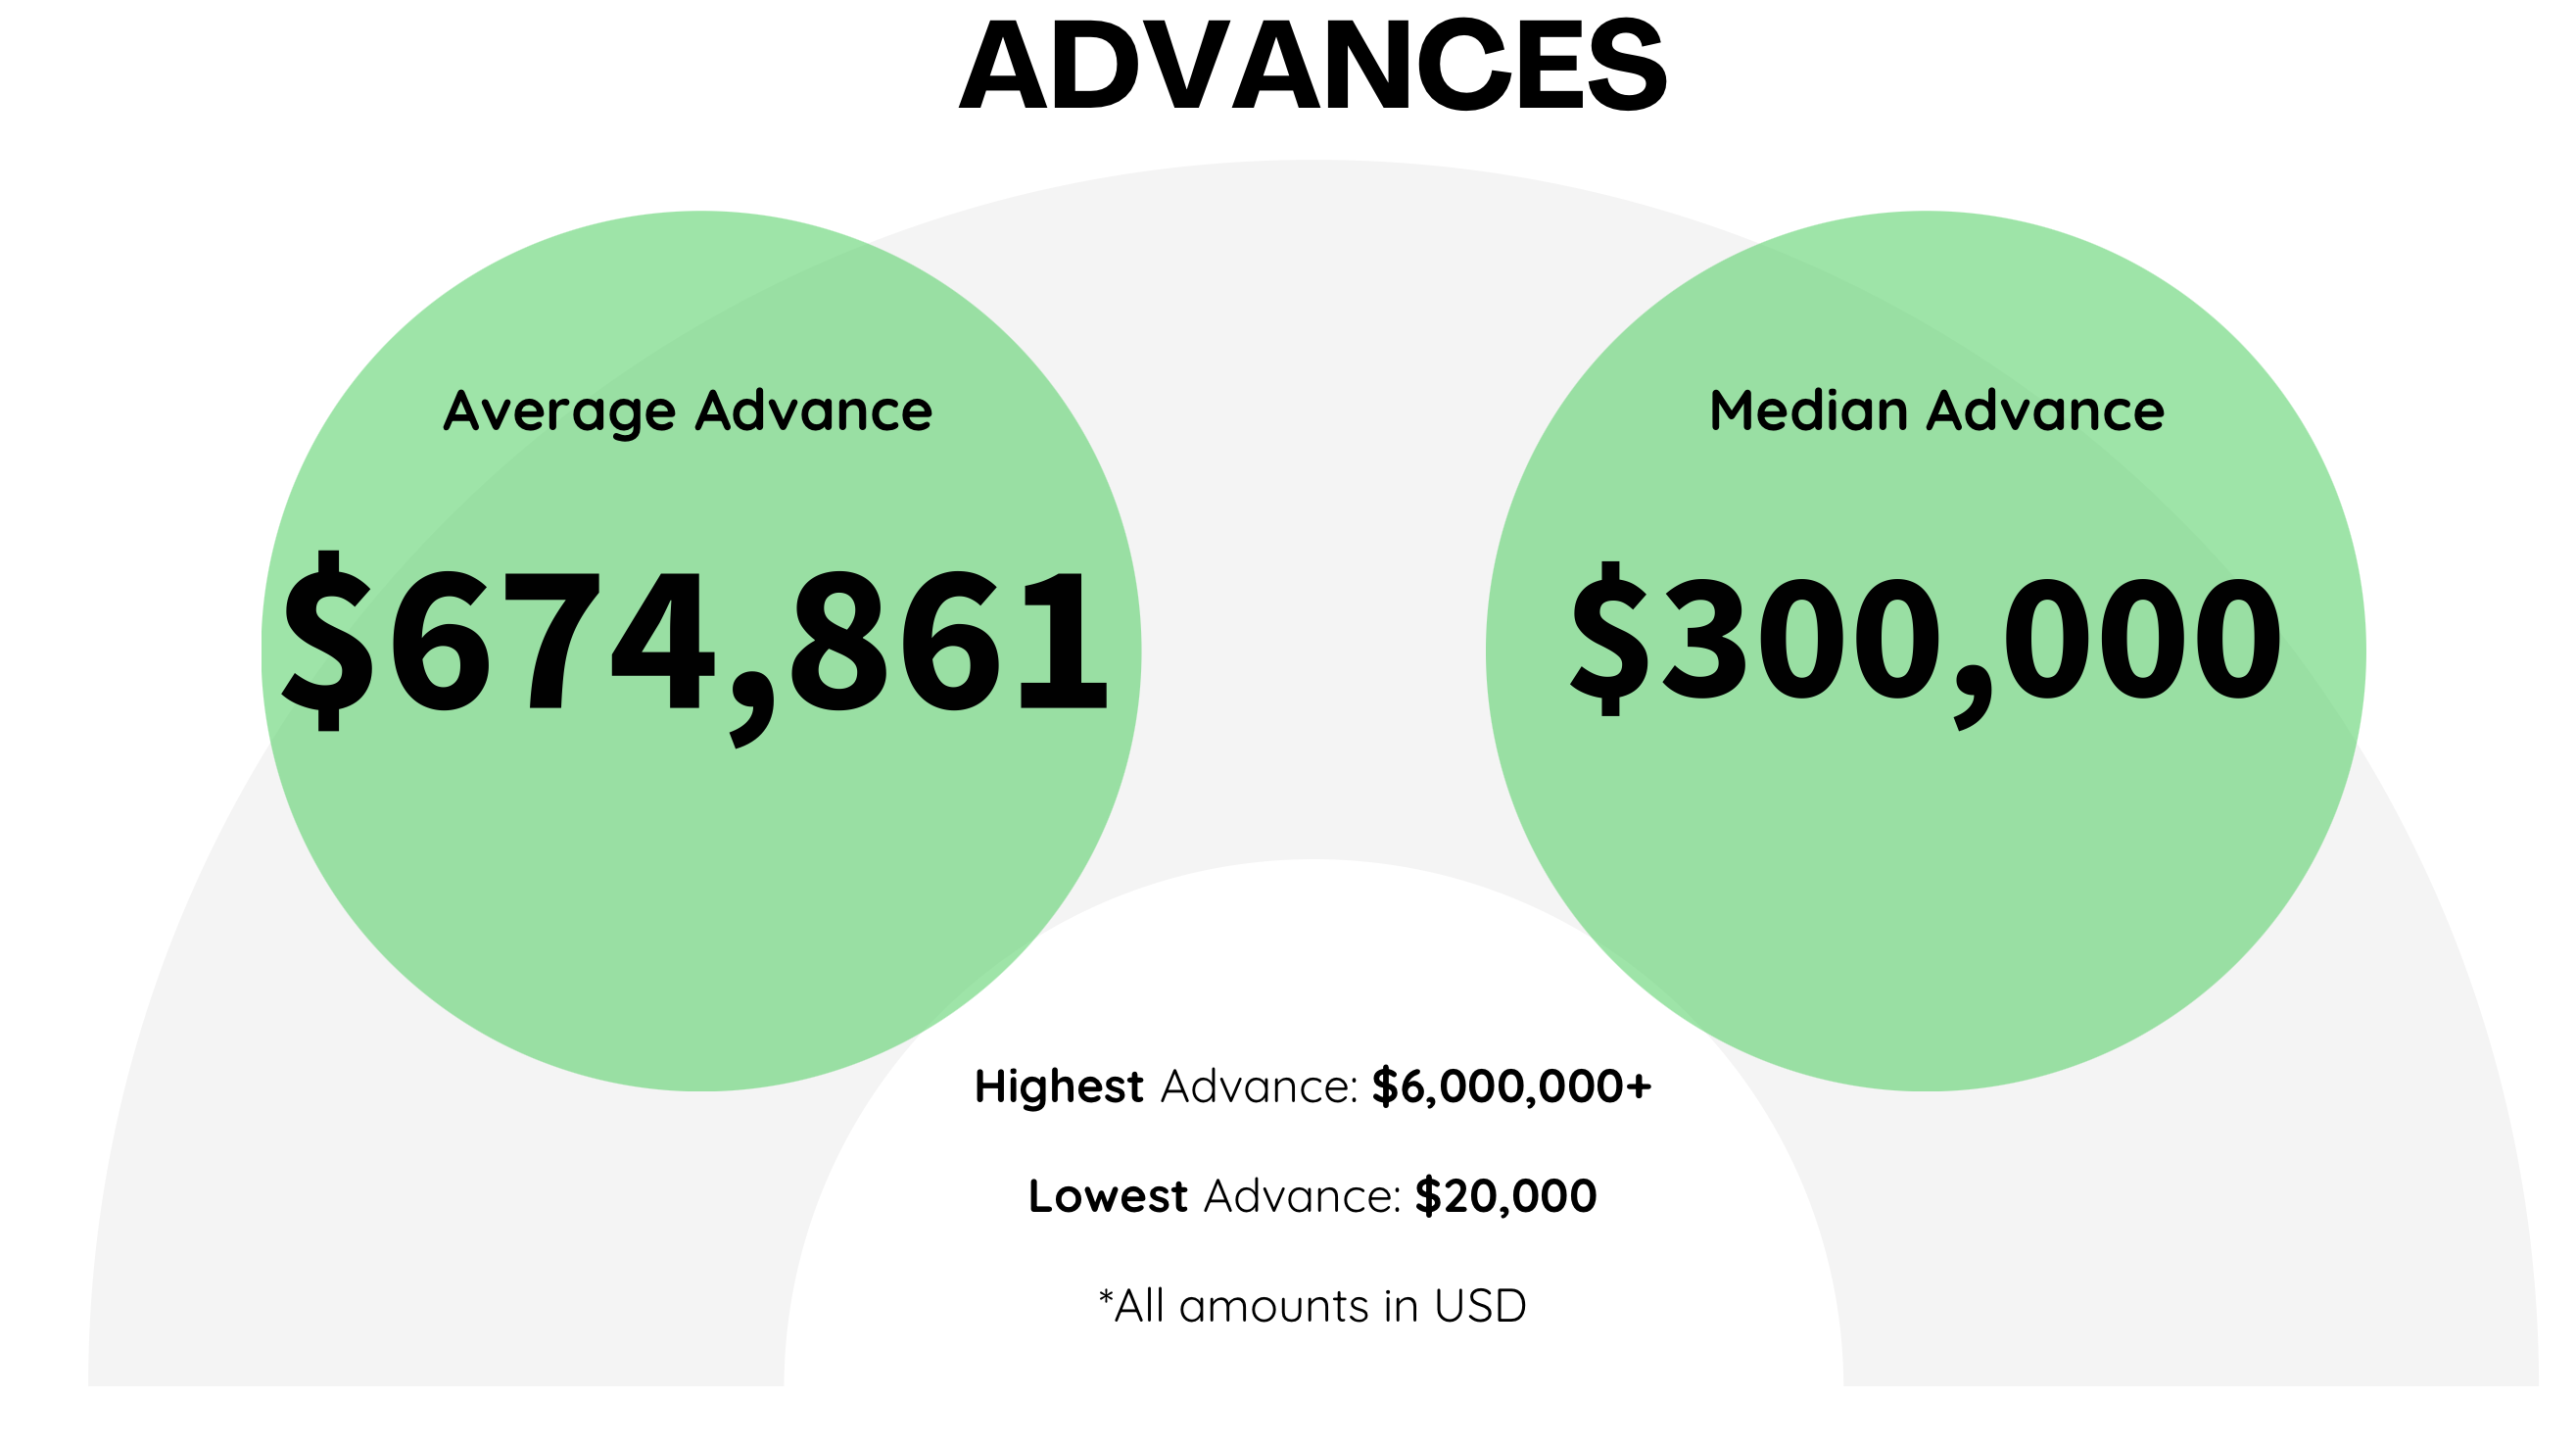
The average advance amount is $674,861; the median is $300,000. The highest advance in the sample is over $6M, the lowest is $20,000.
In 95.5% of cases, development funding was provided upfront. In 79.7% of cases, the payment was tied to milestone completion. In 93.9%, the advance was recouped (compensated from the revenue share). In 48.4% of cases, recoupment occurred before the partner received their first revenue share payout.

In deals with an advance, sequel rights were included in 63.49% of contracts. If sequel rights were specified, in 56.41% of cases this was an exclusive right for the partner to develop the sequel, and in 43.59% - the possibility to enter negotiations.
In deals without an advance, a sequel rights clause appeared in 47.06% of cases. Of this percentage, the majority-85.71% - gave the partner the right to enter negotiations for the sequel.

Finally, in console publishing deals, sequel rights appeared only in 25% of cases.
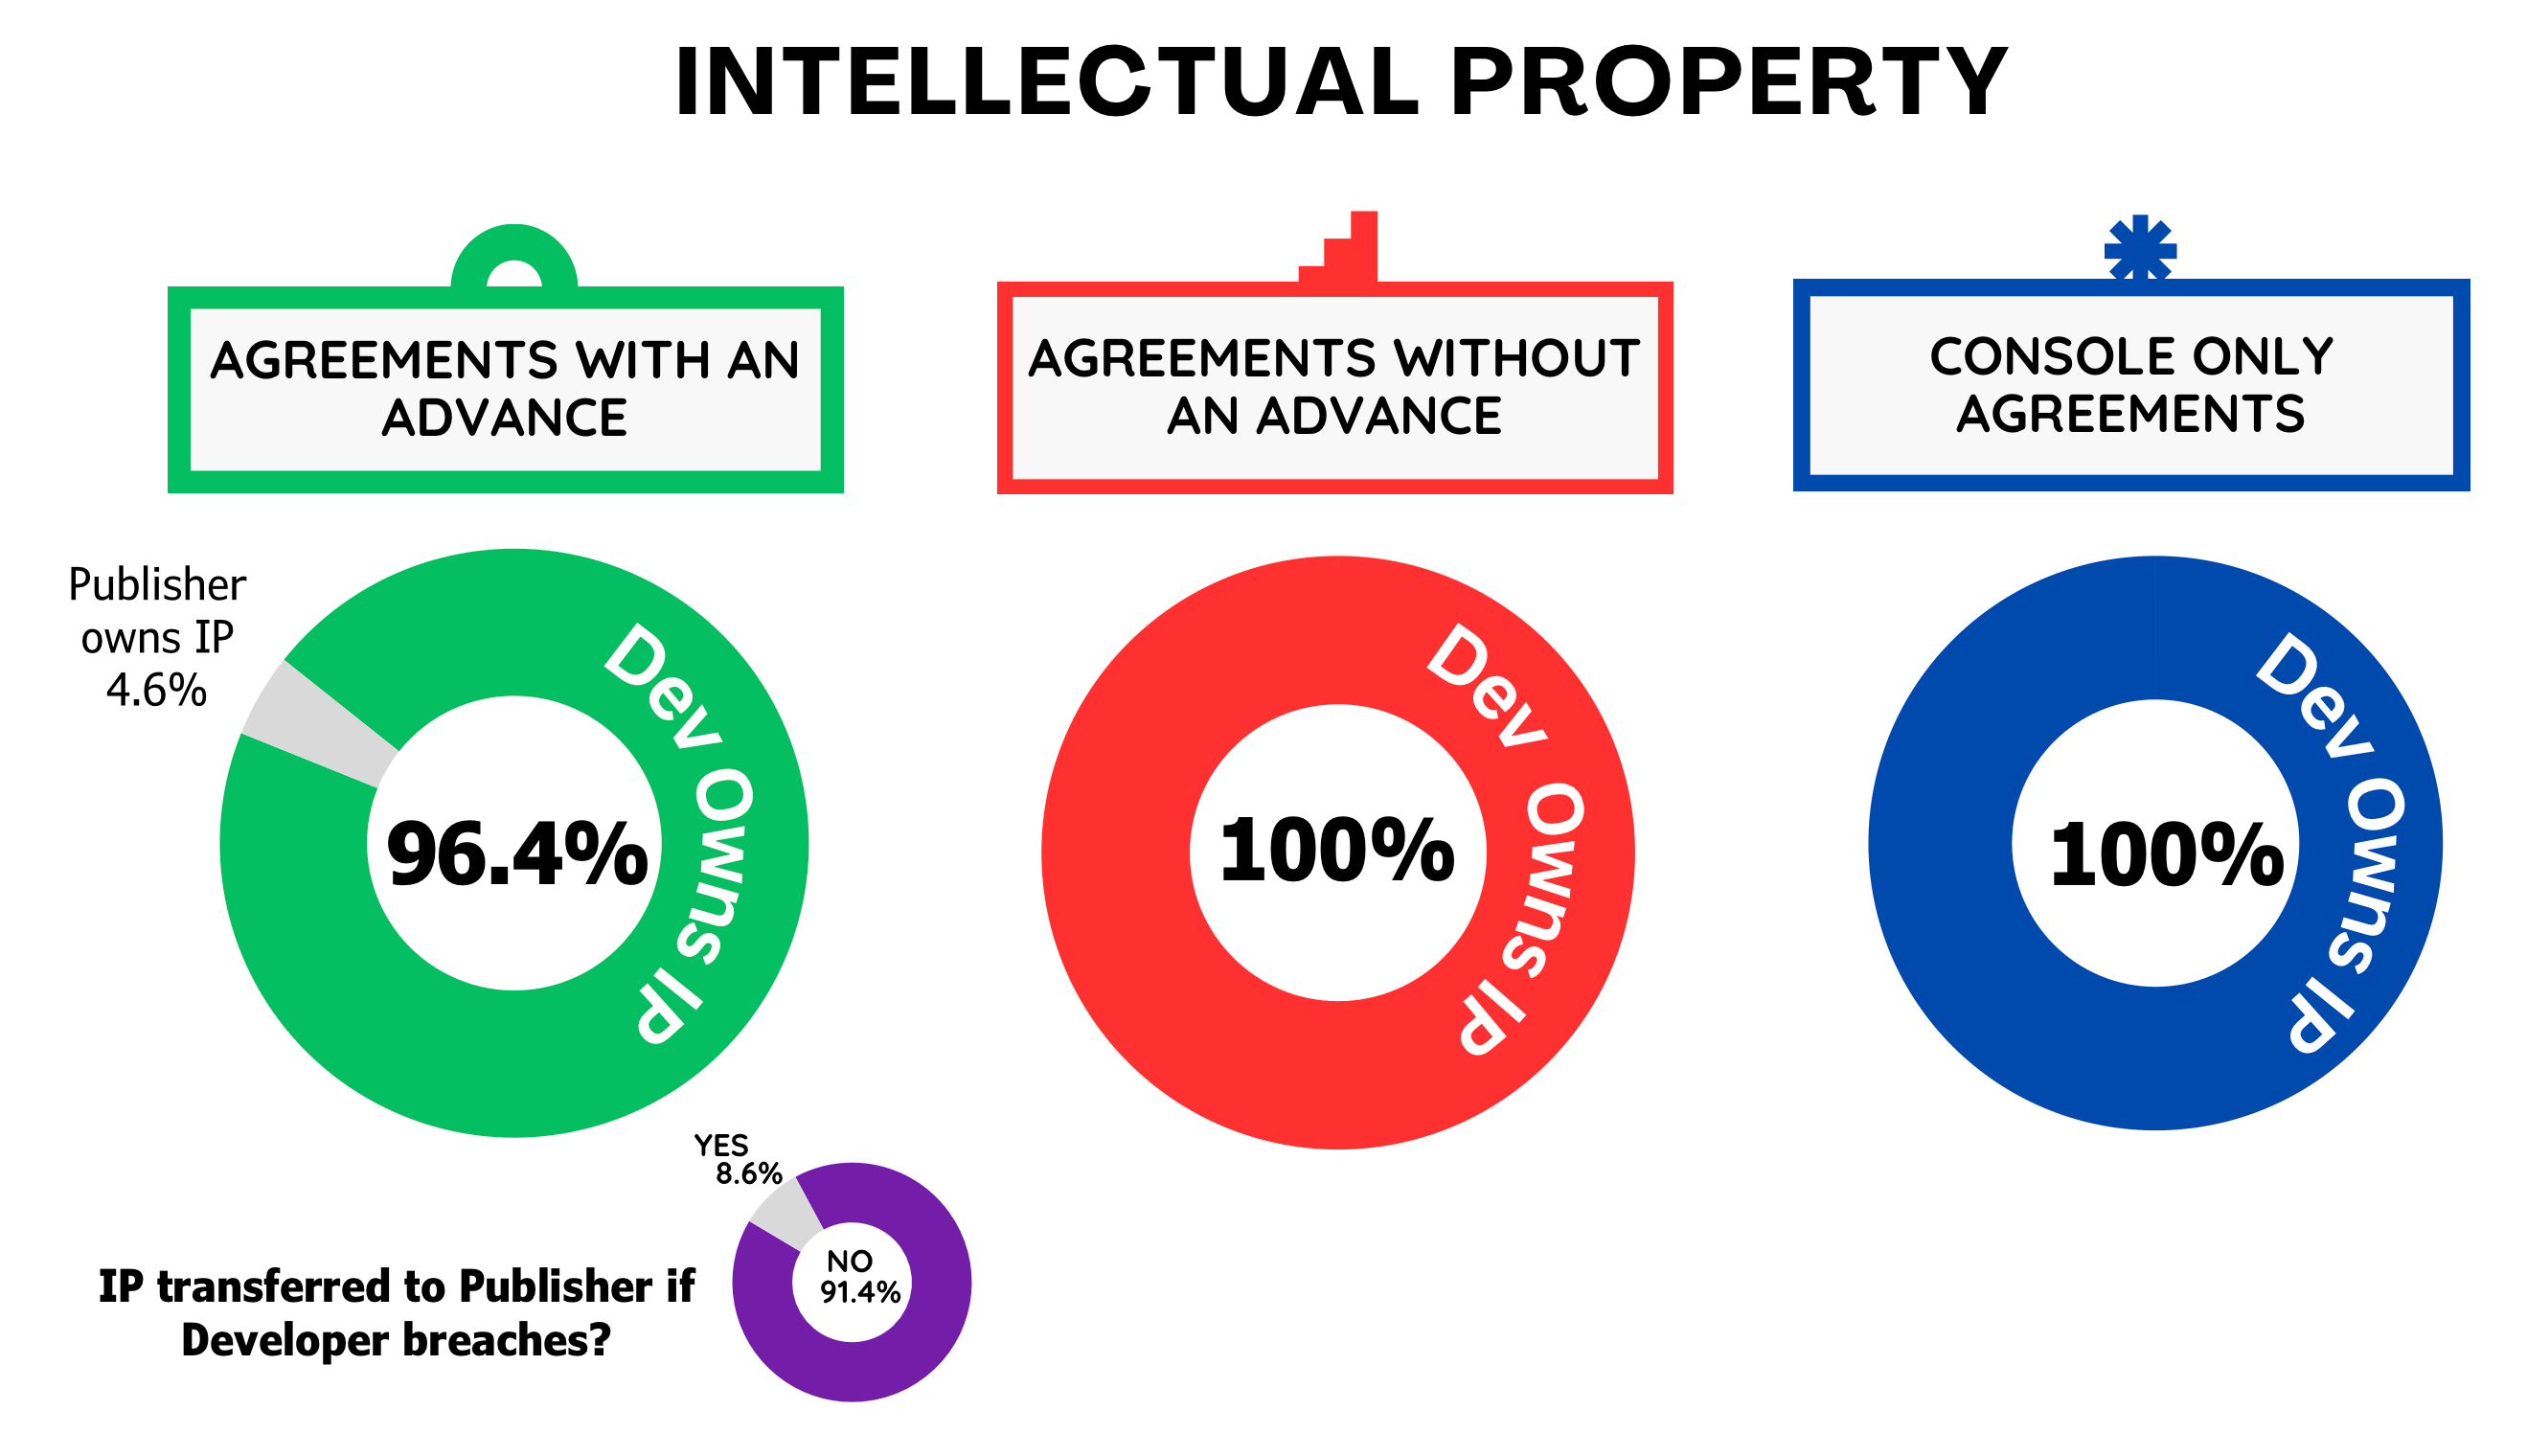
In deals with an advance, 96.4% of developers retained IP rights. Even in the event of a contract breach, in 91.4% of cases, the IP remained with the developer. In all agreements without an advance or with console publishing, the IP remained with the developer.
In 56.5% of deals with an advance, there was a revenue share from merchandise sales. Such terms are also present in half of the deals without an advance and in 25% of deals for console-only publishing.
In deals with an advance, the average merchandise revenue share is 48.3% in favor of the developer. Where there is no advance-47.2% in favor of the developer. In console publishing deals - 40% in favor of the developer.

85% of agreements of all types have a fixed term (15% are perpetual). In 49.2%, there is an auto-renewal clause.
▫️The average term of agreements with an advance is 6.84 years. Without - 4.18 years. The shortest are console publishing deals - 3.7 years.
An average publishing deal in 2025, according to Voyer Law’s sample
Upfront payment of $674.8K.
Revenue share - 57.7% in favor of the developer, paid in tranches.
The developer has audit rights.
The developer retains IP rights.
The publisher has the right to negotiate for the sequel.
The developer’s revenue share from merchandise sales is 48.3%.
Contract term-6 years with auto-renewal.
Alinea Analytics: Microsoft became the most successful publisher on PlayStation by copies sold in April

Top 10 on PlayStation in April 2025
Minecraft (987,000 copies), Forza Horizon 5 (837,300 copies), EA FC 25 (713,400 copies), The Elder Scrolls IV: Oblivion Remastered (637,200 copies), and Assassin's Creed Shadows (368,300 copies) were the best-selling titles on PlayStation in April 2025. Three of these projects (Minecraft, Forza Horizon 5, and The Elder Scrolls IV: Oblivion Remastered) are published by Microsoft.

Microsoft accounted for 69% of top-5 PlayStation sales in April.
Minecraft’s April sales nearly doubled, driven by the popularity of the movie adaptation.
73.2% of The Elder Scrolls IV: Oblivion Remastered buyers also played The Elder Scrolls V: Skyrim on PlayStation.

Microsoft games made up almost half (48%) of all copies sold on PlayStation. Notably, Microsoft had more games in the top 10 than Sony (Sony’s entries were MLB: The Show 25 and The Last of Us 2).
Assassin's Creed Shadows is performing well on the platform, selling 368,300 copies in April. Total sales have reached 1.7 million.
Clair Obscur: Expedition 33 is selling well with 354,300 copies in April. More details on the project’s sales can be found here.
Consider subscribing to the GameDev Reports Premium tier to support the newsletter. Get access to the list of curated articles & archive of Gaming Reports that I’ve been collecting since 2020.
The release of the second season of The Last of Us TV series appears to have a positive impact on sales. The game sold 222,000 copies on PS5 in April (entering the top 10), and it’s also selling actively on Steam.
Indiana Jones and the Great Circle sold 151,100 copies on PlayStation 5 in April, ranking 18th by copies sold.
Dynamics of Microsoft game launches on PlayStation
Sea of Thieves is one of Microsoft’s most successful titles on PlayStation, with over 2 million copies sold.
However, launch sales show Forza Horizon 5 is selling significantly better. In the first 8 days after release, the game sold over 1.4 million copies, 2.1 times more than Sea of Thieves in a comparable period, and 10 times more than Indiana Jones and the Great Circle.

Alinea Analytics notes that 60% of Forza Horizon 5 players on PlayStation also played The Crew 2.
UKIE: UK Games Market fell by 1.8% in 2024

In 2024, the UK games market reached £7.63 billion, down 1.8% compared to 2023.
Software sales
Game software sales grew by 0.58% to £5.14 billion.
The mobile segment increased by 8.1% year-on-year to £1.725 billion, remaining the main growth driver. Over the past decade, mobile games revenue in the country has doubled.
Digital console game sales rose by 3.5% to £2.446 billion, while digital PC game sales dropped by 1.8% to £647 million.
Physical game sales fell sharply-down 34% to £322 million.
Consider subscribing to the GameDev Reports Premium tier to support the newsletter. Get access to the list of curated articles & archive of Gaming Reports that I’ve been collecting since 2020.
Hardware sales
Games hardware sales declined by 5.1% to £2.105 billion.
Console sales fell the most, down 24% year-on-year to £723 million.
PC hardware sales, on the other hand, grew by 6% to £715 million. This category includes both gaming PCs and monitors.
Console accessories sales also increased by 14% to £463 million.
The VR segment grew by 7% year-on-year to £204 million, with strong sales for both Meta Quest 3 and Quest 3S.
For the second year, UKIE included the “game culture” segment in its report, covering toys, merchandise, books, soundtracks, movies, TV series based on games, etc. This segment generated £385 million in 2024, representing a 13% decrease from the previous year.
InvestGame & GDEV: VC Investments in Gaming AI

InvestGame experts analyzed venture investments made between 2020 and 2024 in companies related to gaming AI. In total, 264 deals amounting to $1.8 billion were analyzed.

119 deals and $1.2 billion were directed toward AI tools for content creation. This includes startups that help create assets, game worlds, NPCs, and dialogues.
$0.4 billion was invested in infrastructure projects. 72 investments were made in AI toolkits that enable automated testing, increase development efficiency, and improve analysis or management of services.
Finally, 73 deals totaling $0.2 billion were for other AI tools. This category includes everything related to marketing, community management, monetization, and so on.

Consider subscribing to the GameDev Reports Premium tier to support the newsletter. Get access to the list of curated articles & archive of Gaming Reports that I’ve been collecting since 2020.
Stability.ai ($101M), Parametrix.ai ($100M), and Pika ($80M) are the leaders in terms of funds raised. Inworld is also among the leaders in total investment.

Andreessen Horowitz (20 deals totaling $233 million) and Bitkraft (12 deals totaling $177 million) are the most active VC funds for the period in question. However, Lightspeed invested the most - $350 million across 6 deals.

The total number of deals in the gaming segment has been growing since 2020. However, I wouldn’t call this growth explosive.
In terms of total deal volume, 2024 was a record year ($602 million). Investments in AI tools for content production show steady growth.
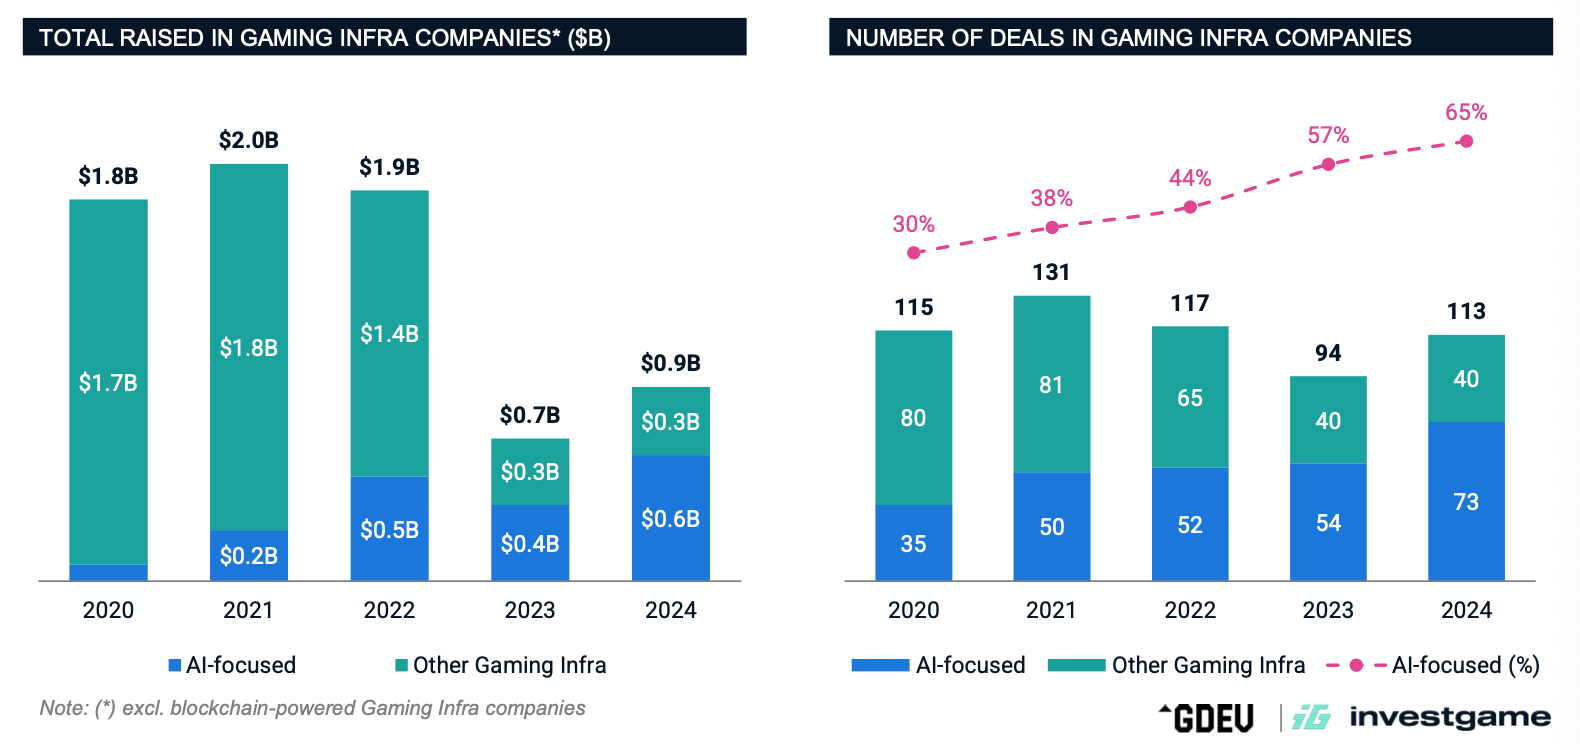
In 2024, 65% of all investments in infrastructure technologies for games were related to AI. This share has been increasing since 2020.
At the same time, investment volume in infrastructure projects decreased in 2023–2024.
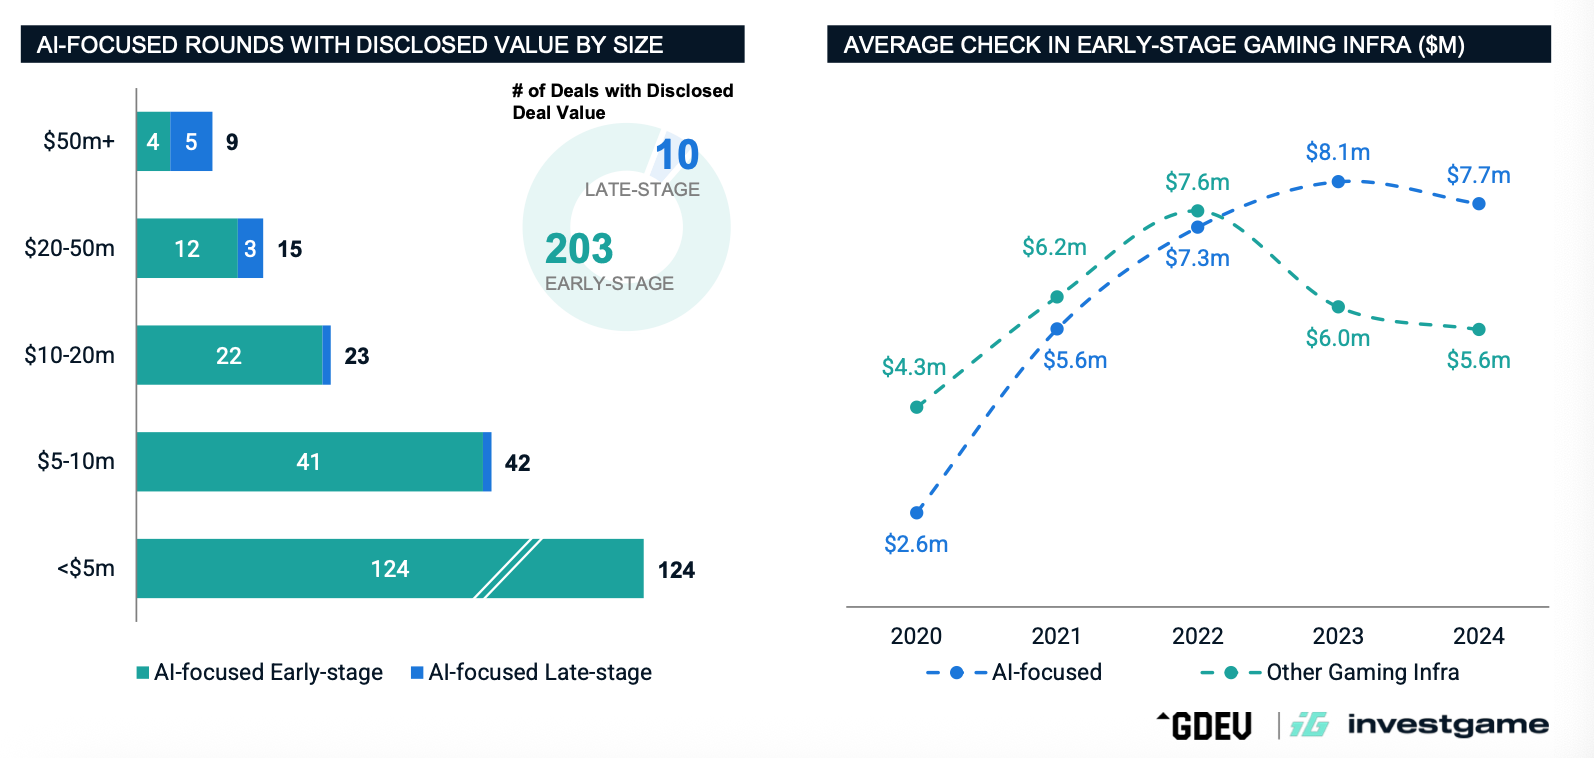
The overwhelming majority of AI startups raised less than $5 million.
Of all the deals considered, only 10 (4.69% of the total) were late-stage. This is normal, as AI technologies are still in the early stages of development.
Anzu: Intrinsic In-Game Advertising Trends in Gaming

The report uses data from 105 games and 333 direct advertisers who use Anzu.
❗️Anzu is a tool for placing in-game advertising. The report may be biased.
User Engagement in 2024

Games are a type of entertainment that lacks pronounced seasonality. This is a clear advantage over, for example, television, where viewership drops sharply in summer.

CPM in games peaks, on average, from September to December. This is the most competitive period. At the same time, the beginning of the year (the period of low CPM) is the best time for advertisers in fitness, travel, and healthy lifestyle sectors. People are ready to change their lives at the start of the year, and the market cools down after the holiday season.
Advertising Activity by Platform
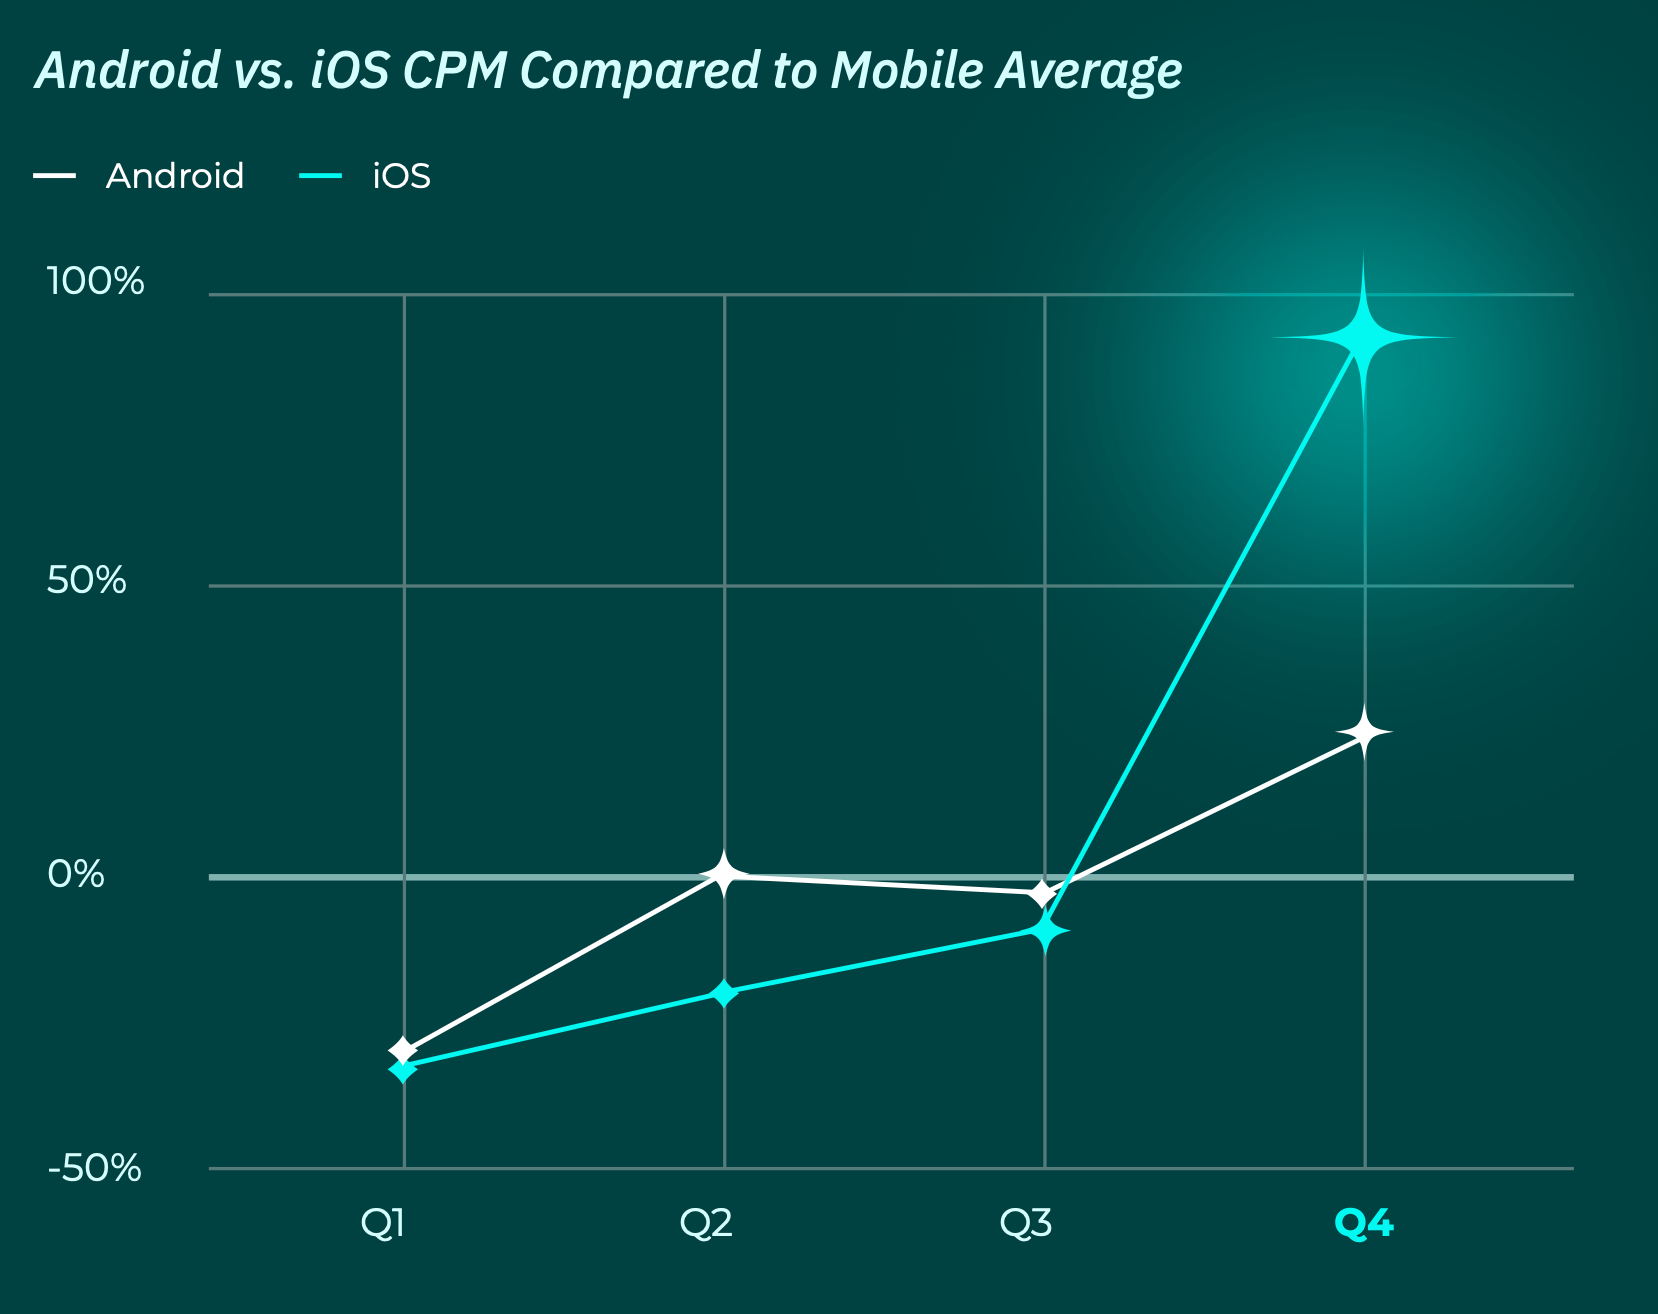
Advertisers are roughly evenly split between iOS and Android throughout the year. However, in Q4, advertiser activity on iOS is significantly higher. This is largely due to the APAC region having many Android devices, and big holidays in these countries are not happening in Q4.

People spend more time playing on PC and consoles than on mobile devices. On average, session length is 3 times longer (4.3 minutes vs. 15 minutes), quarterly playtime per game is almost 5 times higher (20.2 minutes vs. 107 minutes), and the number of sessions per game per quarter is 1.5 times higher (4.7 sessions vs. 7.1 sessions).
However, there is another side to this. On mobile devices, the audience is 25 times larger and also more diverse.
Regional benchmarks

North America leads all markets in average session length (4.99 minutes), number of sessions per game per quarter (6.45), and CPM. Europe is not far behind in user engagement but lags by 33% in CPM.

Anzu notes that Q1 can be a favorable time for advertisers in North America in games-user activity remains high while CPM drops significantly.

For European countries, Q1 and Q3 are the best quarters for advertising activity. Competition is lower, and user activity is either at its peak (as in Q1) or without a dramatic drop (as in Q3).

The same logic applies to Latin American countries. Q1 is a good quarter for marketing campaigns.
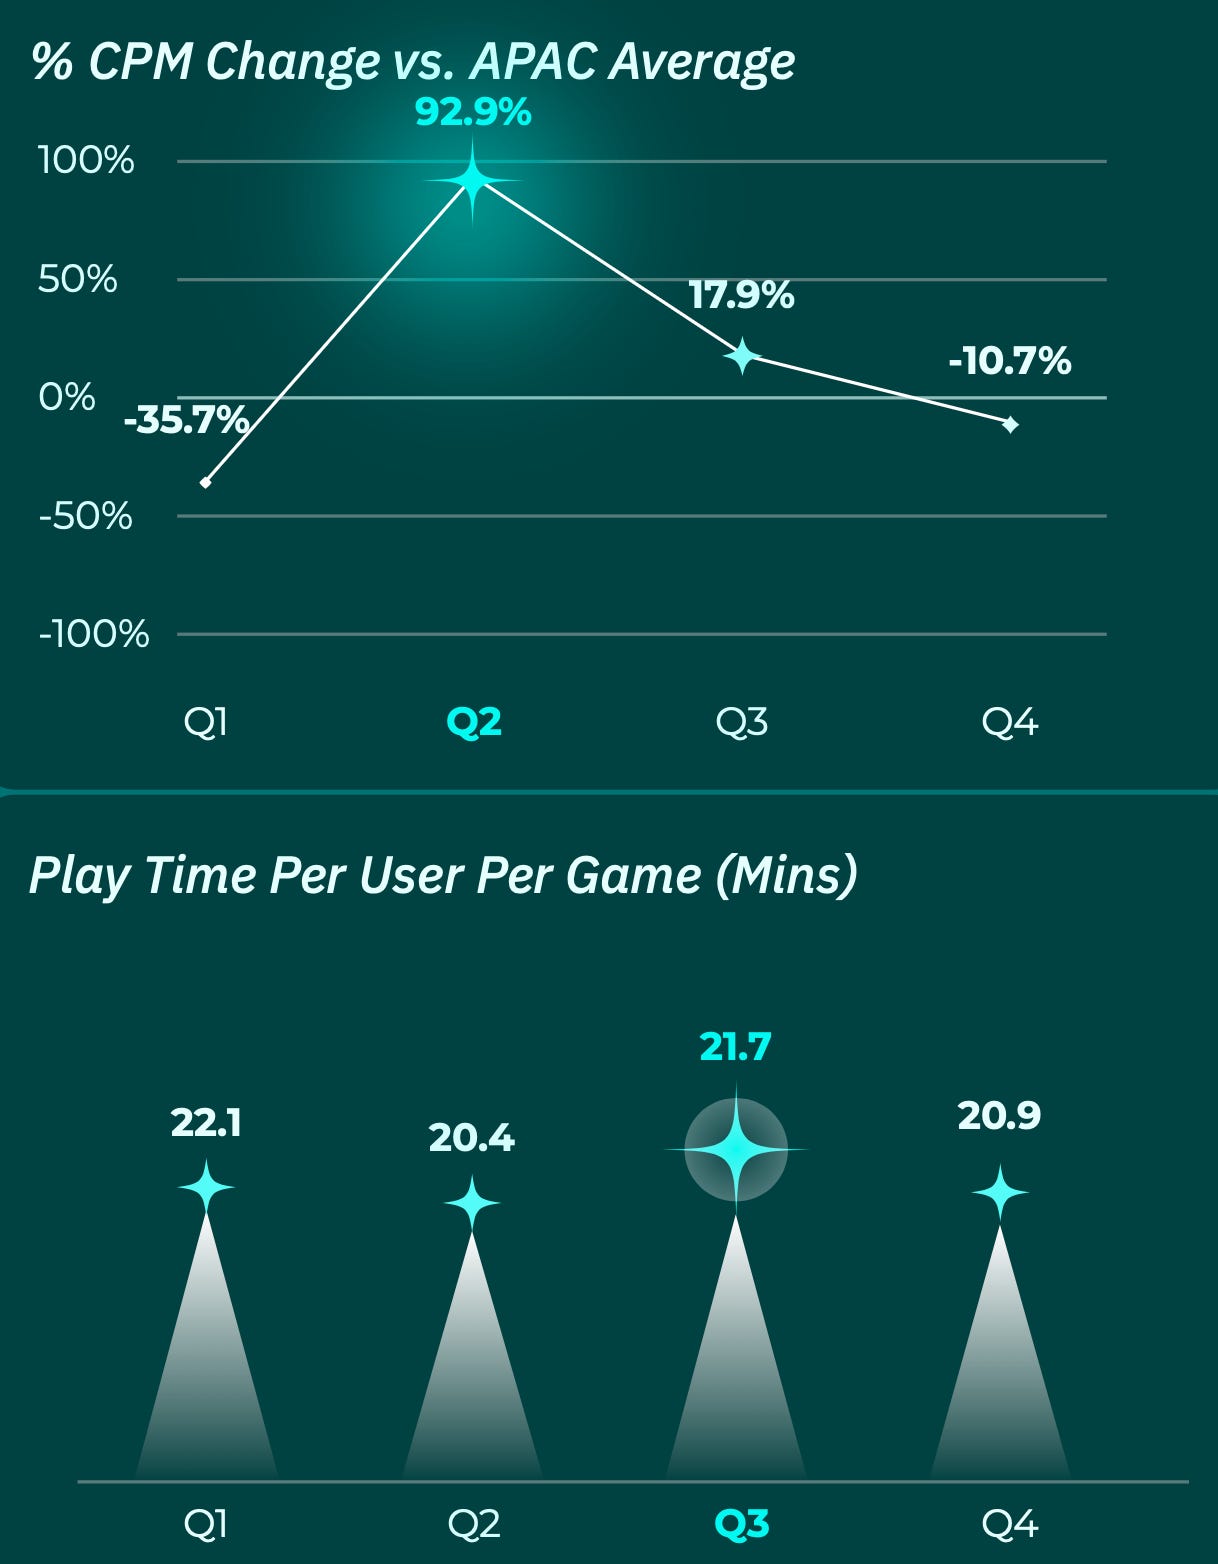
In Asian and Middle Eastern countries, the CPM peak falls on Q2. Usually, Ramadan and Golden Week occur in this quarter. Advertisers actively compete for user attention.
Consider subscribing to the GameDev Reports Premium tier to support the newsletter. Get access to the list of curated articles & archive of Gaming Reports that I’ve been collecting since 2020.
Genre Benchmarks

Sports games are among the most popular genres for native in-game advertising. The audience is engaged, and in-game ads look organic in such projects.

At the same time, in sports and racing games, static ads are more popular. The opposite is true for action games and arcades. Anzu believes that static ads are better suited for fast-paced genres, while video works well for slower genres.


In sports games, CPM rises in Q3 and peaks in Q4. This is due both to the release schedule (new installments of sports franchises usually come out in Q3) and increased advertising activity.


In racing games, the situation is different. The CPM peak is in Q2, and there is a sharp drop in Q4. This is related to the start of many competitions in Q2. It would make sense for advertisers to reallocate part of their budget from overheated Q4 genres to racing projects.

In action games, the situation matches the market as a whole. The peak of user activity and CPM is in Q4.
Intrinsic In-Game Advertising Effectiveness Metrics

Ad viewability rates on mobile devices and consoles exceed 98%. The situation is slightly worse on PC. It's hard to say why.

According to Anzu, native in-game advertising attracts the most attention-several times more than banners on social networks or mobile devices.

Intrinsic in-game advertising, according to Anzu, has a positive effect on brands. Viewers remember the brand, have a better attitude toward it, and are more likely to make a purchase.
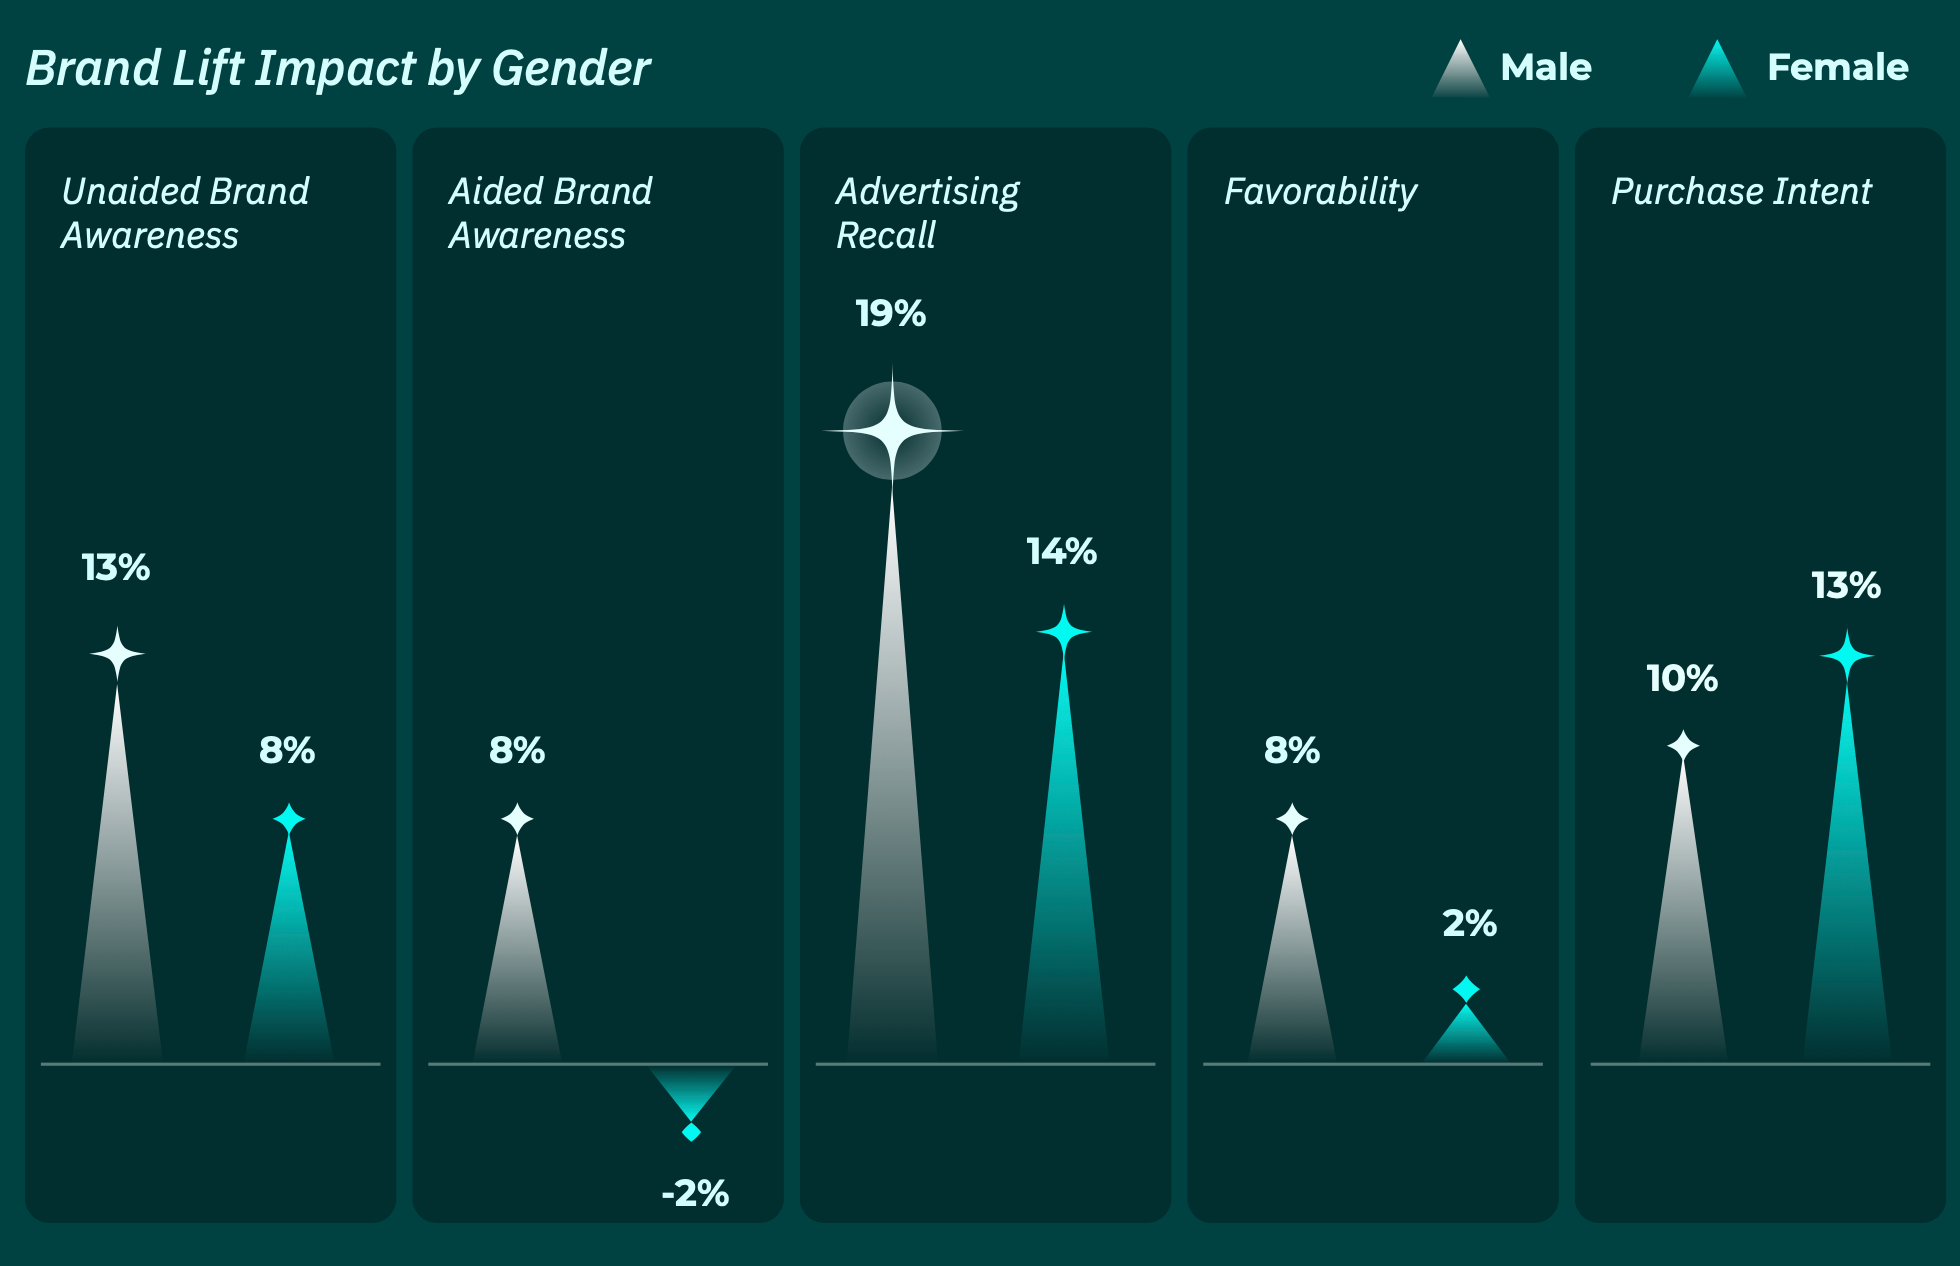
Anzu reports that the male audience remembers in-game ad campaigns and the brand better. However, women are more likely to convert to a purchase after such ad campaigns. Still, the sample is heavily skewed toward the male audience-Anzu is transparent about this.

Anzu notes that in-game advertising in games shows, on average, a CPA 21% lower than expected. The conversion from ad view to store visit is 6%.