

Weekly Gaming Reports Recap: May 20 - May 31 (2024)
Newzoo lowered its forecast for 2023; the US gaming market decreased in April after 3 consecutive months of growth in 2024; Sony shared a PlayStation business presentation.

Reports of the week:
Newzoo lowered its Forecast for the Gaming Market in 2023
Notes of the Nintendo FY'24 report
GameAnalytics: Benchmarks in Mobile Games for Q1’24
Famitsu: Nintendo Switch has become the best-selling console in Japan's history
StreamElements & Rainmaker.gg - State of the Streaming Market in April 2024
Games & Numbers (15.05.24 - 28.05.24)
Big Games Machine: How People Discover New Games in 2024
Metaplay: How much does it cost to develop custom Backend Services in Mobile Gaming Companies?
Circana: The US Gaming Market Decreased by 3% in April 2024
PlayStation 5 is the most profitable console for PlayStation & more from a new FY'23 PS business presentation
Newzoo lowered its Forecast for the Gaming Market in 2023

Revenue
The market volume forecast has been lowered from $187.7 billion (+2.6% YoY) to $183.9 billion (+0.5% YoY).
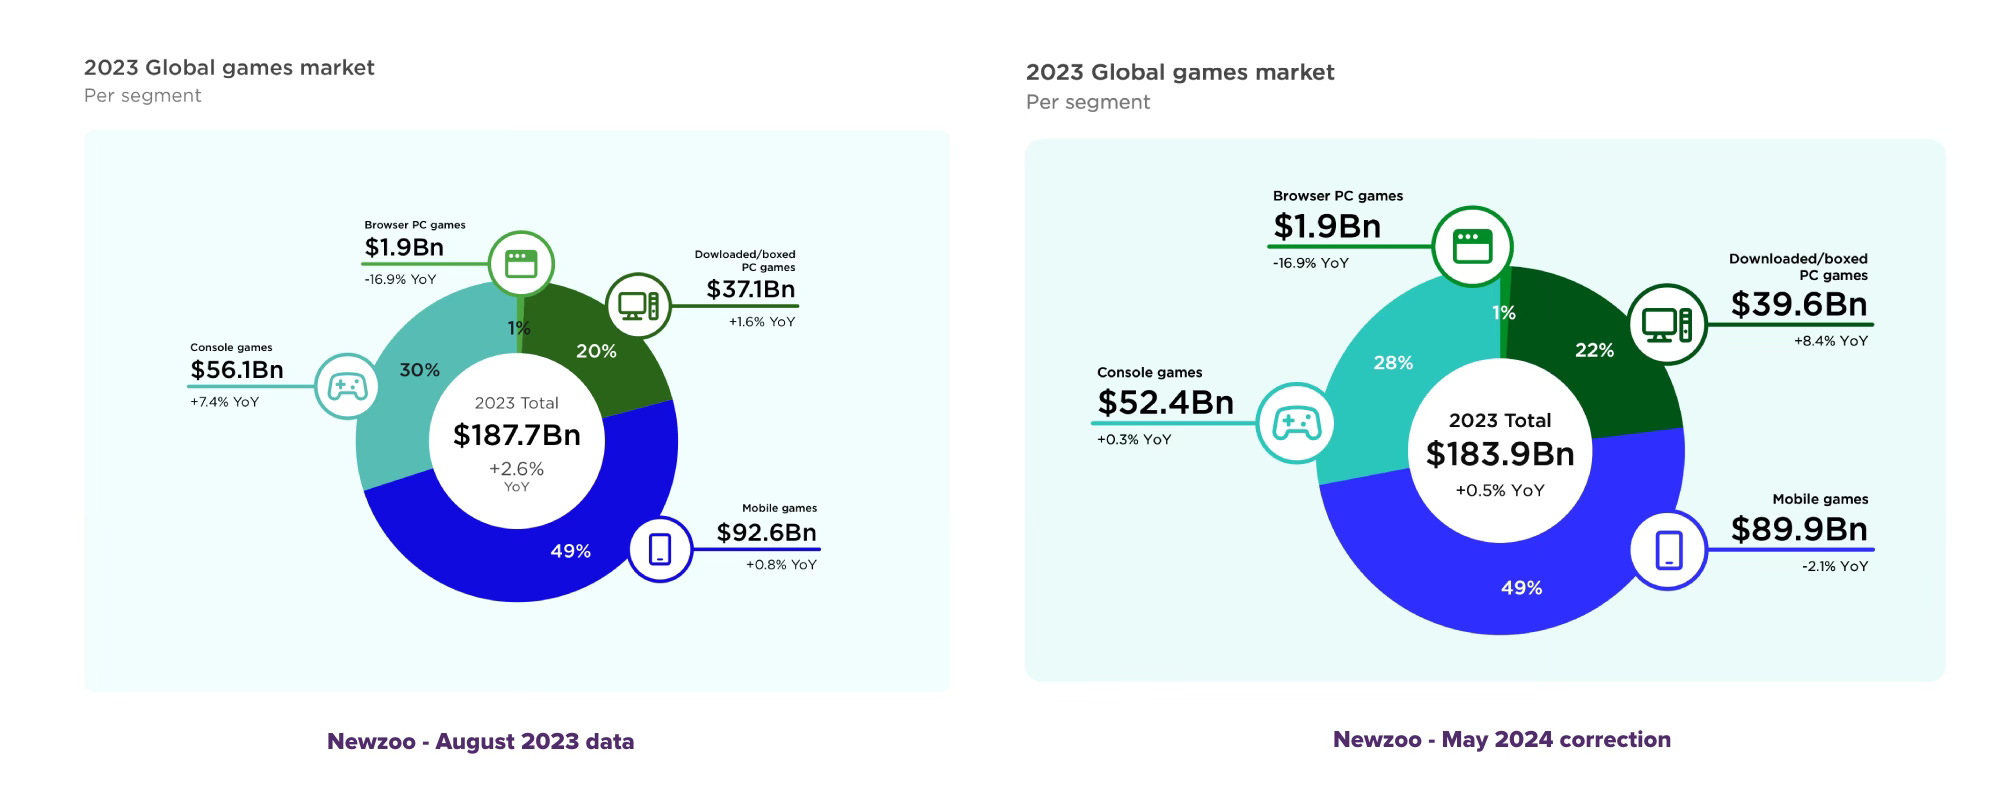
As a result of the reevaluation, the mobile market in 2023 declined by 2.1% instead of the previously reported growth of 0.5%. The console segment grew by only 0.3% YoY instead of the previously reported 7.4%. However, the PC segment in the new version increased by 8.4% YoY instead of the initial 1.6%.
The reevaluation affected regional statistics. The Asia-Pacific region, as a result, declined by 0.2% instead of growing by 1.2%. North America grew by only 0.3% instead of 3.8%. The growth in the MENA region (Middle East and North Africa) of 6.9% turned into 4.6%. Europe grew by 1.3% YoY instead of 3.2%. Latin America increased by 2.2% instead of 3.8%.

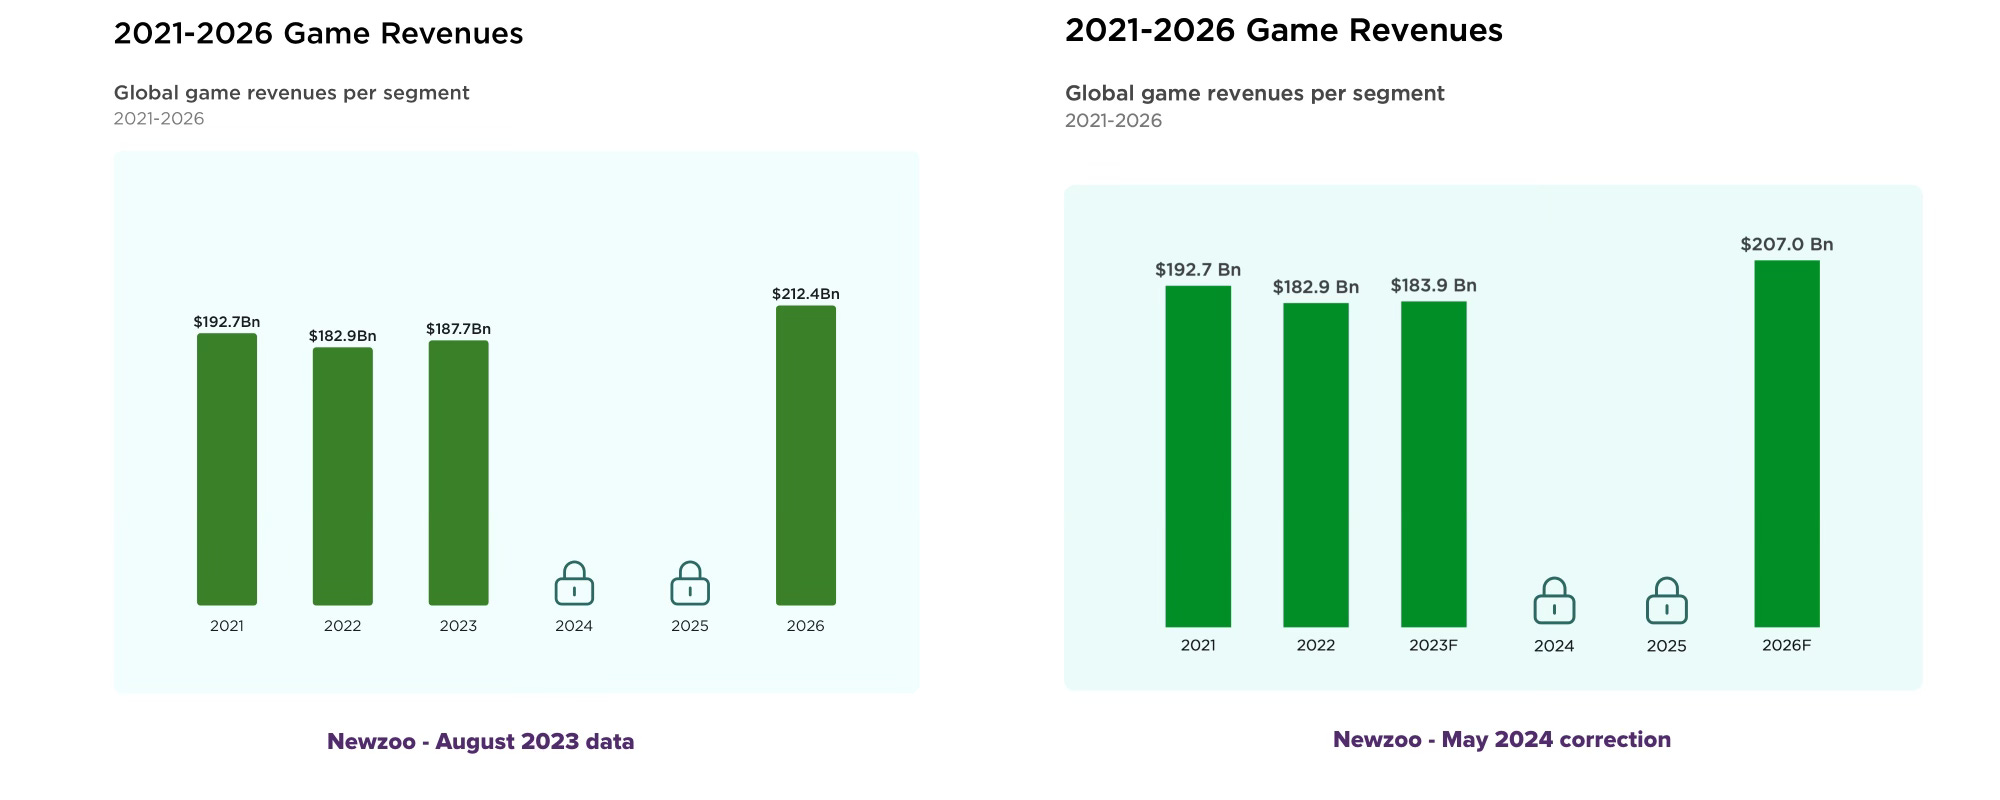
Newzoo lowered its revenue forecast for 2026. Previously expected $212.4 billion turned into $207 billion.
Users
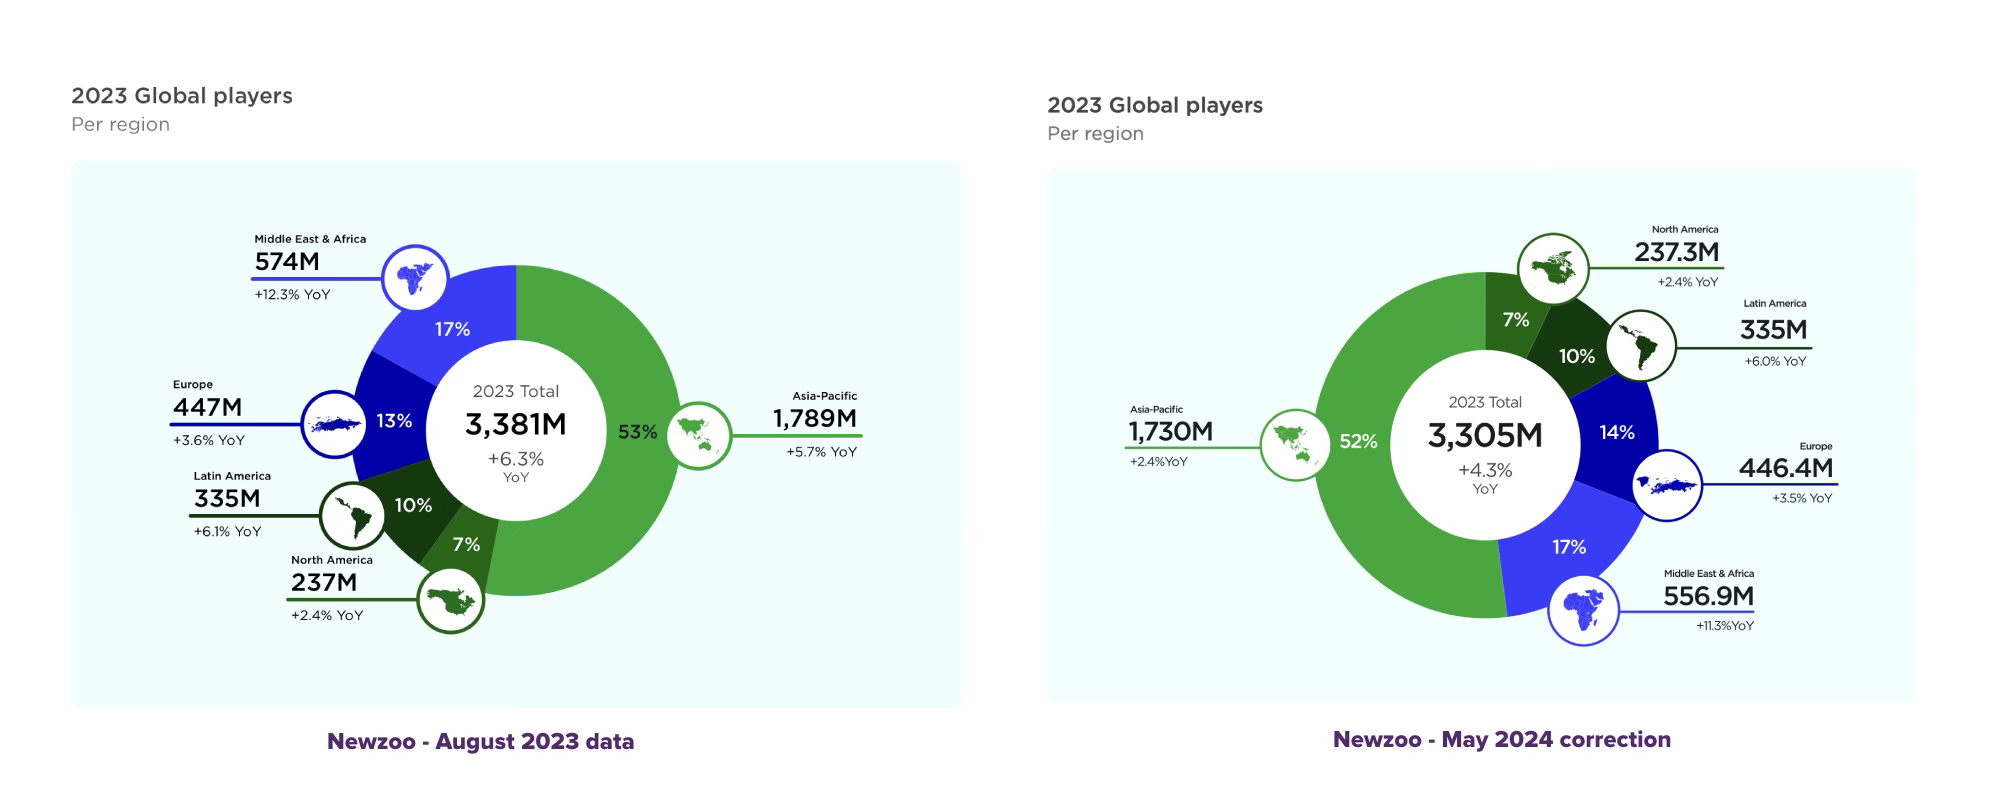
The company lowered its forecasts for the number of players worldwide in 2023 (from 3.38 billion to 3.3 billion). Moreover, the growth forecast has been reduced, with Newzoo now expecting 3.68 billion players in 2026 instead of 3.79 billion.
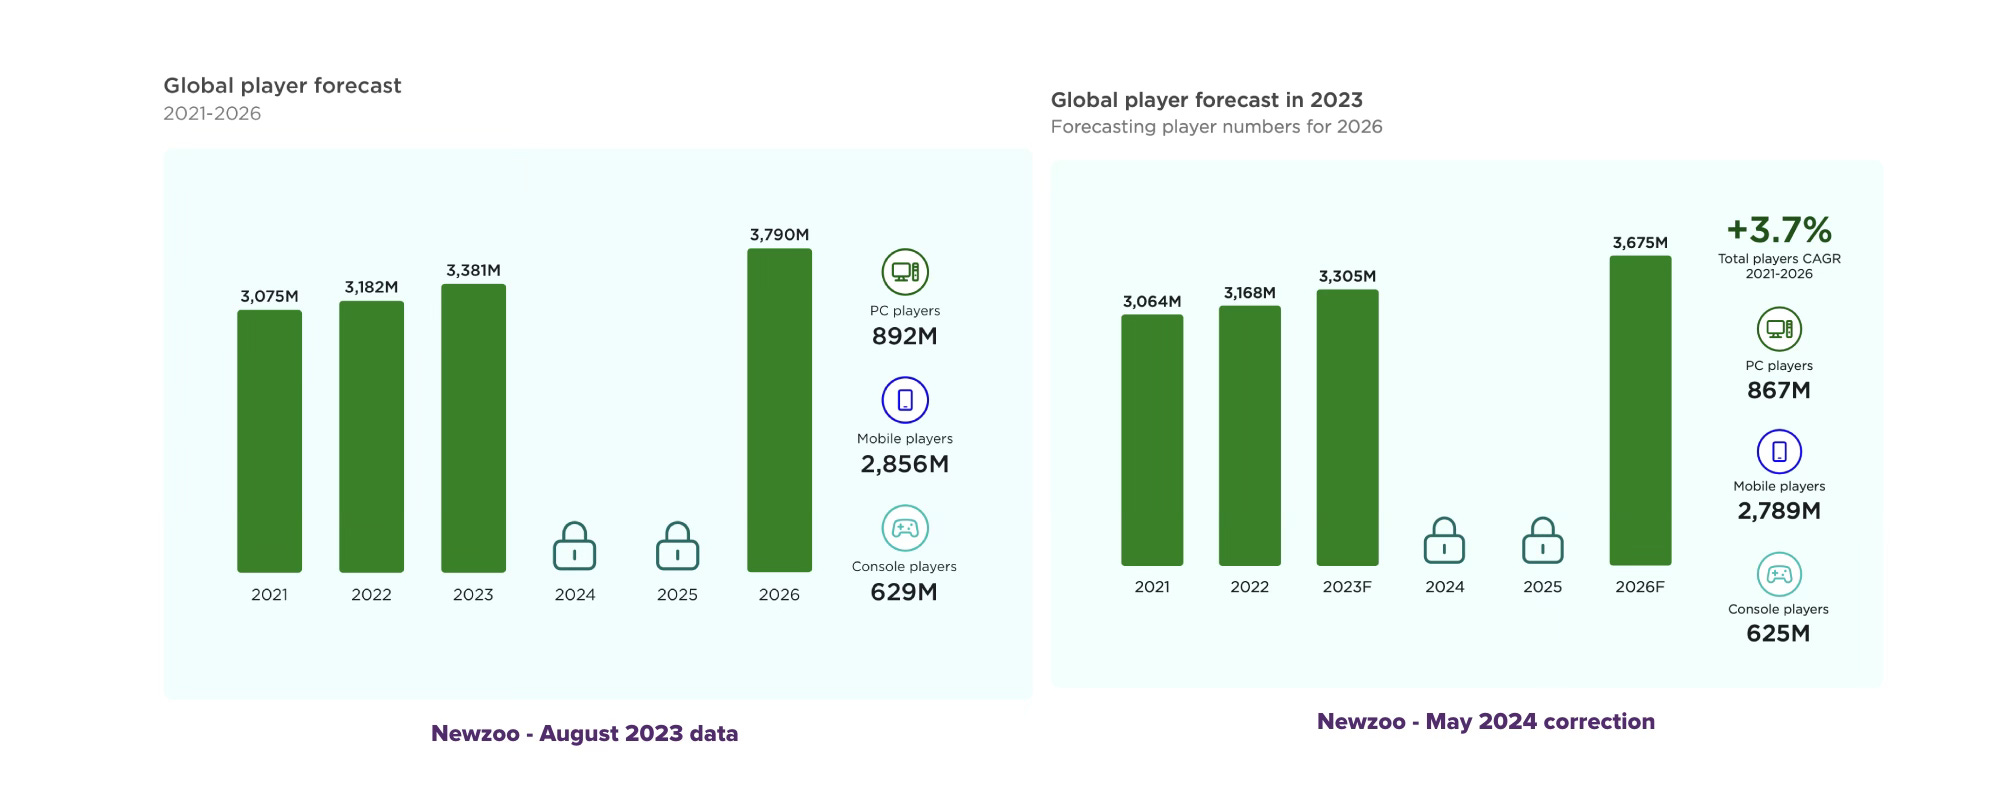
The reevaluation significantly affected the Asia-Pacific region. Its YoY growth fell from the initial estimate of 5.7% YoY to 2.4% YoY.
Notes of the Nintendo FY'24 report

I’ll leave aside the company's financial performance and focus only on the platform/game results.
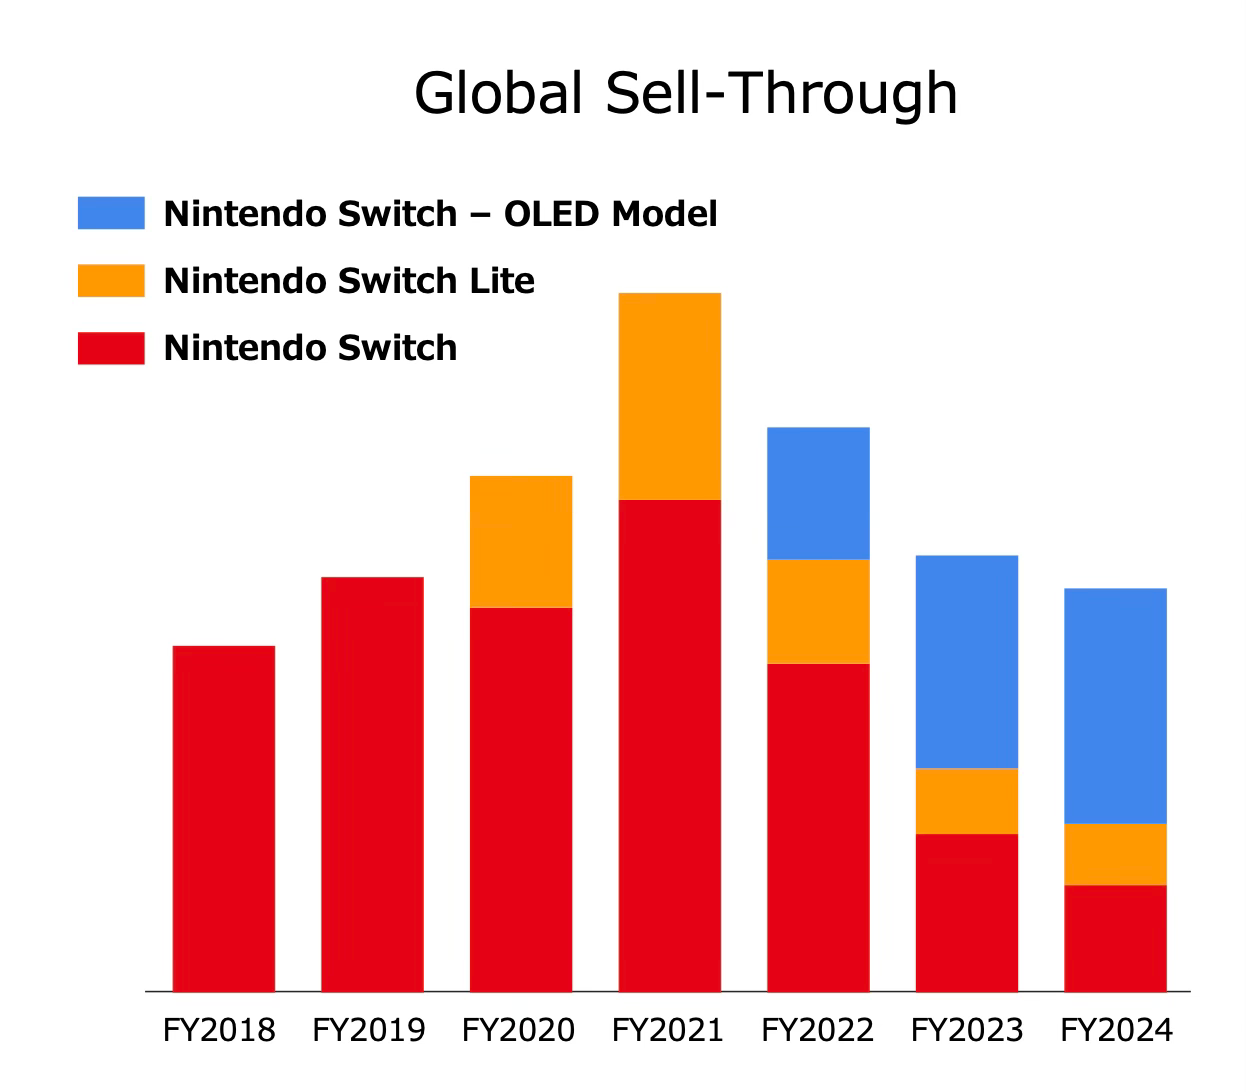
Nintendo Switch
In the fiscal year 2024 (from April 2023 to March 2024), the company sold 15.7 million Nintendo Switch units. The trend is declining for 4th year straight, which is normal for the end of the lifecycle.
The company reported a total of 141.32 million Nintendo Switch units sold.
❗️ Currently, the Nintendo Switch is the second best-selling console in history. The PlayStation 2 is in first place with 155.1 million units sold.
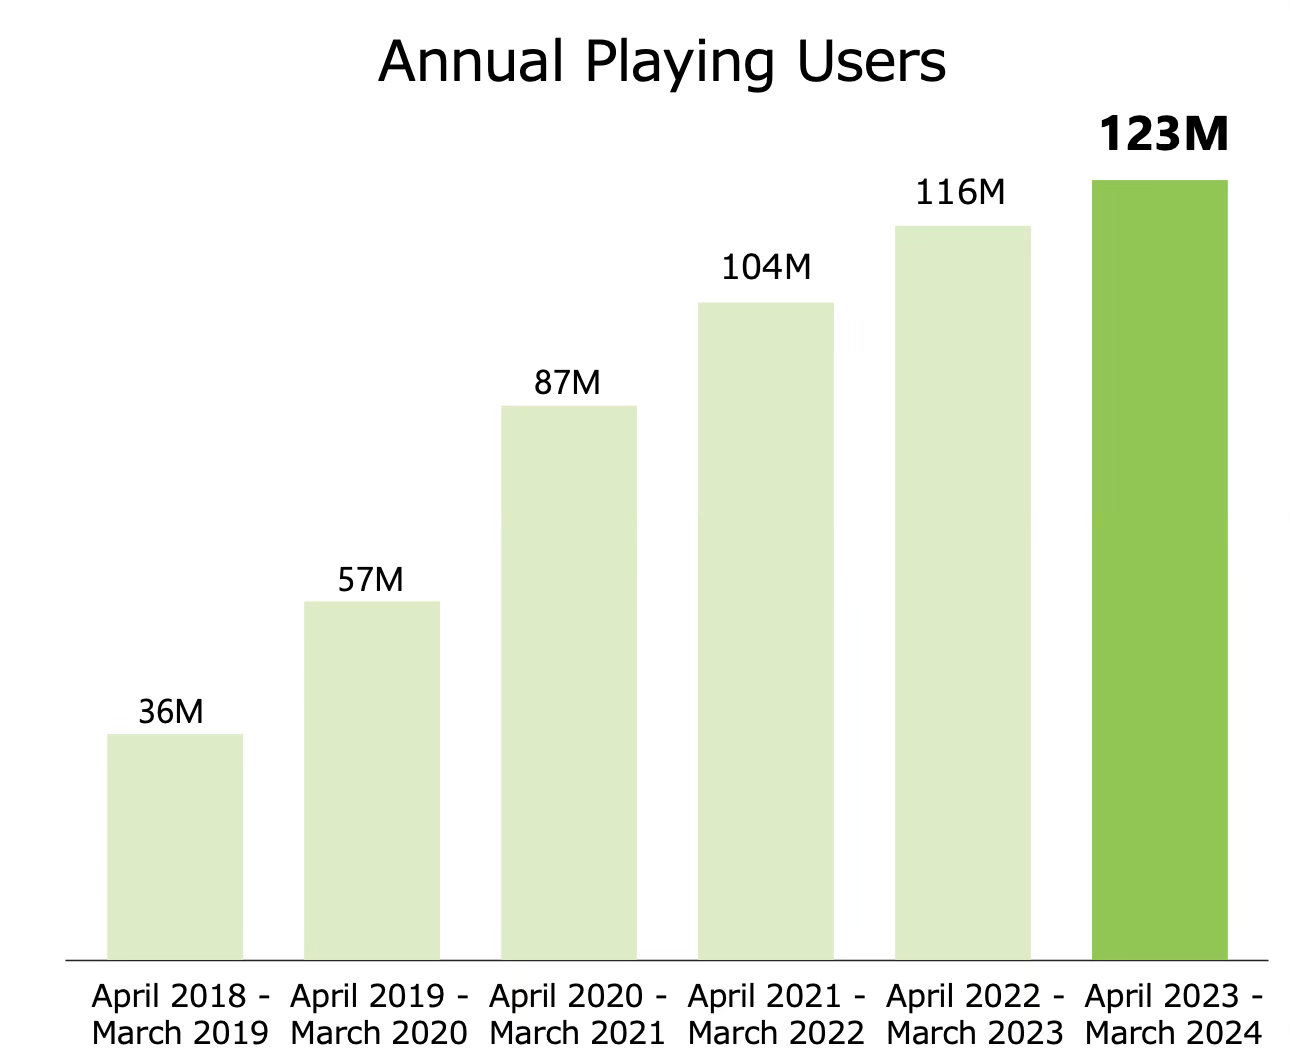
The number of active users has been steadily increasing since 2018. In the fiscal year 2024, the number of users reached 123 million.
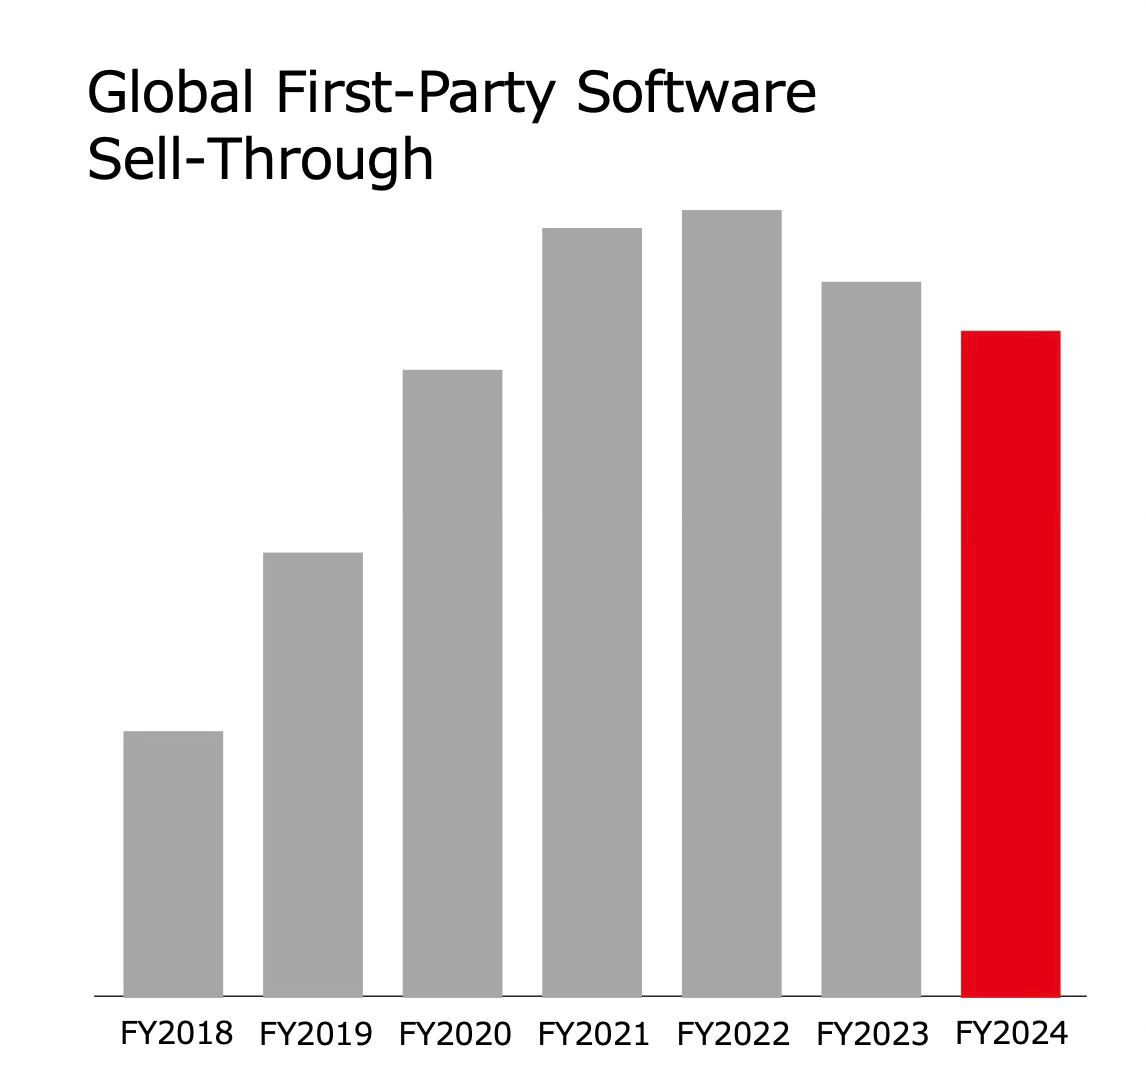
Game Sales
Global sales of Nintendo's first-party lineup have been declining for the second consecutive year, despite the successes of The Legend of Zelda: Tears of the Kingdom (20.6 million), Super Mario Bros. Wonder (13.4 million copies), and others.
In 2024, 31 games on Nintendo Switch surpassed the 1 million copies mark. 20 of them were Nintendo's own games, while 11 were from other publishers.
GameDev Reports Newsletter offers promotion opportunities to gaming companies. Reach out to learn more.
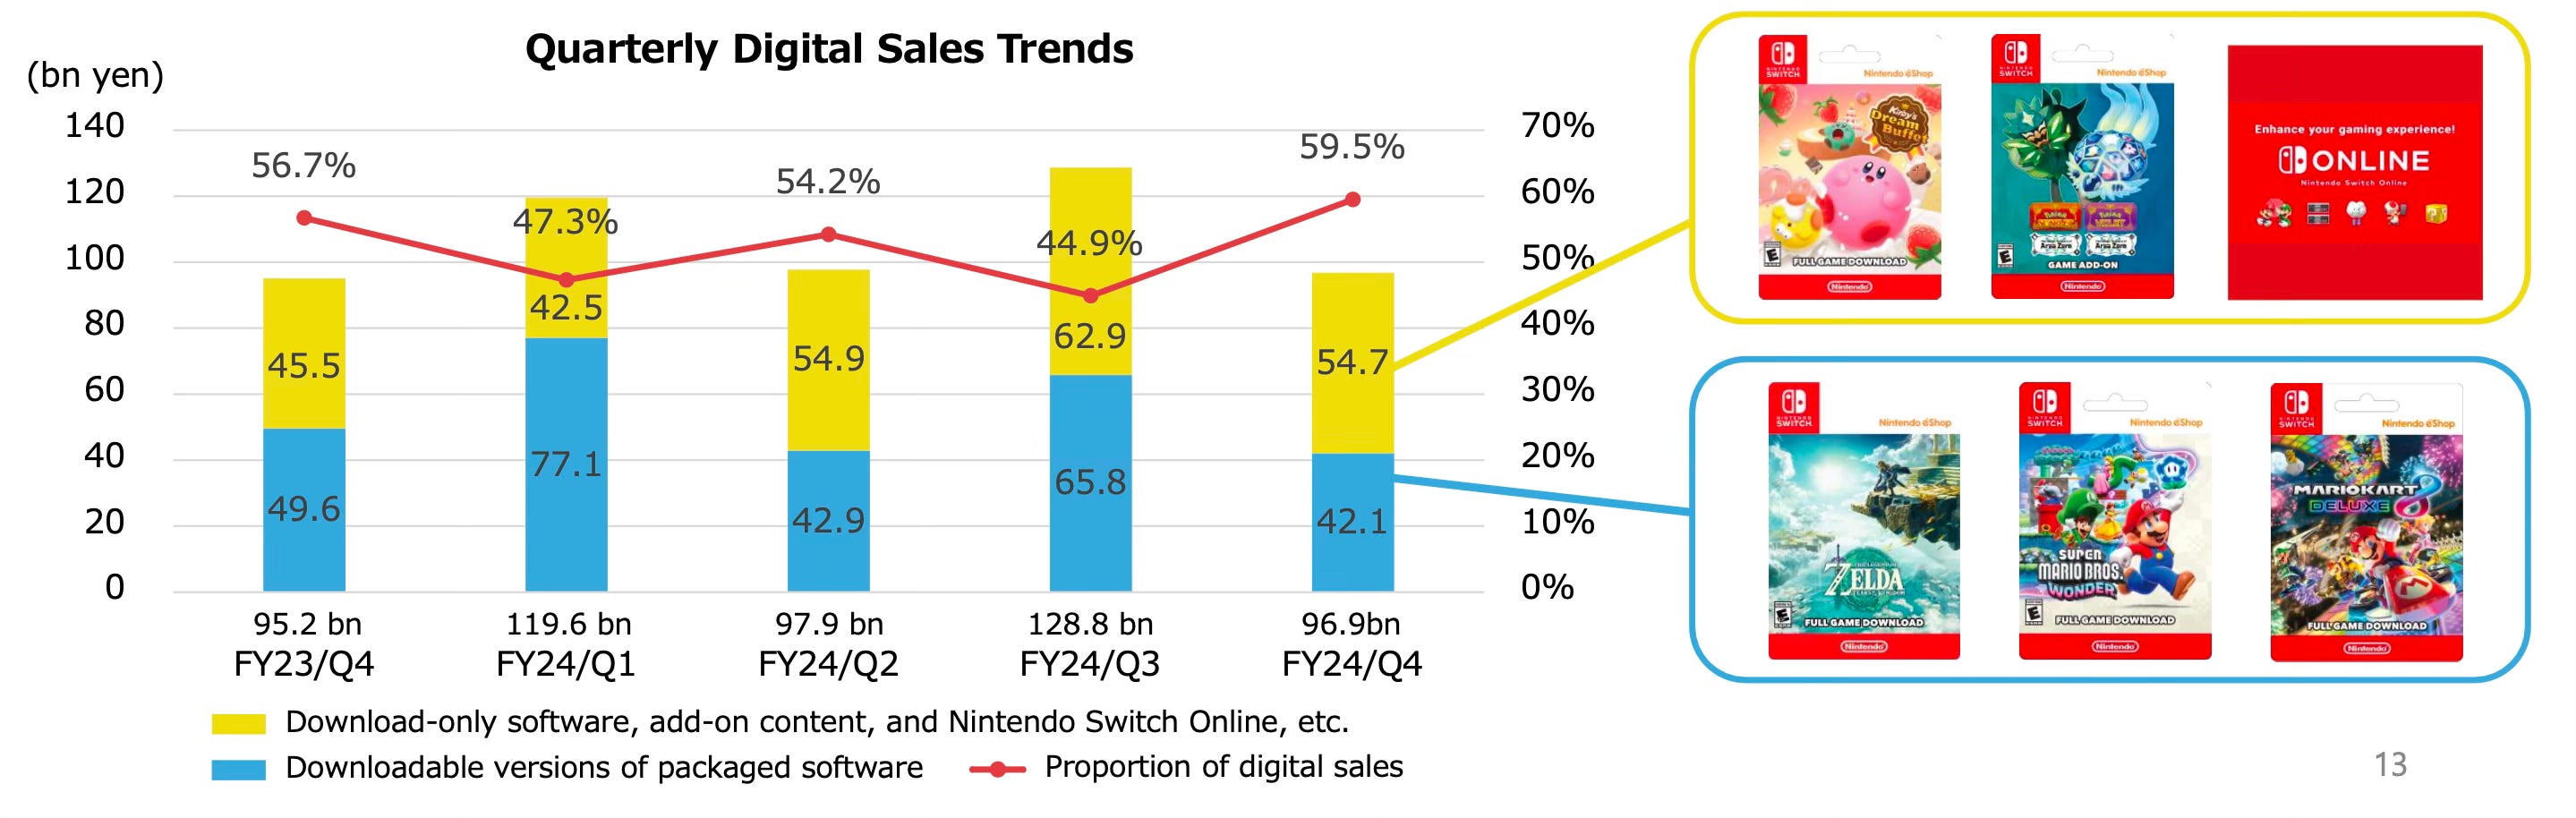
The share of digital sales on Nintendo Switch in the fiscal year 2024 was 50.2%. Last year it was 48.2%.
GameAnalytics: Benchmarks in Mobile Games for Q1’24

GameAnalytics studied over 10,000 projects using their analytics. Each game was launched in at least 3 regions. The projects had 2.7 billion MAU. All figures were collected in the first quarter of 2024.
Retention Benchmark - Top 25% of Projects
The median D1 Retention across all markets and projects (not just the top 25%) is 22.91%; D7 Retention is 4.2%; and D28 Retention is 0.85%. Below, top-25% of projects in the market are covered.
North America leads in engagement rates on days 1, 7, and 28.

Europe leads in short-term retention for casual projects.

In the Middle East, users favor classic (as defined by GameAnalytics) games such as board, card, and word games. They lead in Retention rates on days 1, 7, and 28. However, casual and mid-core projects show lower figures than in North America and Europe.

Classic games, when considering all regions, do not have the best D1 Retention; but they excel over other categories in D7 and D28 Retention.
In Asia, Retention rates are generally lower than in other regions across all genres and days. This is likely due to high competition.

Puzzle games show the highest D7 Retention among all other genres.
Session Time Benchmarks
Here, all projects in the market are considered. The top 25% of projects, the median, and the bottom 25% are taken into account.

The median session time across all regions is 4 minutes 45 seconds.
In North America, the highest session times are for casino and multiplayer projects.

Game sessions in Europe are above the average for other regions.

The leader in session time, considering the top 25% of projects, is card games. However, the median session time is still higher for casino games.
Most players in the Middle East play games for no more than 5 minutes per session. Leading genres are casino and mobile adaptations of board games.

Asian players also enjoy casino games as much as in other regions. However, most genres do not show more than 5 minutes per session when considering median values.

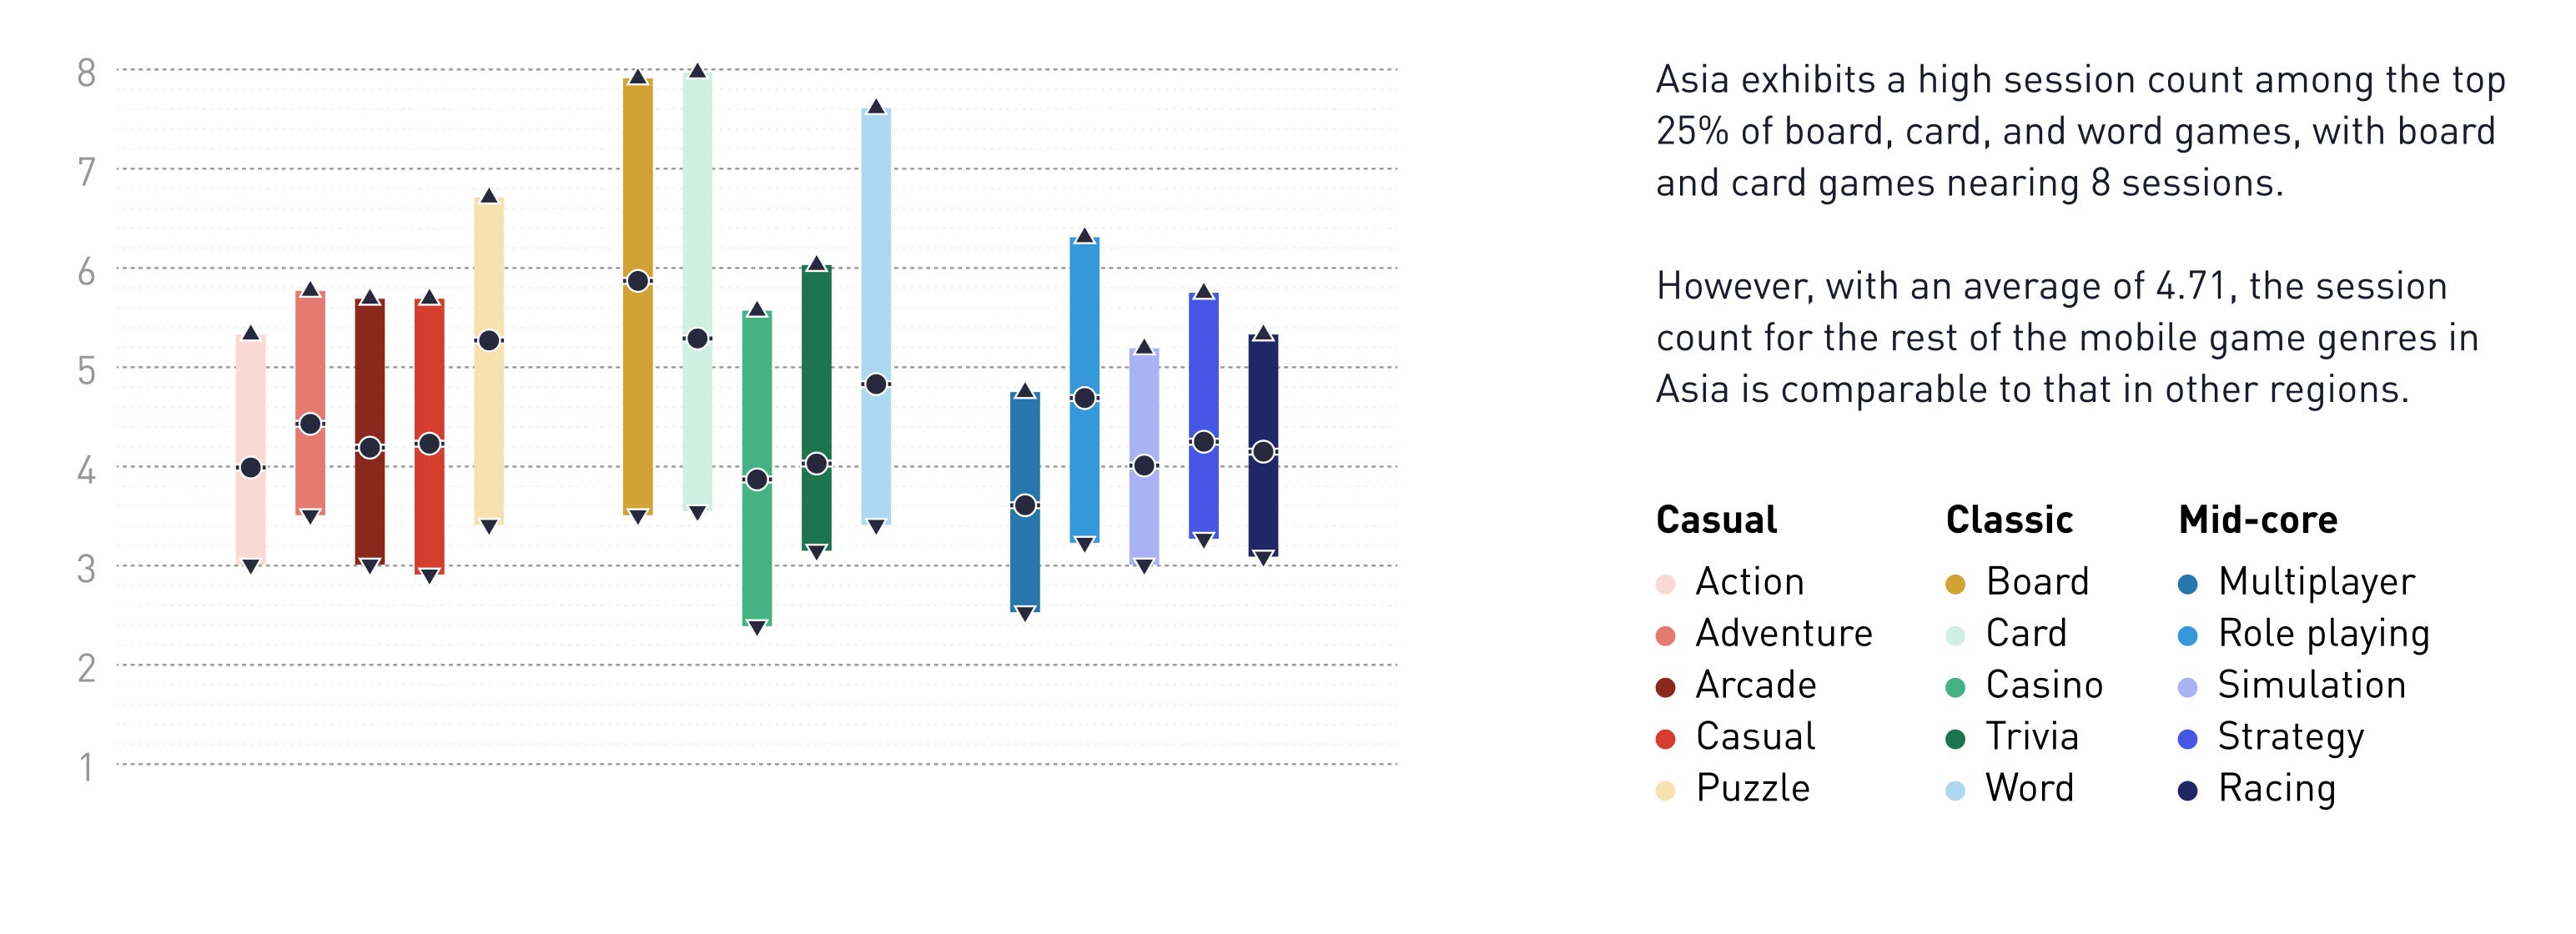
Session Count Benchmarks
The methodology is similar to the above - the top 25% and bottom 25% of projects, as well as the median value, are considered.
On average, users across all regions have 4-5 sessions per day.
In all regions, classic games (board, card, casino, etc.) have more sessions than other genres.
In North America, players typically have 3-5 sessions per day. The highest median values are for board and card games.

In Europe, word games have the highest number of sessions, reaching up to 7 per day.

The number of sessions in games in the Middle East is higher than in other regions. Leading genres are puzzles and word games.

In Asia, there are no significant statistical anomalies. The number of sessions in games is on par with other markets.
Famitsu: Nintendo Switch has become the best-selling console in Japan's history

According to the publication's estimates, sales of the Nintendo Switch in the country have surpassed 32.9 million units.
The previous record was held by the Nintendo DS with 32.86 million systems.
Nintendo Switch is selling faster. It took 377 weeks to set the record, whereas sales of the Nintendo DS were recorded over 425 weeks.
StreamElements & Rainmaker.gg - State of the Streaming Market in April 2024

StreamElements tracks only Twitch data.
The number of hours watched on Twitch in April dropped by 8% compared to the previous month. When compared to April 2023, the decline was less than 2%.
Additionally, when comparing daily viewership, there was a decrease of about 5% from March 2024.
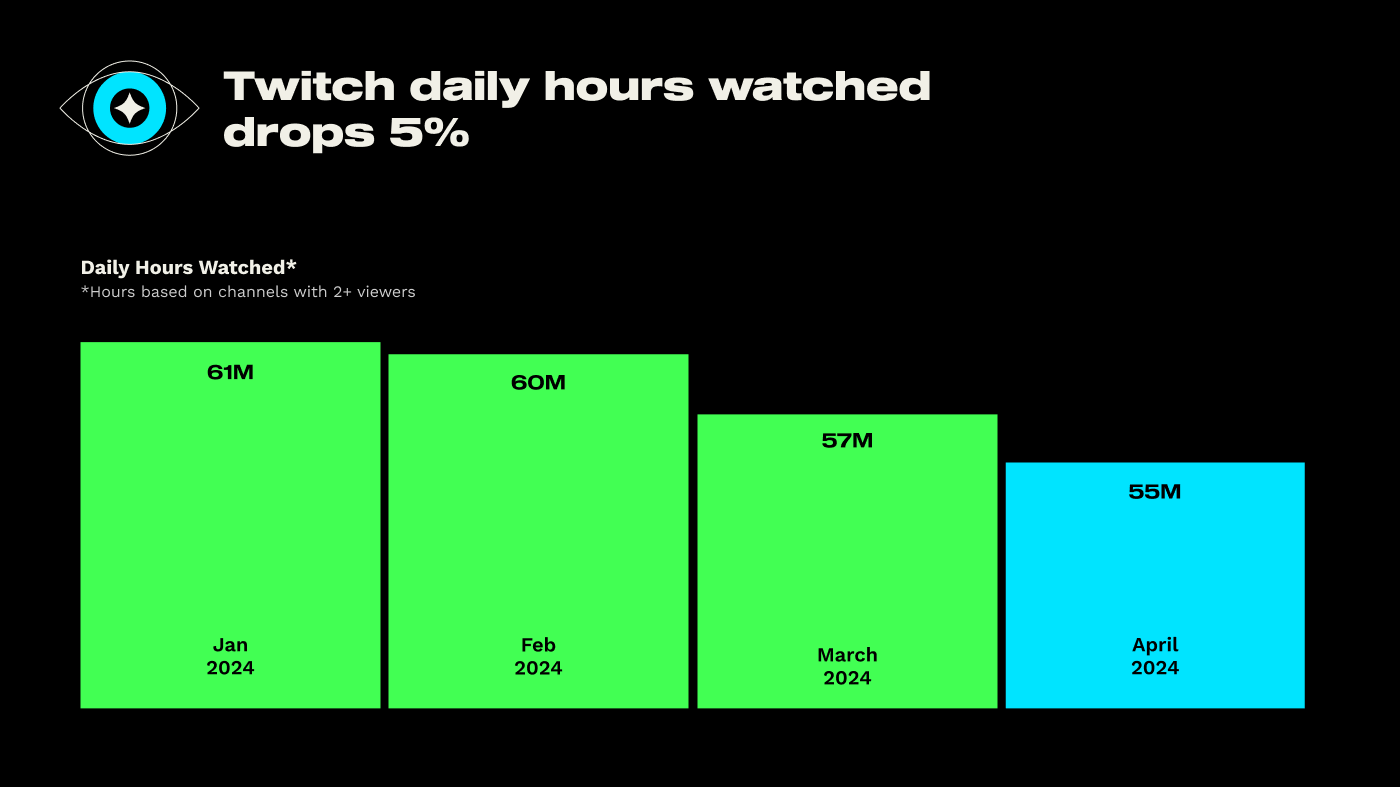
❗️The decline is attributed to the absence of major events in the esports scene and major releases.
Rust climbed to 8th place in viewership on Twitch in April 2024. The number of hours watched in April increased by 227% due to a new update.
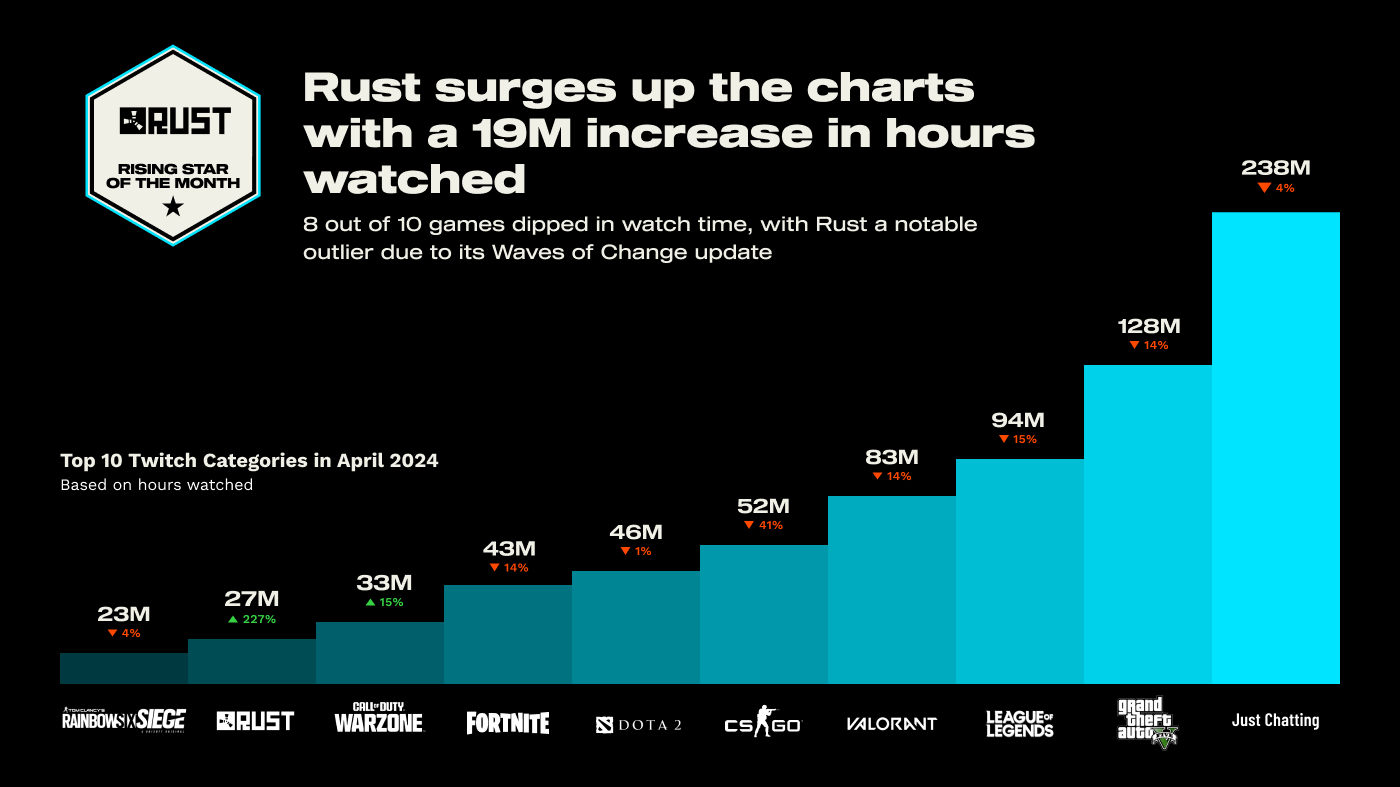
The leaders in viewership remain the same - Grand Theft Auto V (128 million hours); League of Legends (94 million hours); and Valorant (83 million hours).
Games & Numbers (15.05.24 - 28.05.24)

PC/Console Games
Manor Lords reached two million copies sold in less than 3 weeks. The publisher revealed that the conversion from wishlists to sales was 26%. The project had over 3.2 million wishlists at launch - a Steam record. The first million copies on Steam were sold in the first 24 hours.
Abiotic Factor, a cooperative survival game, sold 300 thousand copies in less than a month. The game was released on Steam on May 2.
Another Crab’s Treasure sold over 250 thousand copies in less than a month. 60% of sales were on Steam; 20% on PlayStation 5; 20% on Nintendo Switch.
Consider subscribing to the GameDev Reports Premium tier to support the newsletter. Get access to the list of curated articles & archive of Gaming Reports that I’ve been collecting since 2020.
Bellwright sold 200 thousand copies in its first month of early access. This is an RPG with survival elements set in a medieval setting.
Little Kitty Big City was downloaded over 1 million times through the Xbox Game Pass subscription. Sales in the first couple of days exceeded 100 thousand copies.
Gaming insider Tom Henderson reported on the success of XDefiant. The first million users came to the game 2.5 hours after launch; in two days, the audience reached 3 million users. On release day, the project's CCU (concurrent users) reached 500 thousand people.
Mobile Games
Rush Royale has earned more than $300 million since its release. The game has been downloaded over 83 million times.
Revenue for Legend of Mushroom reached $270 million by the end of April 2024. The majority of cash comes from South Korea (39.4%) and Japan (30%). In these countries, the male audience for the project exceeds 80%.
")
Squad Busters reached 5 million downloads faster than any other Supercell game. It took the game only 18 days. The previous record was held by Clash Royale - 59 days. Meanwhile, the global release of the game will take place tomorrow, May 29.

According to AppMagic, users have spent over 3 billion dollars on Dream Games. Royal Match generated 99% of the revenue; the remaining percent came from Royal Kingdom (the studio's new project in soft launch).

Big Games Machine: How People Discover New Games in 2024

A survey was conducted with 1009 players from the USA. The number of men and women was equal. The age distribution (from 18 to 44 years old) was also almost equal.

64% of players learn about new games from YouTube. This is the most popular channel.

TikTok (38%) is in second place. It is followed by Instagram (36%), Facebook (35%), recommendations from friends and acquaintances (34%), and advertisements (32%).
On average, users check 4 to 5 sources when they want to make a purchase decision.
Moreover, the younger generation uses TikTok (58% of 18-24-year-olds versus 29% of 34-44-year-olds) and Instagram (49% of 18-24-year-olds versus 29% of 34-44-year-olds) more often for game news.
Male gamers more frequently use Twitch and YouTube for game information. Females prefer TikTok more.
YouTube is the most trusted by players - 52% of respondents indicated this. TV advertisements are the least trusted - 13%. Opinions are polarized - for example, some people trust TikTok, while others do not.
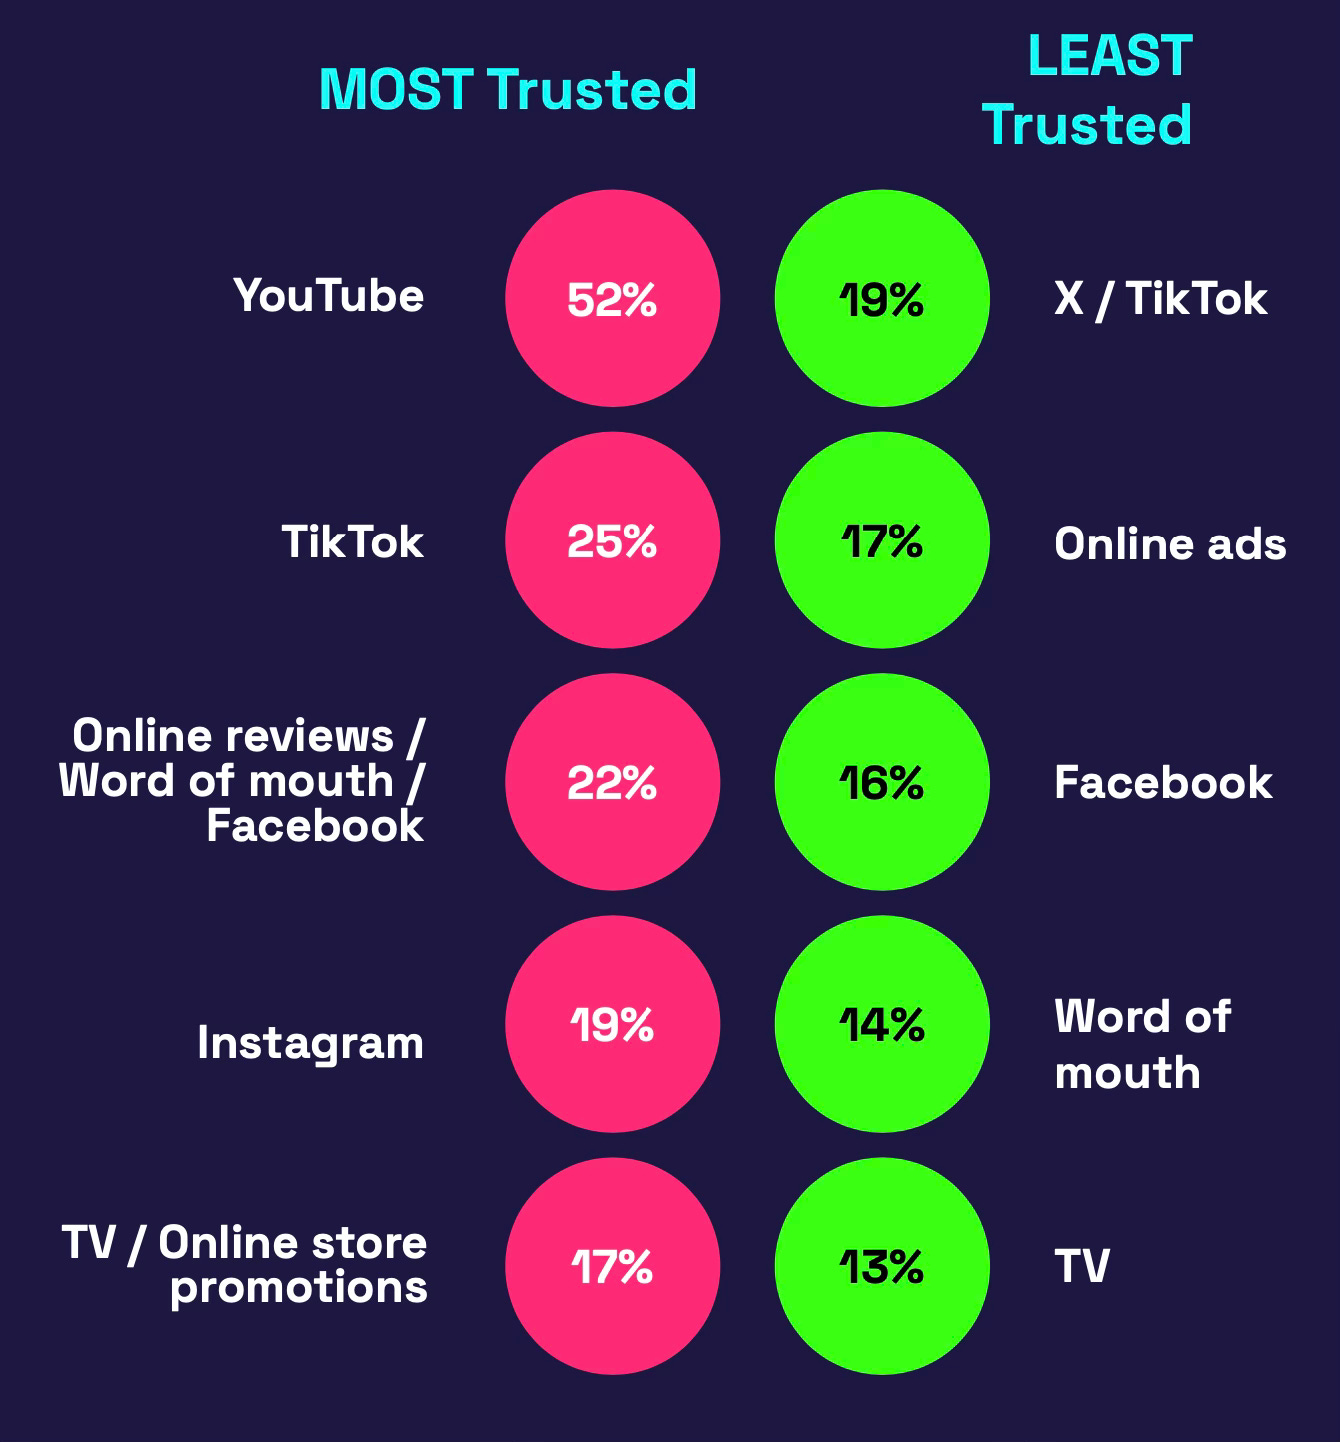
People are inclined to try a new game if it is a new installment of their favorite franchise (40%); the game is included in a subscription (30%); it has good reviews from players (28%); it is released by a developer they like (25%). Overall, people prefer familiar franchises and developers.

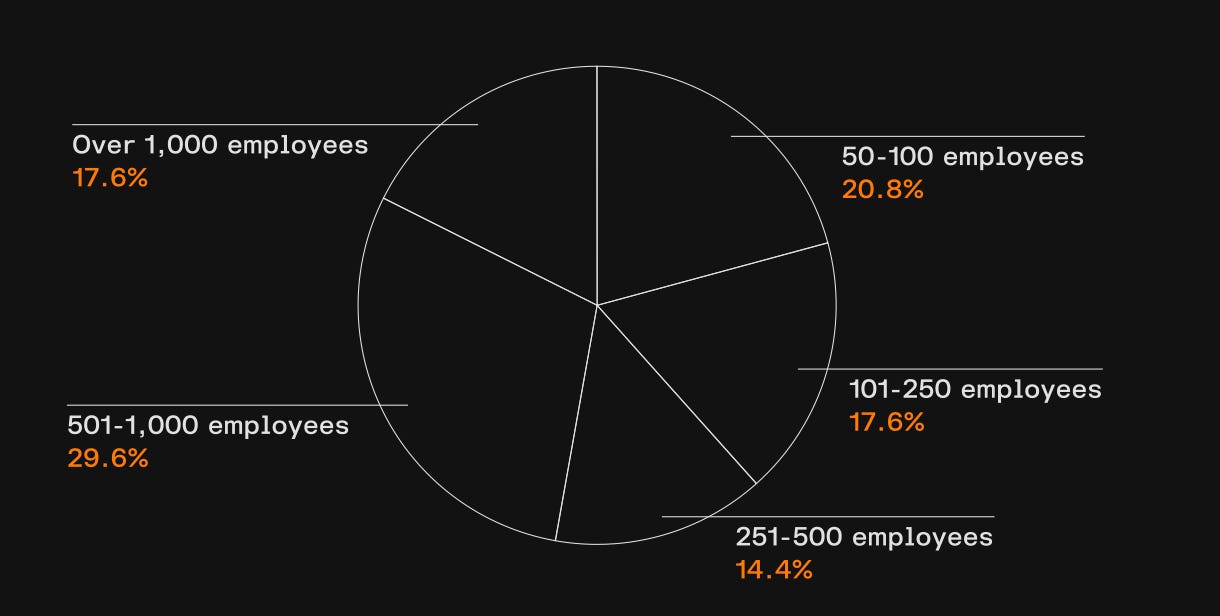
Metaplay: How much does it cost to develop custom Backend Services in Mobile Gaming Companies?

The company surveyed 125 people from companies with more than 50 employees in the US. All respondents were C-level executives or technical team leaders.

The average cost of building a custom backend is $21.66 million.
On average, 52 developers participate in the development of such solutions, with an average salary of $138,864 per year. The process takes 36 months.
❗️The decision to create custom technological solutions is predominantly made by large teams. In the survey, 61.6% of the companies had more than 250 employees.
Metaplay notes that every third studio reported negative effects from reallocating personnel to develop custom backend solutions. This slowed down product development, provoked employee turnover, and increased the amount of crunch.
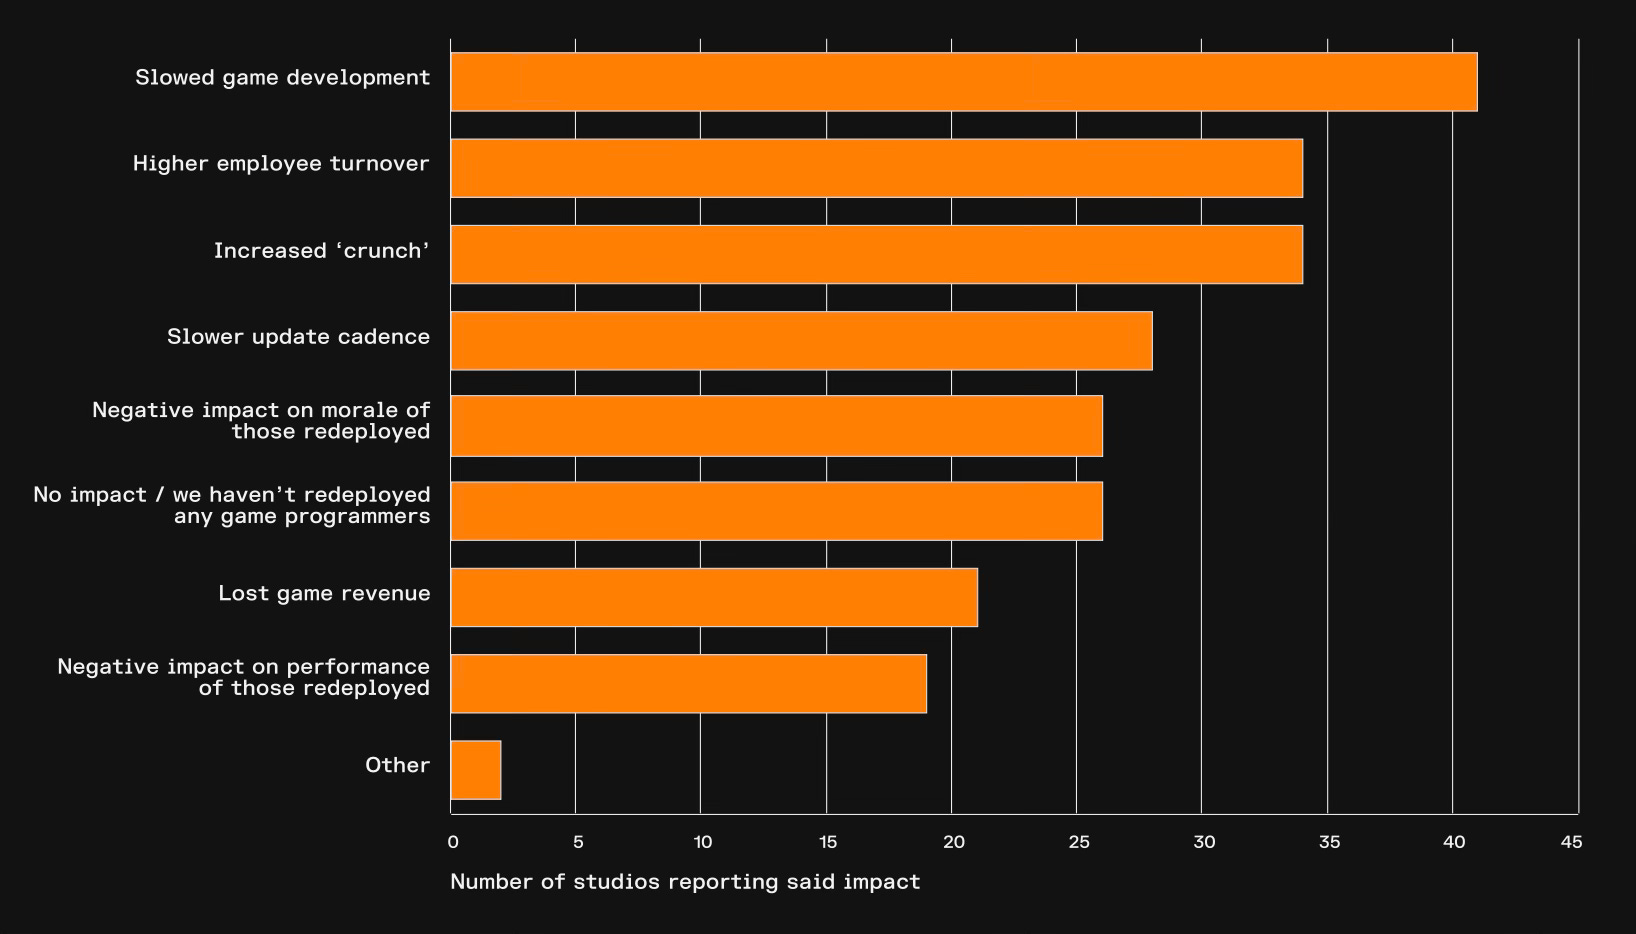
❗️Metaplay is a company that provides backend services. Therefore, the results of the study may be biased.
Circana: The US Gaming Market Decreased by 3% in April 2024

Market numbers
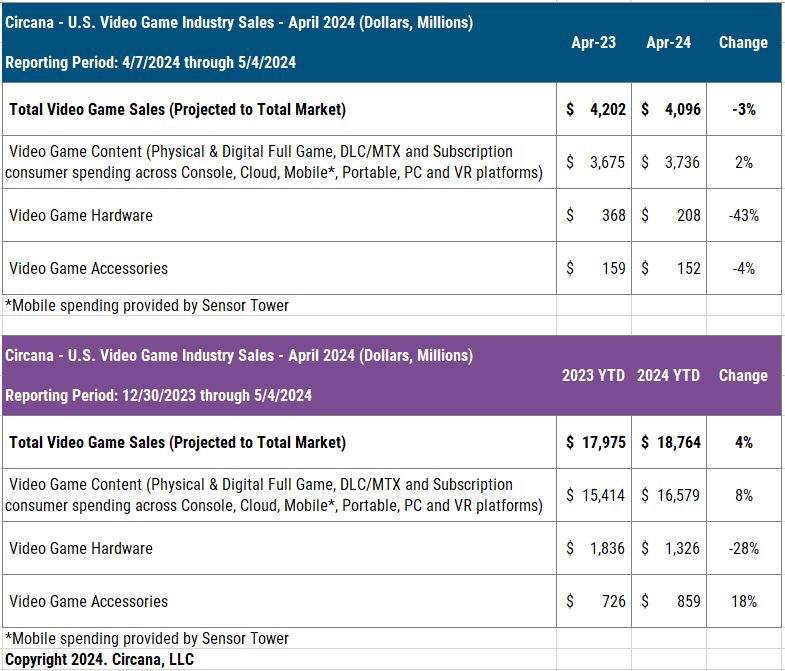
The volume of the US gaming market in April 2024 amounted to $4.096 billion. This is 3% less than a year earlier.
Sales of gaming content grew by 2% (to $3.736 billion).
Notably, this growth is driven by the mobile segment, which grew by 12% YoY, according to Sensor Tower. The console games segment is declining.
Gaming hardware sales plummeted by 43% (to $208 million). Accessory sales also fell by 4% (to $152 million).
PlayStation 5 ranked first in sales. The biggest decline was in Nintendo Switch sales, down 69% YoY, but this did not prevent the console from becoming the second best-selling device. Xbox Series S|X only outperformed the Nintendo Switch regarding dollar sales.
Currently, PS5 sales in the US are 8% ahead of PS4 sales for the same period. Xbox Series S|X is 13% behind Xbox One.
PlayStation Portal was the most successful accessory in April and overall in 2024 in terms of dollar sales.
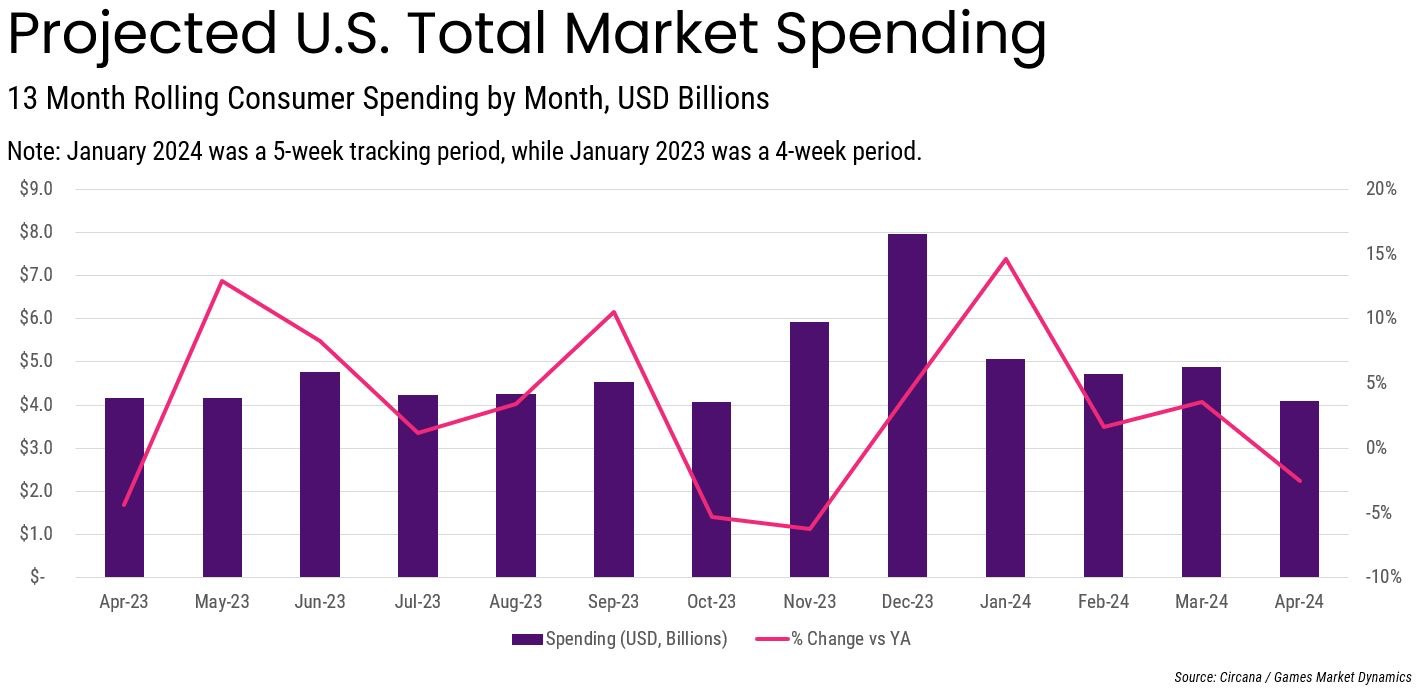
As of the first four months of 2024, the US market is 4% ahead of last year's figures for the same period.
Game Sales
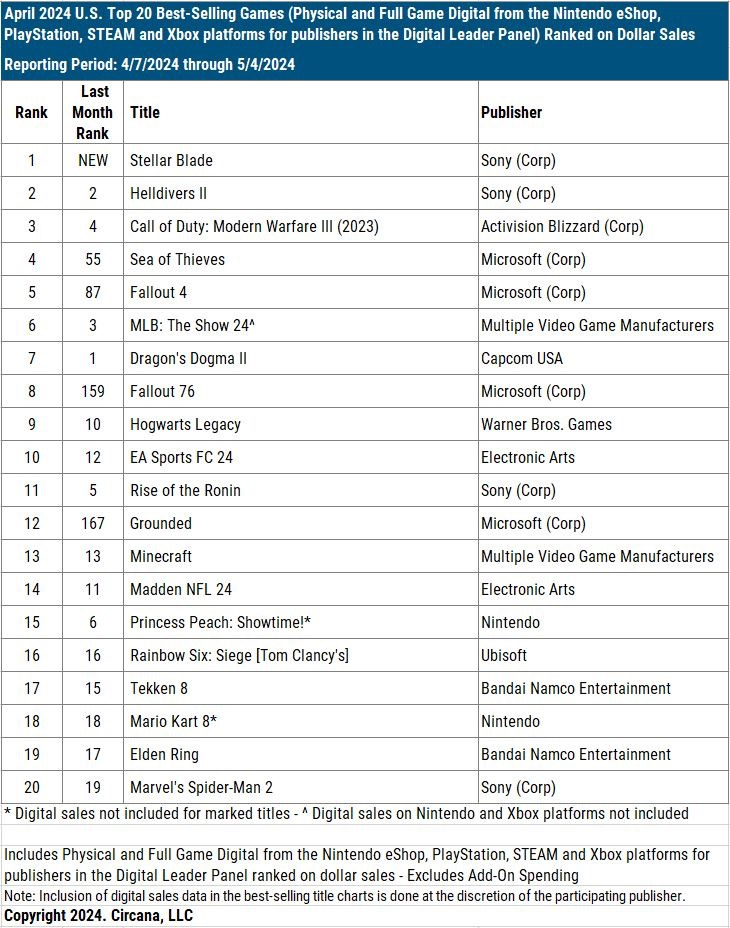
Stellar Blade became the best-selling B2P game in the US in April 2024. It ranks 16th overall. However, it leads with the fewest copies sold since April 2012, when Prototype 2 topped the chart.
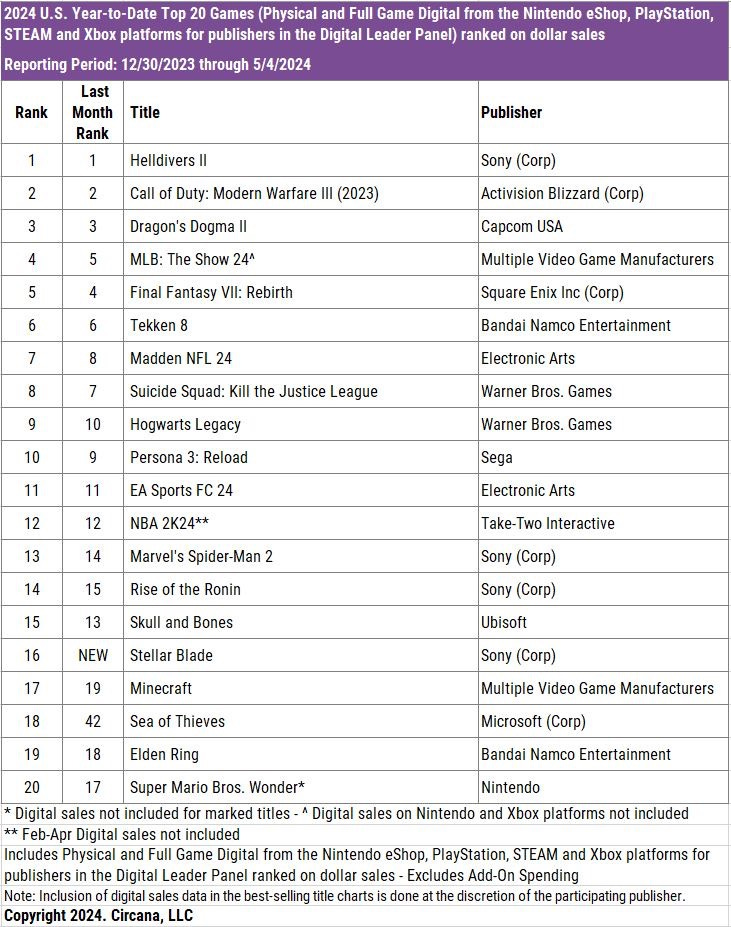
Helldivers II ranked second in sales. But the volume of copies sold fell by 70% compared to March this year. The game continues to confidently lead the overall sales ranking for 2024.
Sea of Thieves (4th place in April) and Grounded (12th place in April) significantly increased in sales after being released on PlayStation. In March, they were ranked 55th and 167th respectively.
Fallout 4 finished the month in 5th place in sales in April.
The leaders of the mobile market are MONOPOLY GO!, Royal Match, and Candy Crush Saga. Last War: Survival continues to grow actively, with revenue increasing by 16-18% compared to March 2024, according to Sensor Tower.
Games ranking by platforms
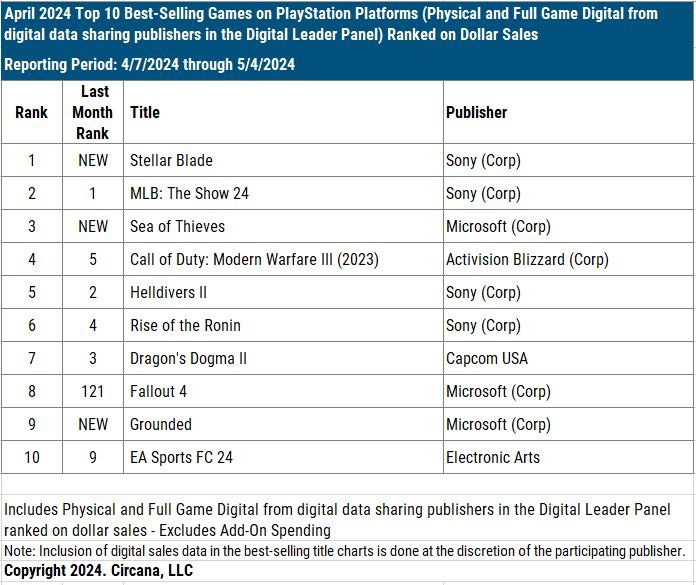
In the top 10 PlayStation sales, there are several new releases. Stellar Blade is in 1st place, Sea of Thieves is in 3rd place, and Grounded is in 9th place. Fallout 4 also returned to the top 10. Interestingly, these three games are published by Microsoft.
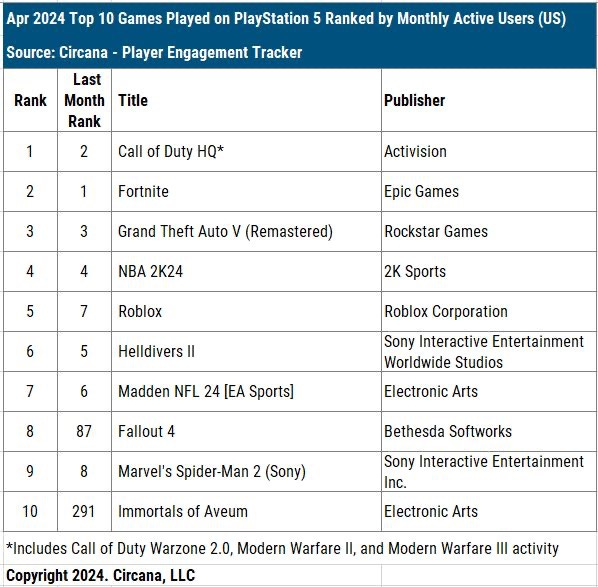
The leaders in MAU (Monthly Active Users) on PlayStation are Call of Duty (all games), Fortnite, and Grand Theft Auto V. Fallout 4 entered the ranking (thanks to the success of the series), as did Immortals of Aveum (the game is available in PS Plus).
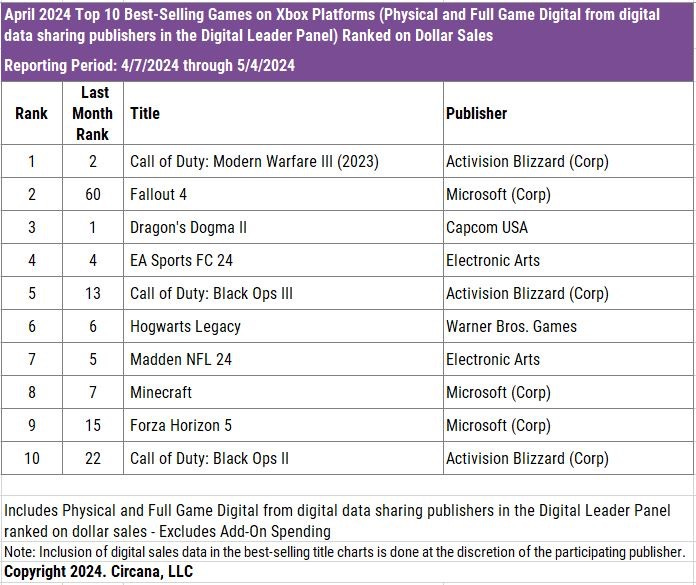
On Xbox, there are no new releases in the charts, but Fallout 4 returned to the top 10, ranking 2nd in April.
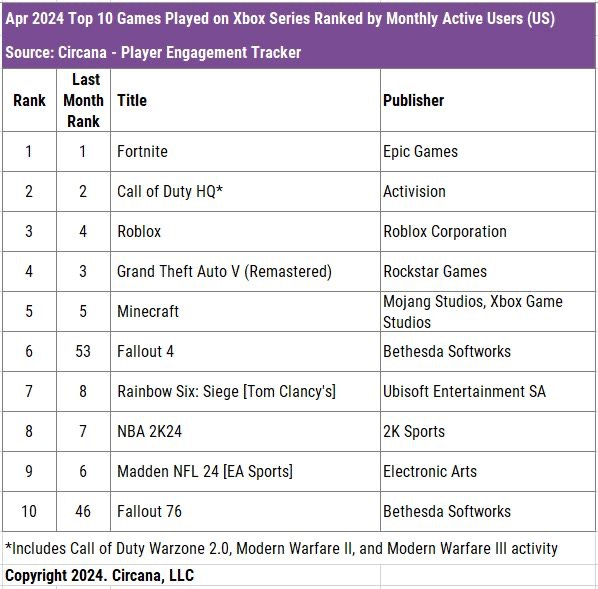
The leaders in MAU on Xbox are Fortnite, Call of Duty, and Roblox. Fallout 4 and Fallout 76 also made it to the top 10.
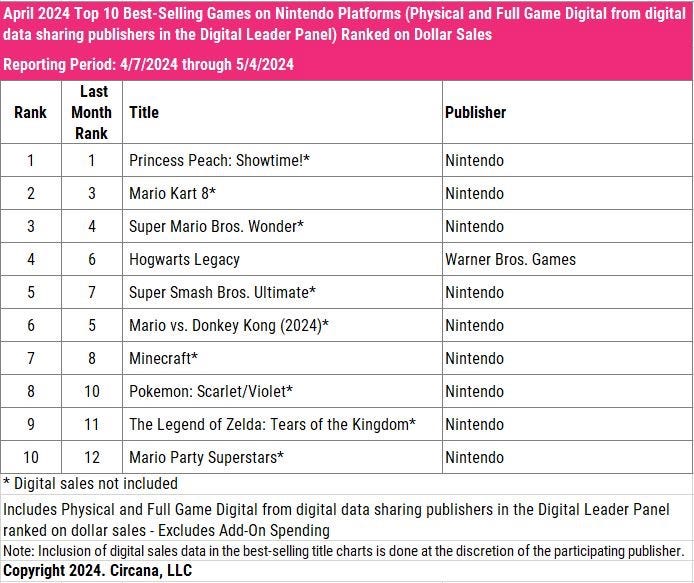
For Nintendo Switch, everything is stable—there were no new releases, and 9 out of the 10 best-selling games are published by Nintendo itself.
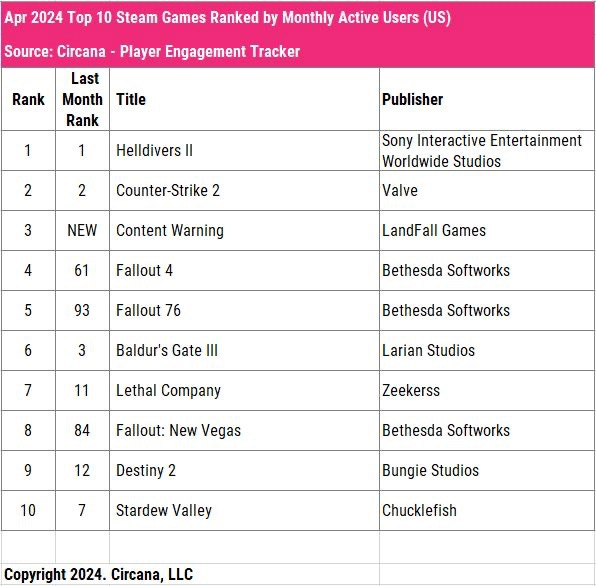
The leaders in MAU on Steam are Helldivers II, Counter-Strike 2, and Content Warning from Landfall Games. Fallout 4, Fallout 76, and Fallout: New Vegas also made it to the top 10.
PlayStation 5 is the most profitable console for PlayStation & more from a new FY'23 PS business presentation
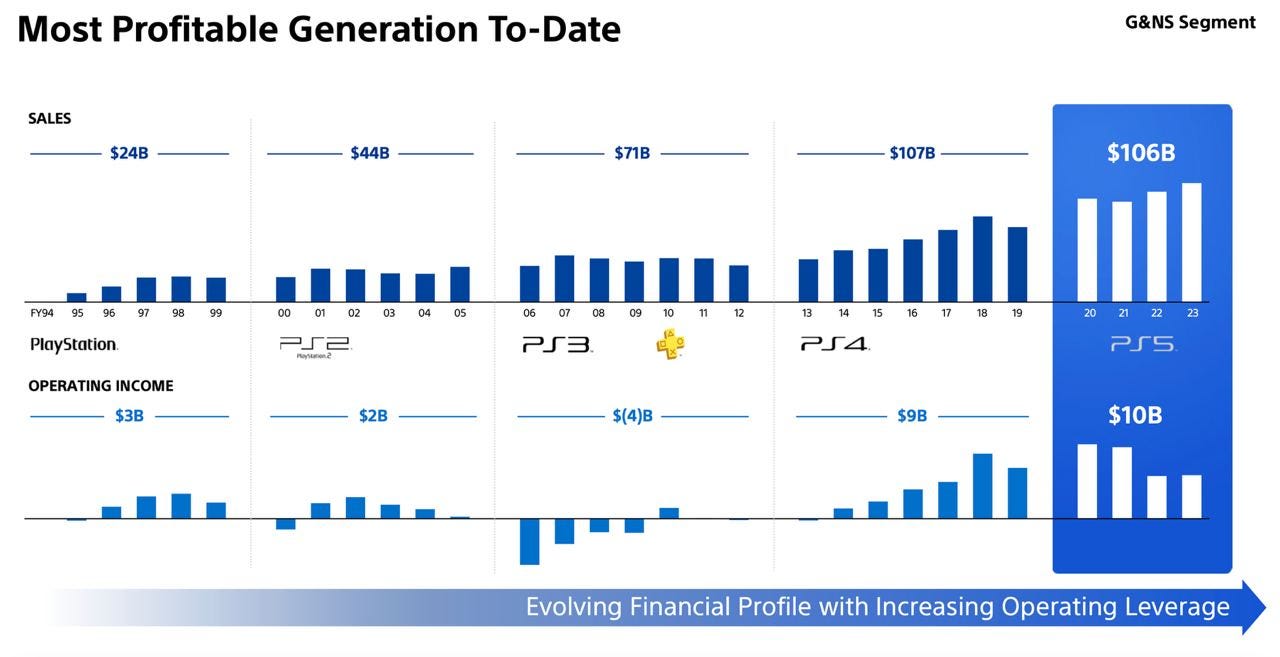
PlayStation 5 is Sony's most profitable console to date. It has already generated $106 billion in revenue (the record is still held by the PS4 at $107 billion), but operating income is already a record $10 billion (compared to $9 billion for the PS4).
As of March 2024, PlayStation platforms had 118 million MAU (unique accounts are counted).
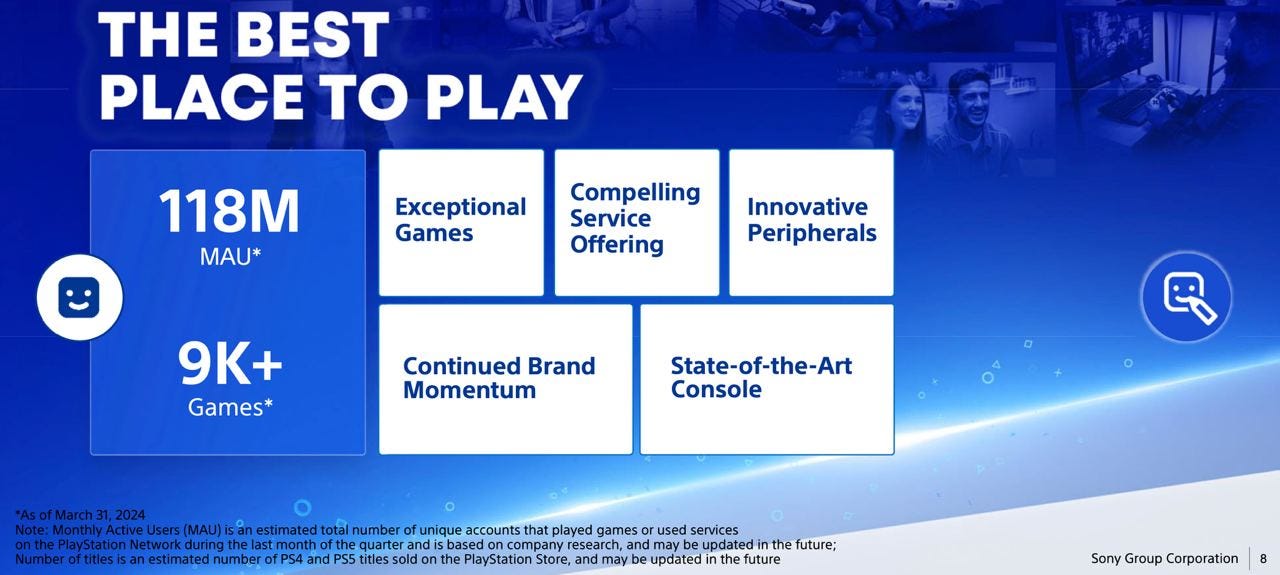
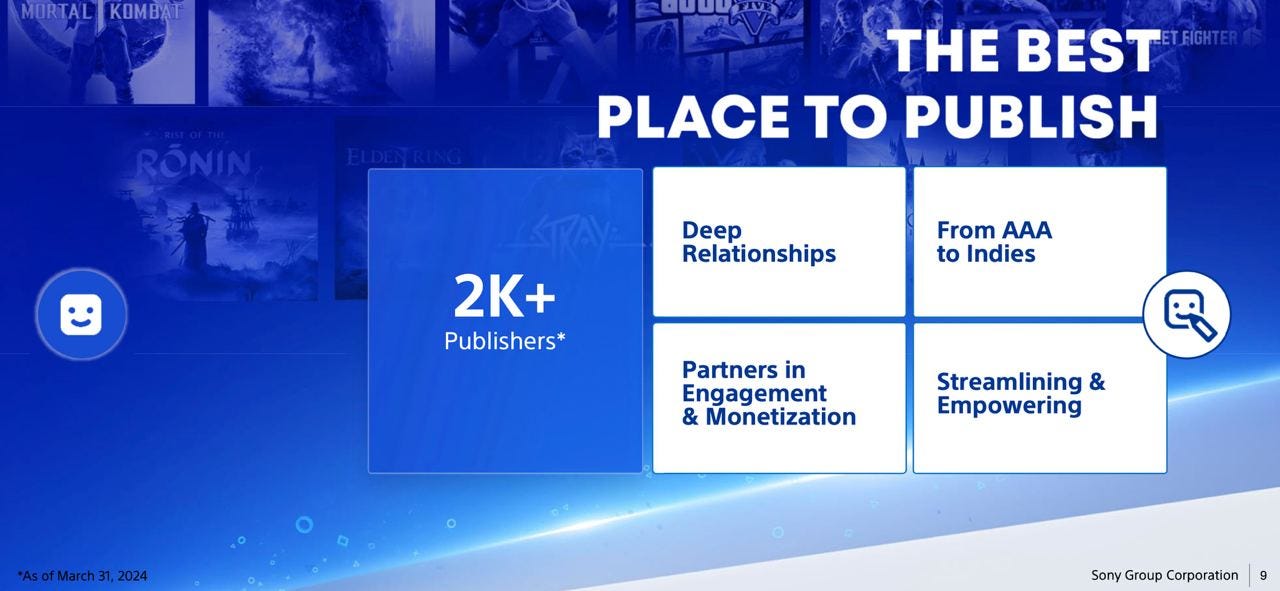
More than 2,000 publishers and 9,000 games are on the platforms as of the end of March 2024.
Sony's presentation includes the metric Monthly Active Consoles. According to this statistic, there were 97 million active PlayStation consoles worldwide in April 2024. Half of them are PS5s, and half are PS4s.
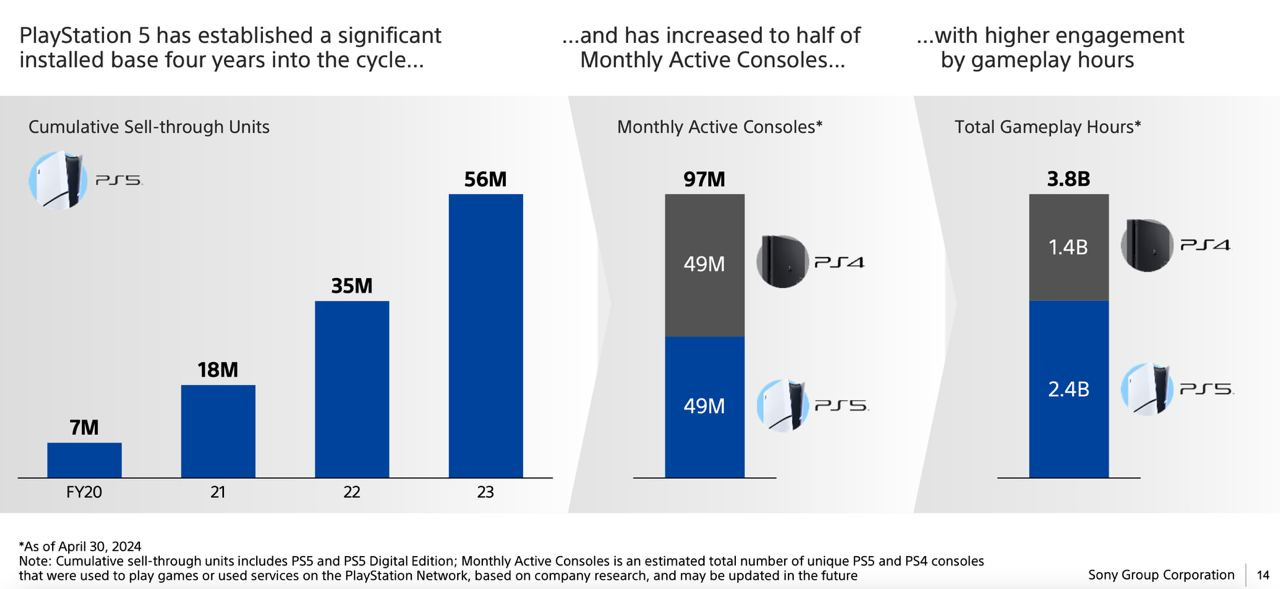
Of the total number of hours played in April 2024 (3.8 billion), 63% (2.4 billion hours) are on the PlayStation 5. User engagement on the PS5 is significantly higher.
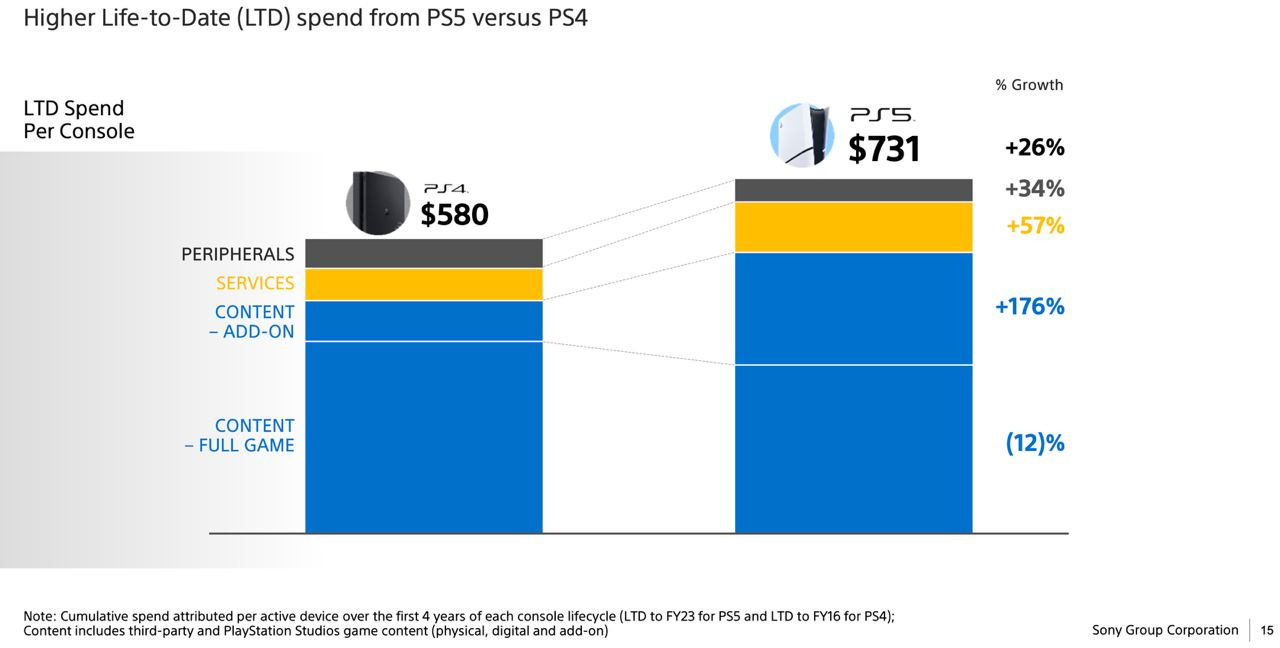
The cumulative average user spending on the PlayStation 5 over 4 years is $731. This is 26% more than for the same period on the PS4 ($580). Almost all spending segments are growing - in-game purchases (+176%); service spending (+57%); peripheral spending (+34%). Only full game purchases have decreased - they are down 12% compared to the previous generation.
Consider subscribing to the GameDev Reports Premium tier to support the newsletter. Get access to the list of curated articles & archive of Gaming Reports that I’ve been collecting since 2020.
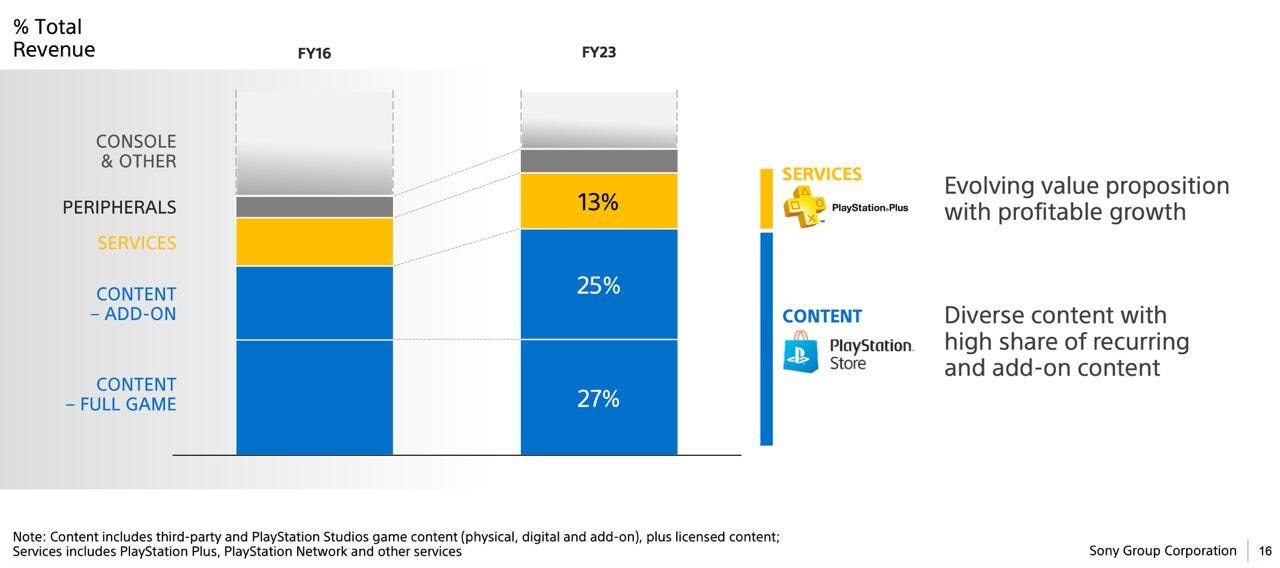
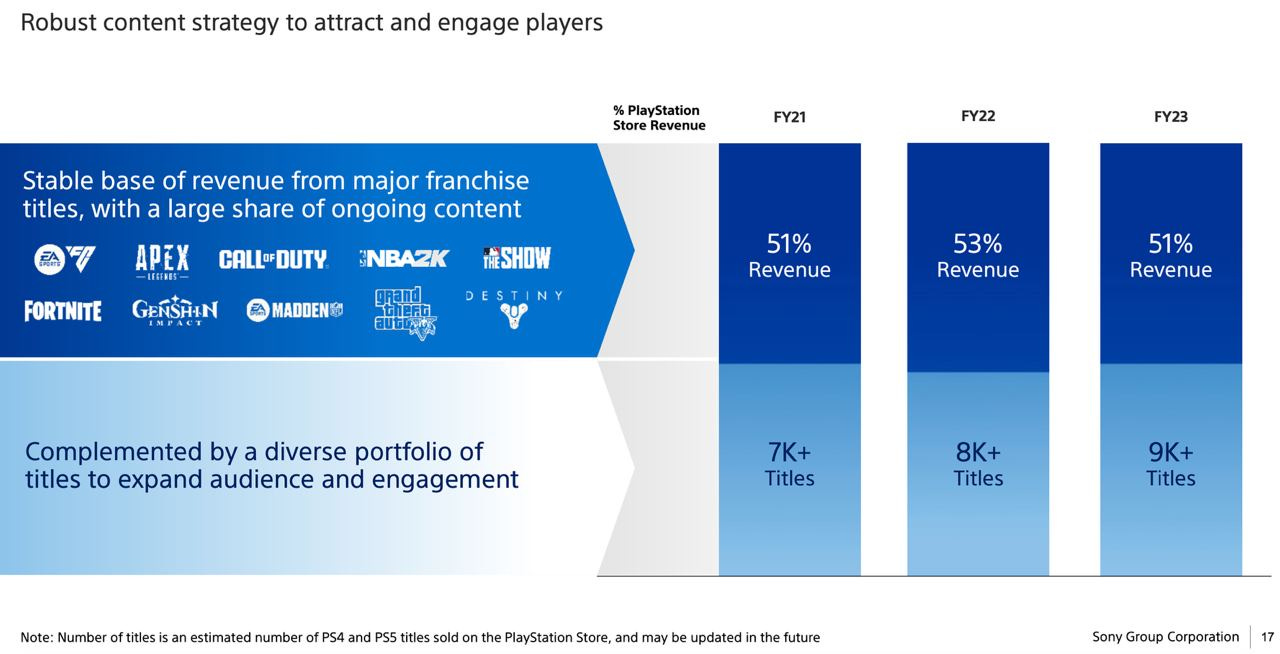
GAAS projects and major annual releases have generated 51-53% of all PlayStation Store revenue for three consecutive fiscal years.
35% of PS Plus subscribers are subscribed to PS Plus Premium (+11% YoY) or Extra (+23% YoY).

Sales of Marvel’s Spider-Man 2 reached 11 million copies as of the end of April 2024. Helldivers II sold 12 million copies on PC and consoles as of May 5 this year.
The company plans to launch live service games simultaneously on PS5 and PC. Single-player projects will be released on PC with a delay.