

Weekly Gaming Reports Recap: May 5 - May 9 (2025)
Liftoff covered the casual market trends in 2025; Alinea Analytics shared the launch number of Clair Obscur: Expeditions 33; AppsFlyer released the report about the creatives in mobile games.

Reports of the week:
AppsFlyer: Games Creative Trends in 2025
Games & Numbers (April 23 - May 6, 2025)
Liftoff & Singular: Casual Games in 2025
Alinea Analytics: Clair Obscur: Expedition 33 is Selling Faster Than Major JRPG Franchises on Steam
AppsFlyer: Games Creative Trends in 2025

The company analyzed over 1.1 million video creatives across more than 1,300 apps. These creatives accounted for over $2.4 billion in marketing spend.
IPM metric is Installs per mille.
General market overview
In Q1'25, the top 2% of creatives in games accounted for 53% of marketing spend (last year it was 56%).
In non-gaming apps, the top 2% of creatives accounted for 43% of all spend (last year it was 47%). AppsFlyer notes that game marketers are more focused on meeting performance KPIs.


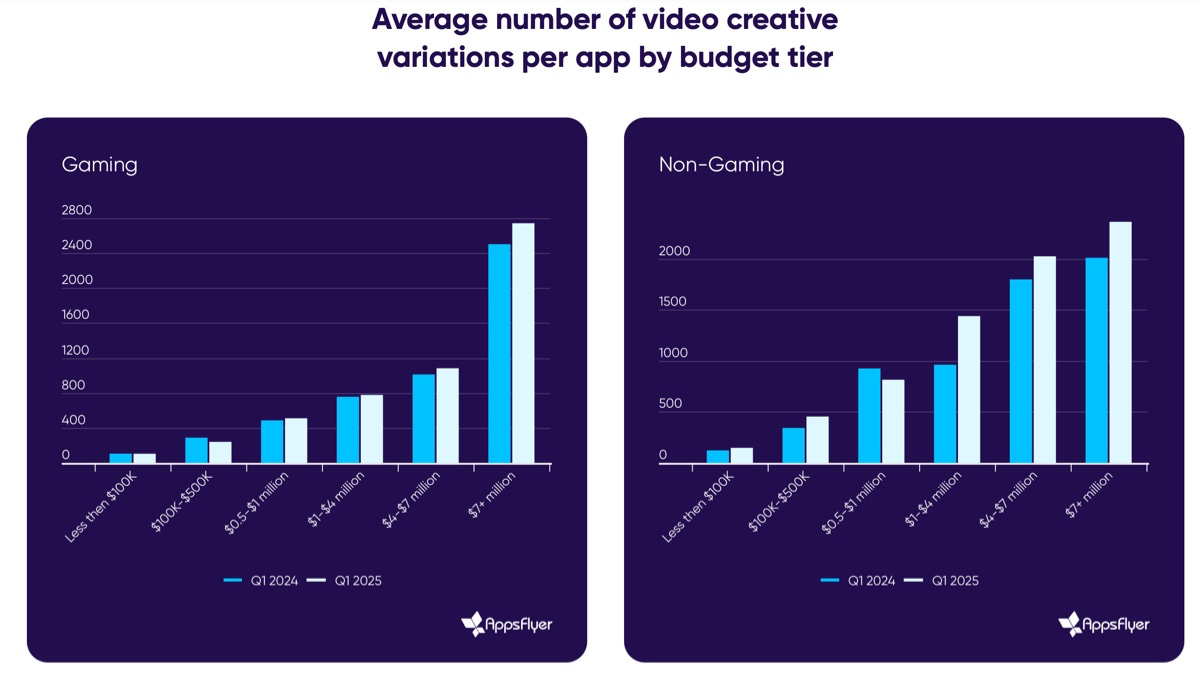
Games that spend over $7 million per quarter on marketing produce an average of 2,743 video creatives per quarter. That’s 3 times more than those spending $4M–$7M per quarter, and 5–6 times more than those spending $1M–$4M.
Games spending over $1M per quarter increased their creative volume by 8%. Those spending less, on the contrary, produced 3% fewer creatives.
AppsFlyer notes that while market leaders are growing, smaller companies are facing challenges. They are focusing not on growth, but on optimizing existing marketing campaigns.
Creative trends in Casual Games
❗️AppsFlyer uses AI creative categorization by motivation (e.g., completion), by hooks(e.g., humorous skit), by creative ending (e.g., pure failure/victory). UGC content is divided into three categories: gameplay review, reaction video, and creator recommendation. Read more about categories here.
Casual product marketers mostly work with creatives that evoke a sense of excitement, as well as creatives that show completion. The former performs better in terms of D7 Retention.

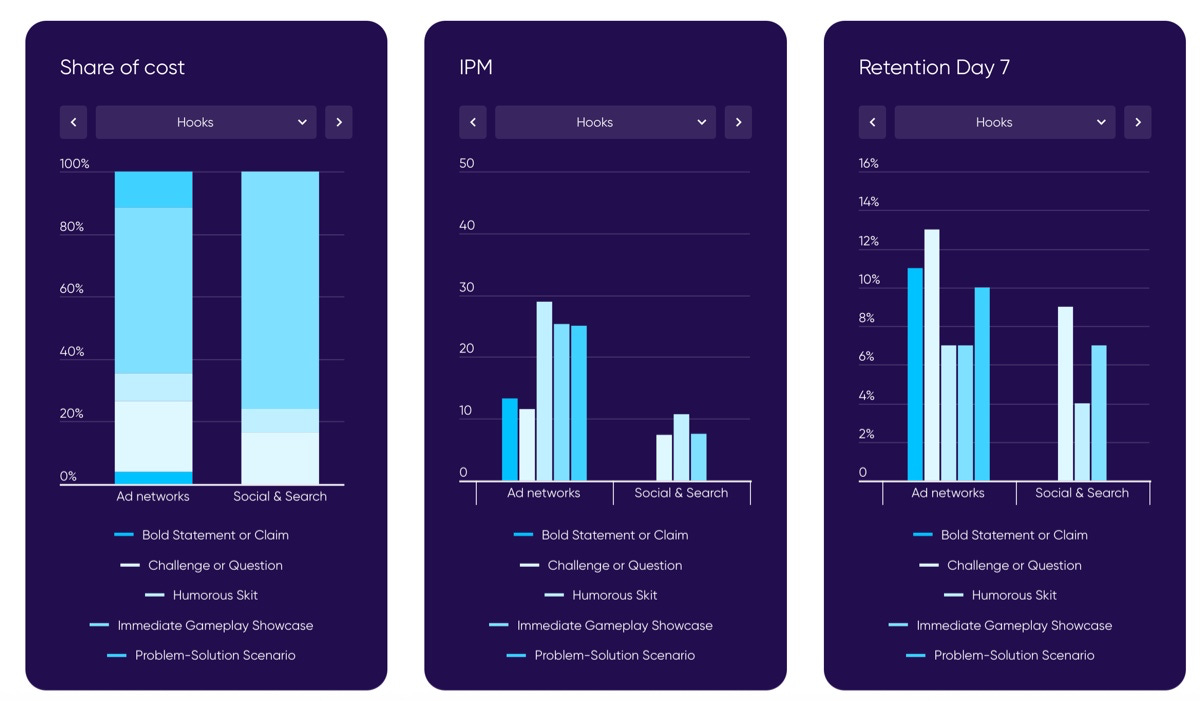
When it comes to hooks, the most popular type is gameplay showcase. On social media, bold statement hooks are often used, but these have low IPM. Most likely, the audience stops believing in such direct advertising. Humorous skits show good IPM. Interestingly, creatives with celebrities have low IPM.

Creatives that end with the user’s victory, on average, show 33% higher IPM. But on social media, creatives with a bad ending - where the player is offered a chance to fix the situation - perform 65% better.

In UGC creatives for casual games, testimonials/endorsements account for the majority of spend. However, creatives with gameplay reviews have higher IPM and D7 Retention, but account for less than 5% of all marketing spend.

Creative trends in Hyper-Casual Games
Creatives showing users a hard challenge deliver the best D7 Retention for the genre.
Consider subscribing to the GameDev Reports Premium tier to support the newsletter. Get access to the list of curated articles & archive of Gaming Reports that I’ve been collecting since 2020.
Meanwhile, creatives showing exciting moments from the game have the highest IPM, but lose out in terms of mid-term user retention.

Gameplay creatives dominate hyper-casual game advertising, they have over half of ad network spend, and more than 72% of all social media spend. IPM is higher in creatives with humorous skits.
The highest D7 Retention is in creatives that show a hard challenge or ask users a question.
In UGC creatives, most ad network traffic goes to testimonials/endorsements (83% of all spend). These have the highest D7 Retention - 14.56%. On social media, marketers focus more on creatives with emotional reactions from content creators.

The highest IPM is in “failure-to-success” scenario creatives. For D7 Retention, those showing the user achieving success are the leaders.

Creative Trends in Midcore Games
As with casual projects, creatives focusing on excitement account for 55–60% of all budgets. These creatives have strong IPM in ad networks, but weak D7 Retention. In DSP and social networks, such creatives also don’t show outstanding metrics.
Creatives demonstrating competition or social elements show better D7 Retention. Despite this, they account for only 8% of all marketing spend on social networks.

For hooks, most budgets go to creatives that immediately demonstrate gameplay. These have outstanding IPM in ad networks, but rather weak D7 Retention.

All types of UGC-creatives are actively used for midcore projects - gameplay reviews (44%), testimonials (39%), and reaction videos (18%).
In ad networks, testimonials show the highest D7 Retention, while on social networks, reaction videos perform best.

In terms of the scenario, most spend goes to creatives demonstrating user success. These also have decent D7 Retention.
Creative trends in Social Casino
Most spend goes to creatives showing the completion of a goal or task. In ad networks, this type accounts for over 80% of all spend and has the highest D7 Retention (11.6%).
This type of creatives also receives the most spend on social media (about 70%), but there, such creatives don’t show the best D7 Retention.

AppsFlyer notes an opportunity for marketers to shift budgets to creatives demonstrating other motivations for users on social media such as excitement or competition.
In terms of hooks, most spend goes to gameplay videos (from 55% to 78% of spend, depending on the channel). The highest IPM in ad networks is shown by creatives that ask the user a question or show a challenge.

For UGC creatives, most traffic is for testimonials and endorsements. These have slightly higher IPM and much higher D7 Retention, so the bet is justified.

Over 80% of all spending on ad creatives goes to those showing the user winning large sums.

Creatives with Celebrities in Games
Consider subscribing to the GameDev Reports Premium tier to support the newsletter. Get access to the list of curated articles & archive of Gaming Reports that I’ve been collecting since 2020.
Movie star ads account for 63% to 91% of all spend, depending on the channel. However, such creatives are far from leaders in IPM and D7 Retention. TV star creatives perform better in terms of IPM, while music artists and influencers in social networks lead in D7 Retention.

In terms of gender, more is spent on ads with male celebrities. But ads with female celebrities have slightly higher Retention on social media.
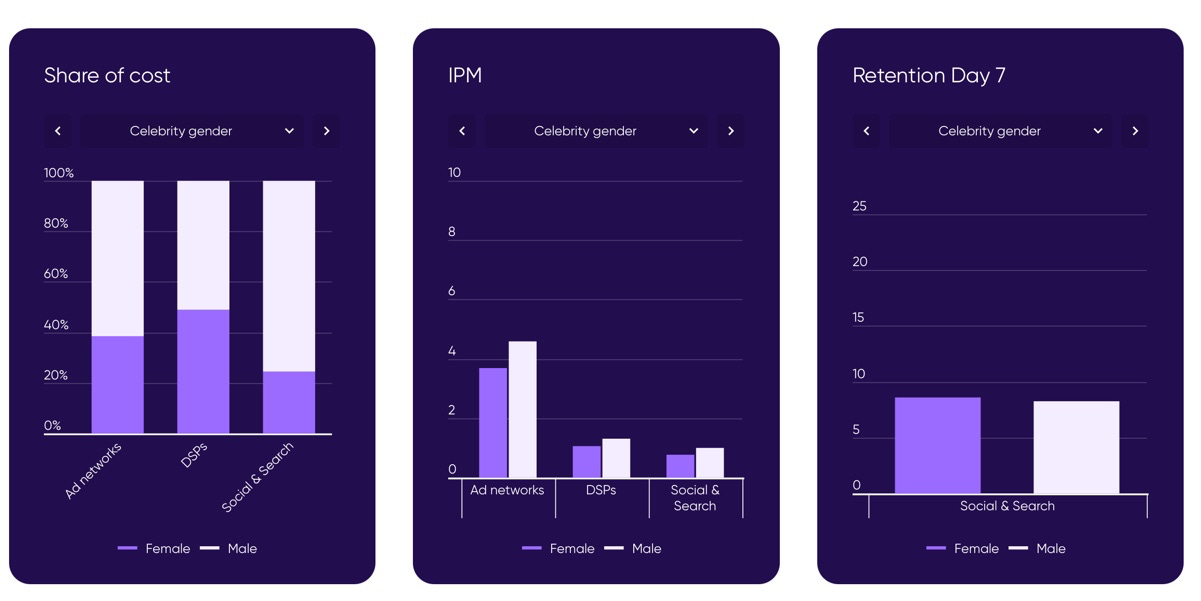
Creatives where celebrities do not play a central role have the highest IPM. But such creatives account for less than 10% of all spend.

The top spend goes to creatives, where celebrities play a supporting role. However, D7 Retention for these creatives is lower than for ads where celebrities have the main role.
Games & Numbers (April 23 - May 6, 2025)
PC/Console Games
Resident Evil 4 Remake has sold over 10 million copies. Less than 1% of sales came from mobile devices.
In April, The Elder Scrolls IV: Oblivion Remastered generated $105.4 million in gross revenue on Steam, according to GameDiscoverCo. That’s more than all other games combined for the month.
Crusader Kings III has sold over 4 million copies in the 4.5 years since its release.
Claire Obscure: Expedition 33 sold over 1 million copies in the first 3 days after release.
Consider subscribing to the GameDev Reports Premium tier to support the newsletter. Get access to the list of curated articles & archive of Gaming Reports that I’ve been collecting since 2020.
Over 2 million people have played Prince of Persia: The Lost Crown. The studio that developed the project has been closed.
Mobile Games
Monster Strike revenue surpassed $11 billion over 11 years of operation. 99% of this revenue came from Japan.

Monopoly GO! has generated over $5 billion in gross bookings in less than 2 years- this is a record number. In the first three months of 2025, the game brought Hasbro nearly $40 million.
Marvel Contest of Champions has earned over $2 billion on mobile since launch. The developers are now preparing to release the game on PC.
Royal Kingdom earned $52.7 million over the last 5 months. The project is showing steady growth, with 11.77 million downloads in the same period, according to AppMagic.

Castle Duels by MY.GAMES surpassed $1 million in monthly revenue. Since its 2024 launch, the project has earned over $6 million.
Big Cash Bingo from Israeli studio Bring it On! reached $500,000 in monthly revenue. This is a skill-based game, and the developers have already paid out $45 million to winners.
Mobile devices account for 80% of Roblox’s total DAU. PC has 17%, consoles 3%. Despite the strong dominance of mobile users, they account for only 46% of the project’s total revenue (30% from the App Store; 16% from Google Play). The average Roblox DAU in 2024 was 82.9 million.
Delta Force Mobile was downloaded over 10 million times in the first 4 days after release. The game launched with 25 million pre-registrations.
Gaming Hardware
2.2 million people in Japan entered the lottery for access to Nintendo Switch 2 pre-orders. This exceeded the company’s expectations.
Liftoff & Singular: Casual Games in 2025

Companies collected marketing data from February 2024 to February 2025. The research is based on 2.4 billion installs and $11.9 billion in marketing budgets. Ad campaigns from the sample projects were viewed 1.1 trillion times and received 36 billion clicks.
Marketing benchmarks
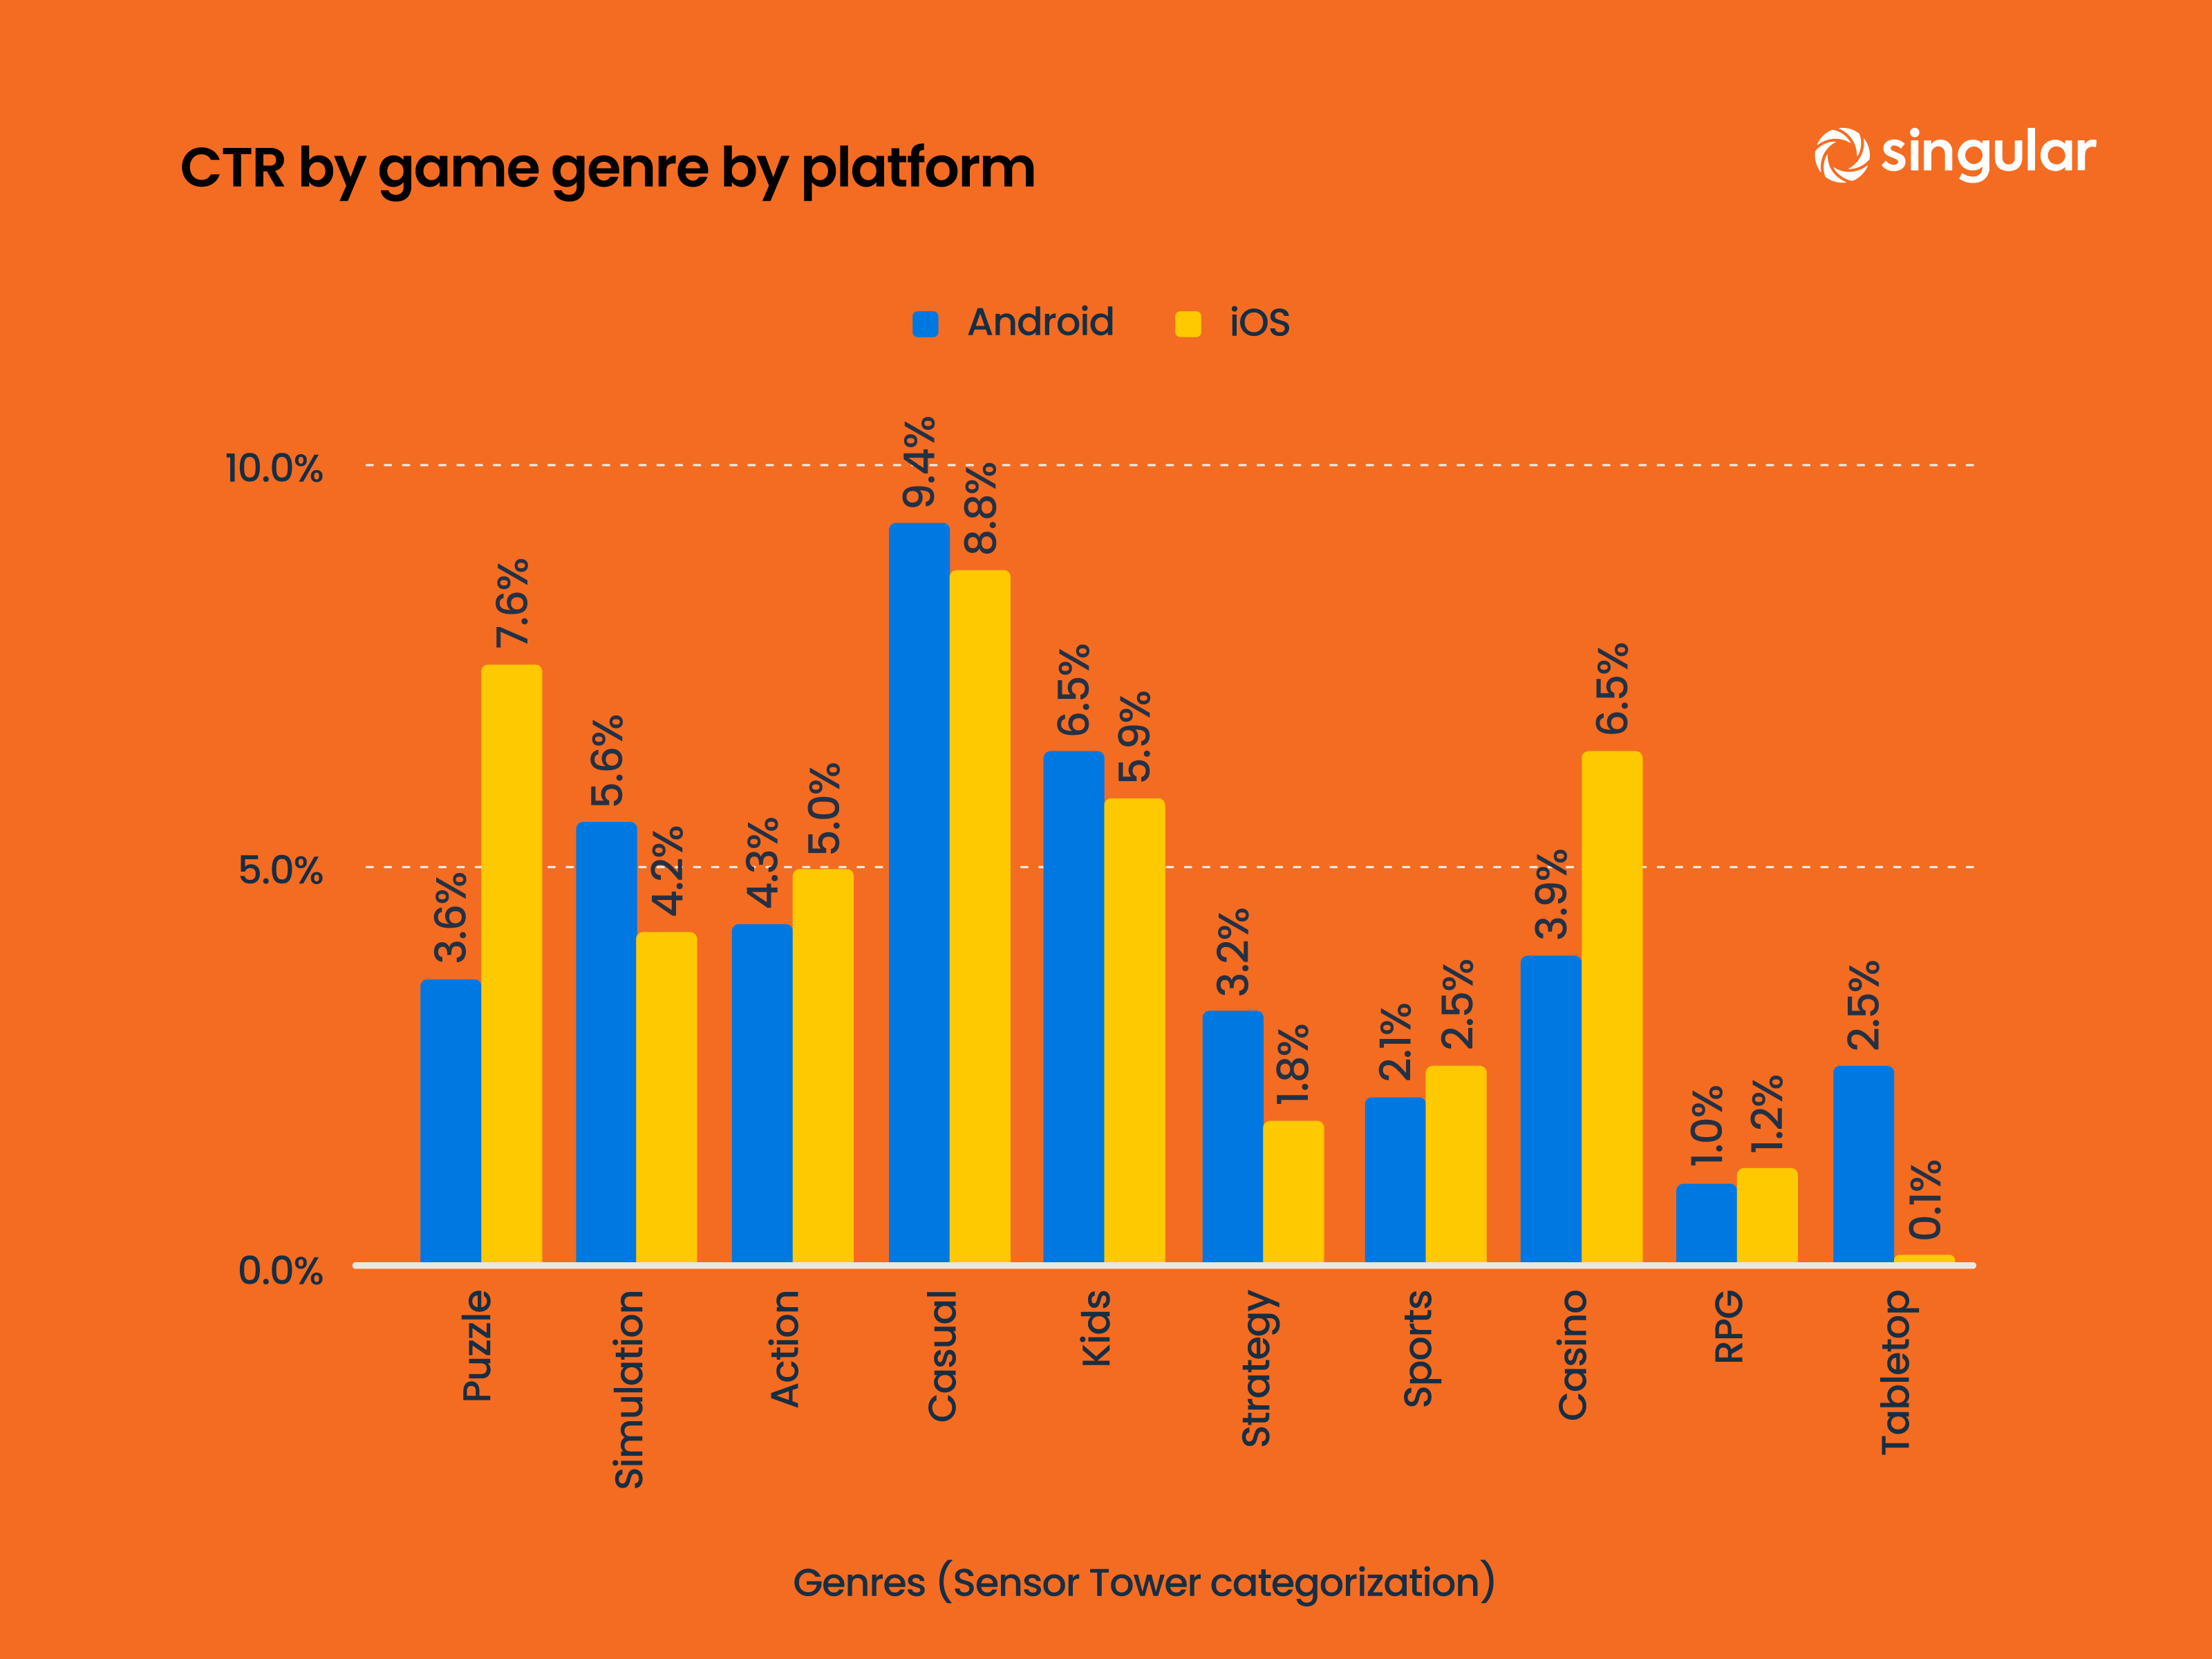
Casual games have the highest CTR among mobile projects (9.4% on Android; 8.8% on iOS). It’s important to note that this includes hyper-casual projects.
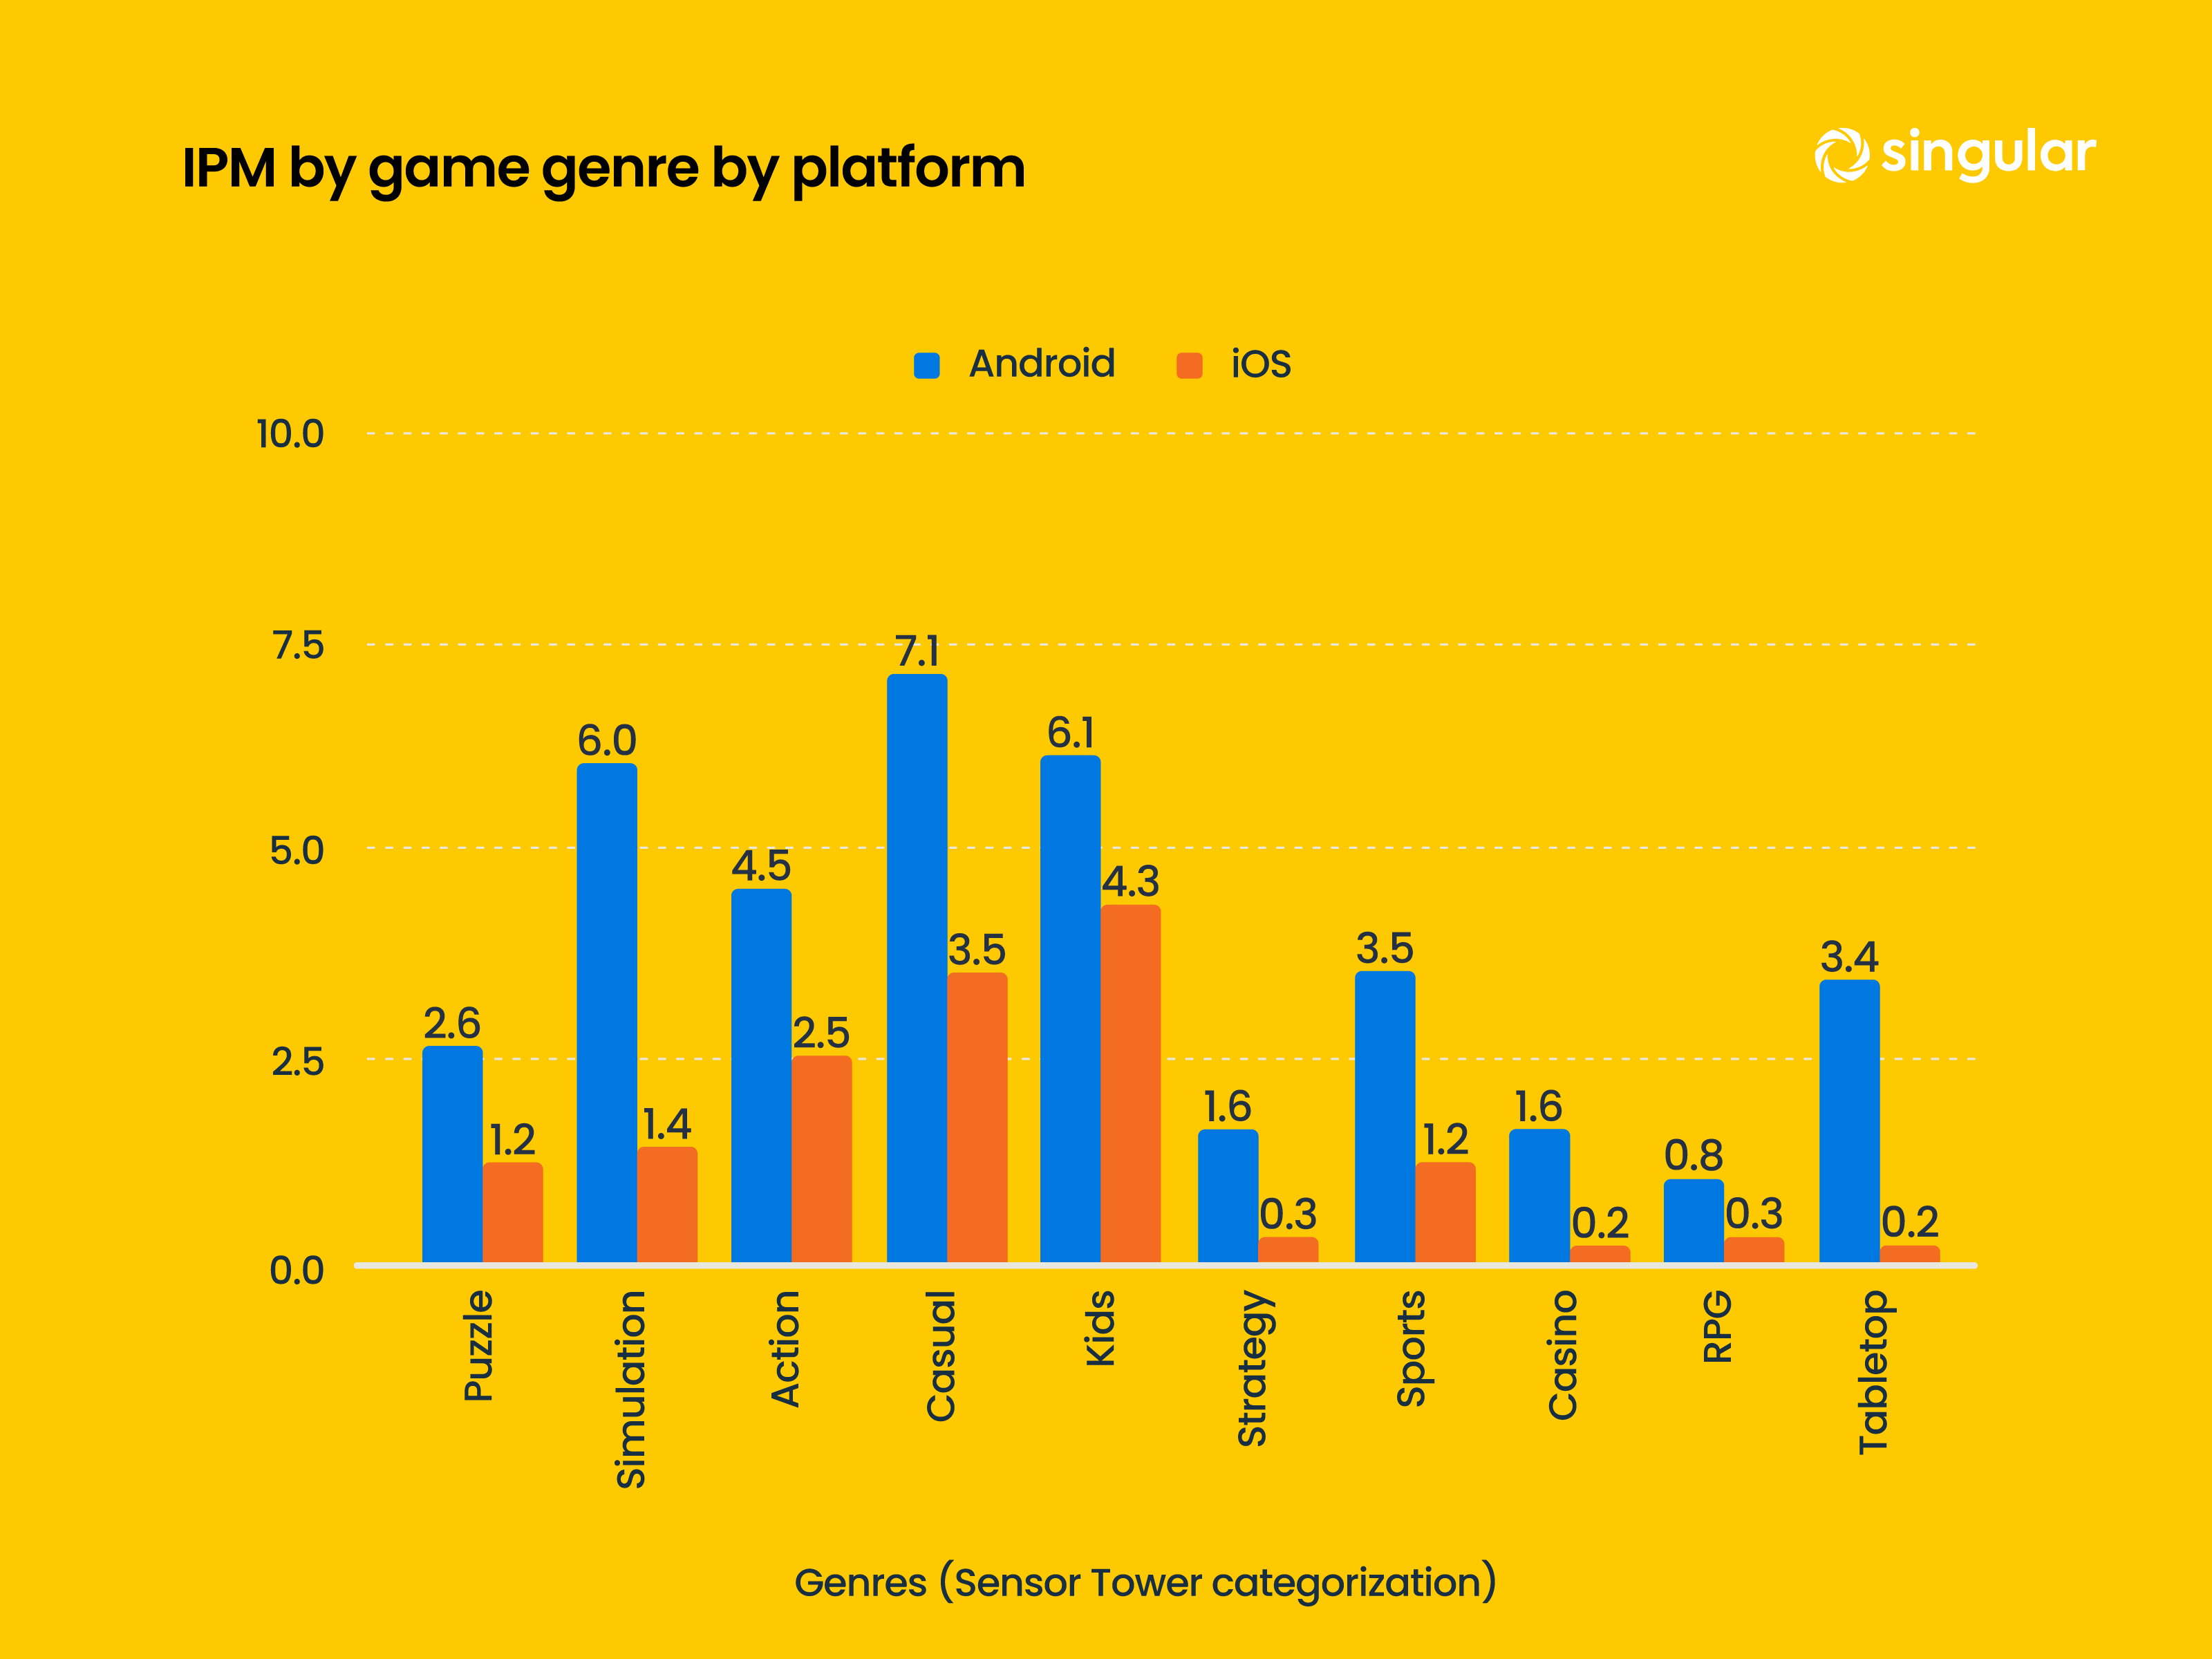
Average IPM (installs per mille) is significantly higher on Android than on iOS.
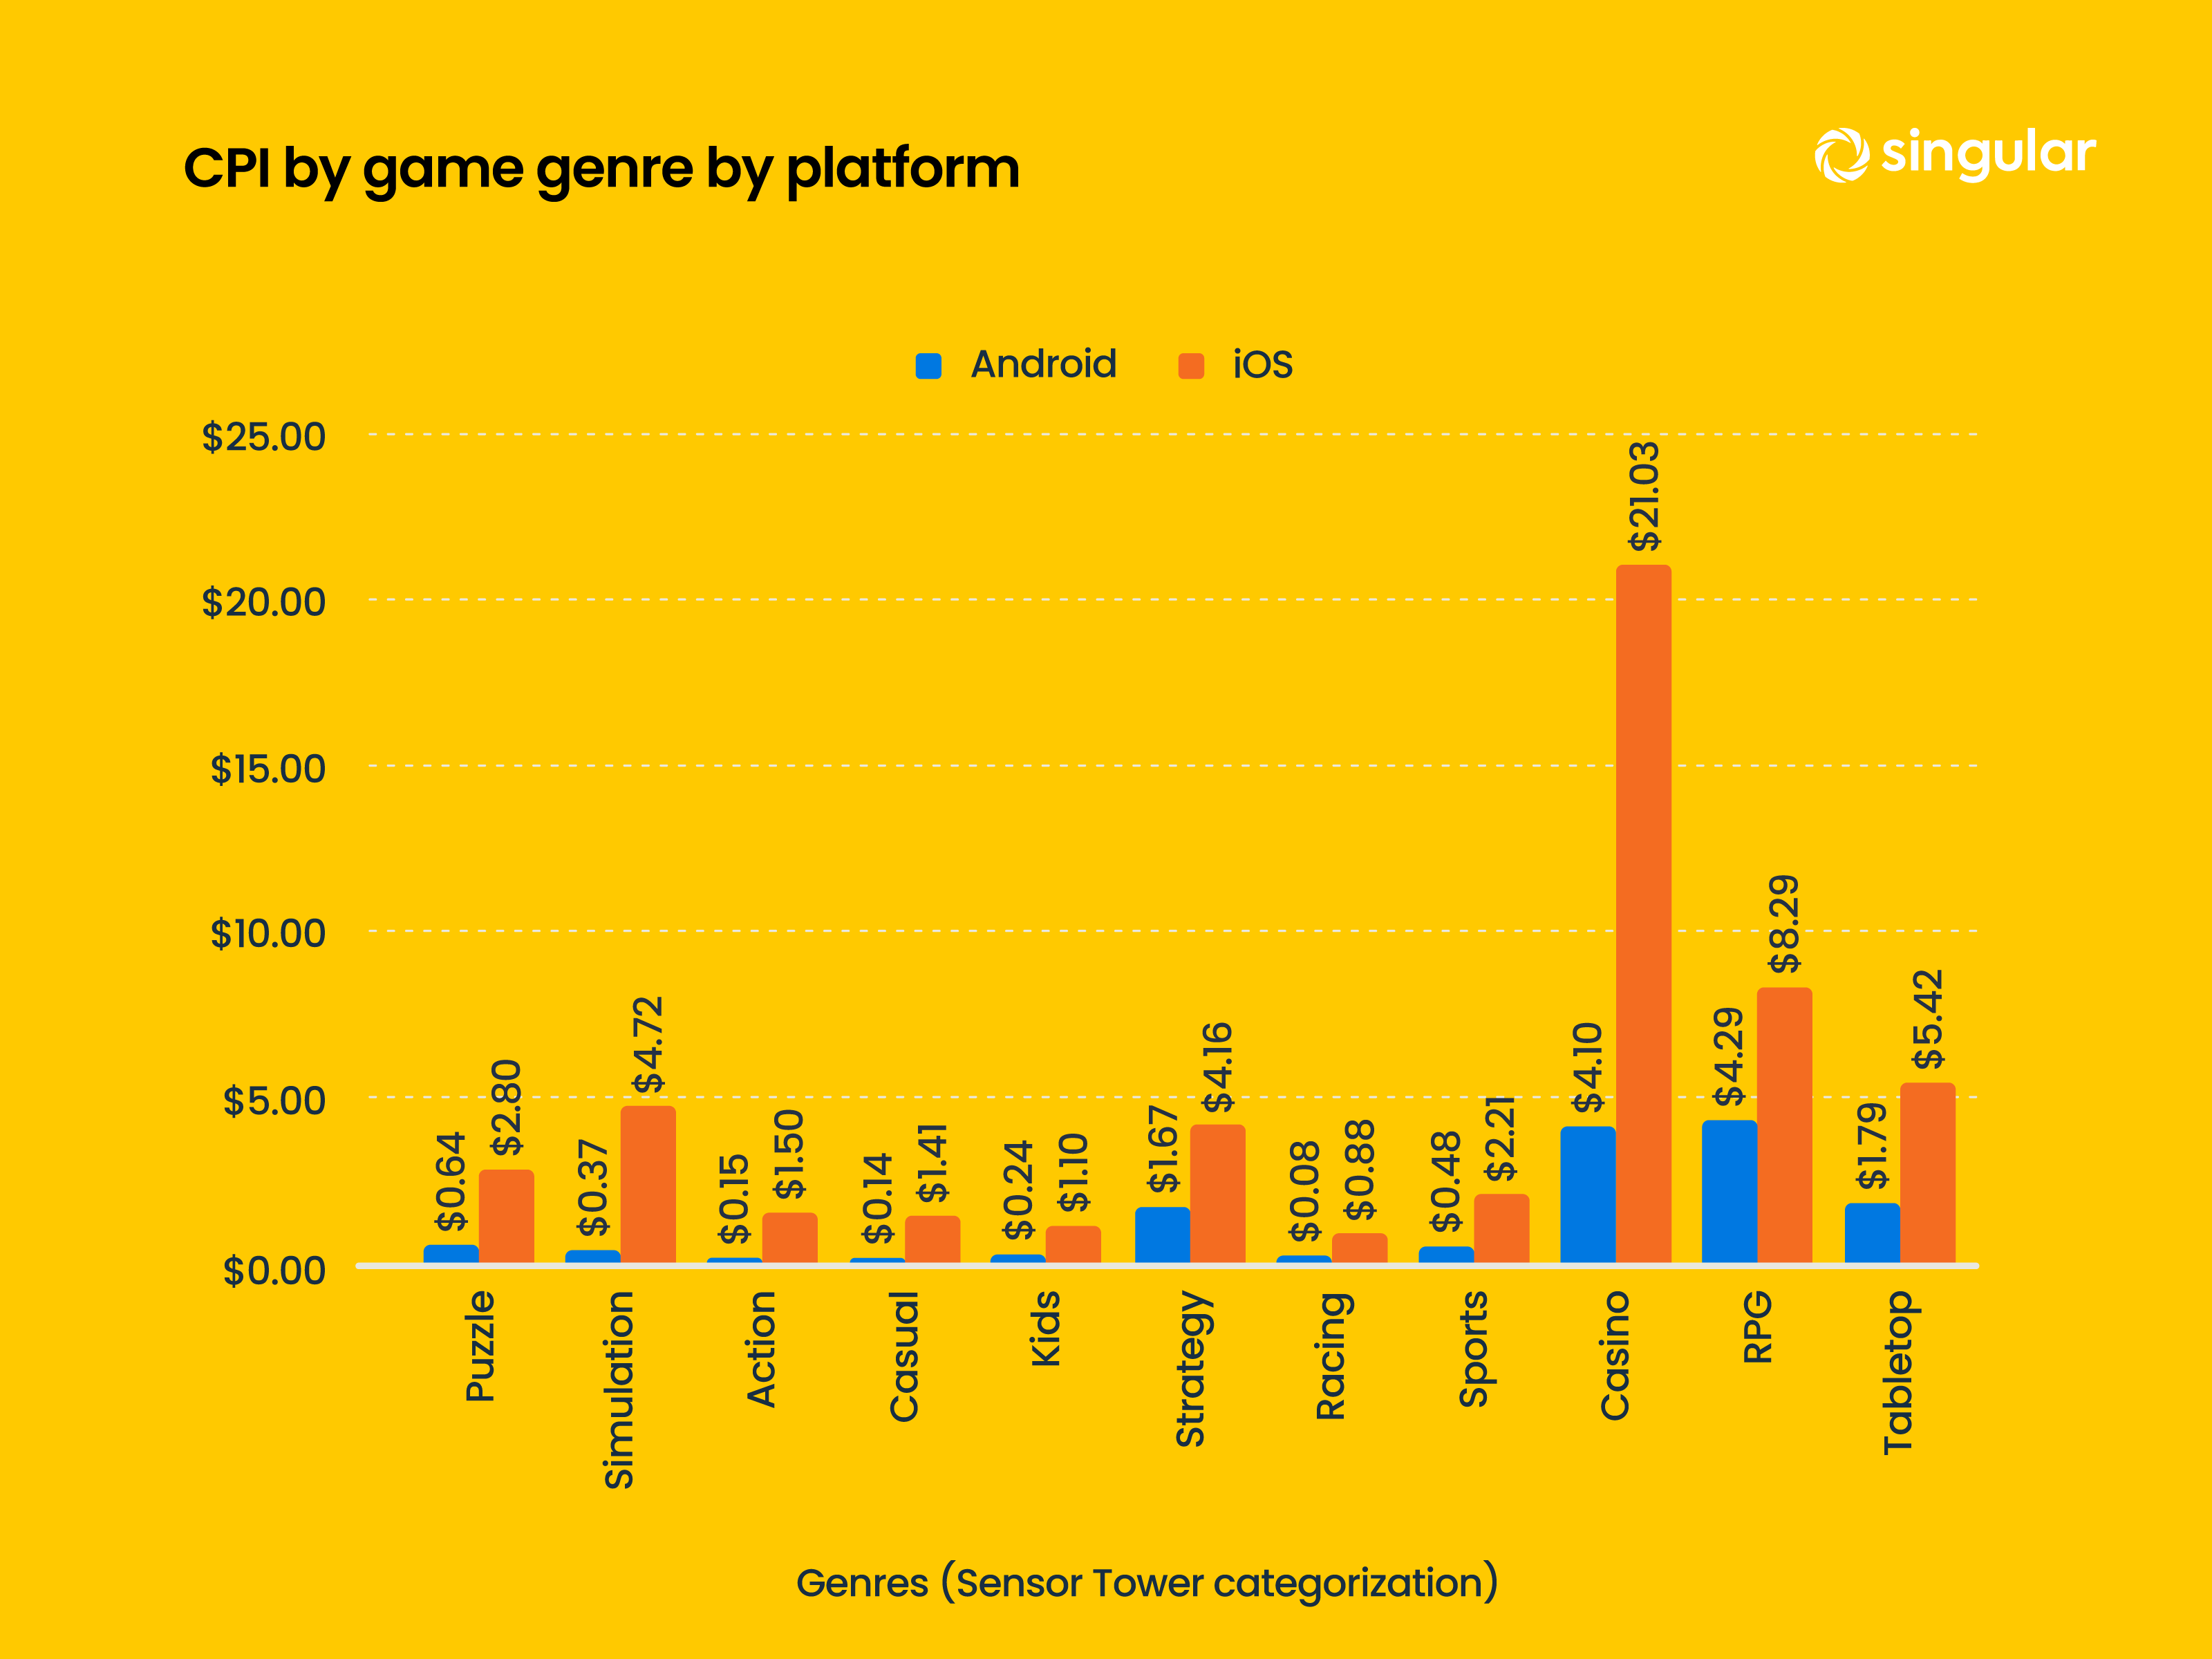
CPI is traditionally higher on iOS. In some genres, the difference is more than 4x. The highest CPI on iOS is in casino games - $21.03. On Android, RPGs lead with $4.29.
At the same time, average D30 ROAS figures are significantly higher on iOS.

❗️As always, a reminder: these are aggregated numbers across many projects. In my opinion, numbers more or less correlate with reality, but the Android benchmarks look low (if we’re talking about successful projects).
Where Casual Games attract their audience
Consider subscribing to the GameDev Reports Premium tier to support the newsletter. Get access to the list of curated articles & archive of Gaming Reports that I’ve been collecting since 2020.
In this section, Liftoff specialists examined ad campaigns that brought in 55 million installs. These ads were viewed 318 billion times and received 27 billion clicks.
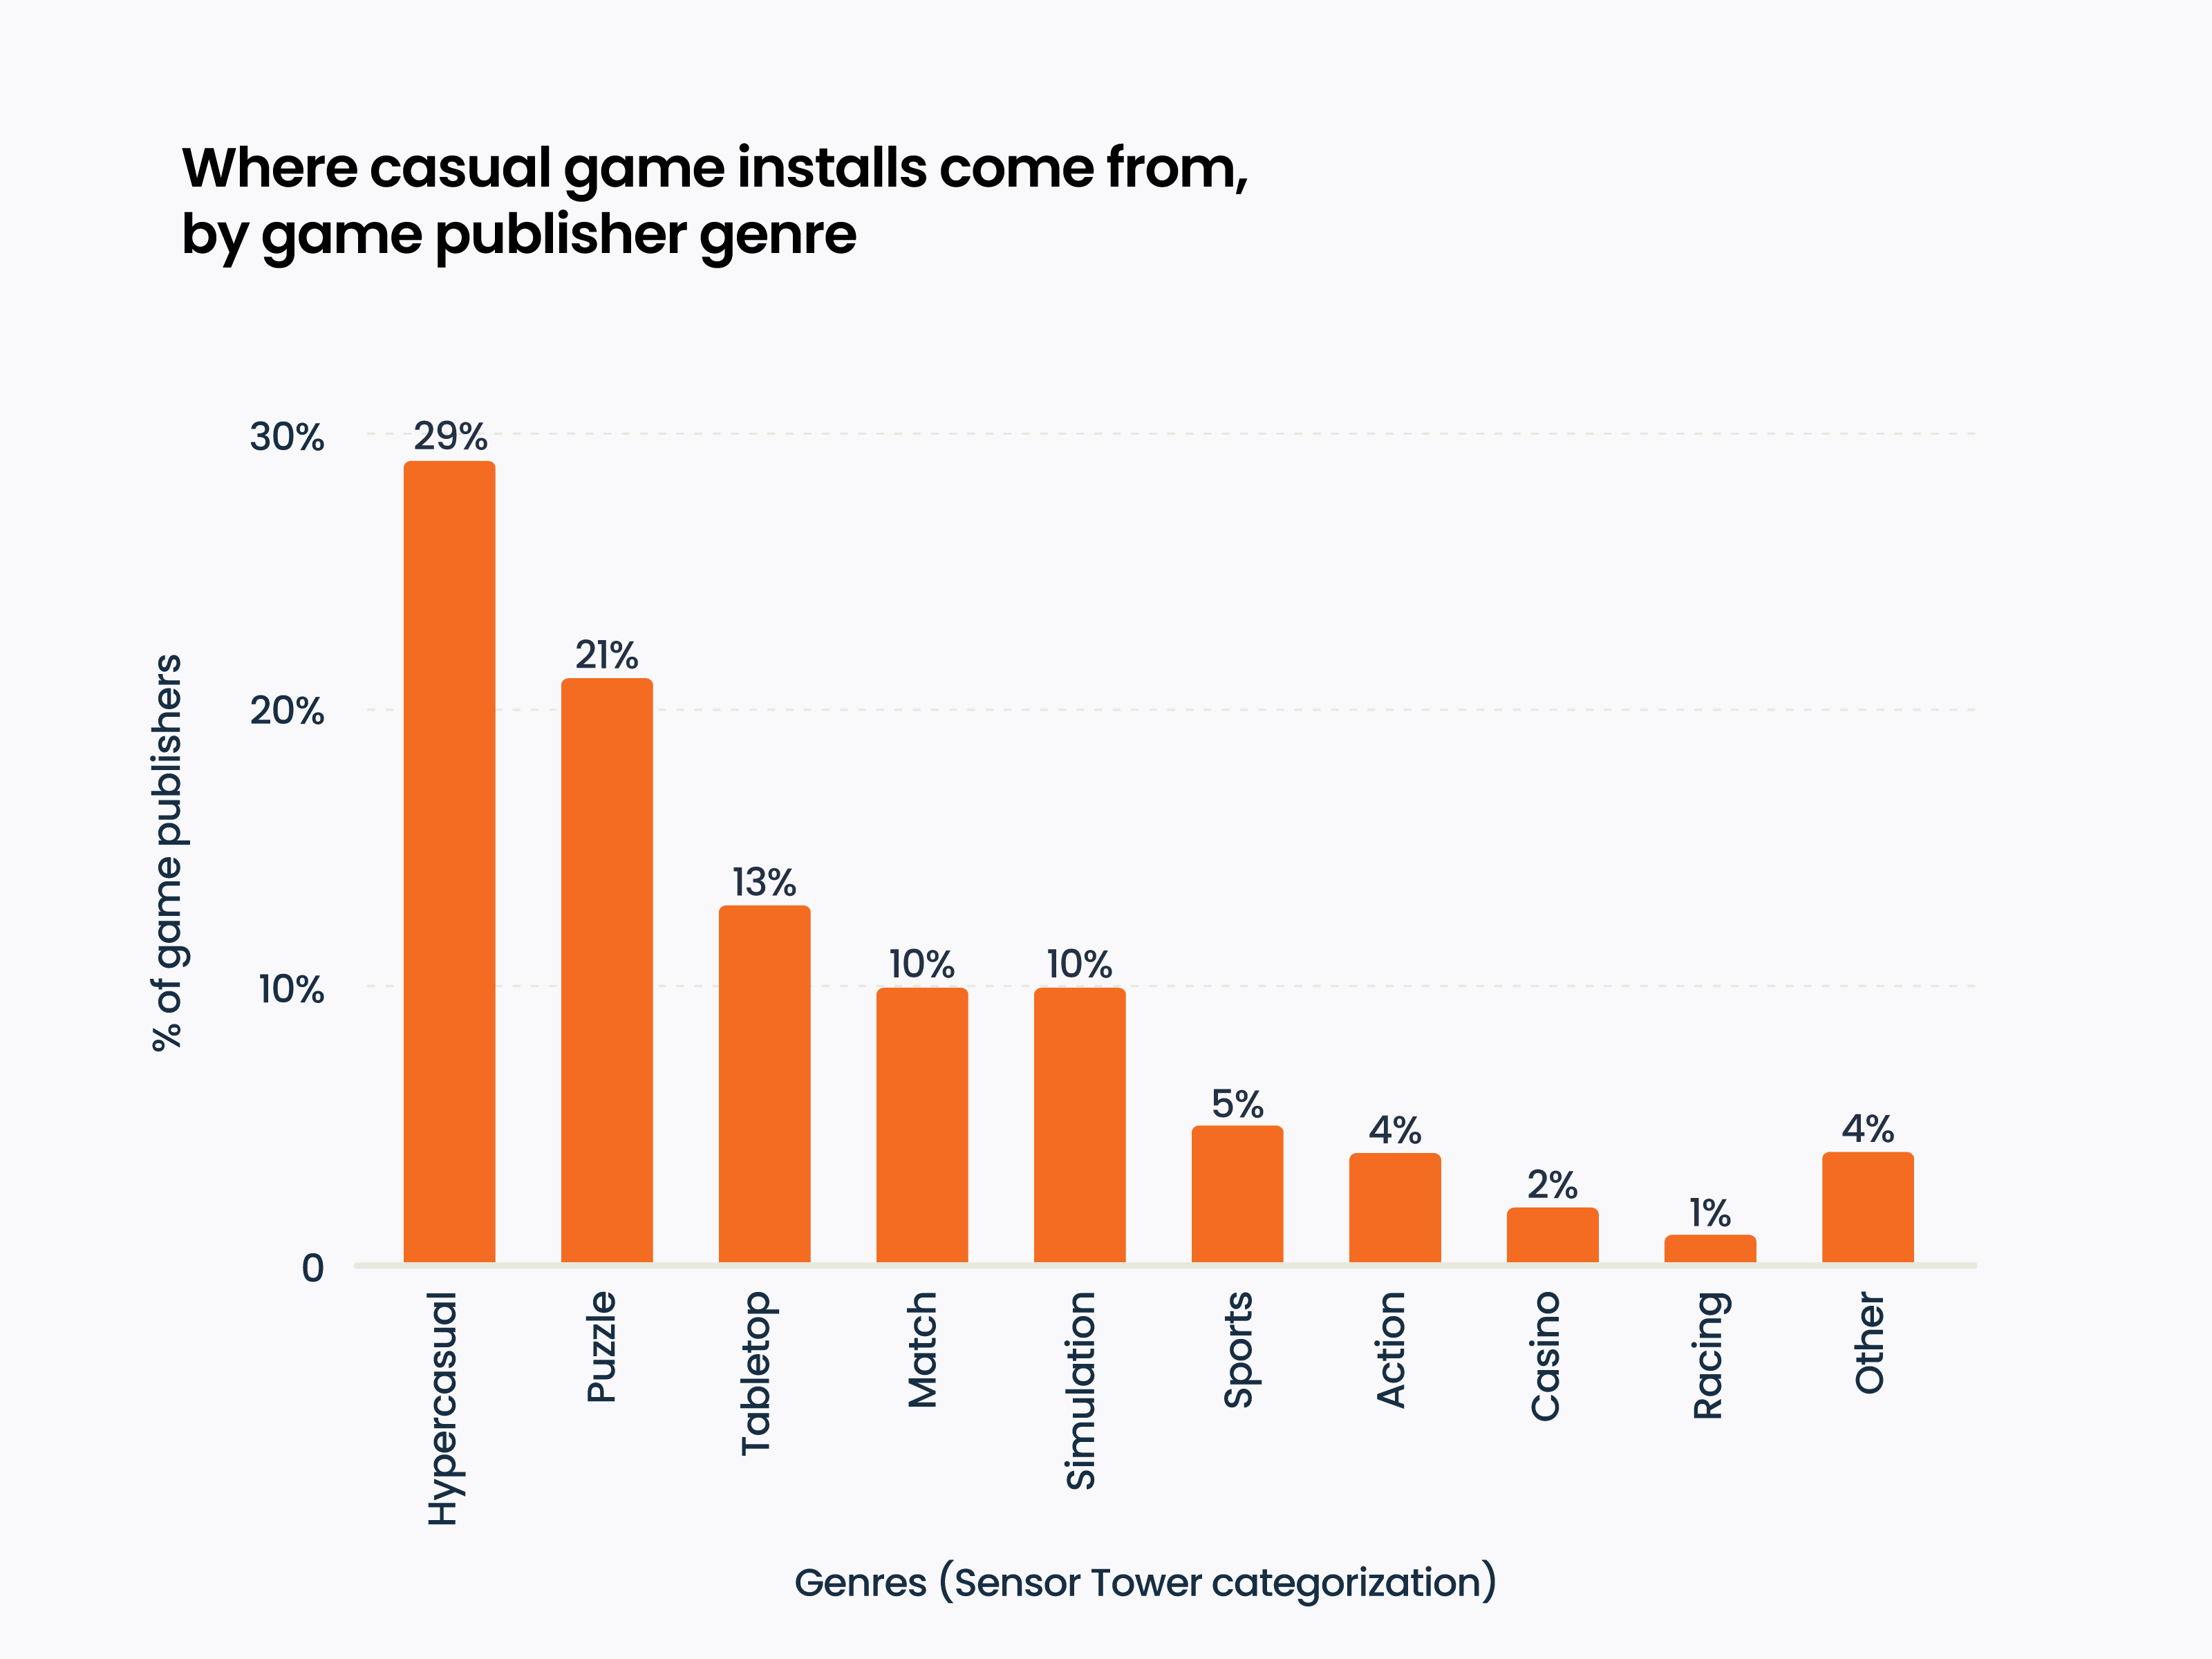
The top-3 genres for attracting users to casual games: hyper-casual projects (29%), other casual games (21%), and board games (13%).
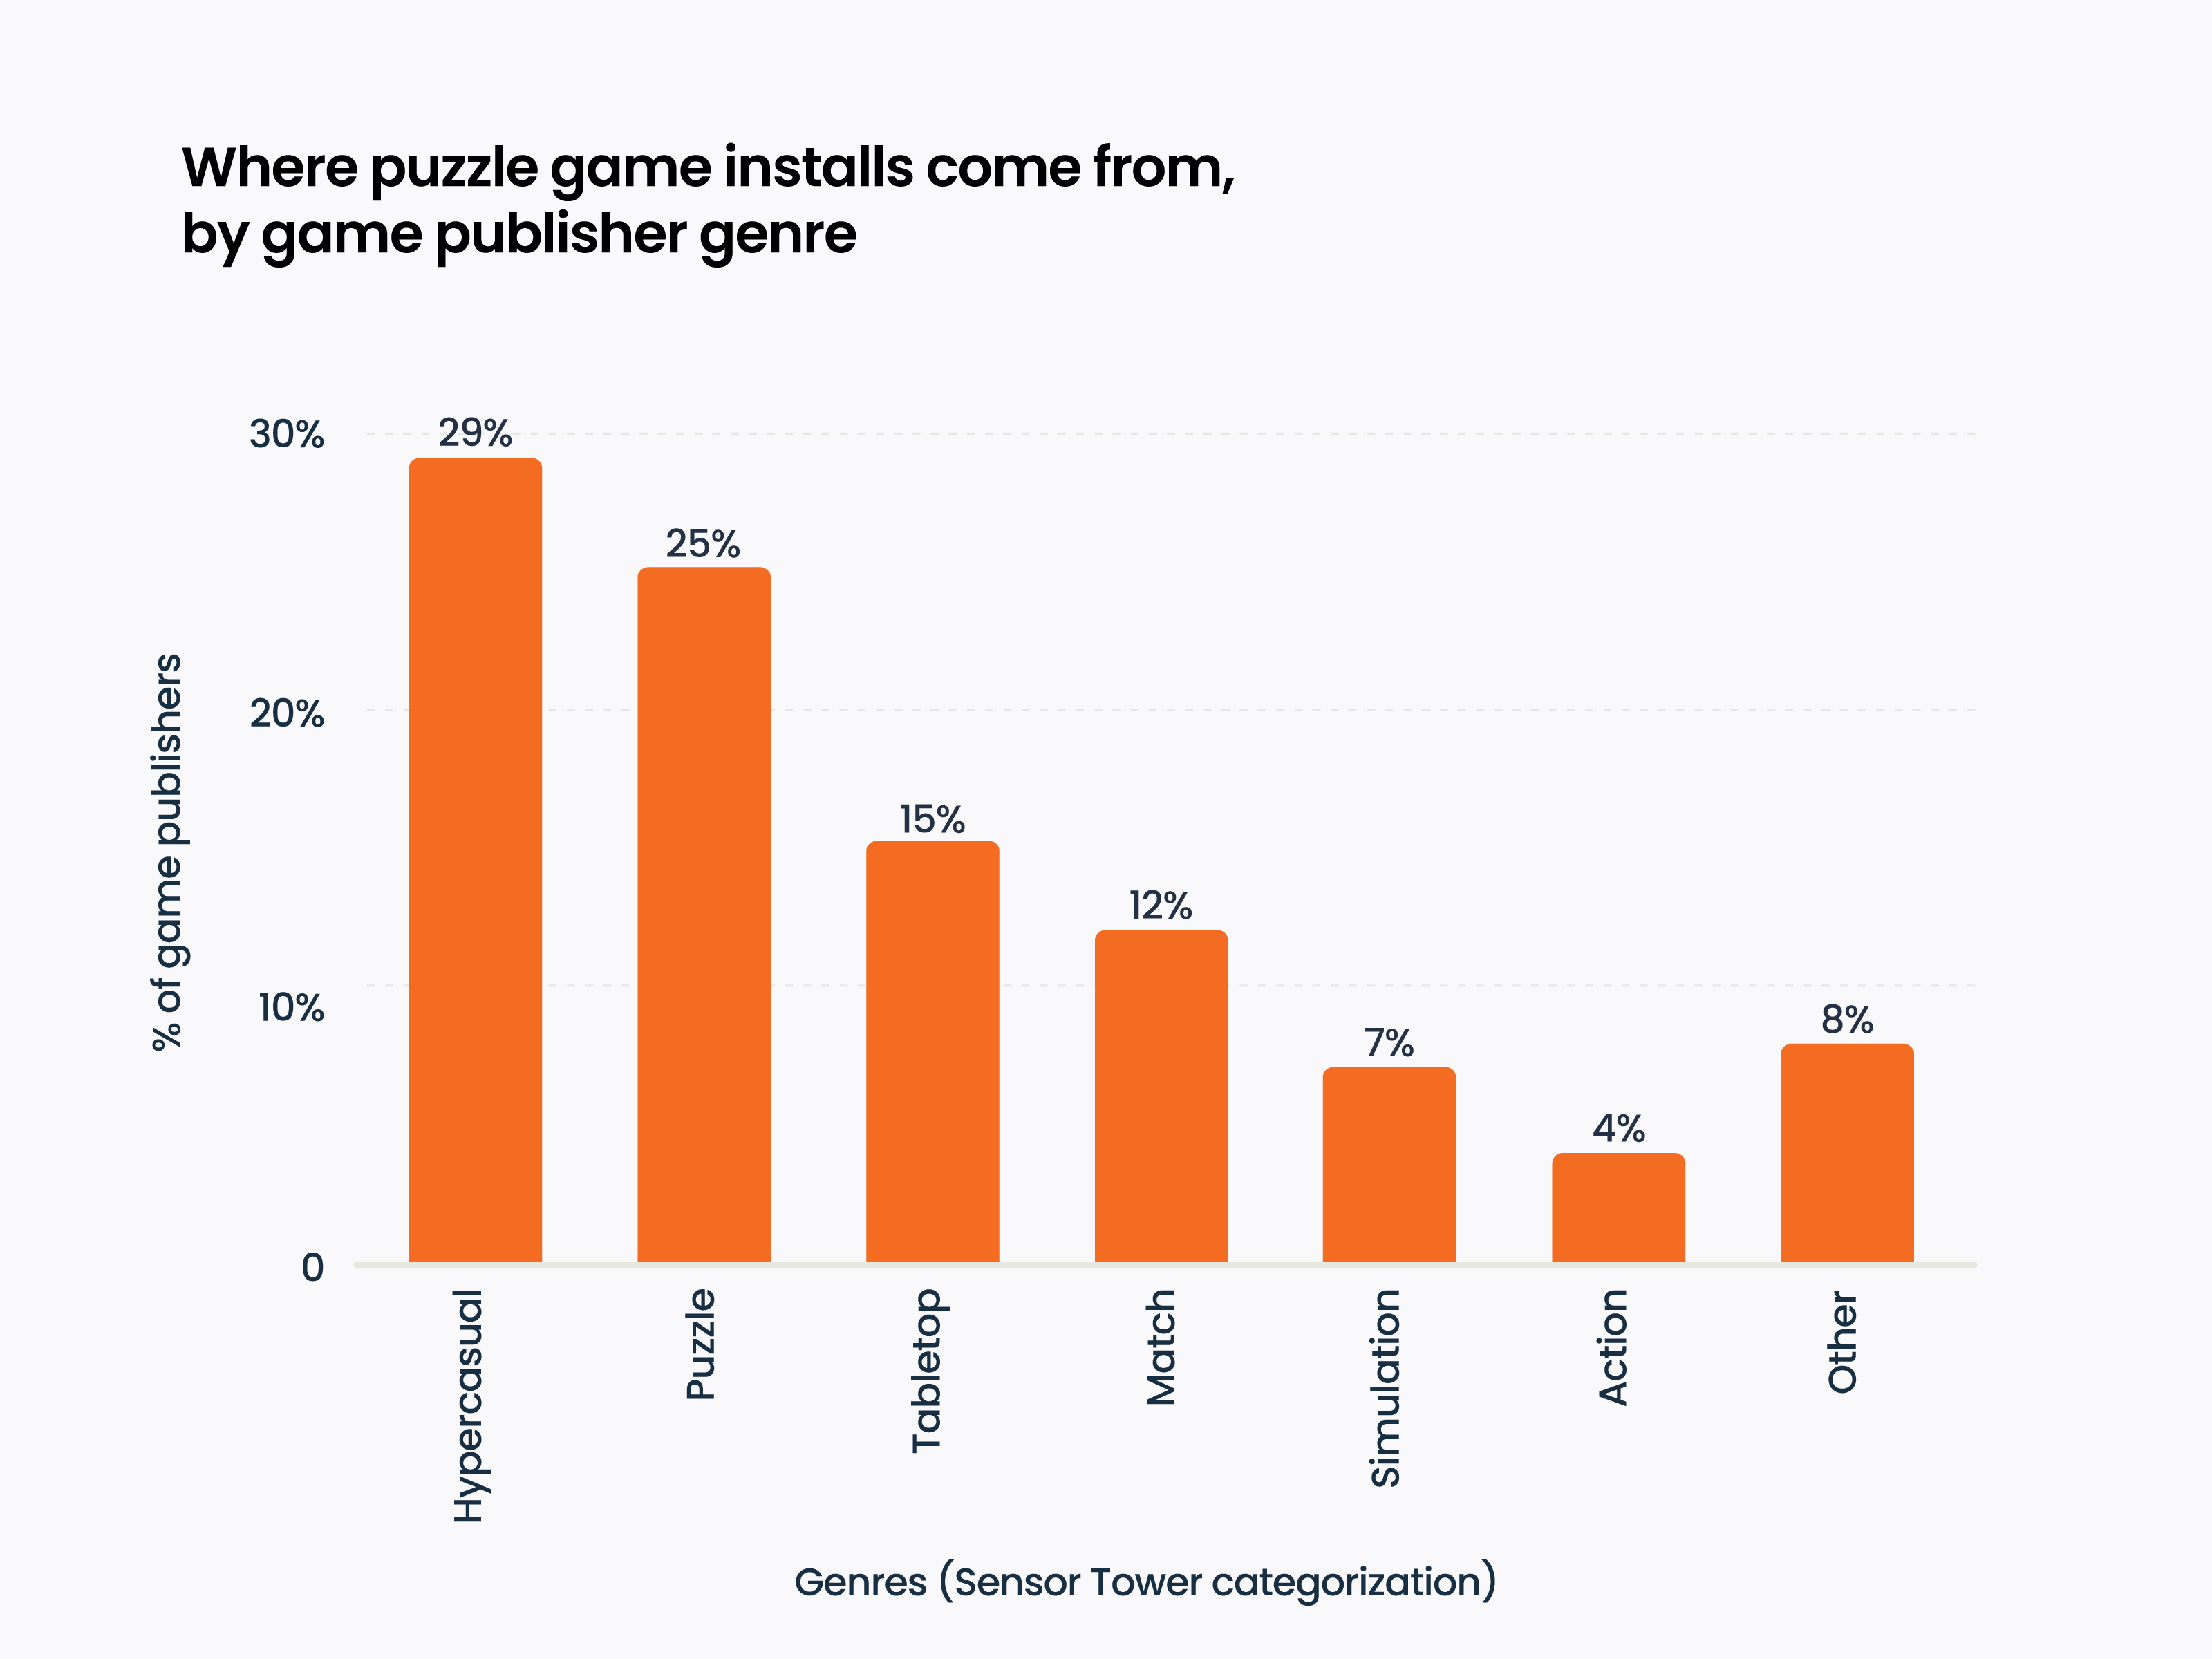
The situation is similar for puzzle games. 29% come from hyper-casual projects, 25% from other puzzles, and 15% from board games.
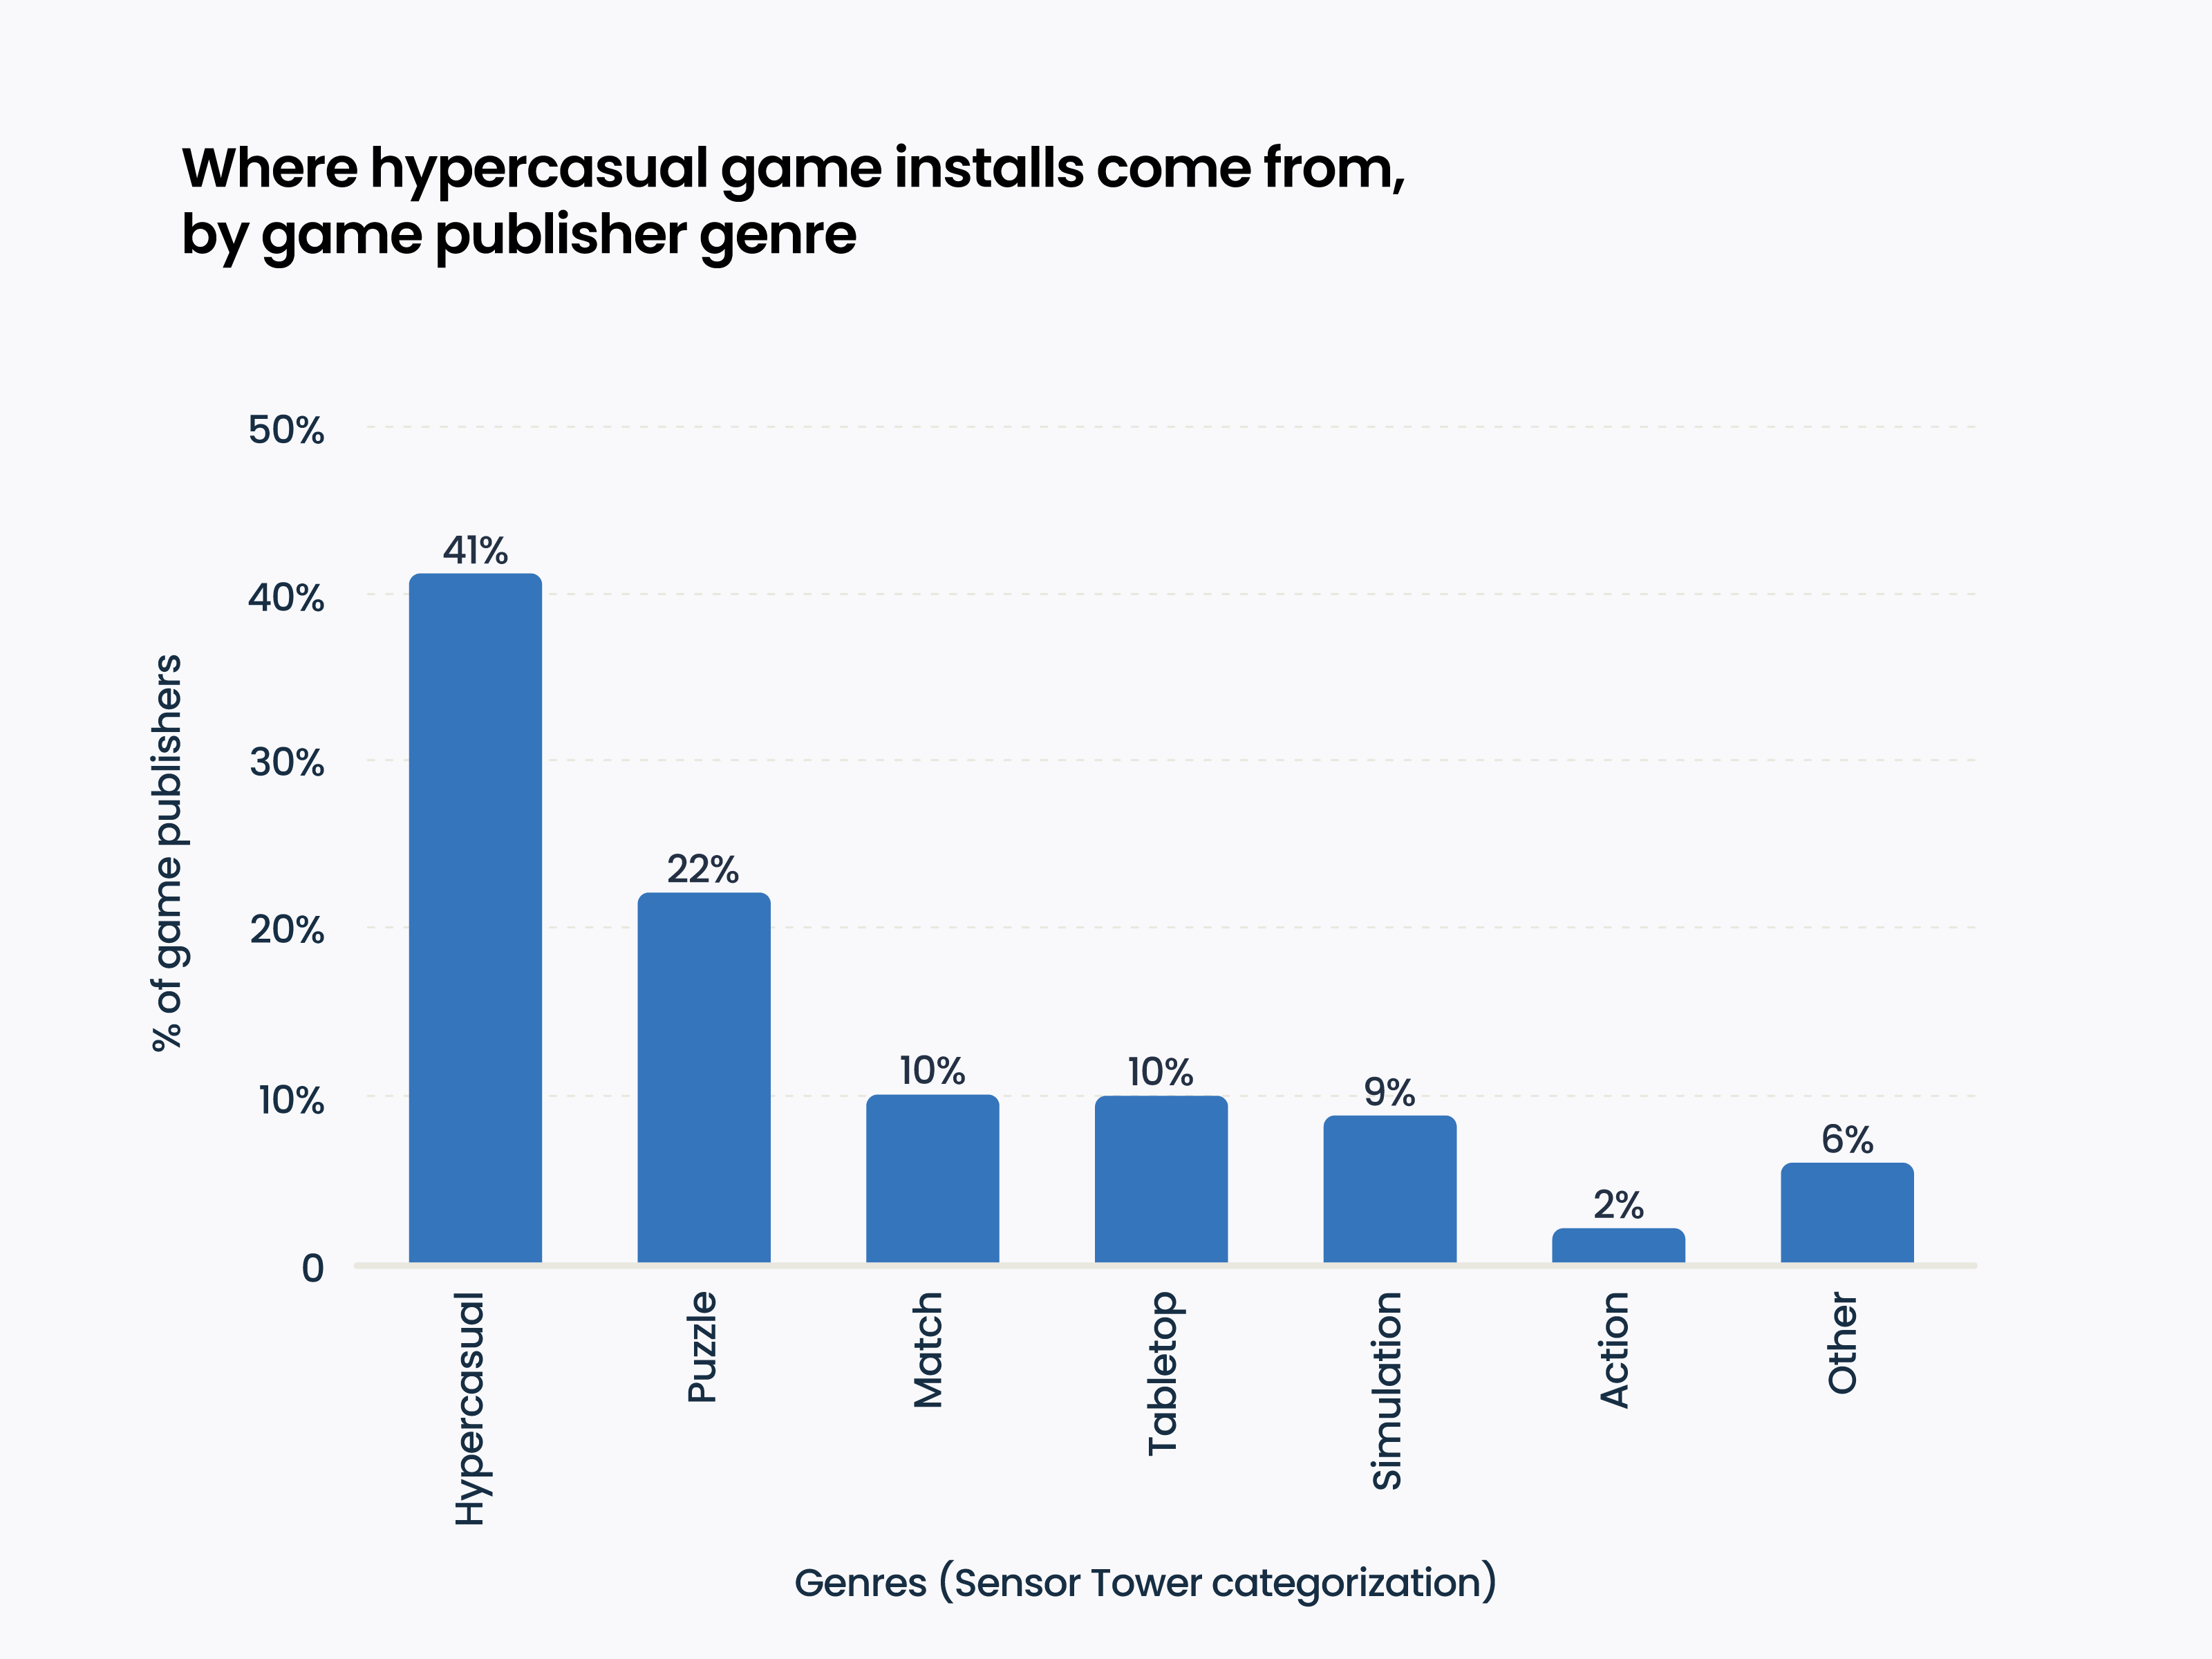
Main sources for hyper-casual projects: other hyper-casual games (41%) and puzzles (22%).
Finally, simulators get their audience from hyper-casual games (34%), other simulators (21%), and puzzles (17%).

❗️I remember when the hyper-casual market was just emerging, there were many theories that users from there would “grow up” and move on to more complex games. In part, you could say this prediction came true.
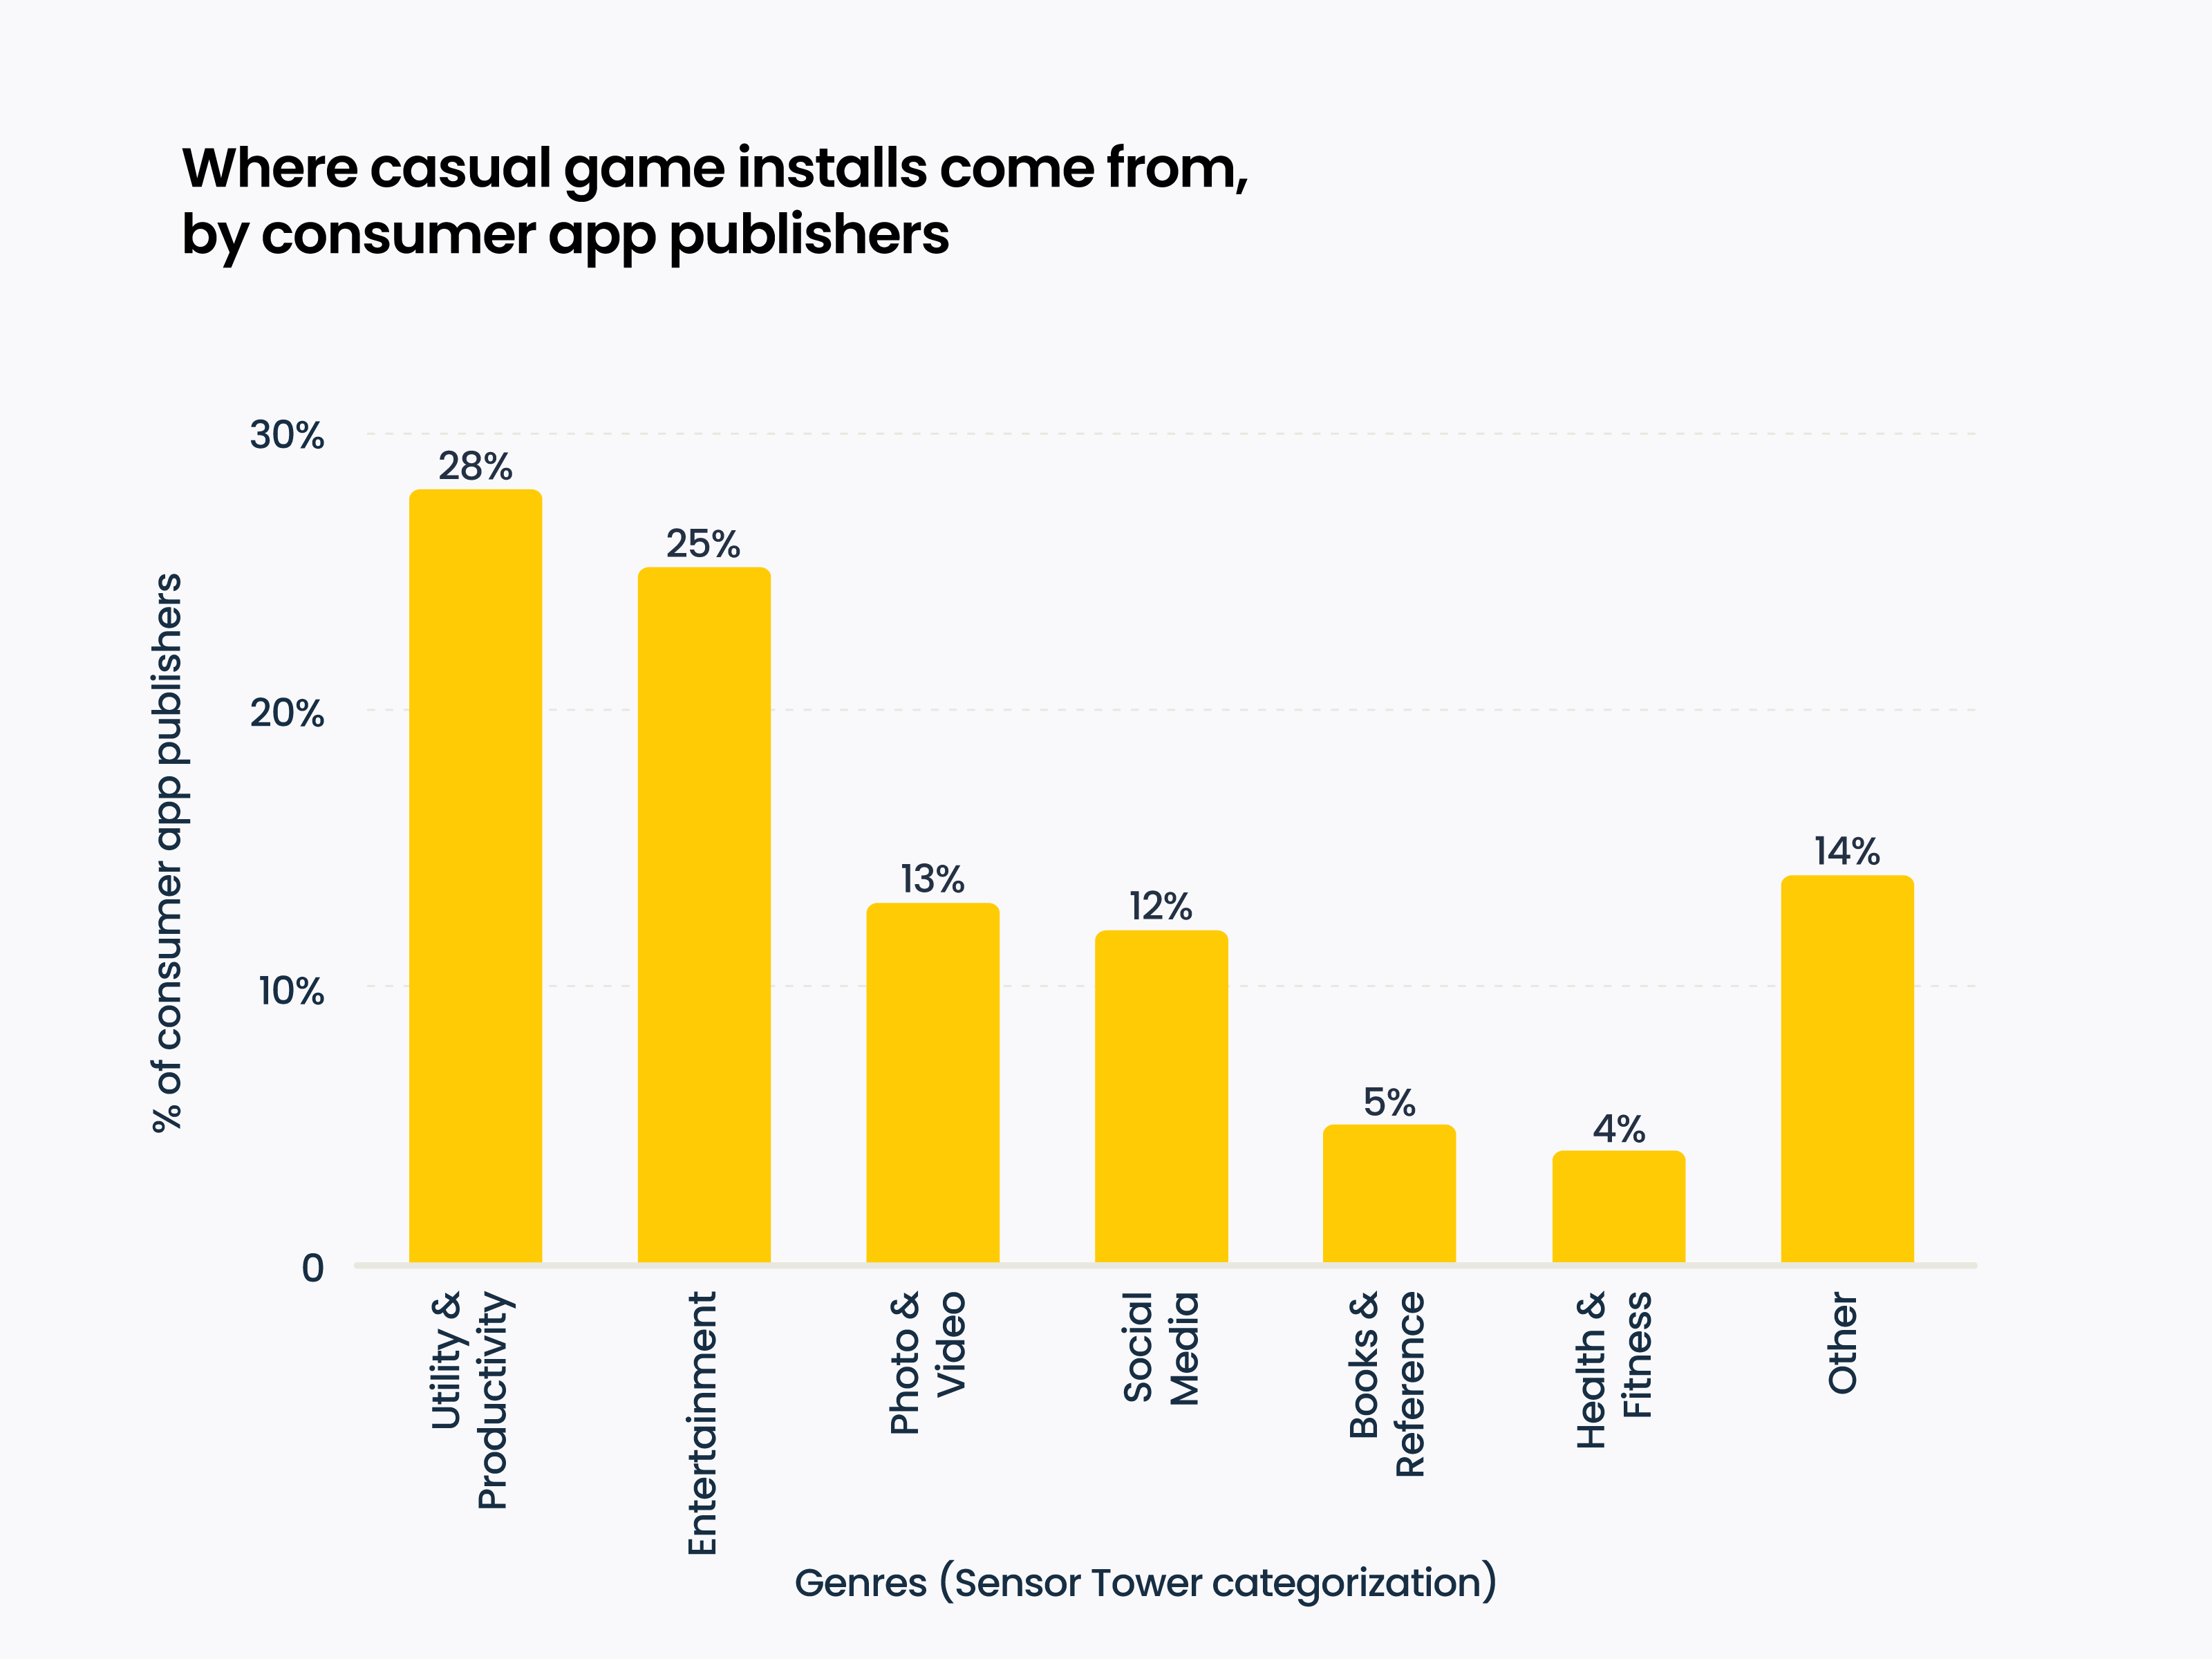
Liftoff specialists note that while attracting users from other games works, it’s not enough in today’s market. In the context of casual games, many developers place ads in non-gaming apps. Leading categories are utilities and productivity apps (28%) and other entertainment apps (25%).
Trends in Casual Games
Liftoff highlighted the top games on the US iOS market over the past year that consistently stayed in the top 200.

❗️Whether Capybara Go!, Archero 2, or Love and Deepspace can be classified as casual games is an open question.
Liftoff identifies the key trend in 2024 casual projects: combining midcore mechanics with hybrid core gameplay. For example, Love and Deepspace blends a classic interactive story with RPG elements; Capybara GO! from Habby combines roguelite, idle RPG, and casual casino mechanics.
Events in Top Casual Projects
Live-ops is everything. Liftoff provides a map of various live-ops activities in casual games.

GameRefinery (a Liftoff company) notes the growing popularity of collaboration events. The first was spotted in Monopoly GO!, then the idea was repeated in Royal Match, Truck Star, and other projects.


“Umbrella events” are also trending; those are events where the user participates in several small, parallel events. These have appeared in Royal Match, Match Factory, Gossip Harbor, Coin Master, and Dice Dreams.


Mini-games are trending as well. Over the past 12 months, GameRefinery has seen more casual projects adding new gameplay. Many companies adapt their UA for these events to attract new audiences.


GameRefinery also recommends looking at win-streak systems. Implementations can vary from “social win-streaks,” where users progress together, to more classic versions where a reward is given for a chain of wins.


Monetization innovations in Casual Games
Consider subscribing to the GameDev Reports Premium tier to support the newsletter. Get access to the list of curated articles & archive of Gaming Reports that I’ve been collecting since 2020.
Liftoff notes that audio ads are appearing more in games. A good example is Pocket Land.

More projects are offering ad removal for both hard and soft currencies. Implementation varies: from temporary removal (24–48 hours) to permanent removal for a one-time payment.

Customizable IAP bundles are gaining popularity, where the user can choose the contents of the purchase.


Bundles where users are offered to choose one of multiple bundle options also gained significant popularity in 2024. In Grand Solitaire Harvest, there was an interesting variation of such a bundle - before the final of the Super Bowl, the company presented an offer to “vote” for the team they thought would win. Additional rewards were given to those who picked the winning team.


Alinea Analytics: Clair Obscur: Expedition 33 is Selling Faster Than Major JRPG Franchises on Steam

The report was released on May 2 and only covers the game’s launch sales.
At the time of writing of an original article, sales of Clair Obscur: Expedition 33 have surpassed 1 million copies (now it’s 2 million). According to Alinea Analytics estimates, 785,000 copies were sold on Steam and more than 350,000 copies on PlayStation.
On Xbox, the game launched day one on Xbox Game Pass, so the exact number of copies sold isn’t calculated. In the first week, 1.3 million people played the game.
In the first 7 days after launch, Clair Obscur: Expedition 33 outsold other JRPGs on Steam, including those from major franchises.
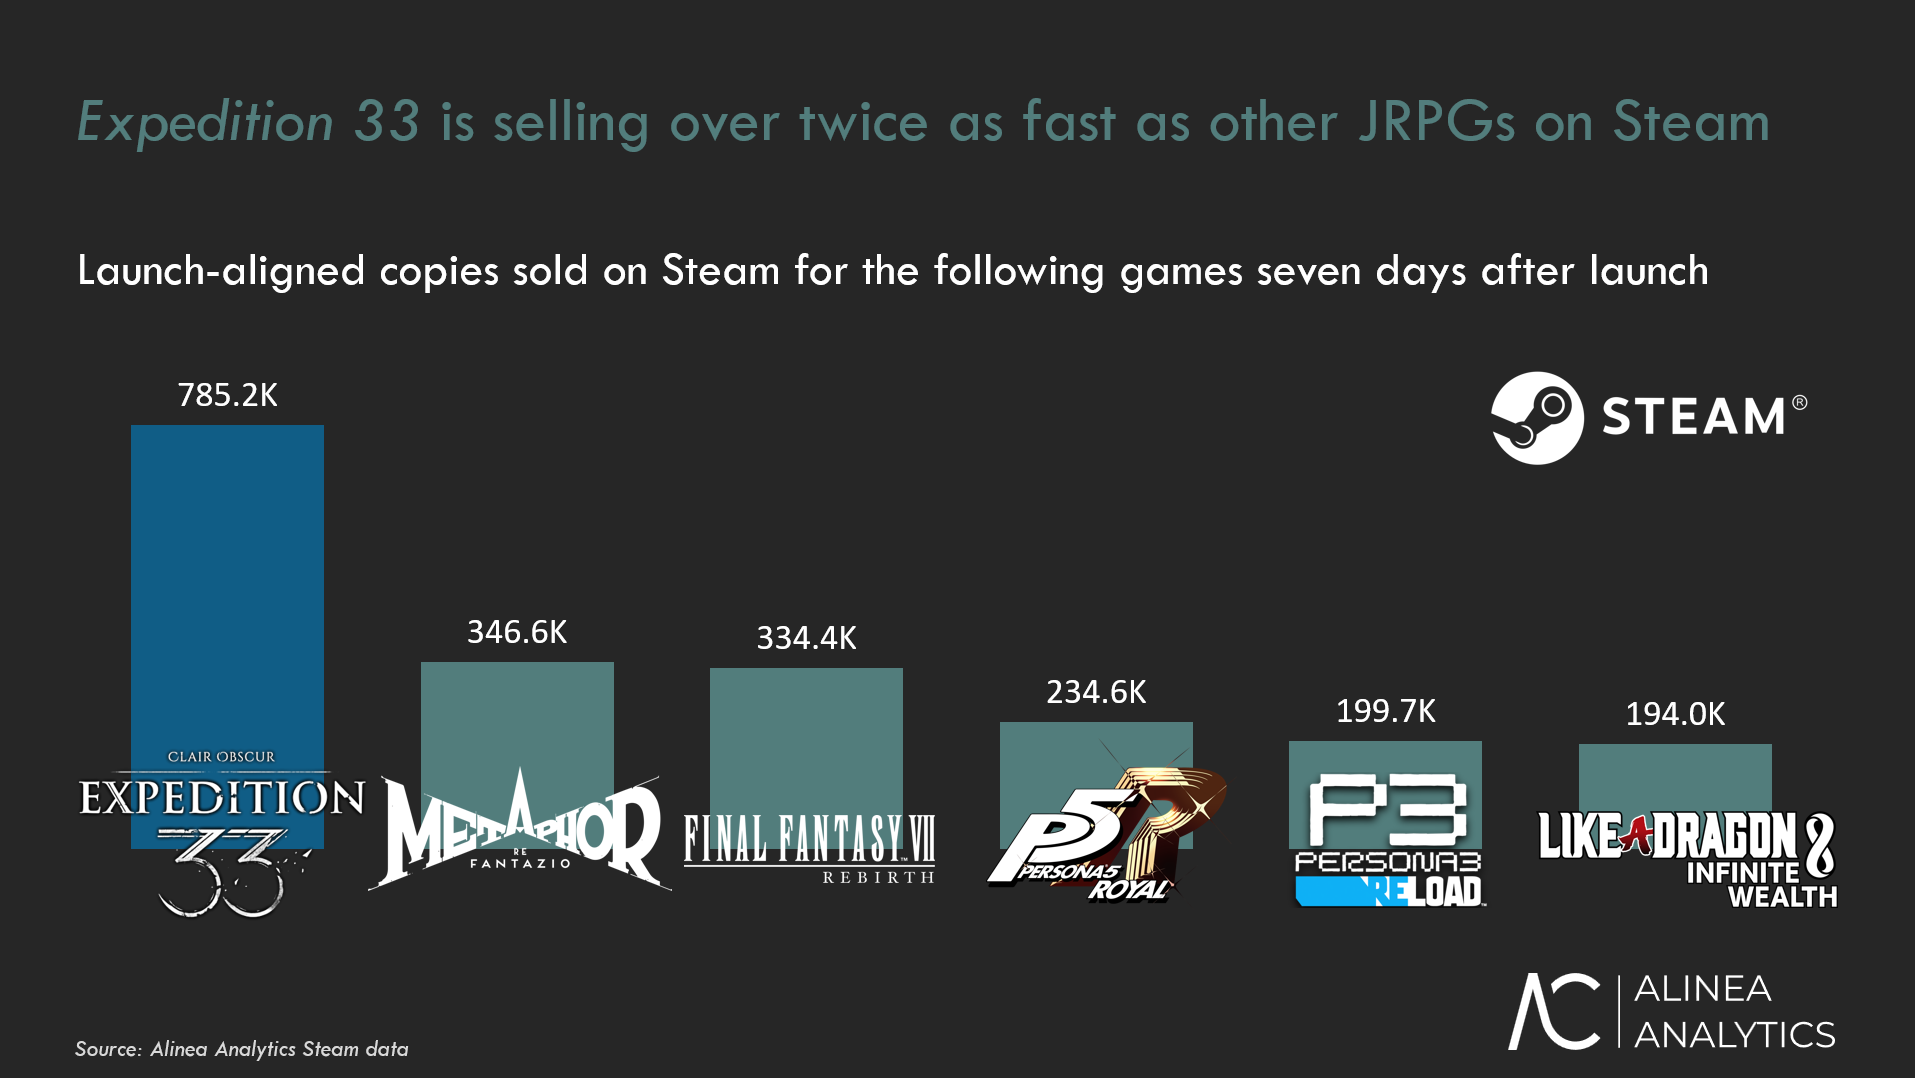
In its first week, the game sold 3.3 times better than Persona 5 Royal; 3.9 times better than Persona 3: Reload; 2.3 times better than Final Fantasy VII Rebirth; and 2.3 times better than Metaphor ReFantazio, which was the latest hit in the genre.
Roughly a third of all Steam purchases came from China, making it the project’s largest market.
Consider subscribing to the GameDev Reports Premium tier to support the newsletter. Get access to the list of curated articles & archive of Gaming Reports that I’ve been collecting since 2020.
On PlayStation, the situation is different. In the first 6 days of sales, Final Fantasy VII Rebirth leads by a wide margin (1.4 million copies). But Clair Obscur: Expedition 33 is in second place - selling 343,900 copies, ahead of Metaphor ReFantazio (301,300), Like a Dragon: Infinite Wealth (282,200), and Persona 3 Reload (227,100) in the same period.

Comparison with The Elder Scrolls IV: Oblivion Remaster Results
The Elder Scrolls IV: Oblivion Remaster launched a couple of days before Clair Obscur: Expedition 33.
On Steam, Oblivion Remaster sold 1.4 million copies in its first week, compared to 708,200 for Clair Obscur: Expedition 33. On PlayStation, Oblivion Remaster sold 590,000 copies versus 343,900 for Expedition 33. On Game Pass, Oblivion Remaster was played by 3.2 million people, nearly three times more than Clair Obscur: Expedition 33.
However, on day 7, Clair Obscur: Expedition 33 sold 77,000 copies on Steam - twice as many as The Elder Scrolls IV: Oblivion Remaster.
In terms of audience overlap, the highest crossover was among Xbox players (understandable, as both games are available on Game Pass). On PlayStation, the overlap is 11.4%, and on PC, 6.5%.
❗️Alinea Analytics believes these products are in direct competition. Users had to choose what to buy.