Weekly Gaming Reports Recap: May 6 - May 10 (2024)
Some Steam insights from GameDiscoverCo; LurkIt & Stream Hatchet shared the streaming industry insights; top-20 PC/Console titles in March by Newzoo.

Reports of the week:
Newzoo: Top 20 PC/Console games in March 2024 by Revenue and MAU
Lurkit: State of the Streaming market in Q1’24
Liftoff: CPI and D7 ROAS benchmarks in Mobile Games
Stream Hatchet: Streaming Market Trends in Q1’24
GameDiscoverCo: Data Consumption in Steam by Country in 2024
Newzoo: Outlast Trials became the top-grossing B2P adventure game of March
GameDiscoverCo: Conversion benchmarks of Steam wishlists into sales in the first month
Newzoo: Top 20 PC/Console games in March 2024 by Revenue and MAU

Newzoo accounts for data in the USA, UK, Spain, Italy, Germany, and France.
Revenue - all platforms
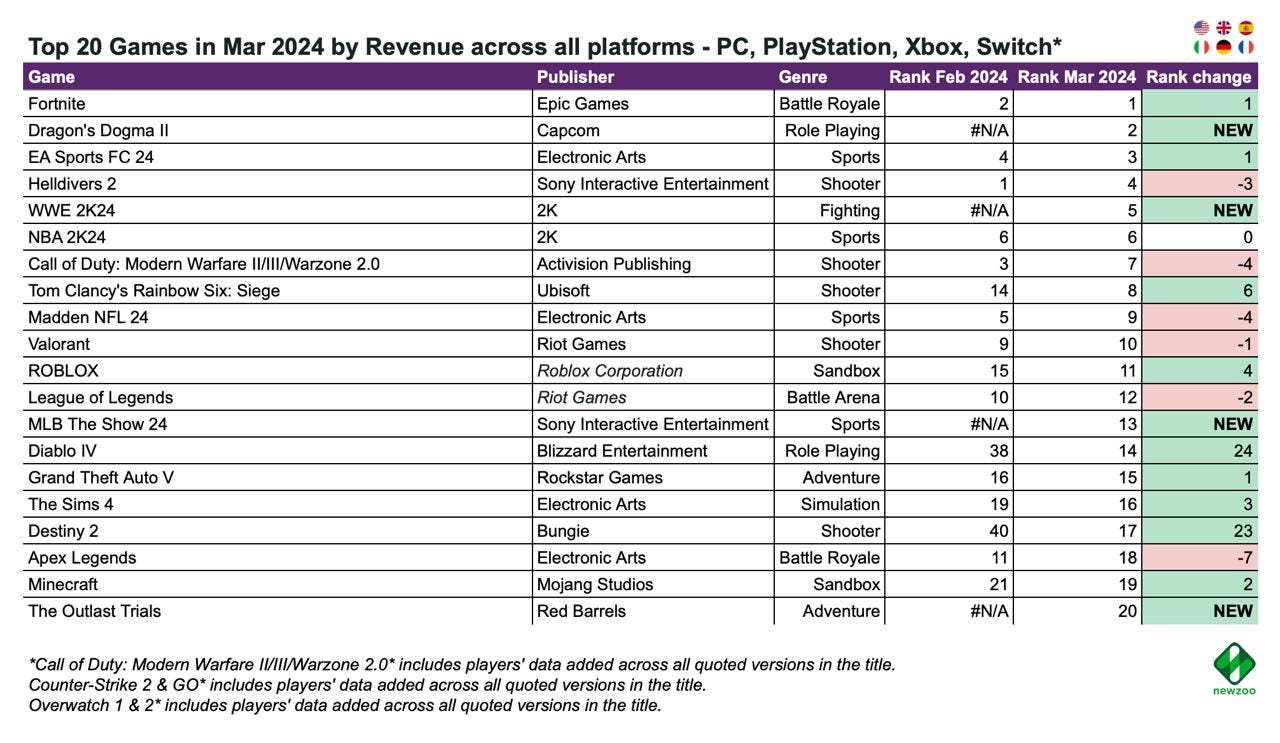
Dragon’s Dogma II became the second highest-grossing game in March, managing to surpass even EA Sports FC 24 and Helldivers II.
Among other new releases in terms of revenue for the month were WWE 2K24 (5th place); MLB The Show 24 (13th place); and The Outlast Trials (20th position).
Diablo IV and Destiny 2 significantly increased their revenue rankings (presumably due to a 50% discount at the end of March for Diablo IV and the Guardian Games event for Destiny 2).
Revenue - by platforms


The most active chart in terms of new releases was on PlayStation - 5 new games: Dragon’s Dogma II; WWE 2K24; MLB The Show 24; Rise of the Ronin; and The Outlast Trials.
Princess Peach: Showtime! on Nintendo Switch performed well, debuting at the second position in revenue, second only to Fortnite.
MAU - all platforms
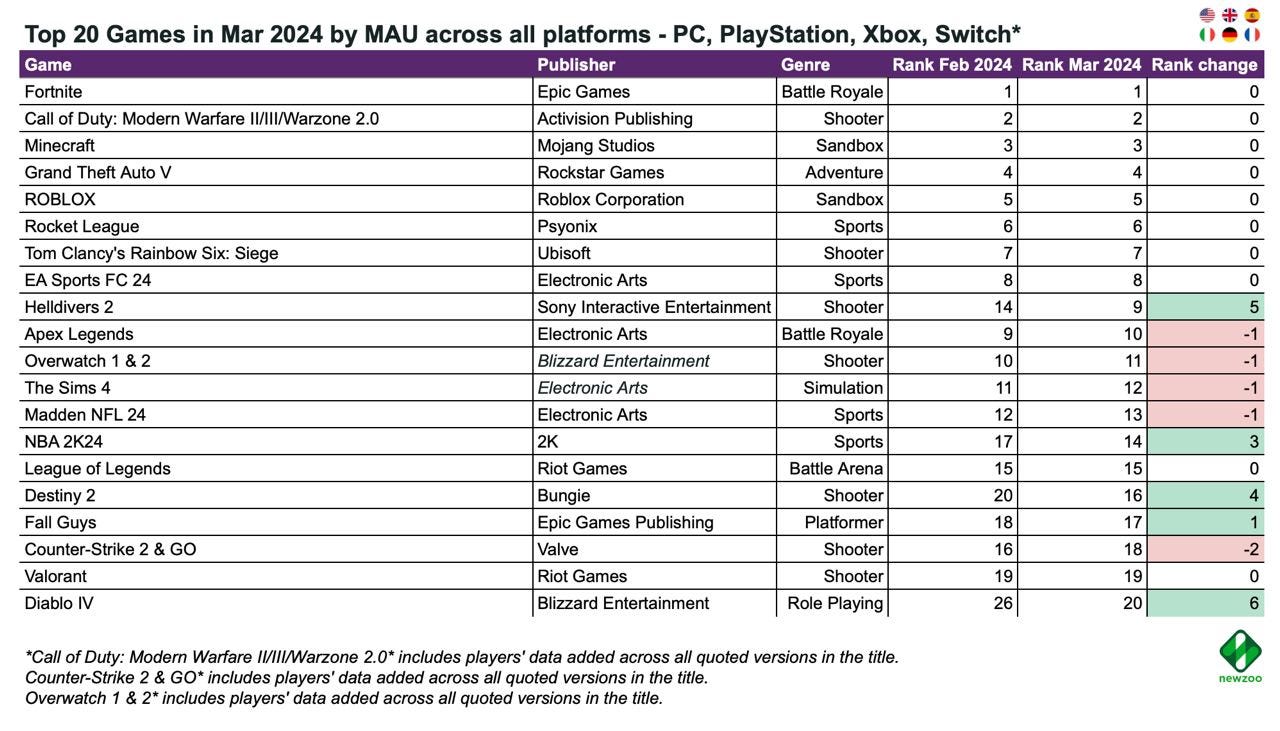
The MAU situation in the monitored markets remains stable. Fortnite; Call of Duty; Minecraft; Grand Theft Auto V; Roblox; Rocket League; Tom Clancy’s Rainbow Six: Siege; and EA Sports FC 24 are the leaders.
In March, Helldivers II continued its active growth in MAU.
MAU - by platforms


F1 23 and Sifu entered the top 20 MAU chart on PlayStation. Thanks to the PS Plus.
Palworld fails to retain its audience. The game dropped out of the top 20 in MAU on PC, and on Xbox, it fell from 7th place to 18th.
Lurkit: State of the Streaming market in Q1’24

The company analyzed the top 500 games on Twitch by the hours watched.
Key findings
In Q1’24, 52,108 games appeared on Twitch. The top 500 accounted for 69.8% of all viewing hours.
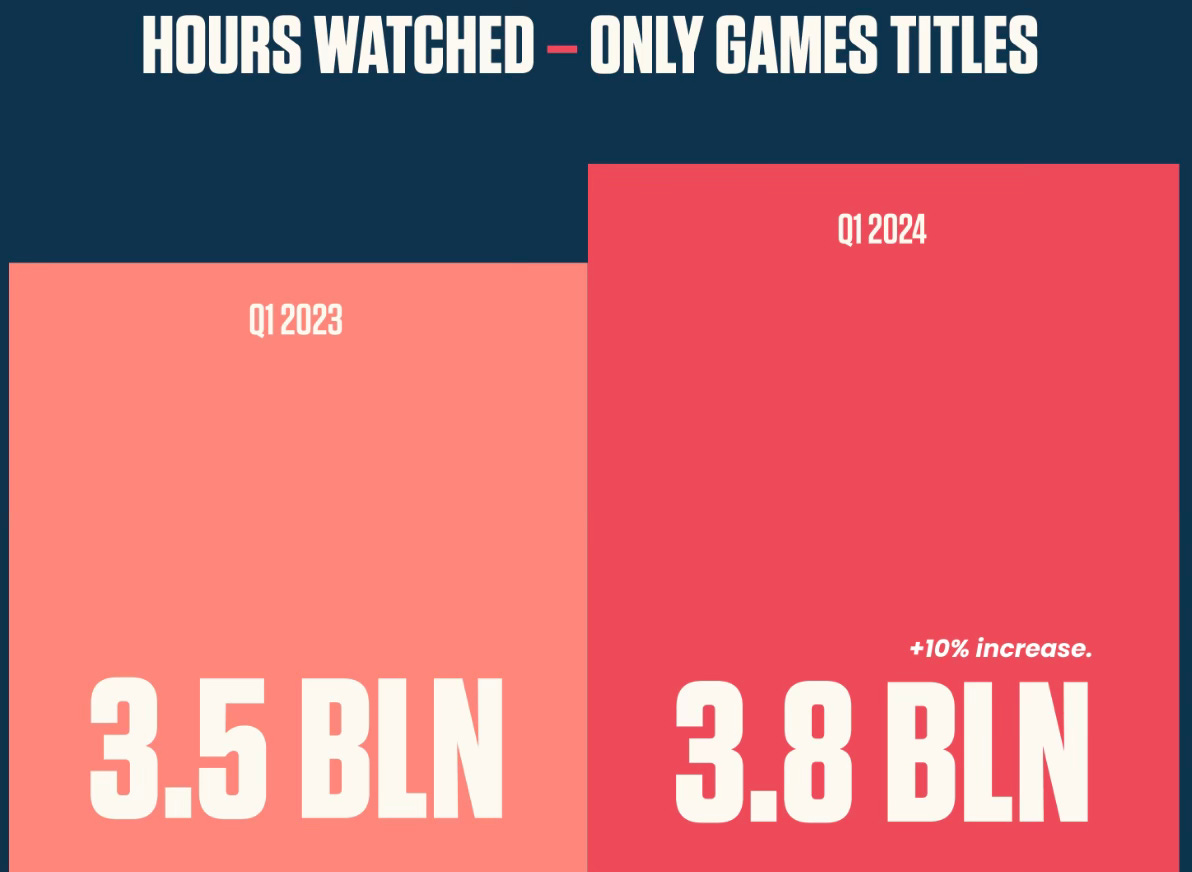
The number of hours users spent watching games from the top 500 reached 3.8 billion hours. This is 10% more than in Q1’23.
67.2% of hours watched are accounted for by games from the top 20. 88.3% - for games from the top 100.

Grand Theft Auto V (479 million hours) is the most viewed game in the first quarter.
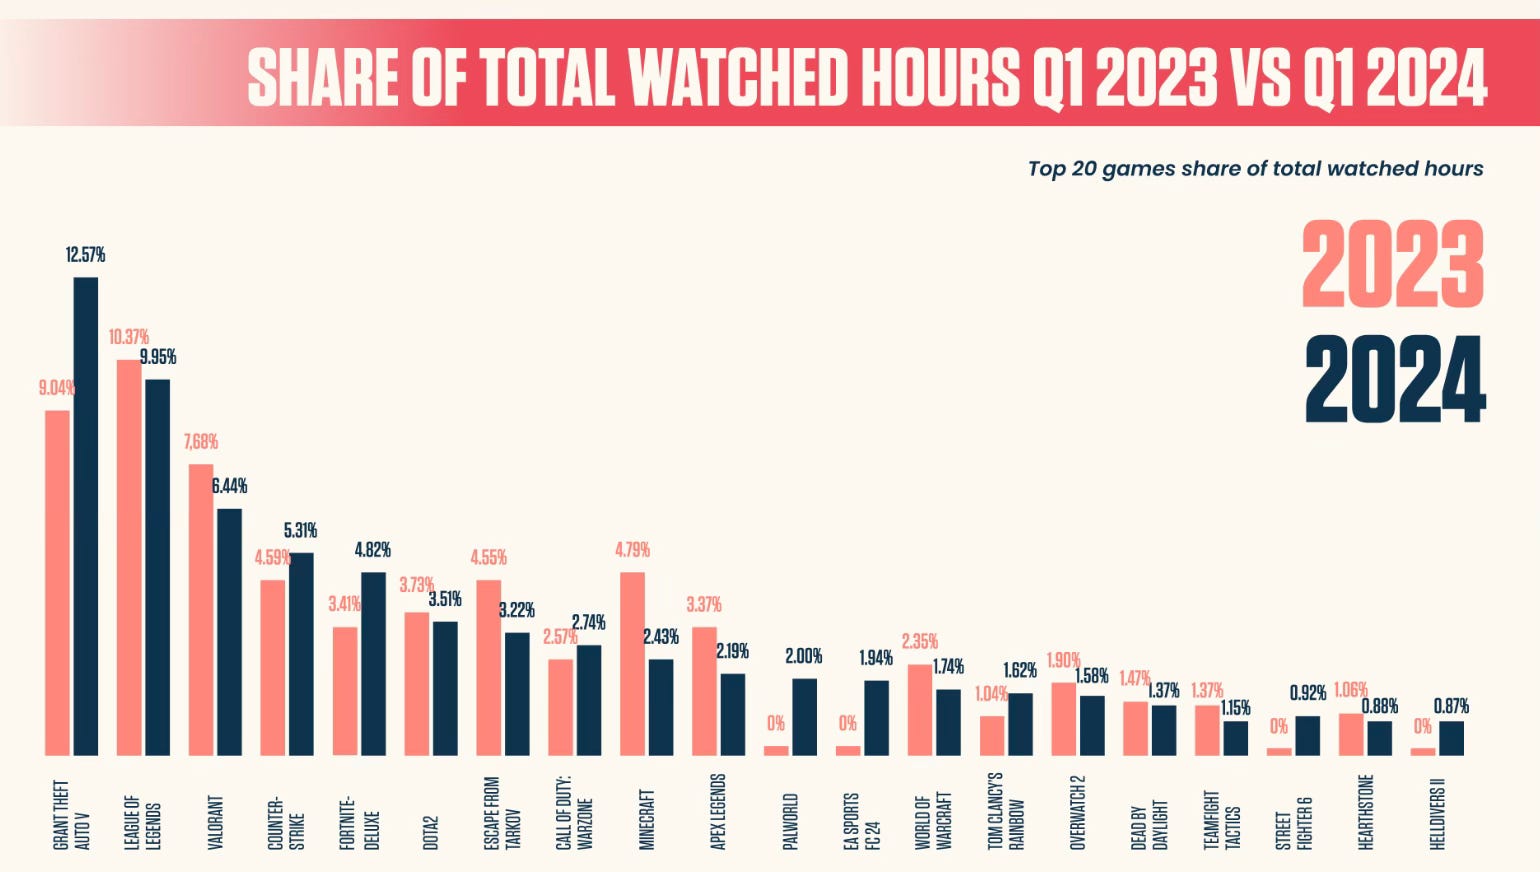
Fortnite is the top game in terms of streaming hours. It accounts for 8.12% of all streaming hours among the top 500 games.
GameDev Reports Newsletter offers promotion opportunities to gaming companies. Reach out to learn more.

The top 10 most successful developers' games account for 59% of all hours watched. This is less than 63% in Q1’23. Riot Games is the most successful developer in terms of watched hours (671 million hours across all games).
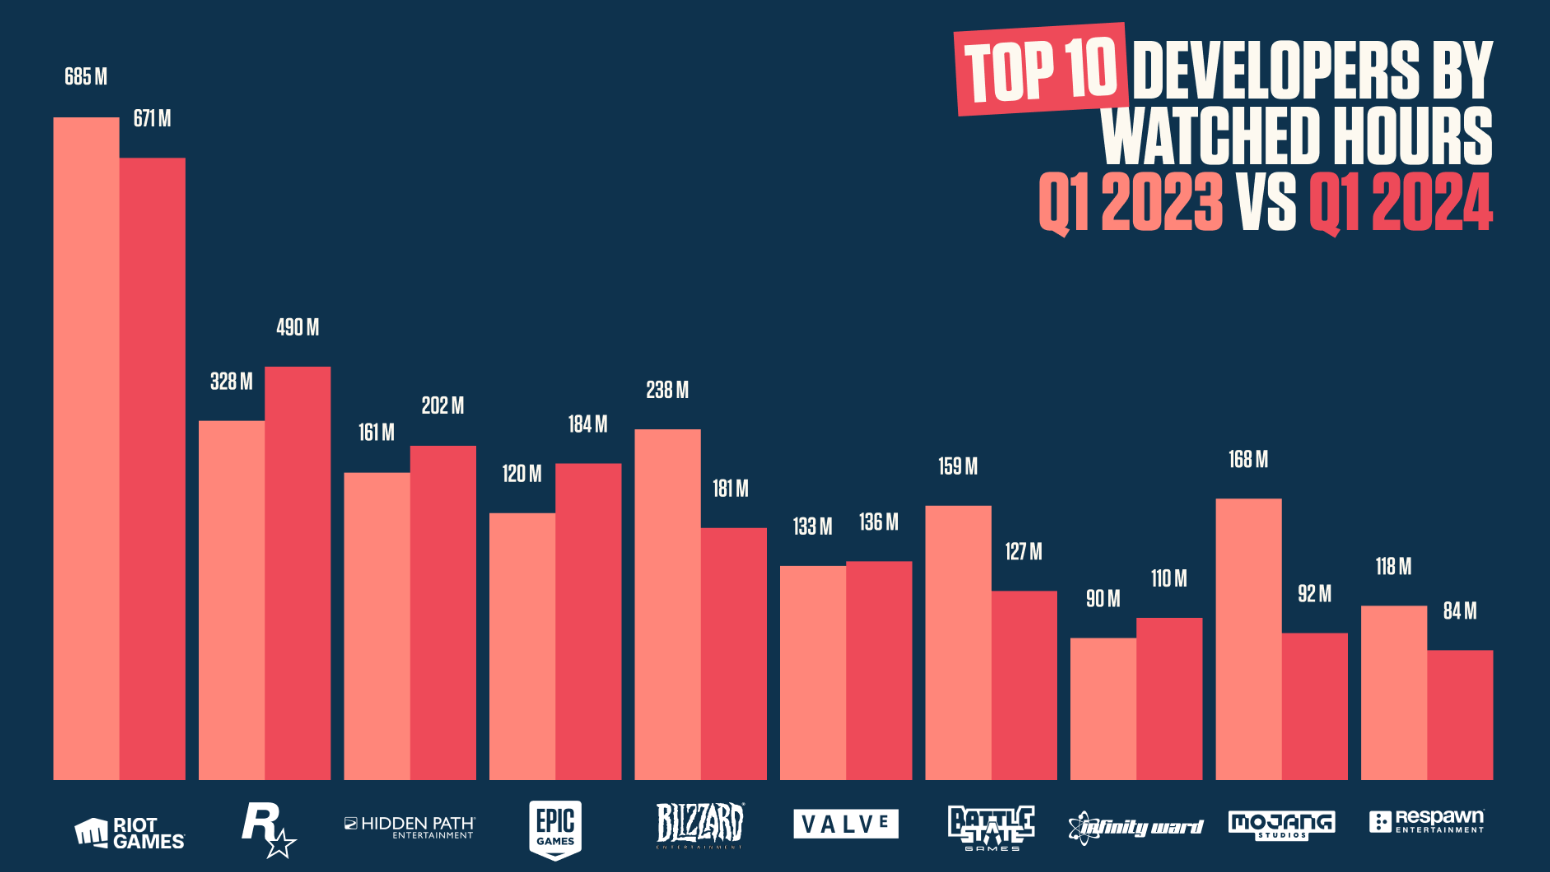
❗️Lurkit included Hidden Path Entertainment in the list of most successful developers. In reality, it is a studio that helped Valve create CS:GO, so when data is exported for CS2, it is listed among the creators.
25 games released in the first quarter of 2024 made it into the top 500 for Q1’24 in terms of hours watched.
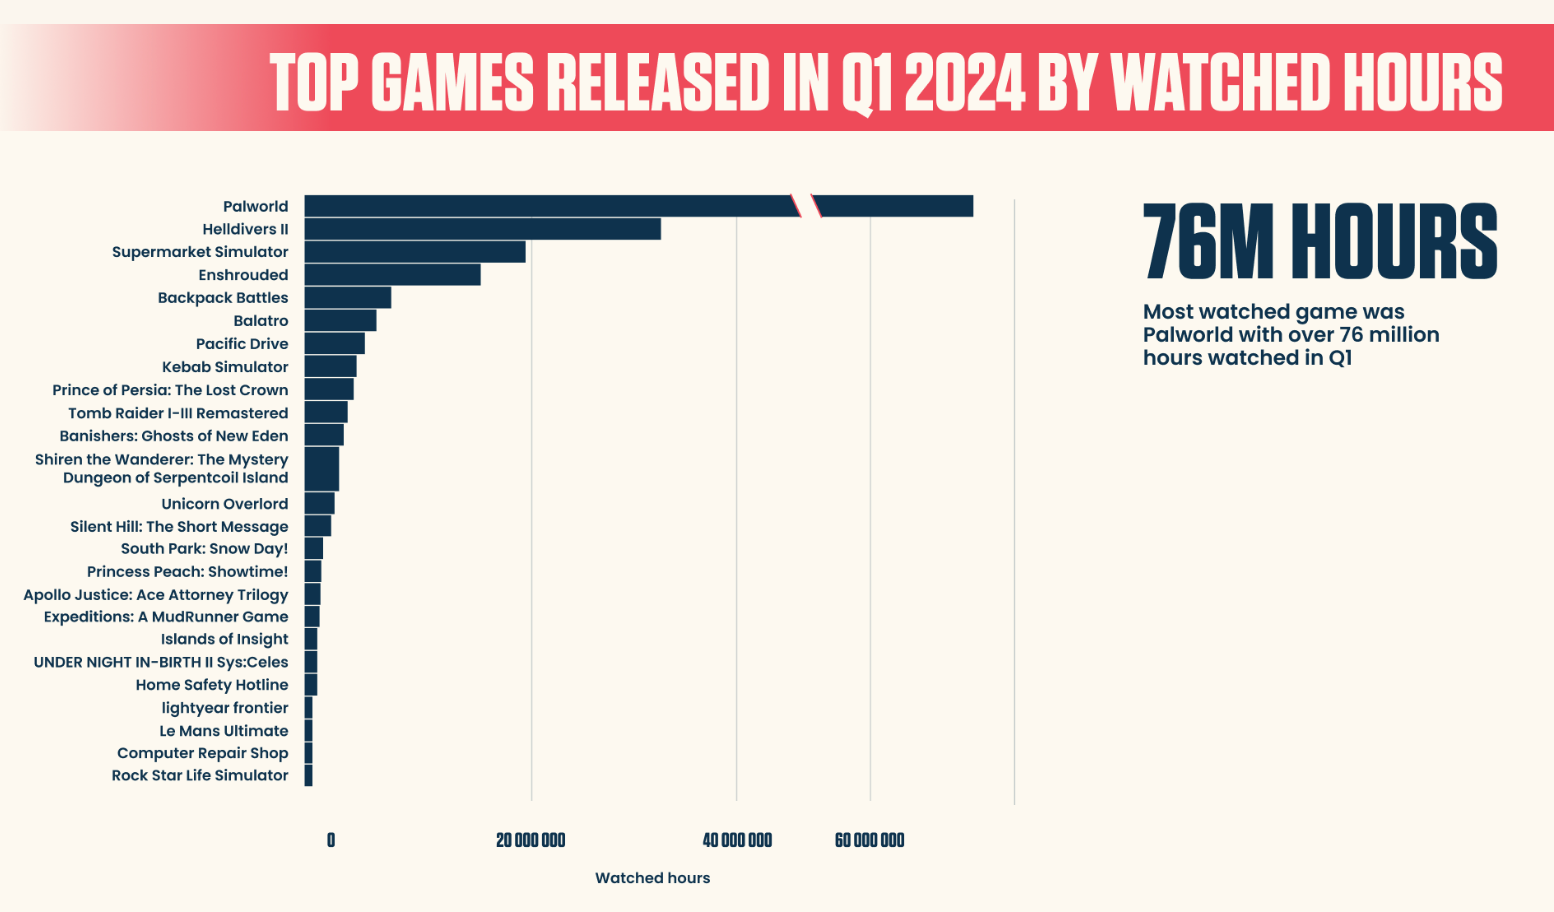
Palworld is the most successful new game of the quarter, with 76 million hours watched. This is 128% more than Helldivers II.

Liftoff: CPI and D7 ROAS benchmarks in Mobile Games

The report is based on research results from January 1, 2023, to January 1, 2024. 602 billion impressions were analyzed; 49.4 billion clicks; 144 million downloads.
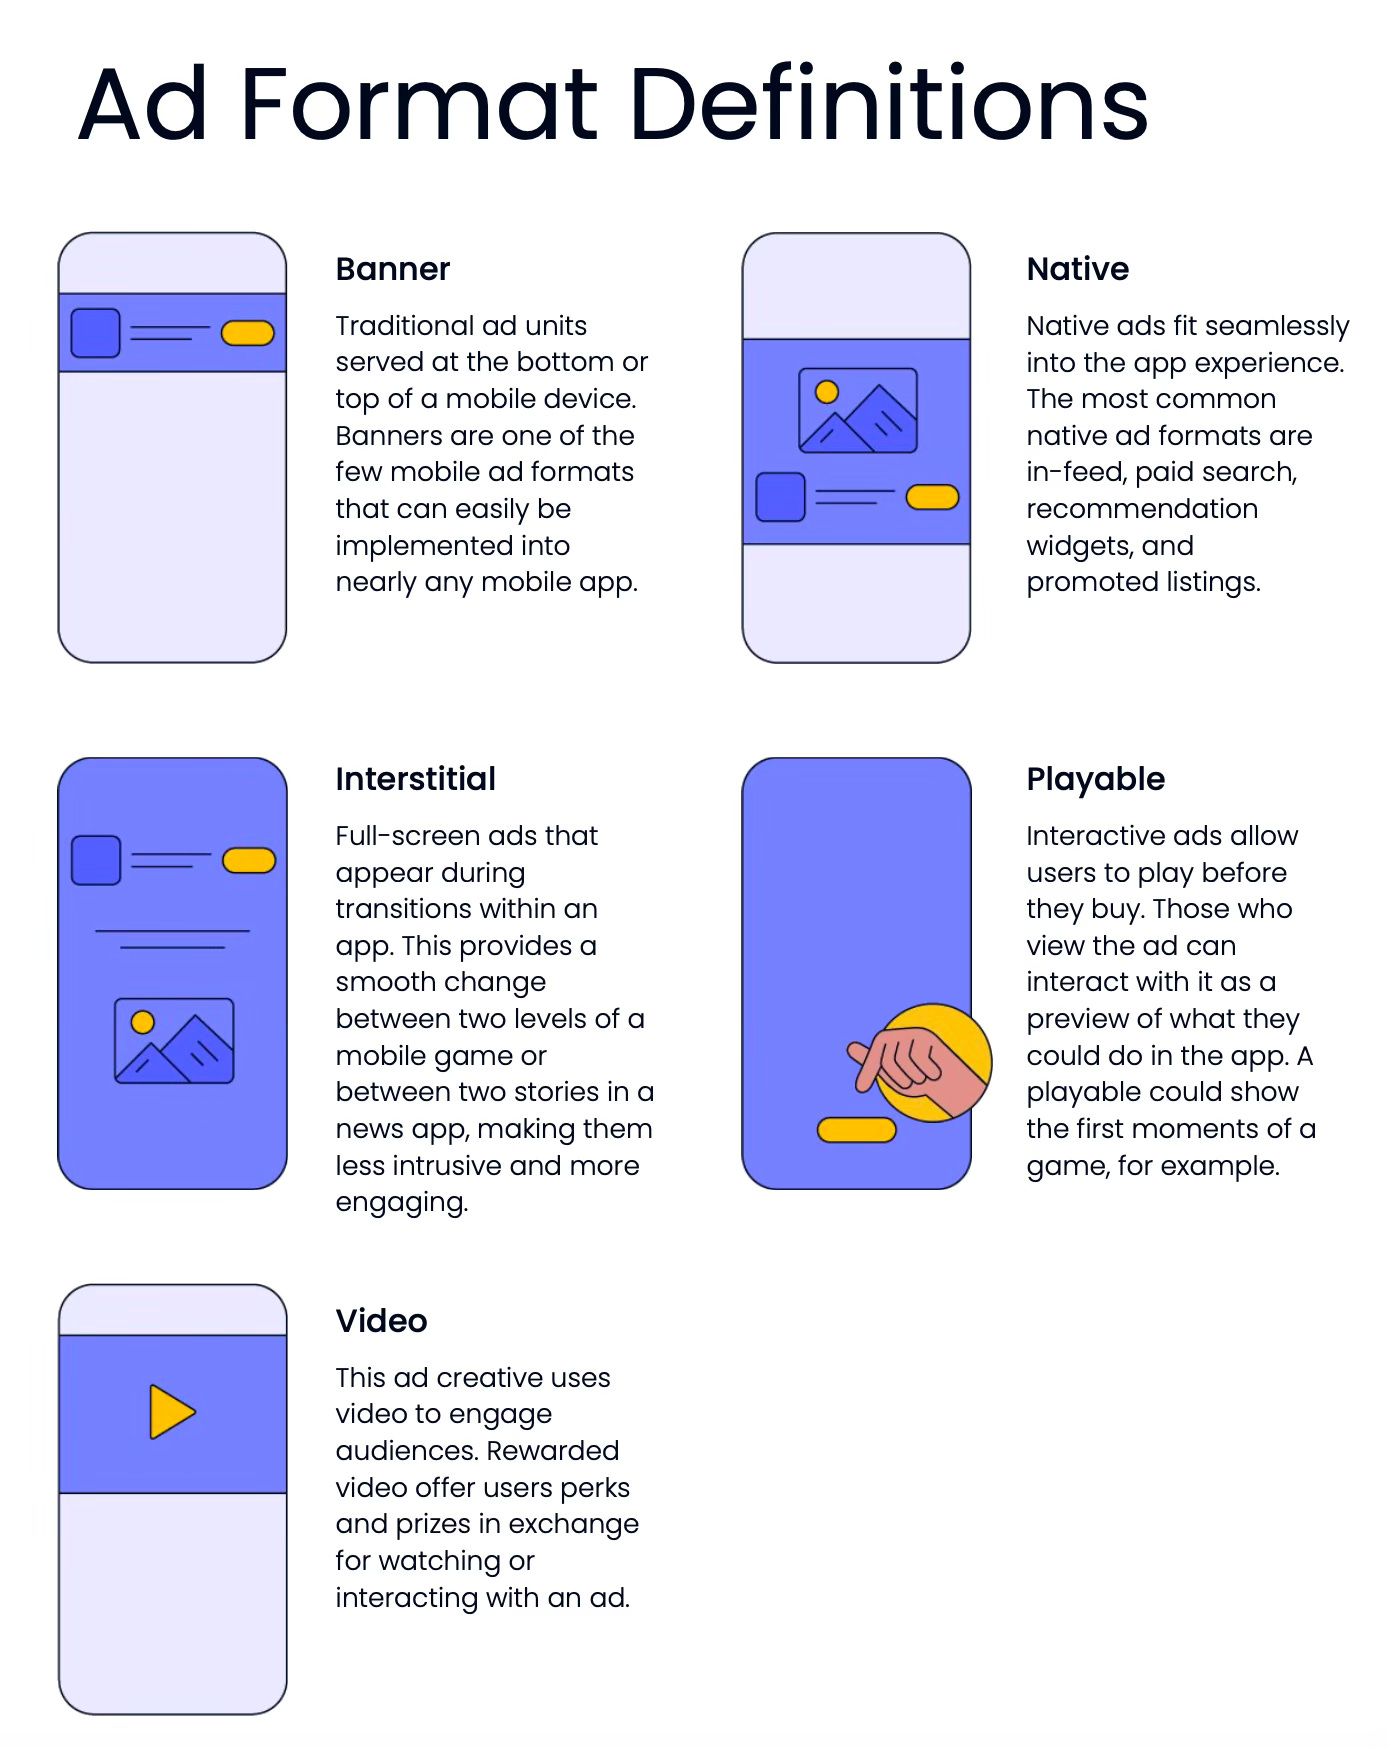
CPI - benchmarks for advertising formats in games
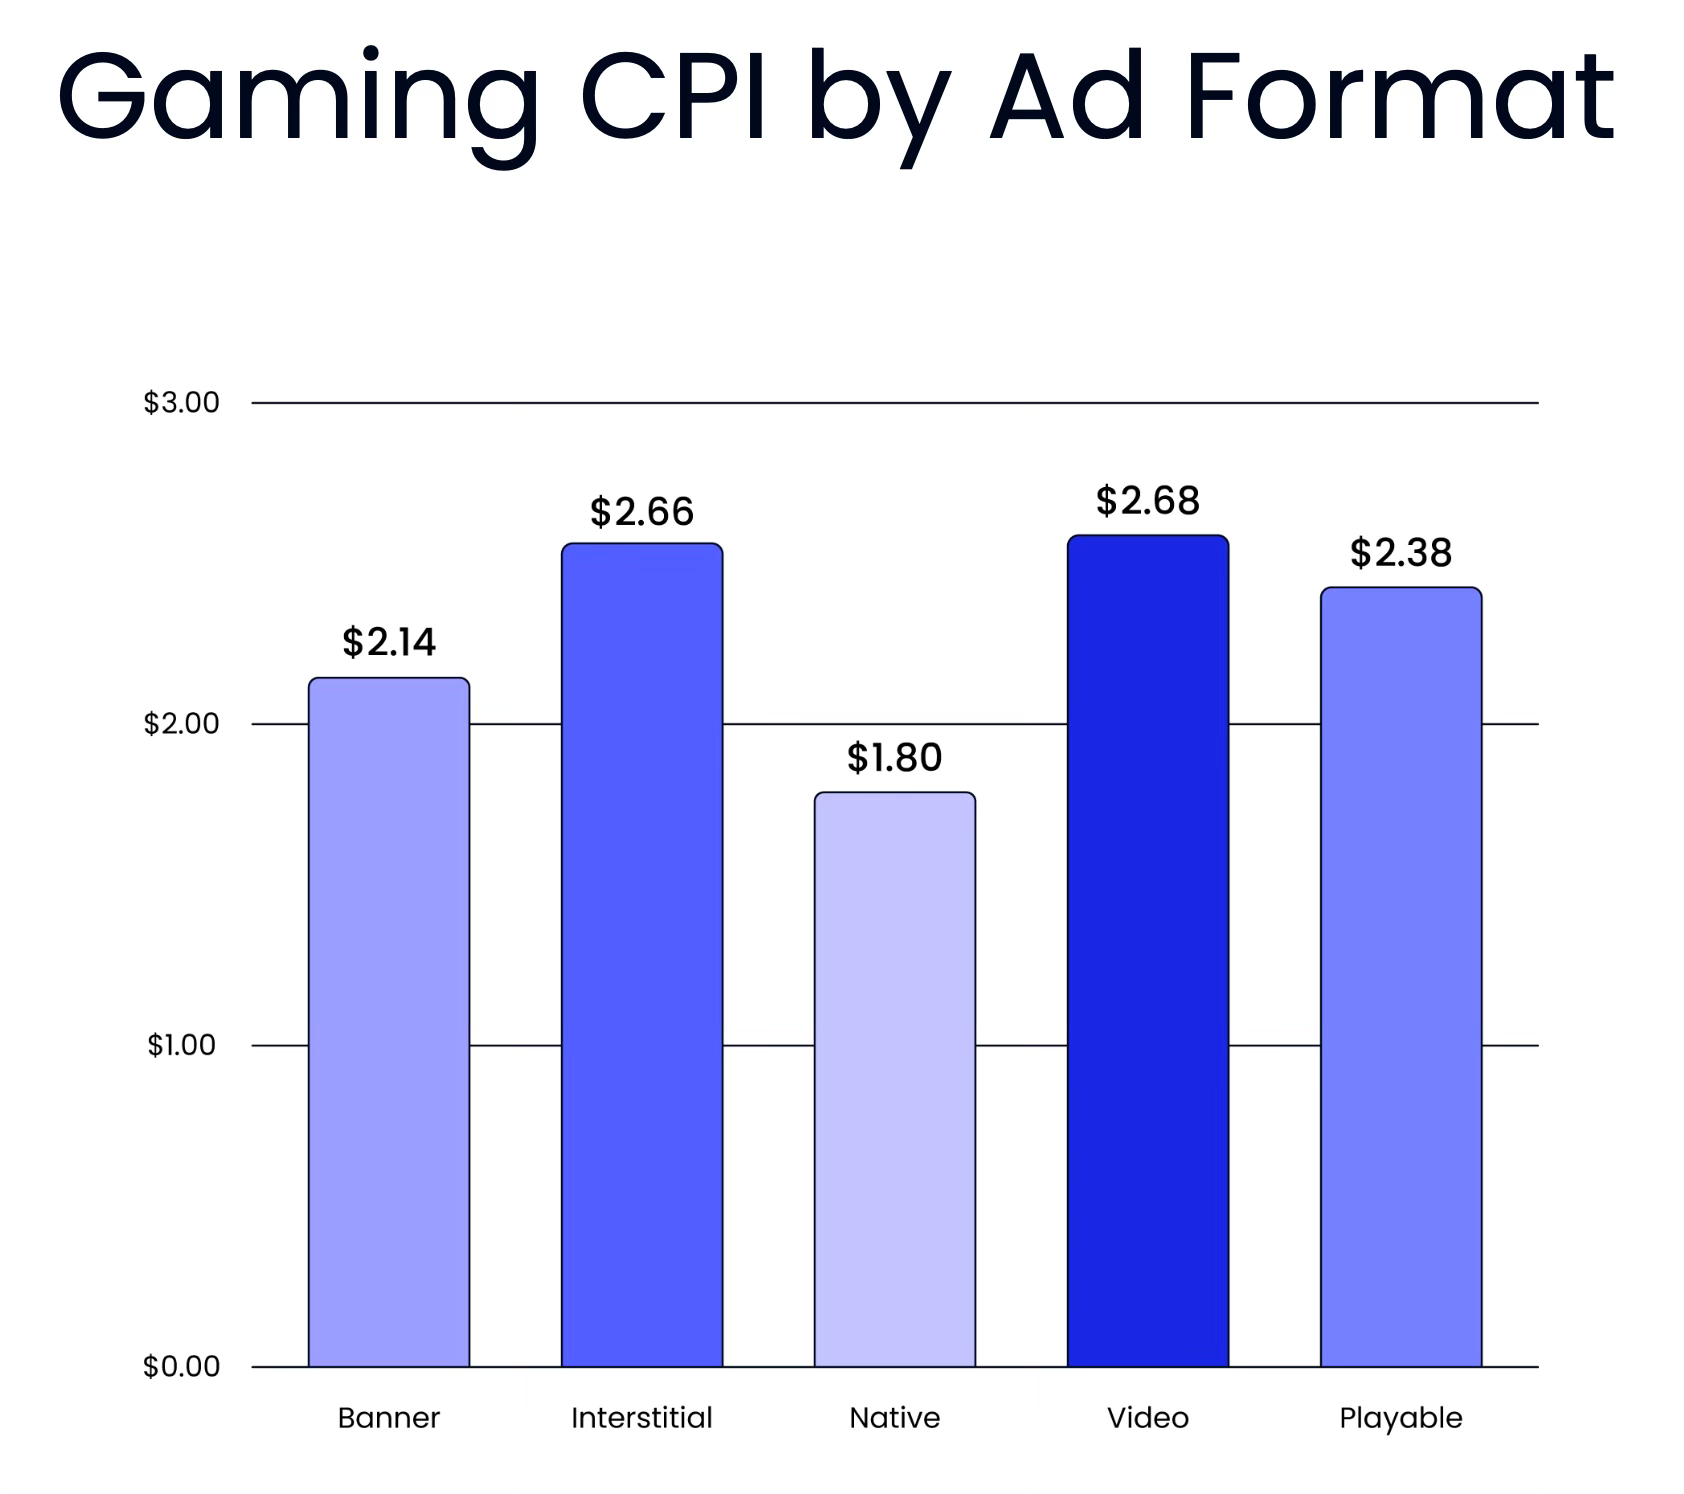
The lowest CPI is for native formats (feed integration, widgets, etc.) - $3.09 on iOS and $1.22 on Android. $1.8 on average.
Banners are second ($2.14 on average - $3.26 on iOS and $0.88 on Android); Playable format is more expensive ($2.38 on average - $5.76 on iOS and $0.6 on Android).
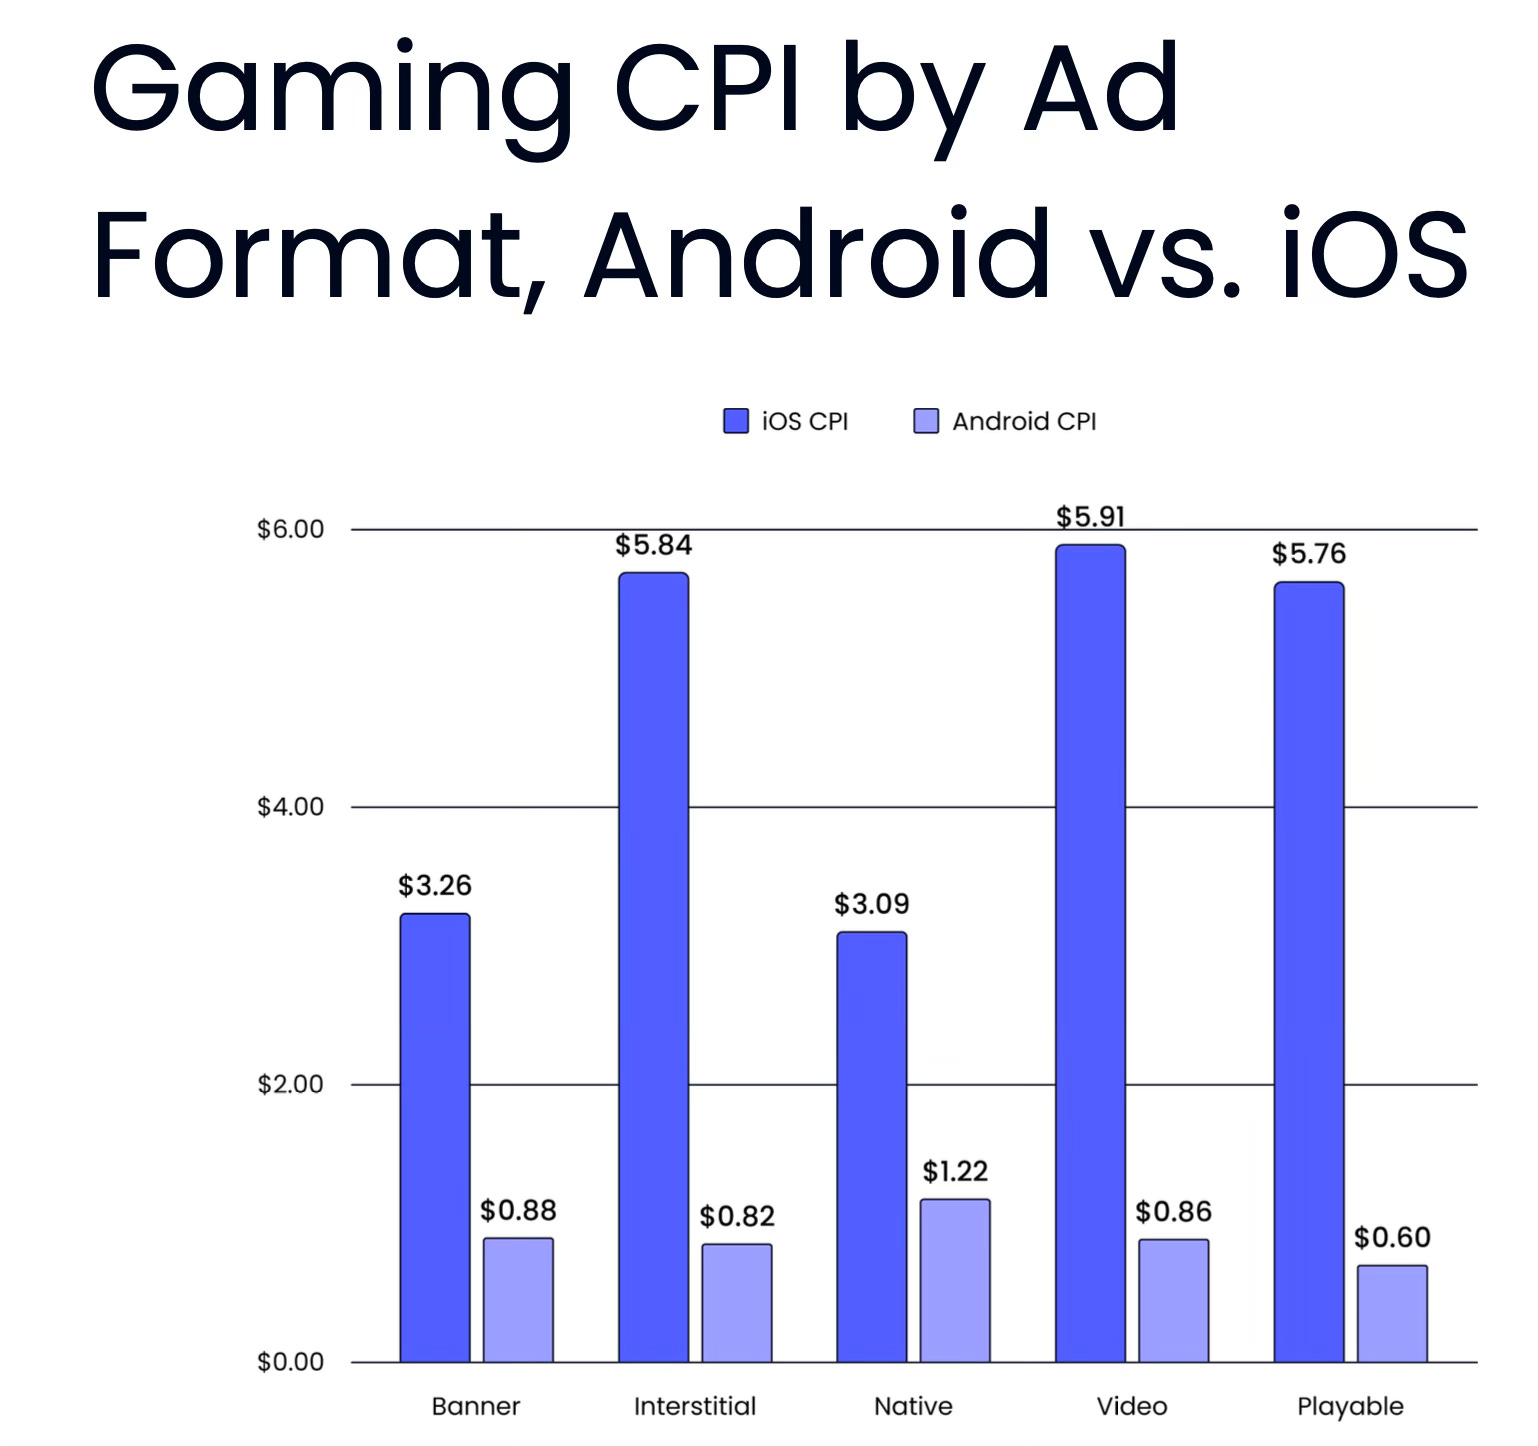
The most expensive advertising formats on average are Interstitial ($2.66 on average - $5.84 on iOS and $0.82 on Android) and video ($2.68 on average - $5.91 on iOS and $0.86 on Android).
Conversion from impression to install

The worst conversion is for banners. Liftoff took it as the baseline.
Results for native advertising formats are 1.6 times better.
There is a significant difference with video ads (conversion is 23 times better than banners); Playable ads (conversion is 27 times better) and Interstitial (conversion is 30 times better).
Day 7 ROAS - benchmarks in games

The worst D7 ROAS results are for Playable ads (6.81%); Interstitial format (8.14%) and video ads (8.29%).
The best results are for banners (18.2%) and native advertising (20.26%).
❗️Liftoff notes that the situation regarding D7 ROAS can vary dramatically depending on the genre, audience, spending level, and many other factors. This is an average figure overall.
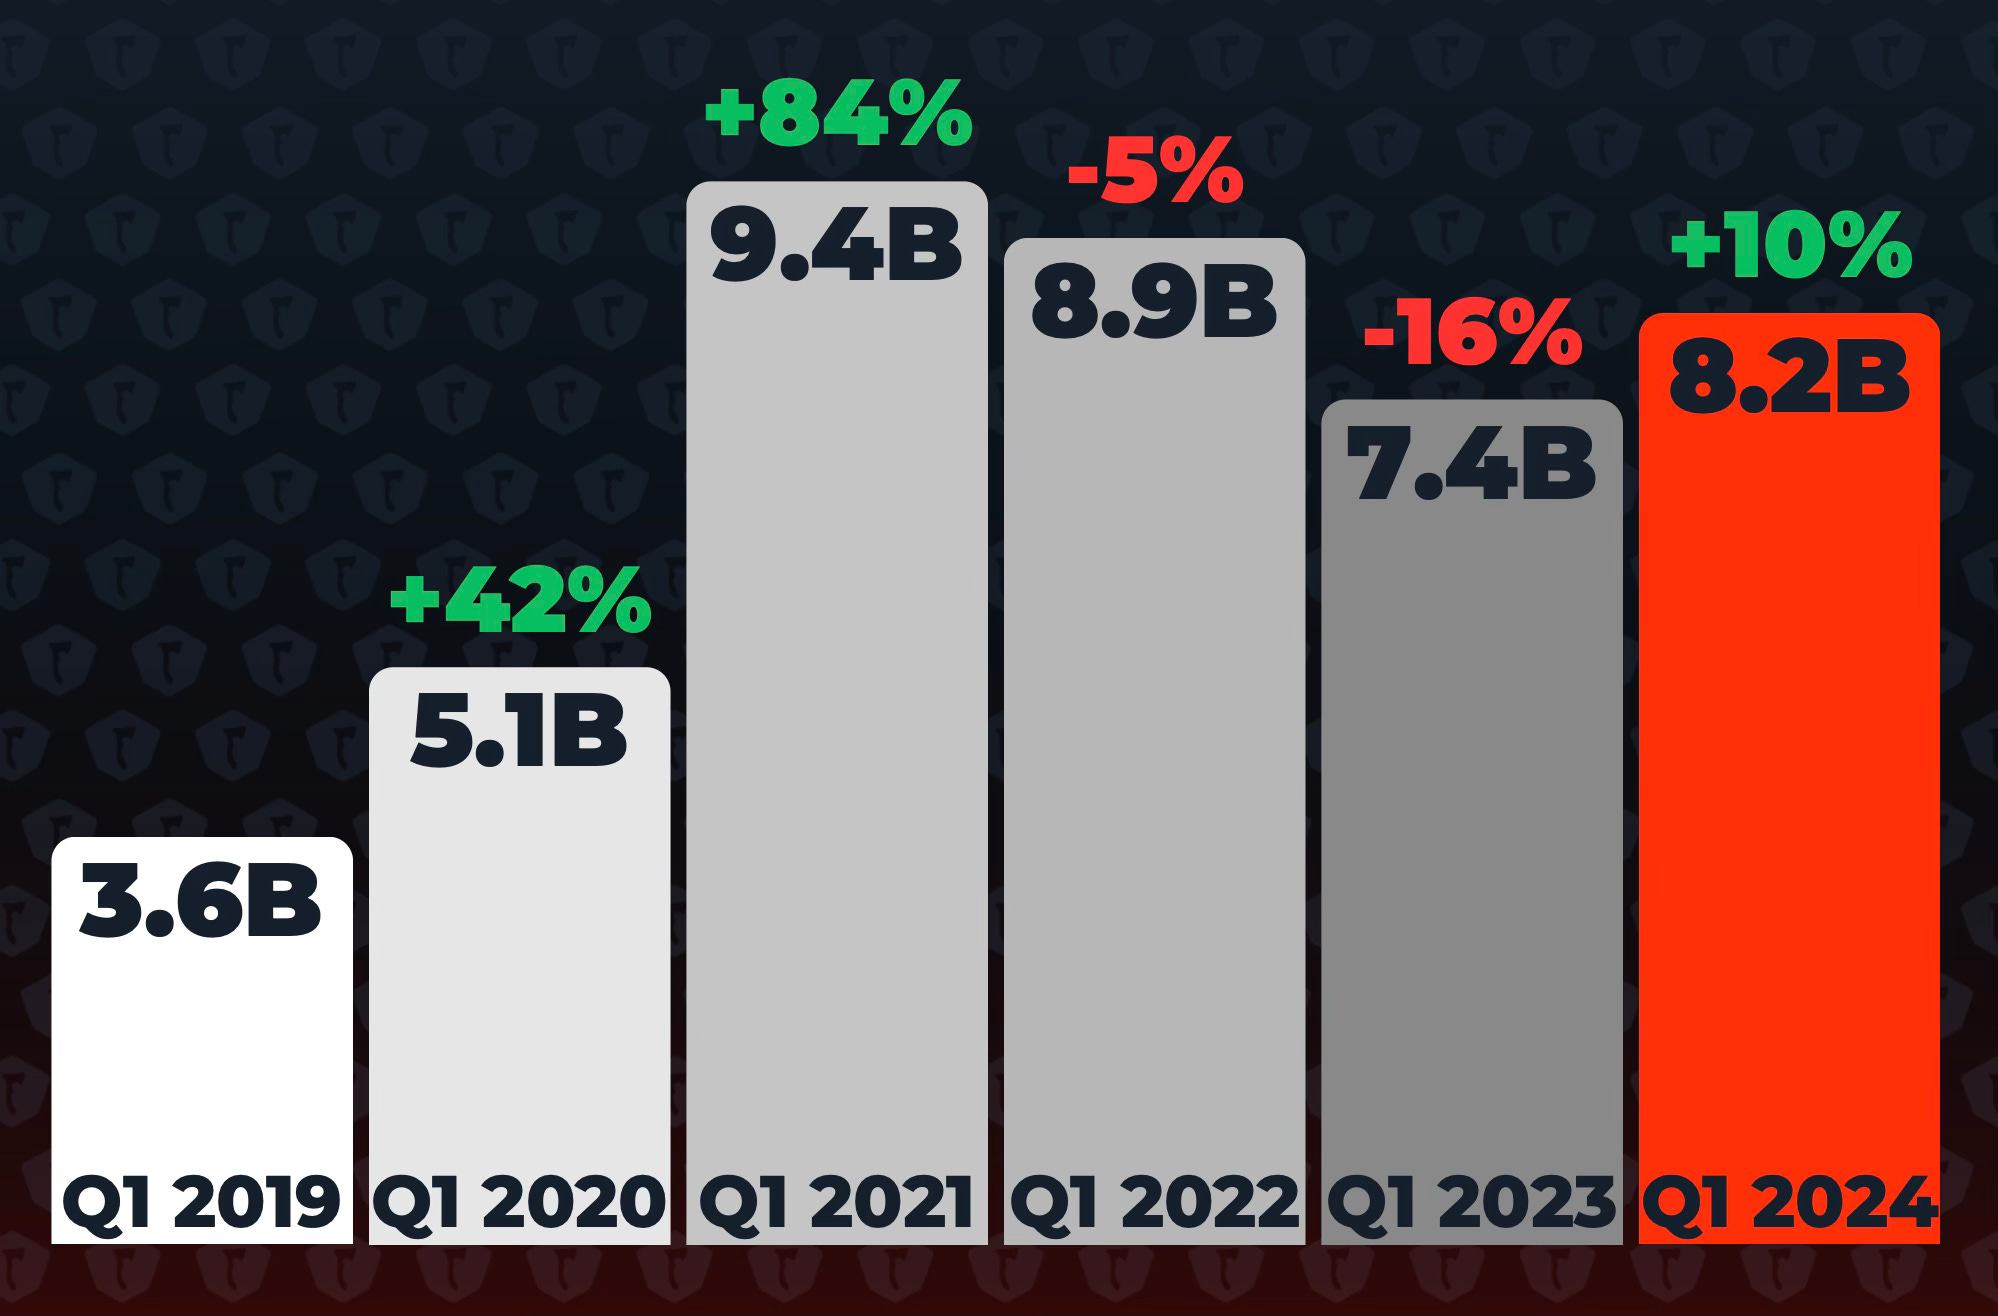
Stream Hatchet: Streaming Market Trends in Q1’24

Stream Hatchet tracks all streaming platforms in the market.
After a two-year decline, the number of viewing hours in Q1’24 increased by 10% compared to Q1’23, totaling 8.2 billion hours. This figure is 128% higher than in Q1’19 and 61% higher than in Q1’20.
Twitch remains the market leader, capturing 69% of the total viewing volume. YouTube Gaming follows with 16.5% of all hours. Kick, in its first year in the market, secured the third position with 4.4% market share; the platform is popular among gambling streamers. AfreecaTV (3.5% market share) ranks fourth, and Steam (1.8%) fifth.

In Q1’24, Twitch accumulated 5.7 billion hours, up by 3% from Q1’23. YouTube Gaming grew by 19% YoY, reaching 1.4 billion hours. Interestingly, Steam emerged as the fastest-growing streaming platform (+109% YoY). VK also showed growth at 17%, albeit on a smaller scale (136 thousand viewing hours).

❗️It seems that Twitch growth almost stopped, while YouTube Gaming continues to actively attract/re-engage the audience.
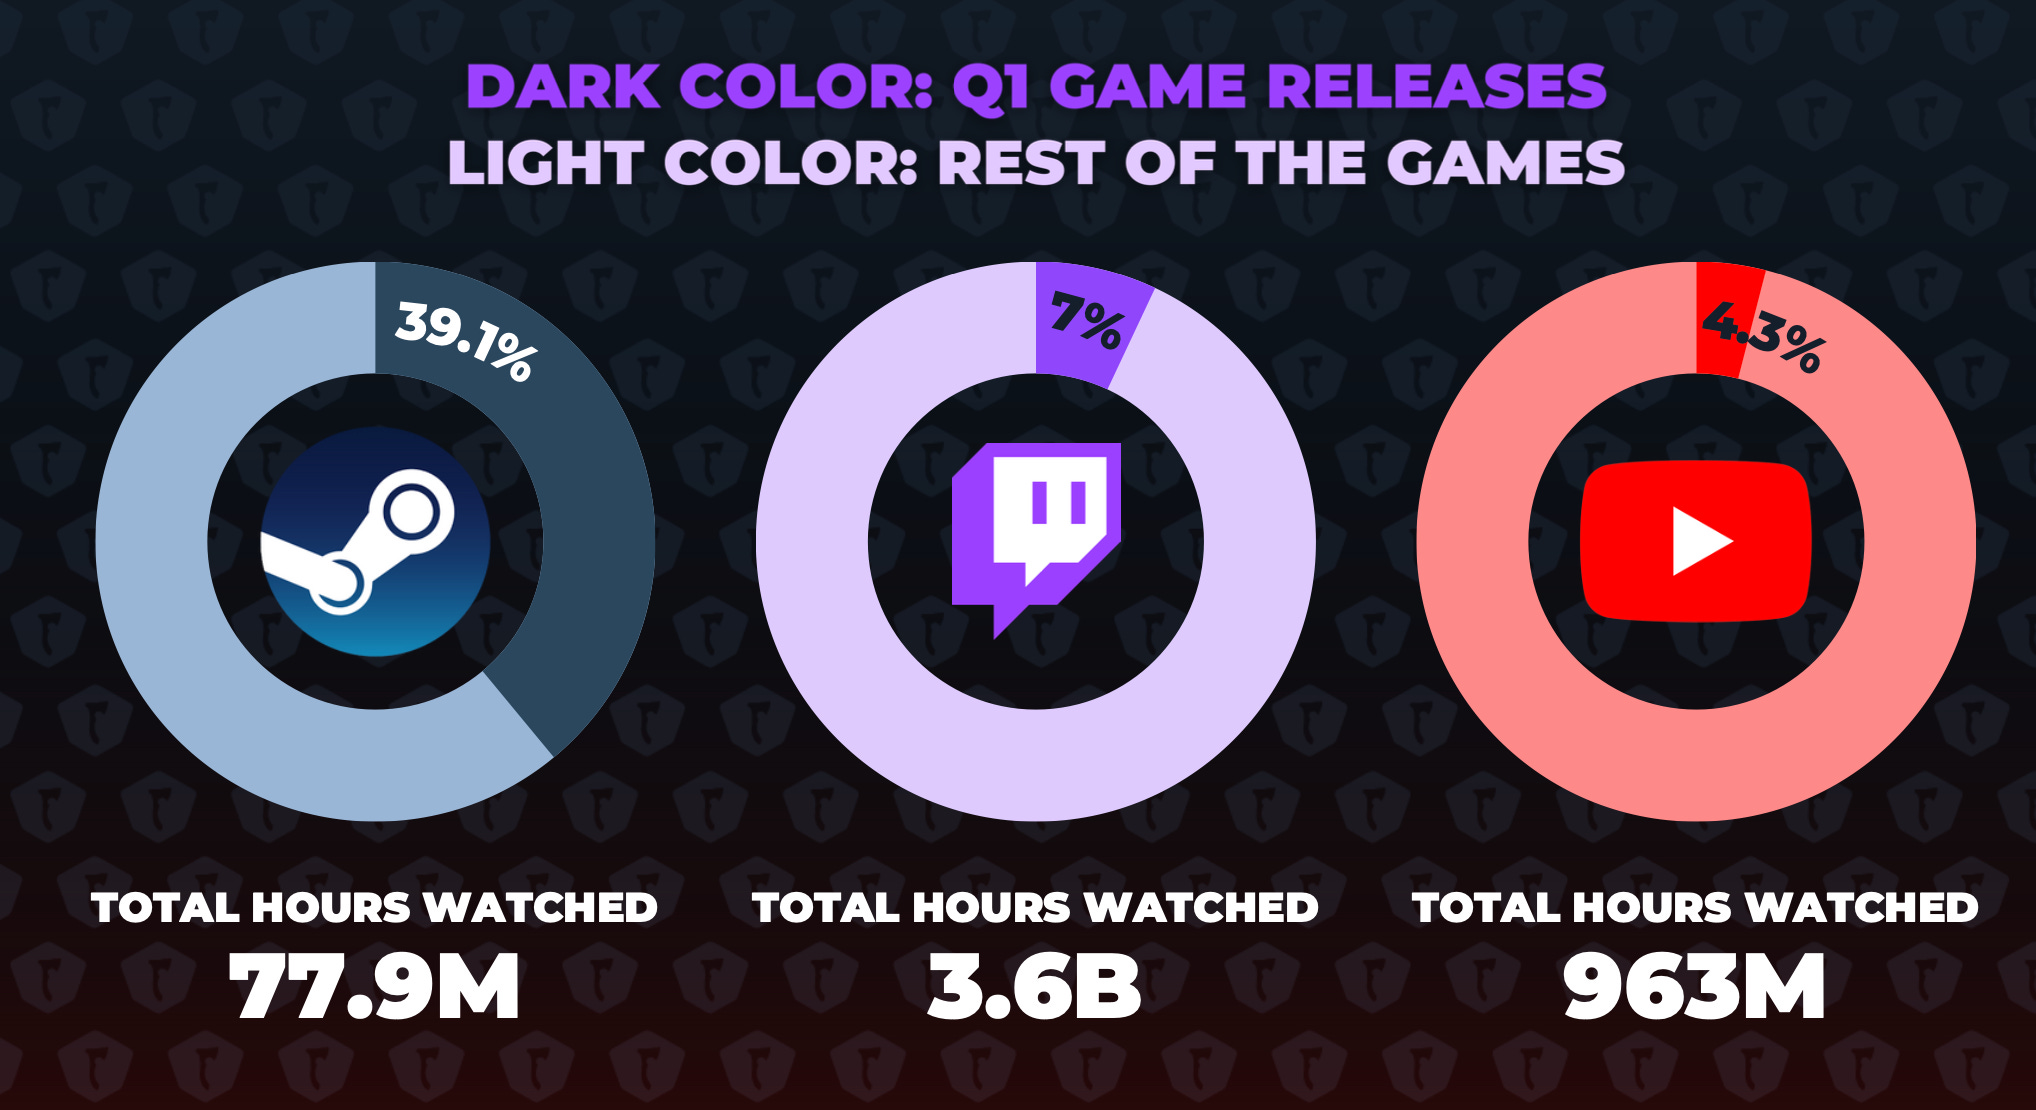
Counter-Strike 2 (13.7 million hours), Enshrouded (9.4 million hours), and Dragon’s Dogma II (4.9 million hours) were the most-watched games on Steam.

39.1% of all Steam views in Q1’24 were from new games. Twitch had only 7% from new games, and YouTube Gaming had 4.3%. Streaming new games on Steam appears to be an effective strategy.
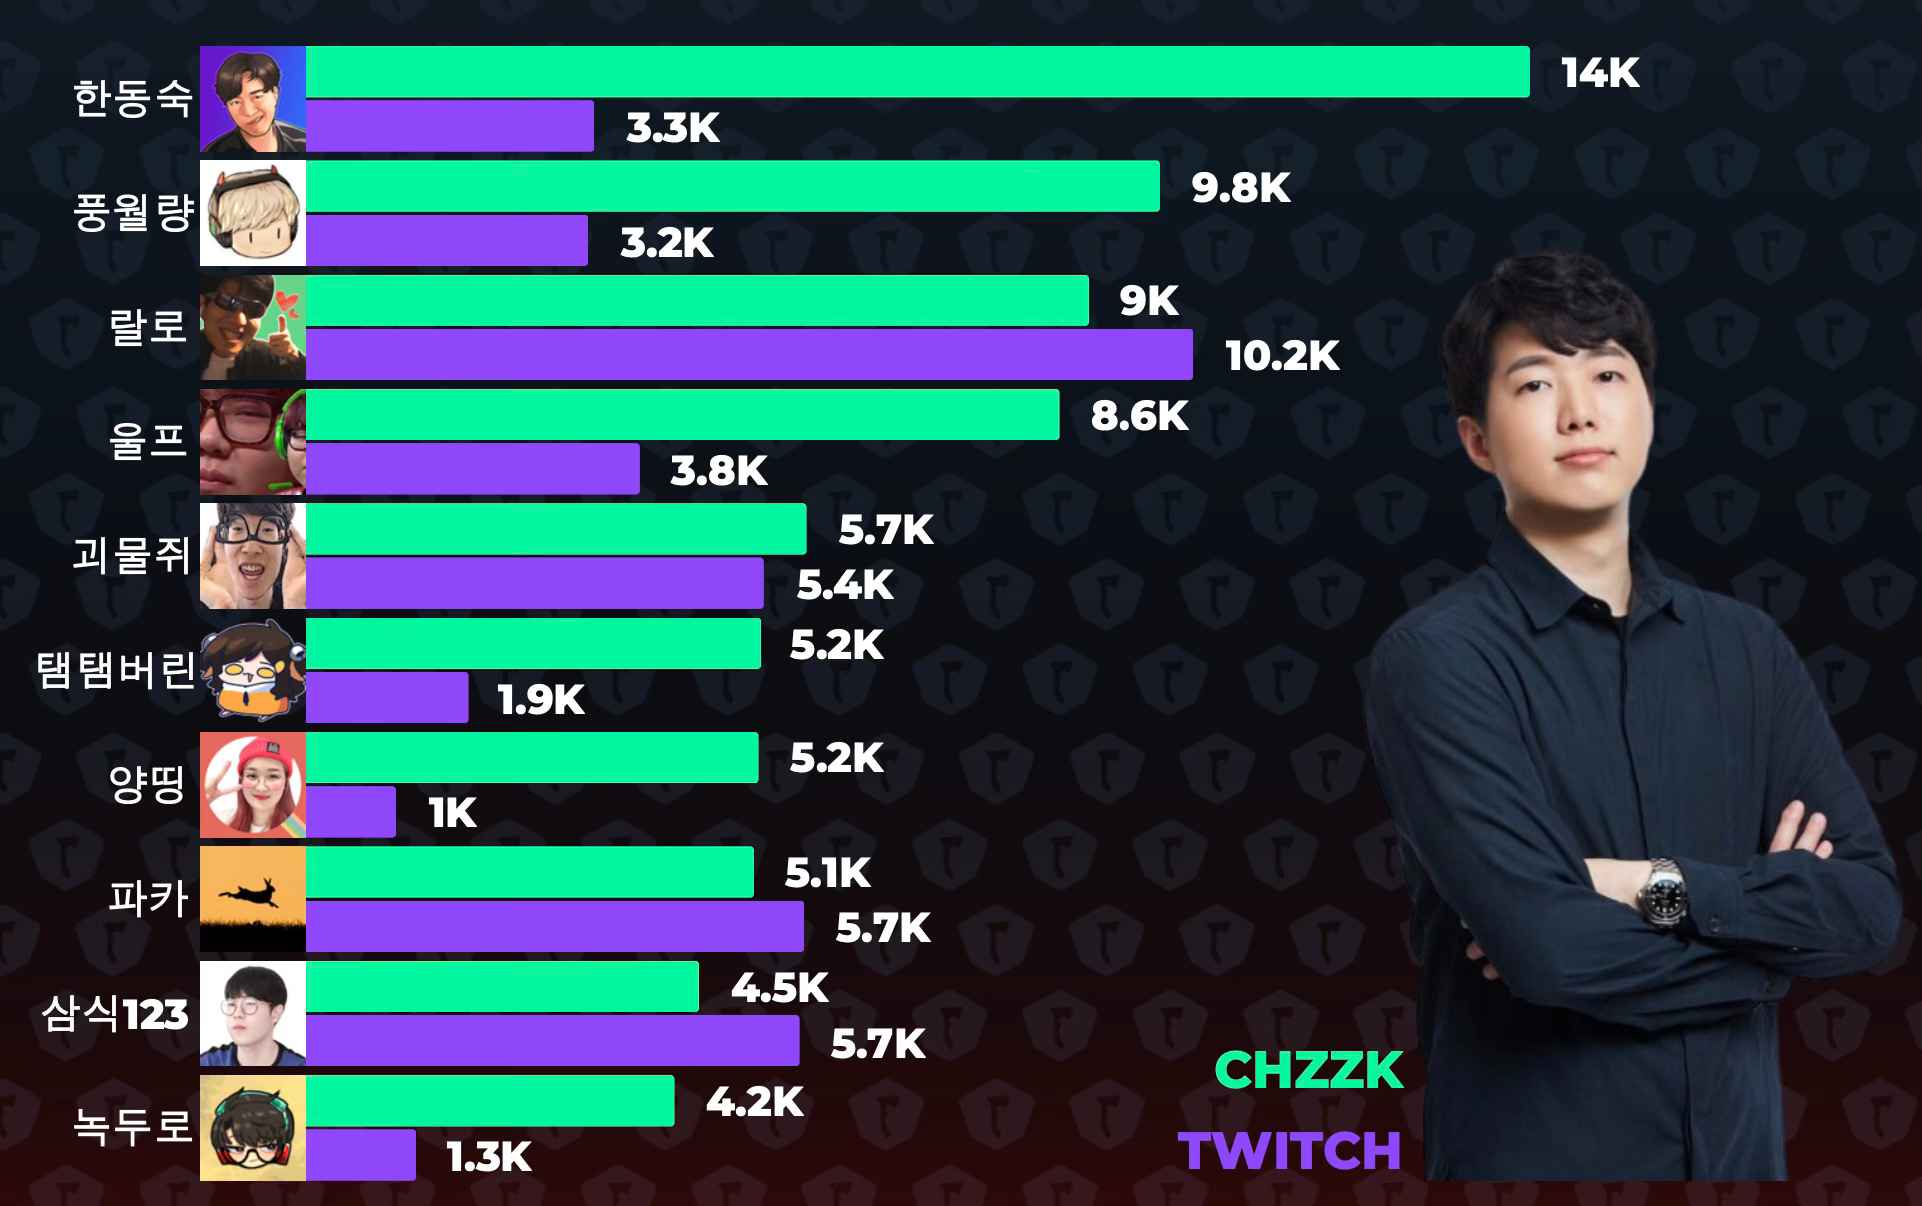
CHZZK and AfreecaTV confidently took the lead over Twitch in South Korea. The latter announced its exit from the market due to high operating costs. It turned out that the average views of the top 7 South Korean streamers on CHZZK are higher than on Twitch.

❗️CHZZK took the majority of the Twitch audience. AfreecaTV hasn’t benefitted that much. Curious to find reasons.
Grand Theft Auto V (590 million hours), League of Legends (526 million hours), and Counter-Strike 2 (299 million hours, +72% QoQ) were the most-viewed games in the first quarter. Seven out of ten games in the top 10 saw growth in views, with an average increase of +31%.

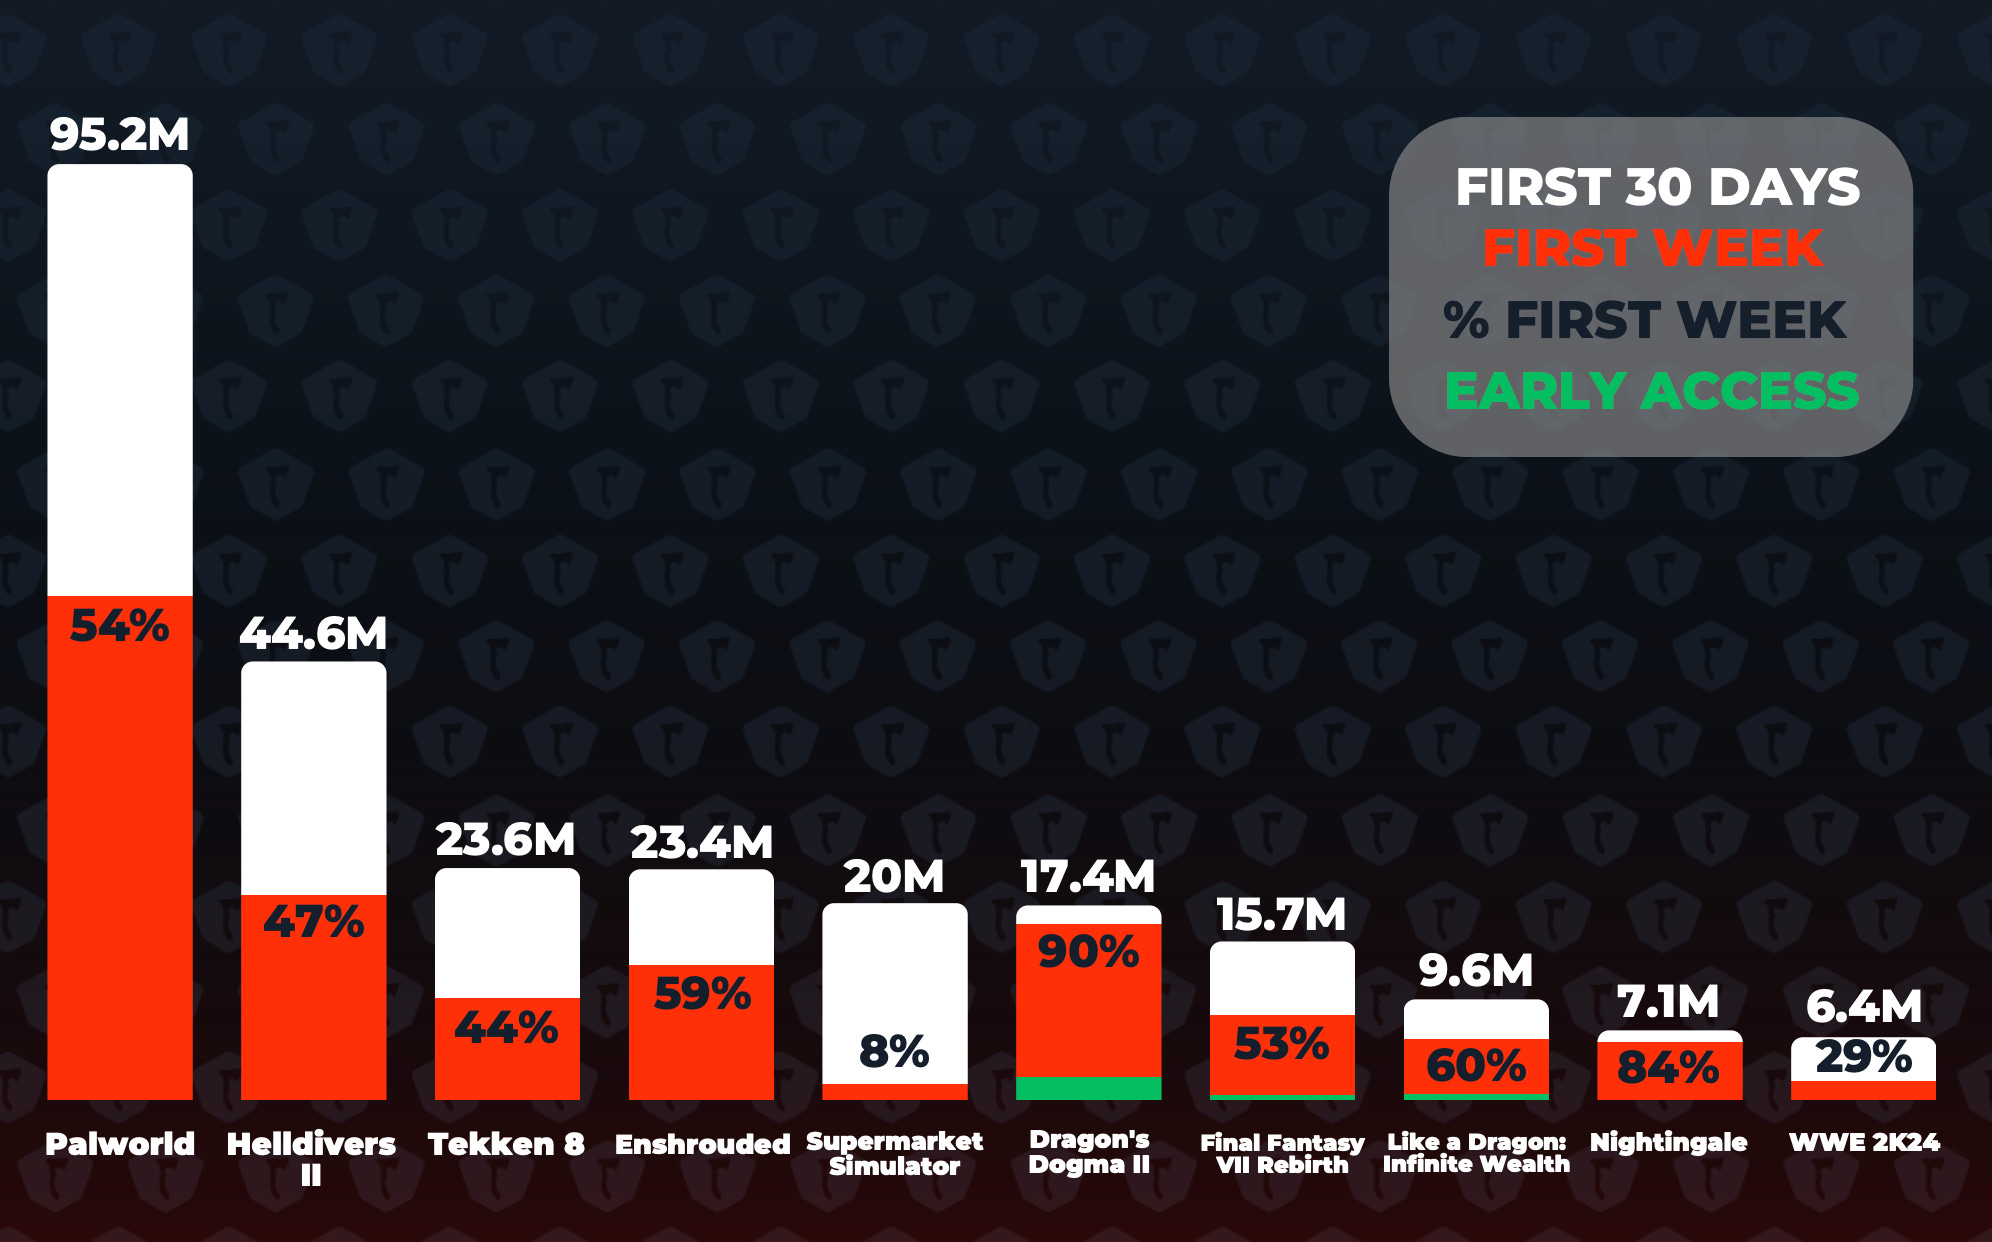
Palworld was the most-viewed newcomer in Q1’24, garnering over 95 million viewing hours in its first month.
FPS (1.3 billion hours, +25% QoQ), action-adventures (1.1 billion hours, +7% QoQ), and MOBA (889 million hours, +3% QoQ) were the most popular genres in the first quarter.

GameDiscoverCo: Data Consumption in Steam by Country in 2024
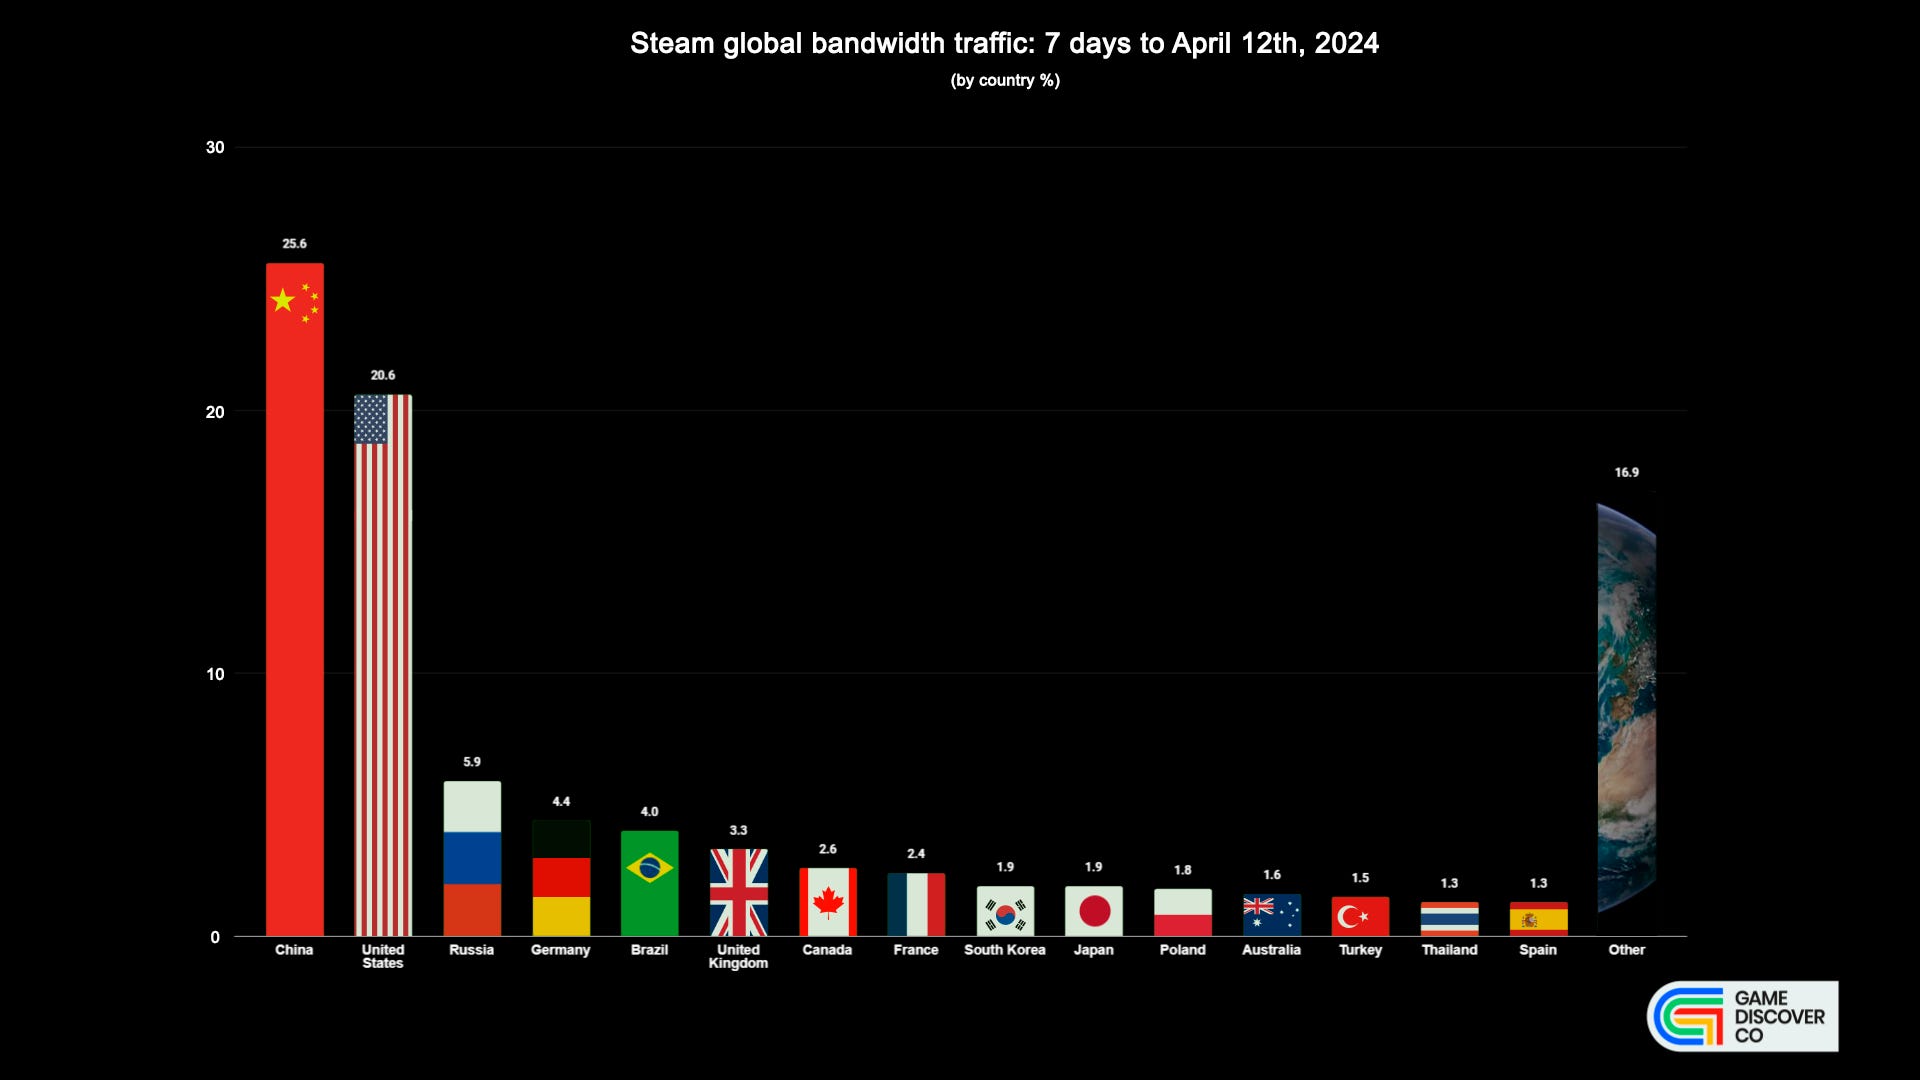
Data was collected from April 5th to April 12th, 2024. Do not forget to subscribe to GameDiscoverCo.
China accounts for 25.6% of all data consumption in Steam; the USA - 20.6%; Russia - 5.9%. These are the top three leaders.
❗️Bandwidth consumption does not indicate the number of users or revenue. Players may download more games or prefer more "heavy" projects.
It's unusual to see Thailand in the ranking. This country accounts for 1.3% of the total data volume.
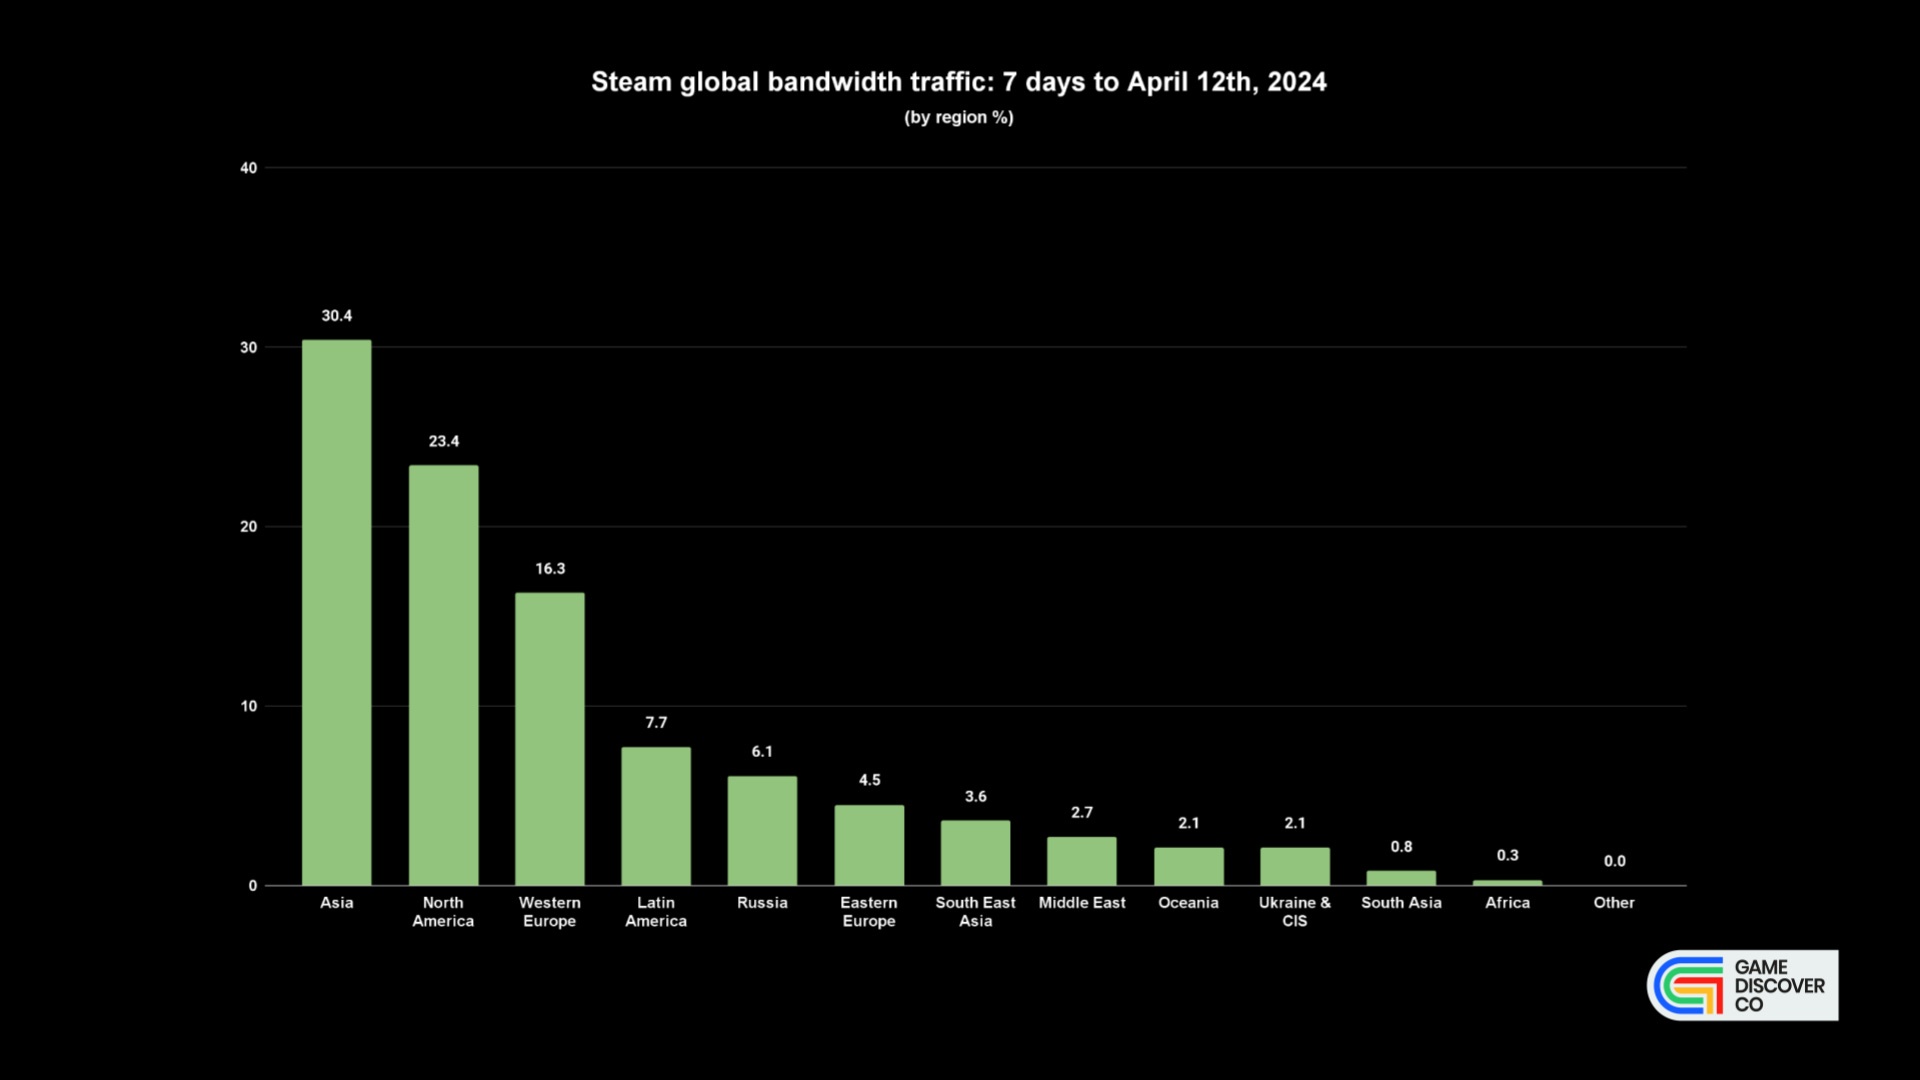
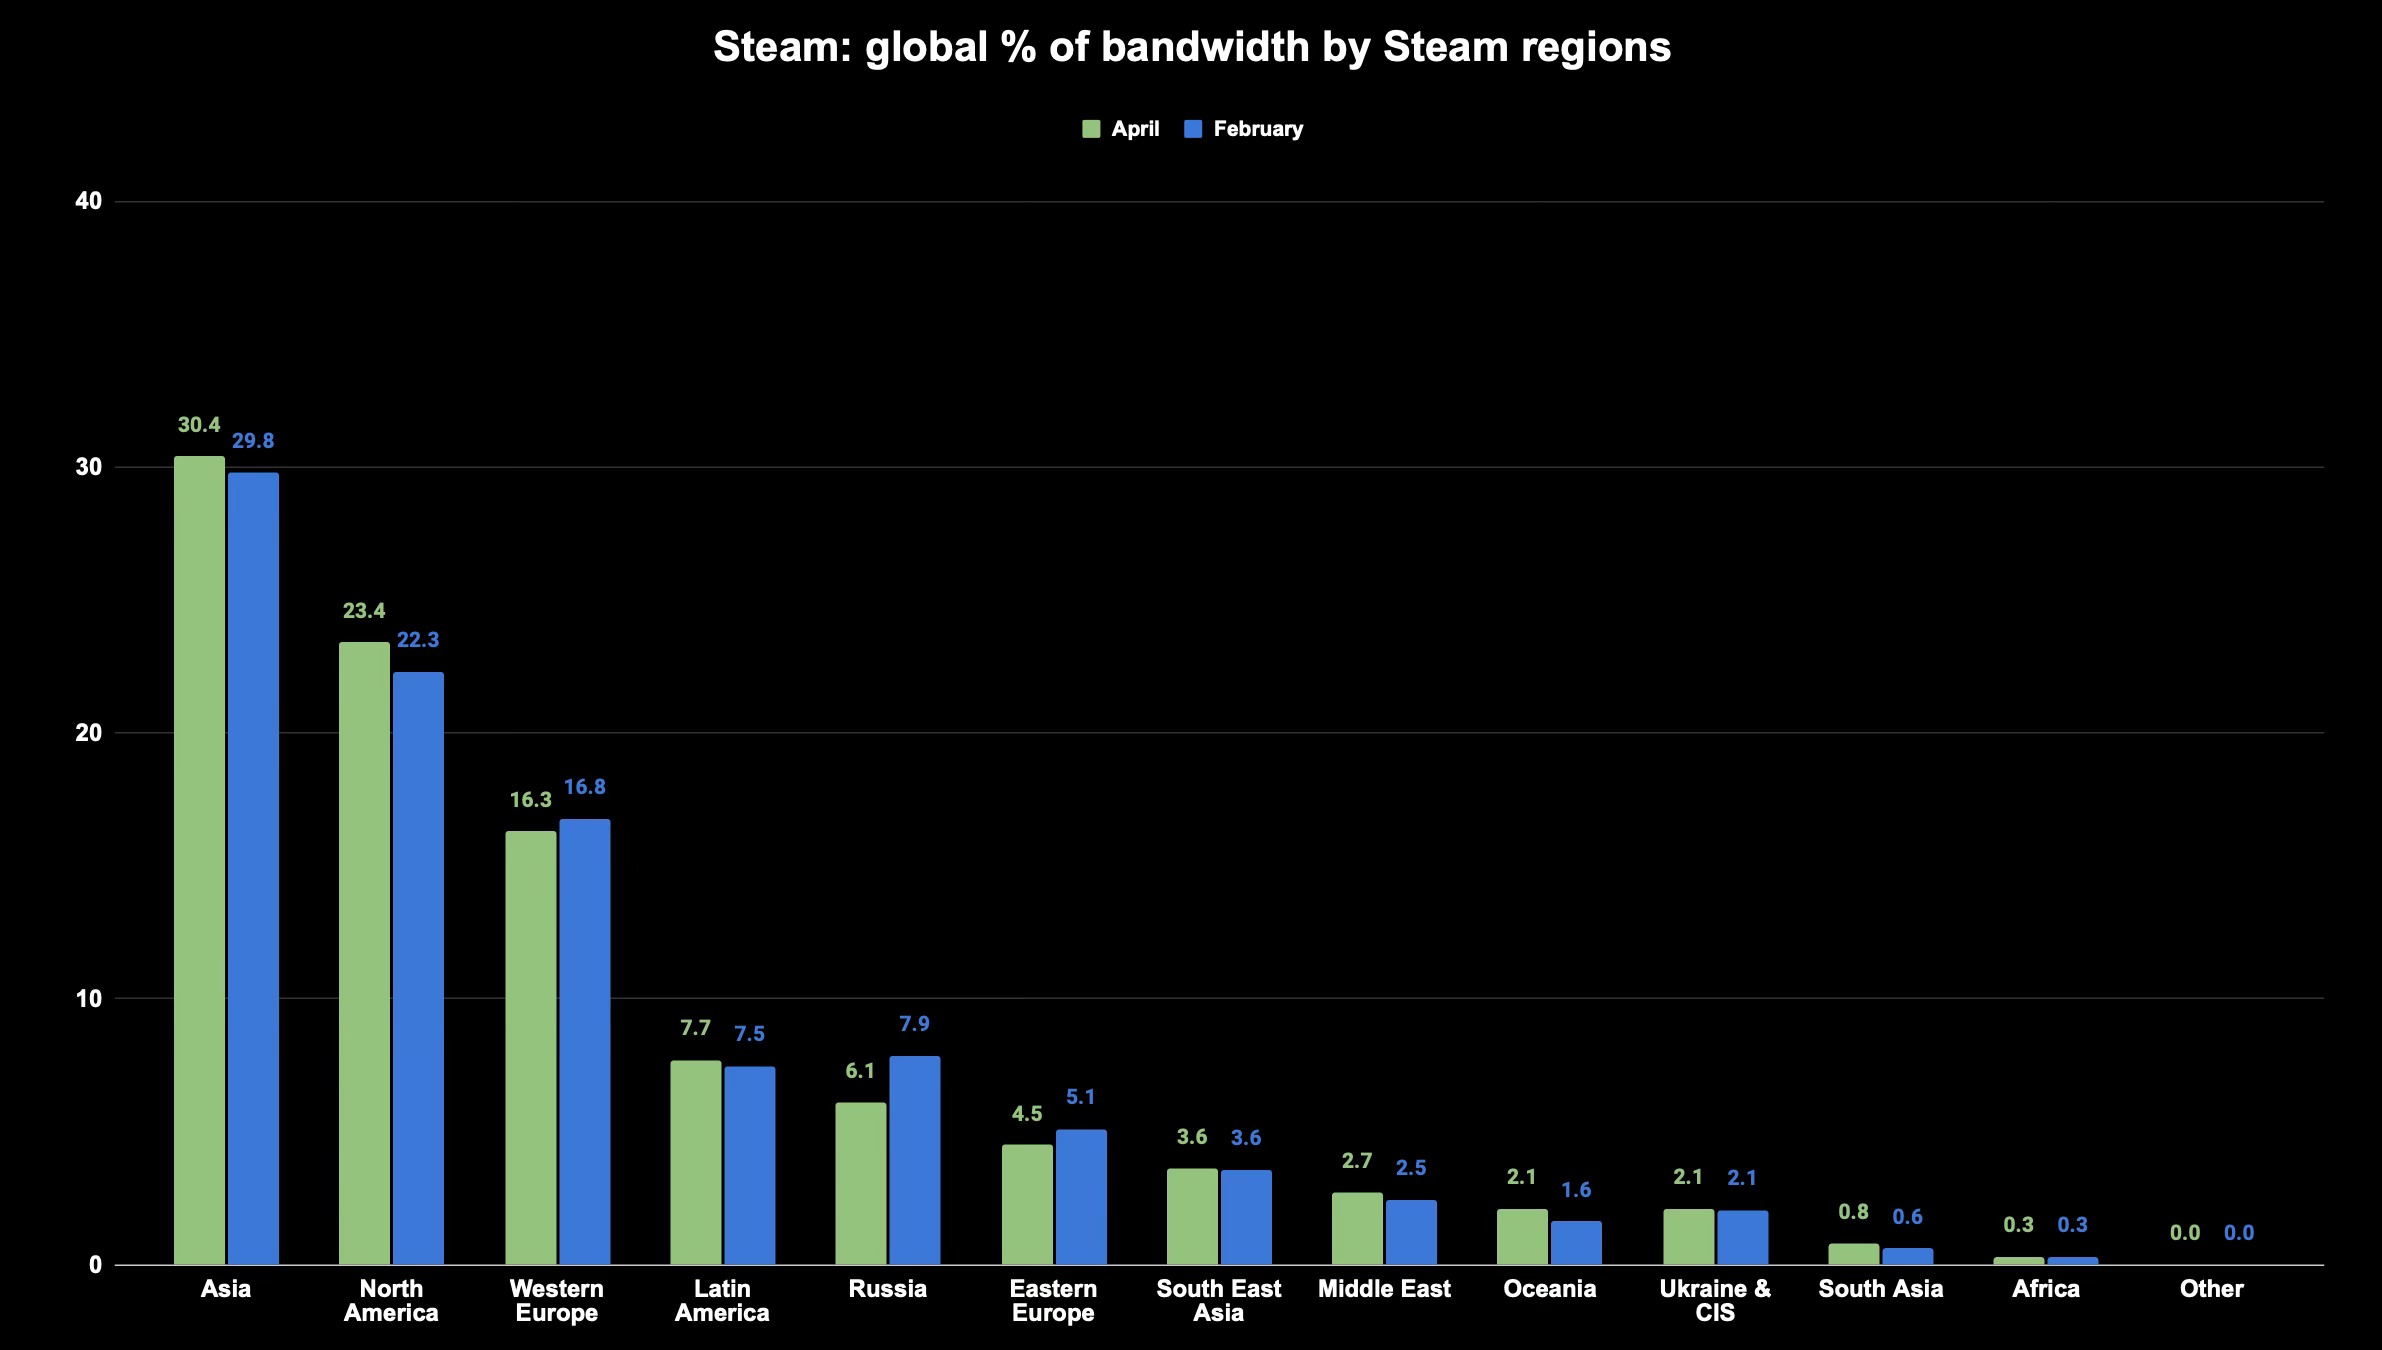
If we look at the distribution of data consumption by regions, Asia accounts for 30.4%; North America - 23.4%; Western Europe - 16.3%; Latin America - 7.7%; Russia - 6.1%; Eastern Europe - 4.5%; Southeast Asia - 3.6%; Middle East - 2.7%; Oceania - 2.1%; Ukraine and CIS - 2.1%.
By this link you will find the raw data and comparison with February data.
Newzoo: Outlast Trials became the top-grossing B2P adventure game of March

Newzoo is tracking data in 37 markets, excluding China and India.
In terms of MAU, Outlast Trials ranked third among all games released in March. It was the top new adventure game in March based on this metric.
In overall MAU within the genre, the game ranks 30th. The majority of players are from the USA and Germany.
0.9% of the tracked audience played Outlast Trials. On average, they spent 9.1 hours in the game.
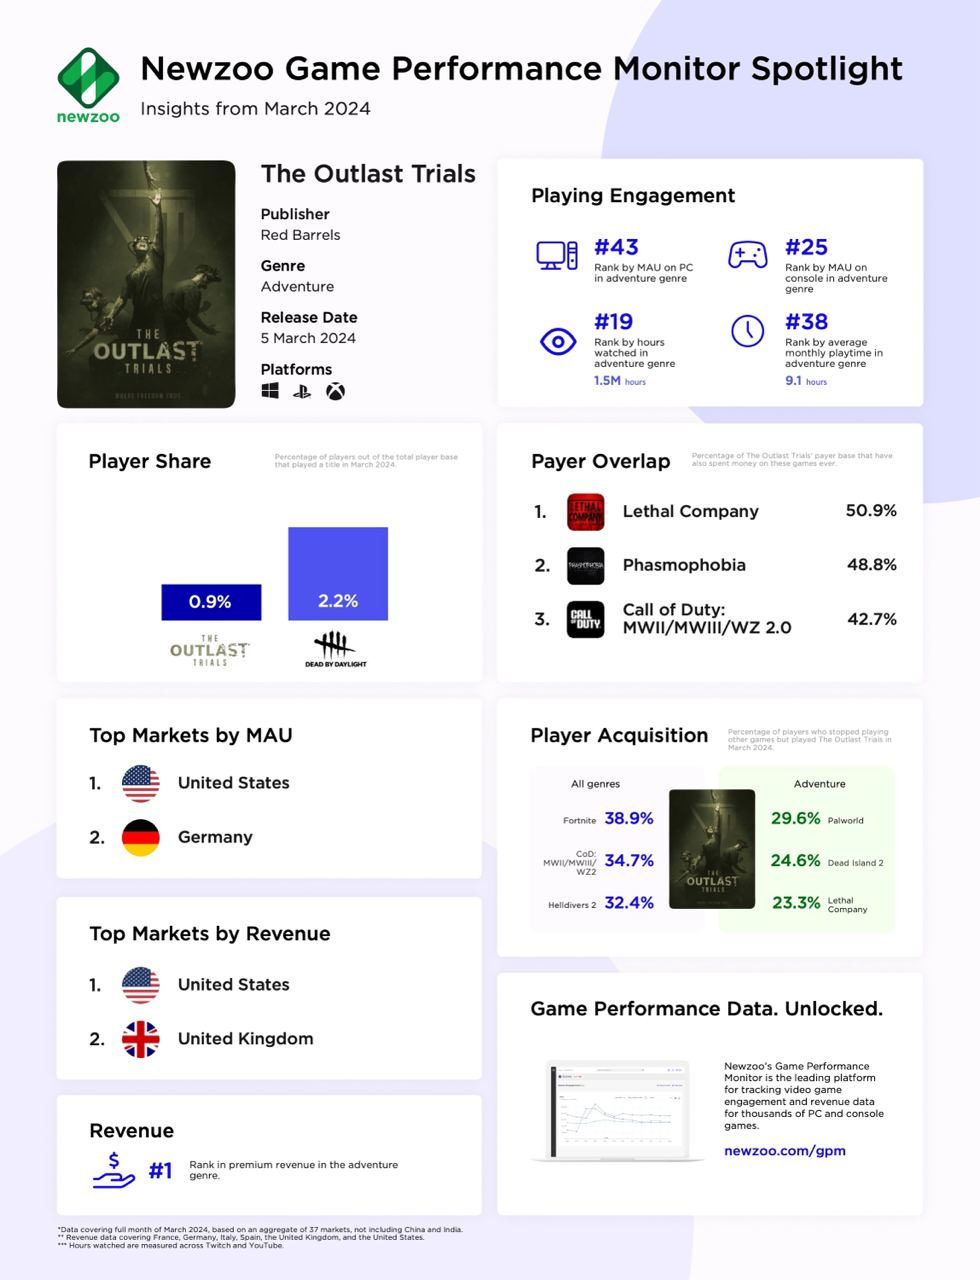
Users spent a total of 1.5 million hours watching content related to the game on Twitch and YouTube.
The highest number of users in Outlast Trials came from Fortnite (38.9%), Call of Duty (34.7%), and Helldivers II (32.4%). If we’ll look at adventure genre alone, most players came from Palworld (29.6%), Dead Island 2 (24.6%), and Lethal Company (23.3%).
The largest audience overlap with Outlast Trials is with Lethal Company (50.9% of users). Following are Phasmophobia (48.8%) and Call of Duty (42.7%).
Regarding overall revenue, GTA V leads in the genre. However, considering the business model, Outlast Trials is the top among paid games. It also ranks 7th in this metric among all games in March.
❗️You can question the taxonomy, though. What is adventure games, and what’s not.
The primary markets for Outlast Trials are the USA and the UK.
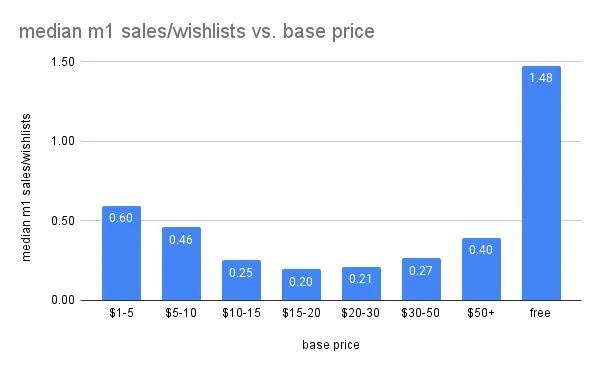
GameDiscoverCo: Conversion benchmarks of Steam wishlists into sales in the first month

700 games on Steam released since September 2023 were examined, each having at least 5,000 wishlists and 500 sales in the first month. Do not forget to subscribe to the GameDiscoverCo for more Steam discoverability data.
Conversion in the first month ranges from 0.06 (10th percentile) to 1.34 (90th percentile).
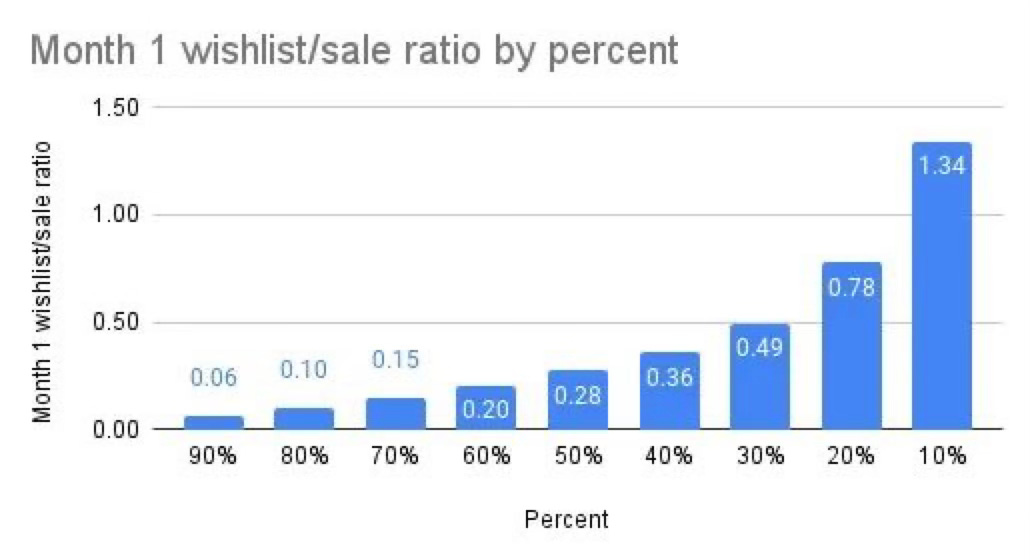
The median conversion rate of wishlists to sales in the first month is 27%. In the first week, it is 22%.
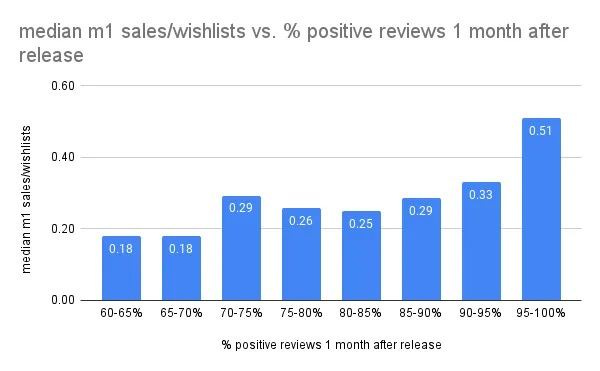
The higher the game's rating, on average, the higher the conversion rate from wishlists to sales. This is especially noticeable at ratings of 95%+ (Overwhelmingly Positive) - in such cases, the conversion is 0.51 in the first month.
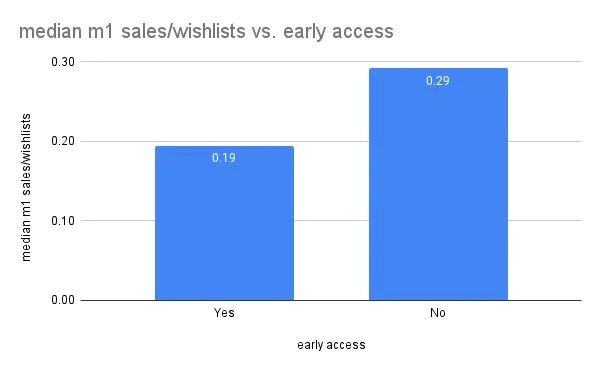
On average, the conversion of wishlists to sales in Early Access is lower than at full 1.0 launch by third.
There is a correlation between conversion and price. For games priced between $1 and $10, and for free projects, the conversion is higher than for others. Conversion is worst for games priced at $15-30.