

Weekly Gaming Reports Recap: November 18 - November 22 (2024)
European job market insights; forecast for the Indian market until 2029, and more inside.


Reports of the week:
Values Value & inGameJob: European Gaming Job Market in 2024
TIGA: The UK Gaming Industry stays resilient and continues to grow
WKO: Austrian Gaming Industry in 2024
Lumikai & Google: Indian Gaming Market to Grow to $9.2B by 2029
Sensor Tower: Popularity of Puzzles is growing in the South Korean Market
ESA: 76% of American children want gifts related to video games for the Holidays
GSD & GfK: Game sales in Europe increased in October 2024
Values Value & inGameJob: European Gaming Job Market in 2024
The survey involved 1,832 people from March to June 2024. The research regions were divided into two parts. The first included countries of the European Union, the United Kingdom, and Switzerland (for simplicity, I’ll name them the EU). The second included European countries not in the EU (I’ll name them as non-EU). More men participated in the survey (58%); the distribution by position level is even. 19% have over 10 years of experience in games.

Salaries
The median annual gross salary for Senior specialists ranges from €31,000 to €84,000 per year. QA and testing specialists earn the least; top management earns the most.


For mid-level specialists, the salary ranges from €13,800 to €47,000 per year. Again, QA and testing specialists are paid the least, while programmers have the highest salaries.
The median salary for Junior specialists ranges from €6,700 to €24,250 per year. Game designers from non-EU European countries earn the least. Programmers in EU countries, the UK, and Switzerland earn the most.


The median salary in 2024 increased for all specialties except HR and recruitment, QA and testing, and project management specialists. In EU countries (+ UK and Switzerland), salaries also decreased for sound specialists and artists. In non-EU European countries, game designers' salaries also decreased.
There is a noticeable decrease in salaries for almost all entry-level positions.


Specialists working in mobile game studios, on average, earn more than their colleagues in premium game development.
Job and Salary Satisfaction
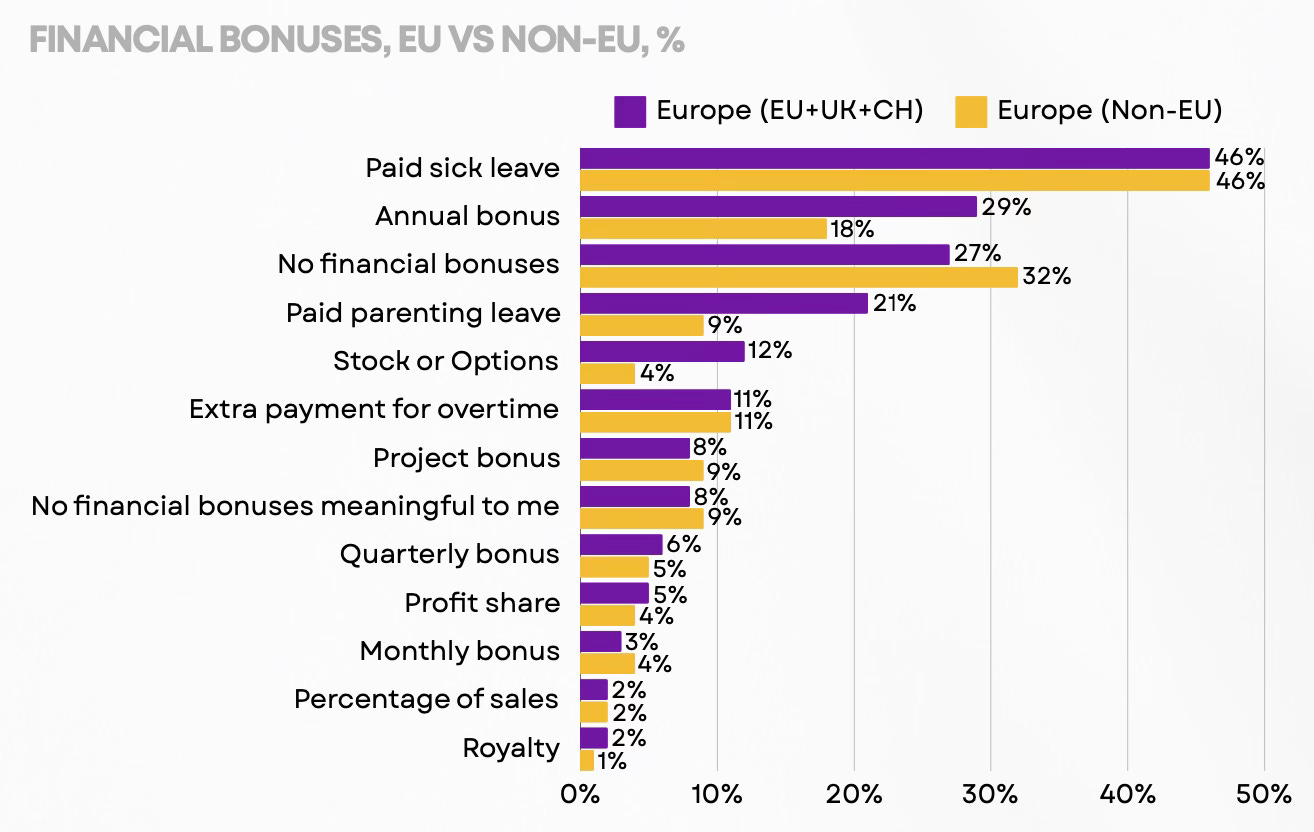
Regarding financial bonuses, only 46% of companies offer paid sick leave; 29% of EU companies offer an annual bonus (only 18% among non-EU companies). Paid parental leave is available in 21% of EU companies and 9% of non-EU companies.
The highest satisfaction comes from (in descending order) - revenue share, sales percentage, royalties, project bonus, and additional overtime pay.
Almost half of the companies offer health insurance; corporate events are held by 33% of EU companies and 24% of non-EU companies. Non-EU companies stand out with holiday gifts for colleagues (24%) and tax compensation for contractors and self-employed (20%).

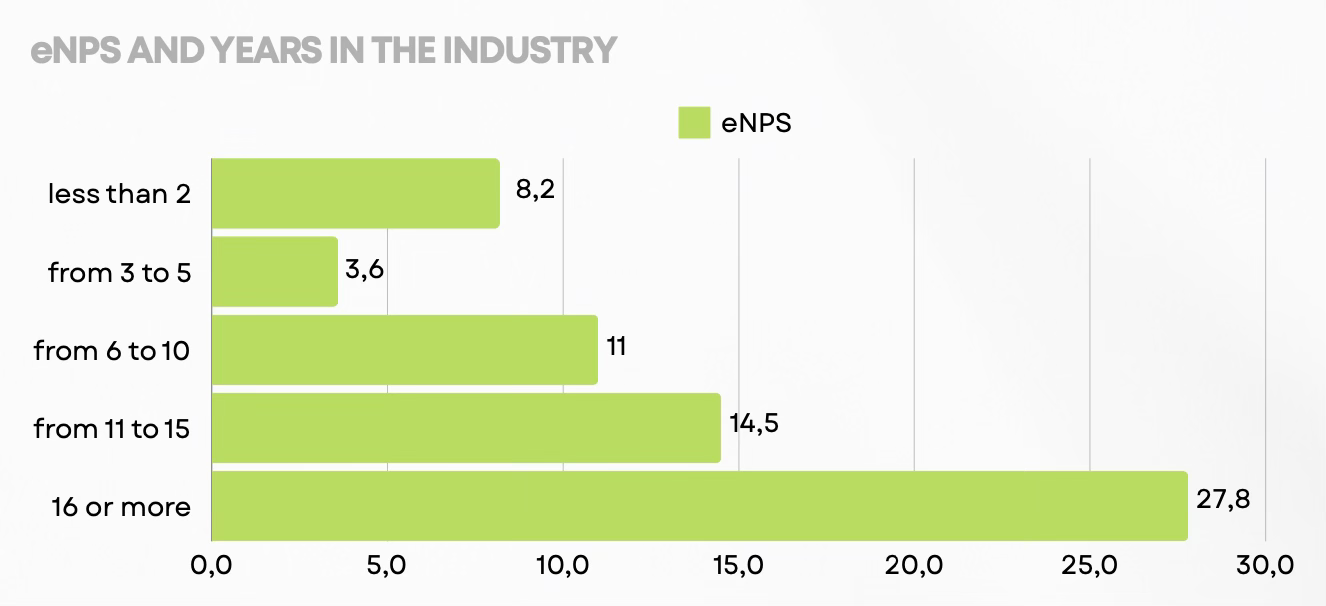
There's a pattern - the longer a person works in the industry, the less likely they are to change jobs. Professionals who have been in the industry for more than 6 years are more loyal to their employers.
The highest employee satisfaction with their workplace is in service companies by a large margin. Publishers and product companies, outsourcers follow. The lowest level of satisfaction is among indie developers and developers collaborating with publishers.

❗️Satisfaction with the workplace has decreased in product companies. This is likely due to the market crisis.
People's attitudes towards overtime have changed. In 2024, they are more tolerant of overtime 1-2 times a week. This is the point after which workplace satisfaction significantly decreases.

Employees feel best in large companies with more than 500 people. The worst - in small teams of 11-50 people.

Only remote or only office work format doesn't make people happier. But a hybrid format does.

When considering non-material bonuses that affect people's happiness, the leaders are - excellent technical support, payment for conference participation, interest-free loans, the possibility of taking a sabbatical, corporate apartments or flats.

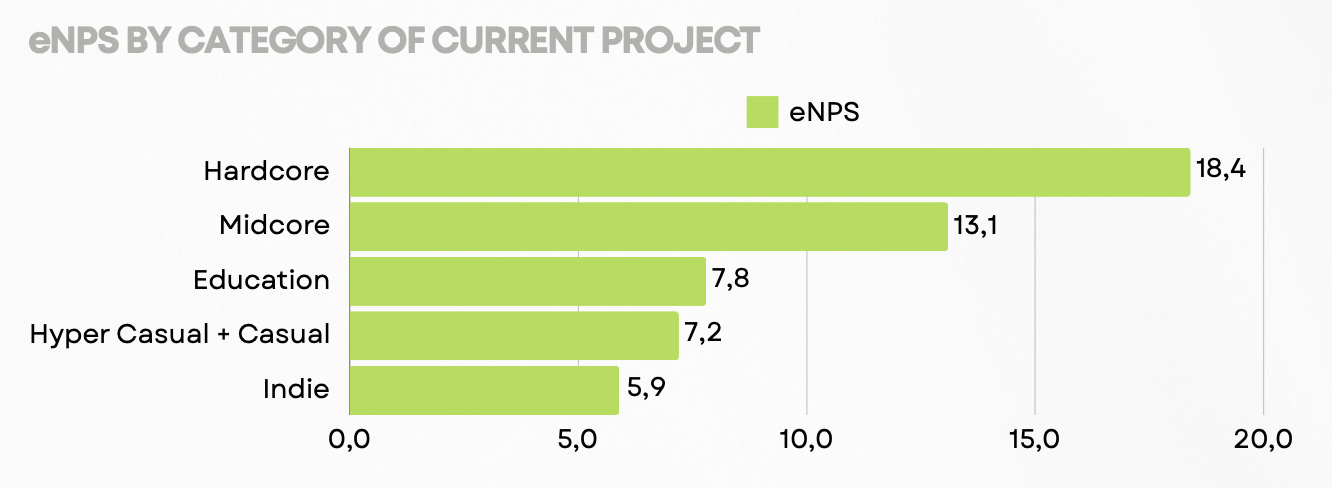
The most satisfied employees are among those working on hardcore and midcore projects in large studios. The most dissatisfied are among indie developers.
Employees who have their pet projects are less loyal and engaged with their employers.
My dear friend Ilya Gutov started Meridian Play - a Gaming Corporate Advisory and Game Accelerator firm focused on fostering cross-border partnerships in the gaming industry between the East and West. Simply put, Ilya is helping developers from the West achieve success in the East. I worked with him, and he knows the ropes. Find more here.
Gender pay gap
Women earn less than men on average. However, female programmers earn more than males, as do HR and recruitment specialists.

Female, on average, wants a lower salary (7% higher than current) than male (54% higher than current).
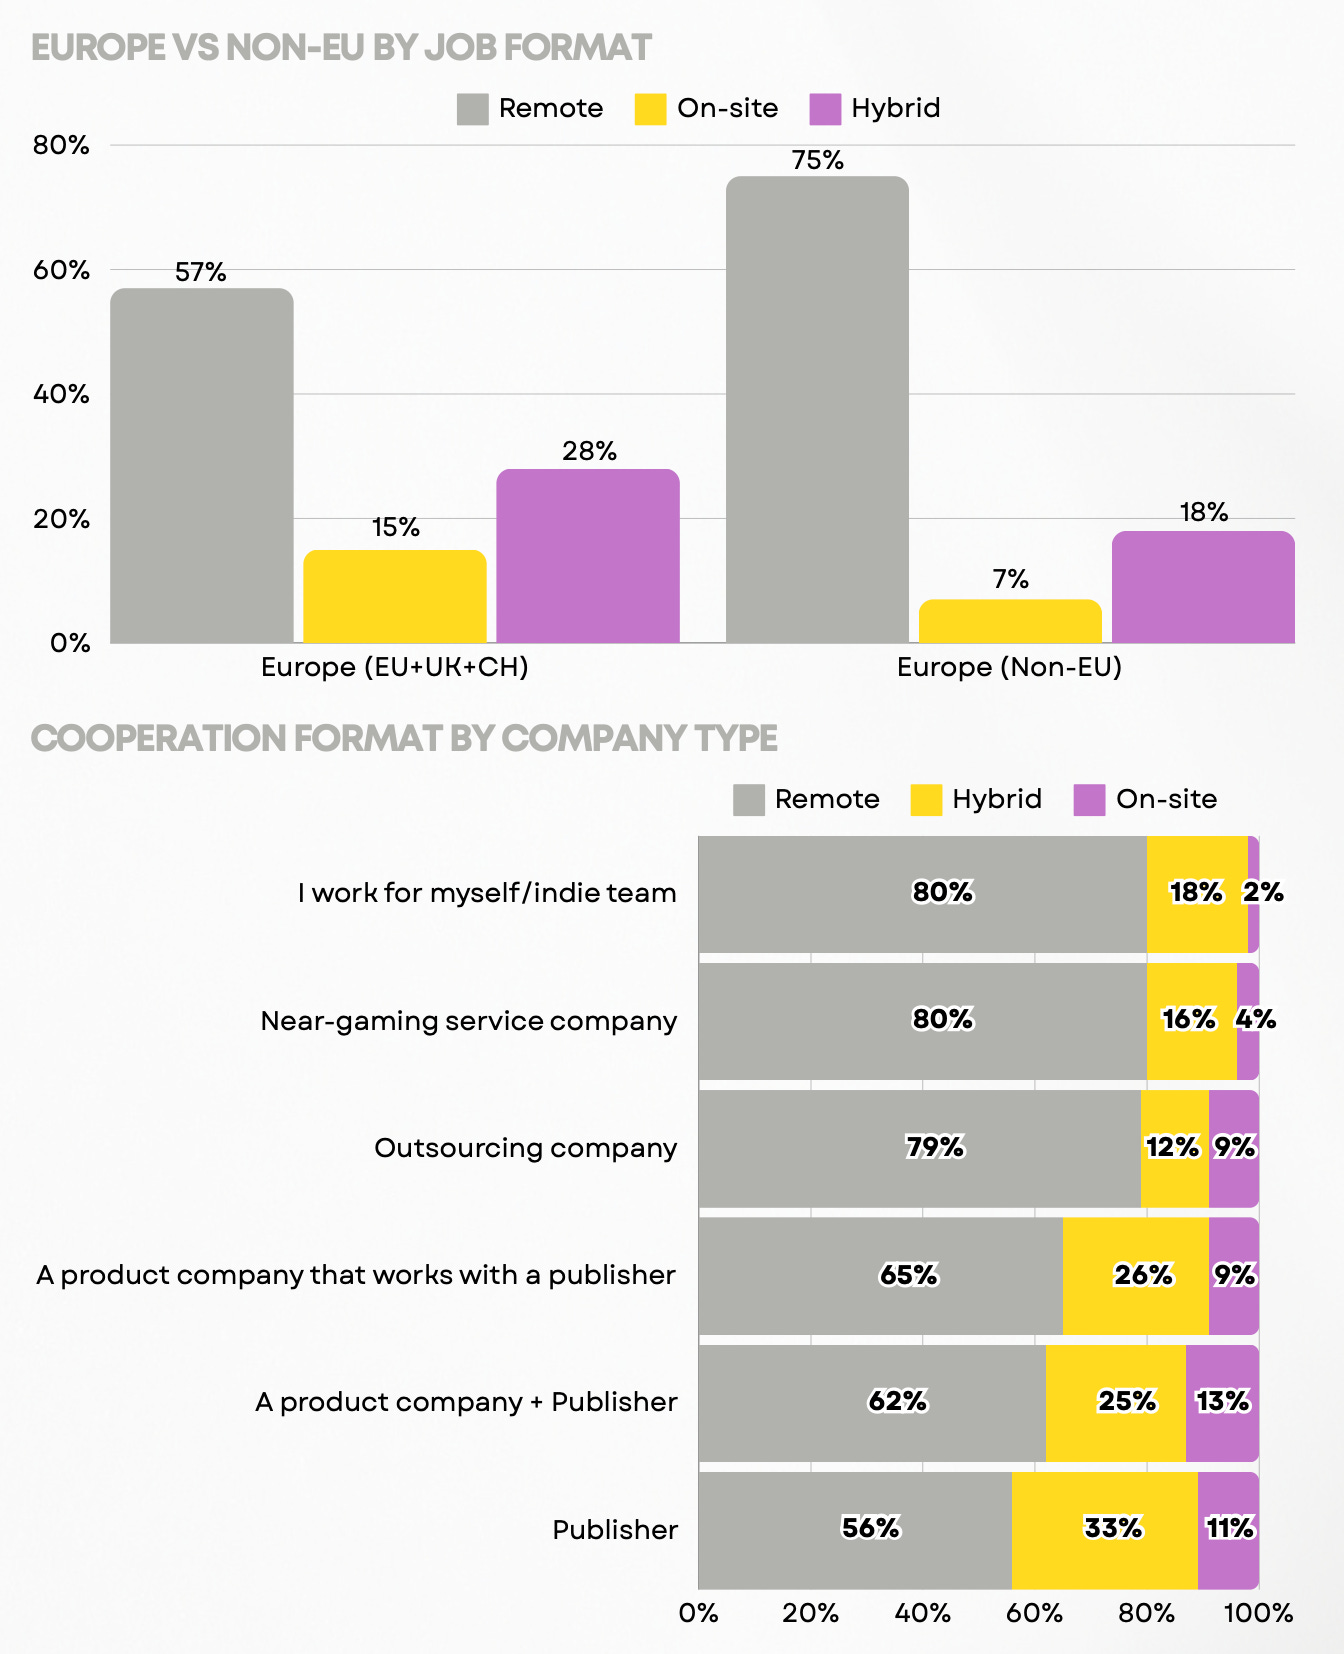
Corporate work
57% of EU companies and 75% of non-EU companies offer remote work options. Publishers and developers offer the least remote format.
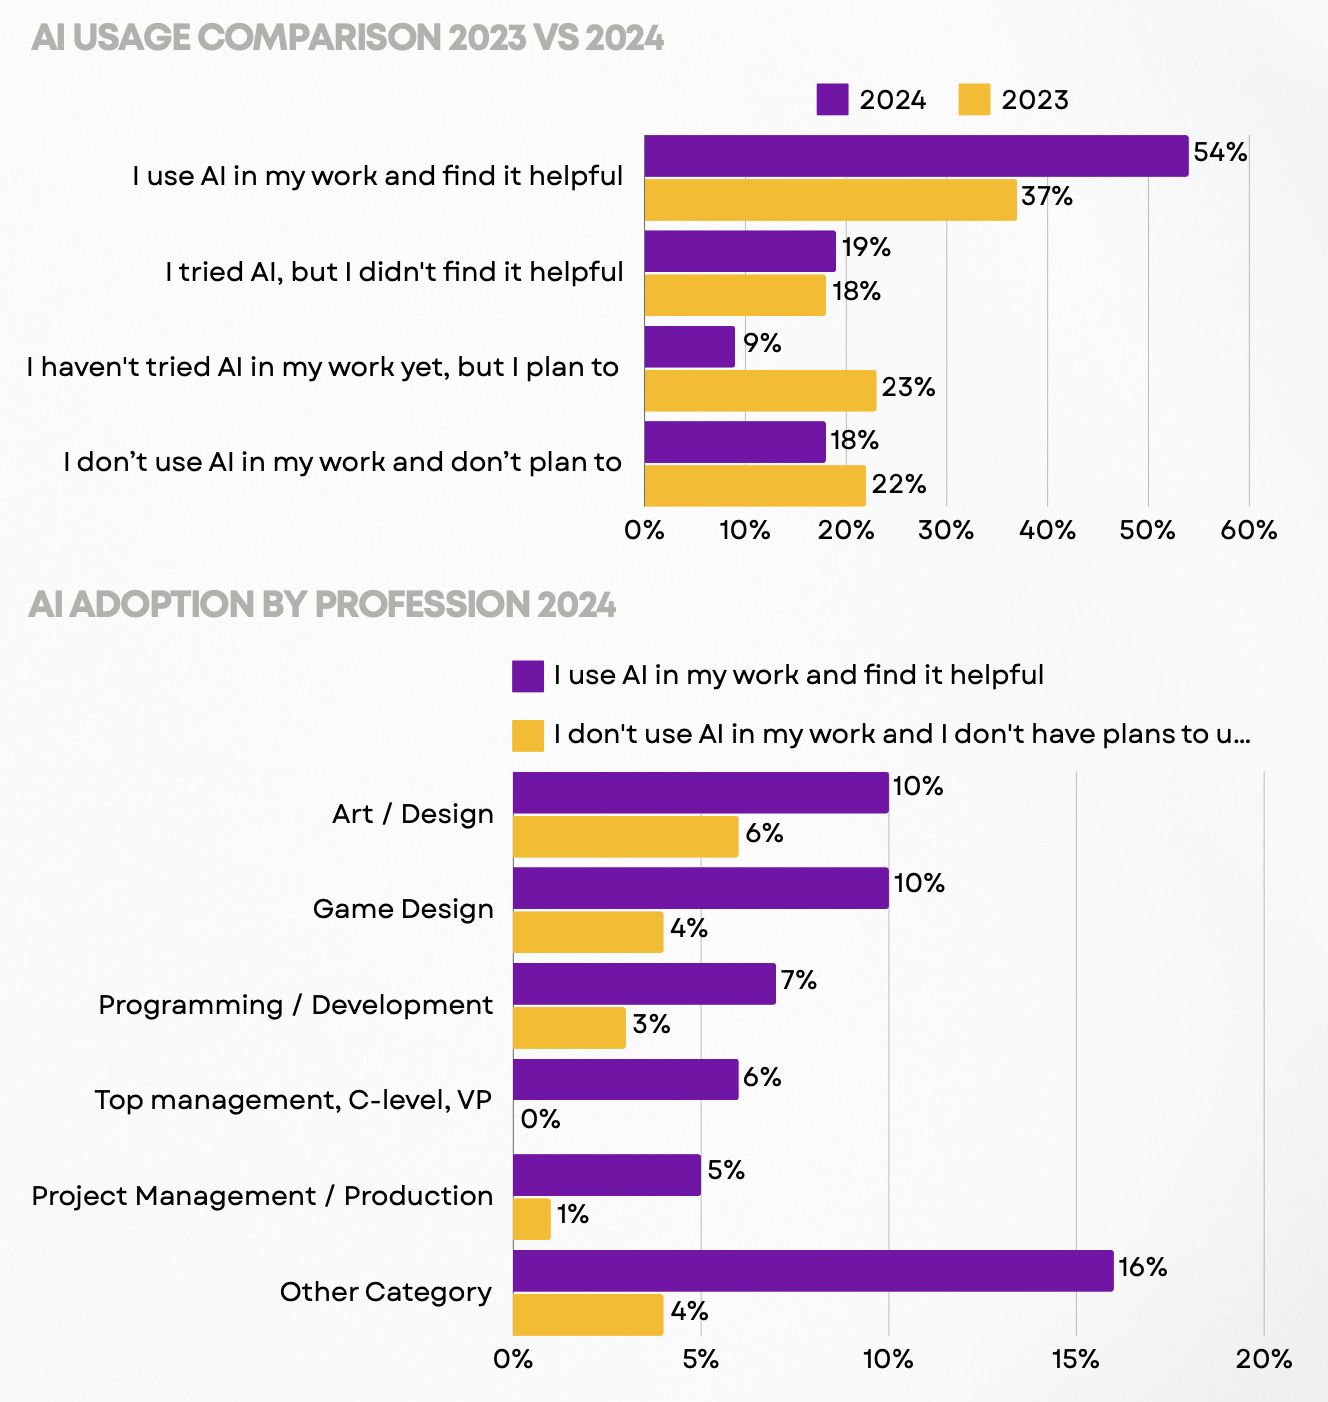
Users' attitudes towards AI are changing significantly. The number of people who use AI at work and find it useful has increased. However, the percentage of people for whom AI is not useful has increased by 1% compared to 2023. Artists/designers and game designers use AI the most.
Job Changes and Layoffs
The lower the classification level, the higher the probability of being laid off - according to employees themselves.


Localization workers, sound specialists, artists, QA specialists, and project management representatives express the greatest concern about their future. People from PR and media worry the least.
Men and women equally assess their risks of being laid off.

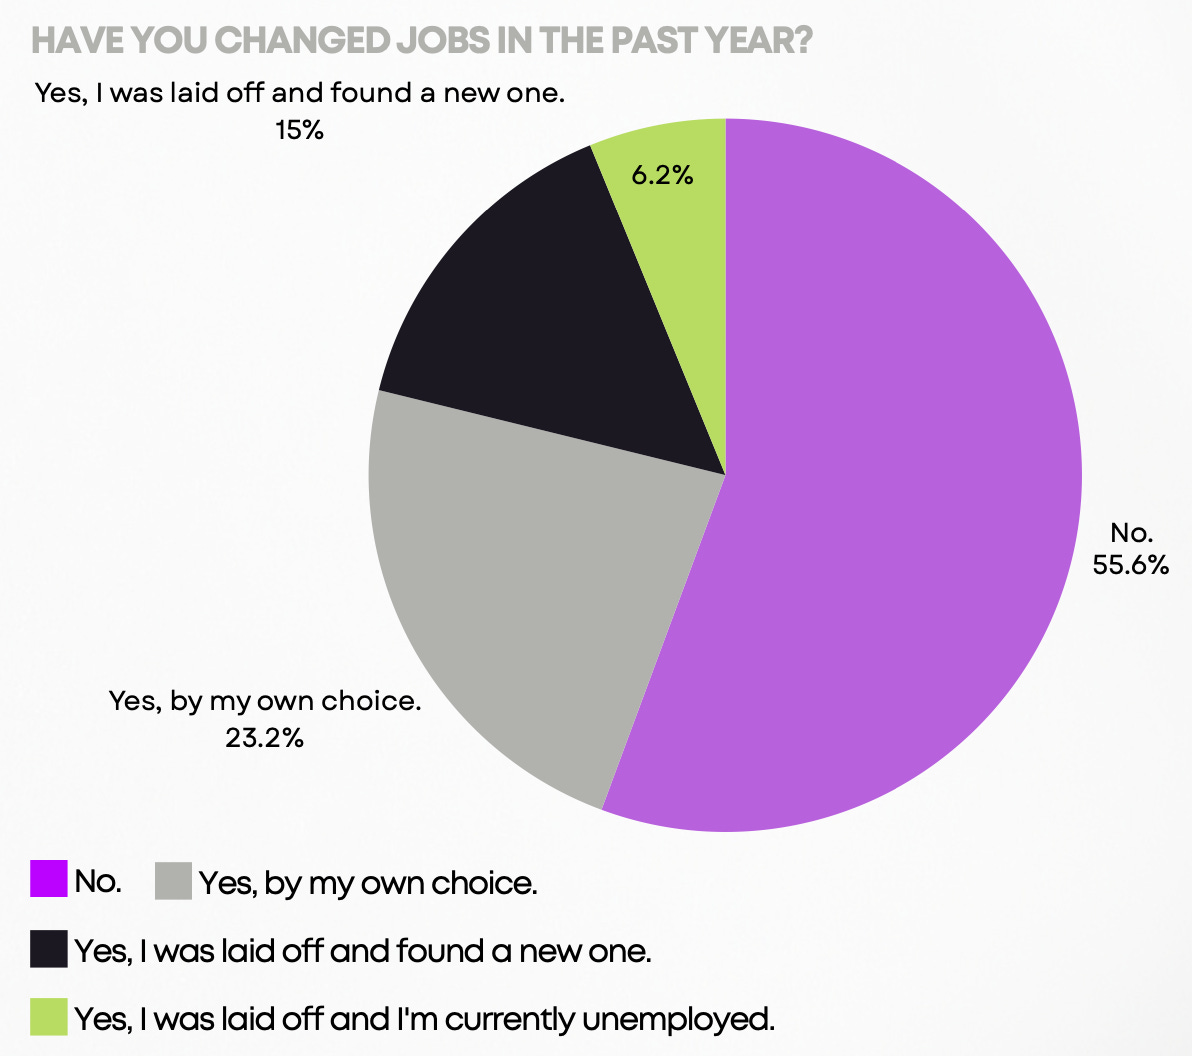
55.6% of respondents did not change jobs in the last year. 23.2% changed voluntarily. 15% were laid off and found a new place. 6.2% were laid off and haven't been able to find new work yet.
The main reasons for changing jobs are - desire to earn more (65-66%), desire for professional growth (53-54%), desire for career growth (47-49%), desire to work on more interesting projects (43-45%).

55.2% look for work for up to 3 months; 24.4% - from 3 to 6 months; 12.3% - from 6 months to a year; 8.1% - more than 1 year.

Top managers and people from project/product management spend the least time job searching. QA specialists have the most difficulty.


Junior specialists take the longest to find a job.
Consider subscribing to the GameDev Reports Premium tier to support the newsletter. Get access to the list of curated articles & archive of Gaming Reports that I’ve been collecting since 2020.
A third of Junior specialists left the gaming industry after leaving or being laid off from their current jobs. Among Middle and higher specialists, no more than 11% did so. A quarter of Middle and Senior specialists agreed to a salary reduction.


Physical and Mental Health in the Gaming Industry
33% of gaming companies have employee development plans. 10.2% plan to integrate them.

Product companies, publishers, and non-gaming service companies have the most employee development programs. There is a direct correlation with company size (larger companies have programs).

In companies where employee development systems exist or are planned, employee loyalty and job satisfaction are higher.

Interestingly, top management representatives feel their development best. Juniors, more often than others, feel they are stagnating.


31% of workers work overtime more than once a week. Top management and Junior specialists have the most frequent overtime.

More than a third of employees are okay with overtime if it makes sense. 8% refuse overtime.


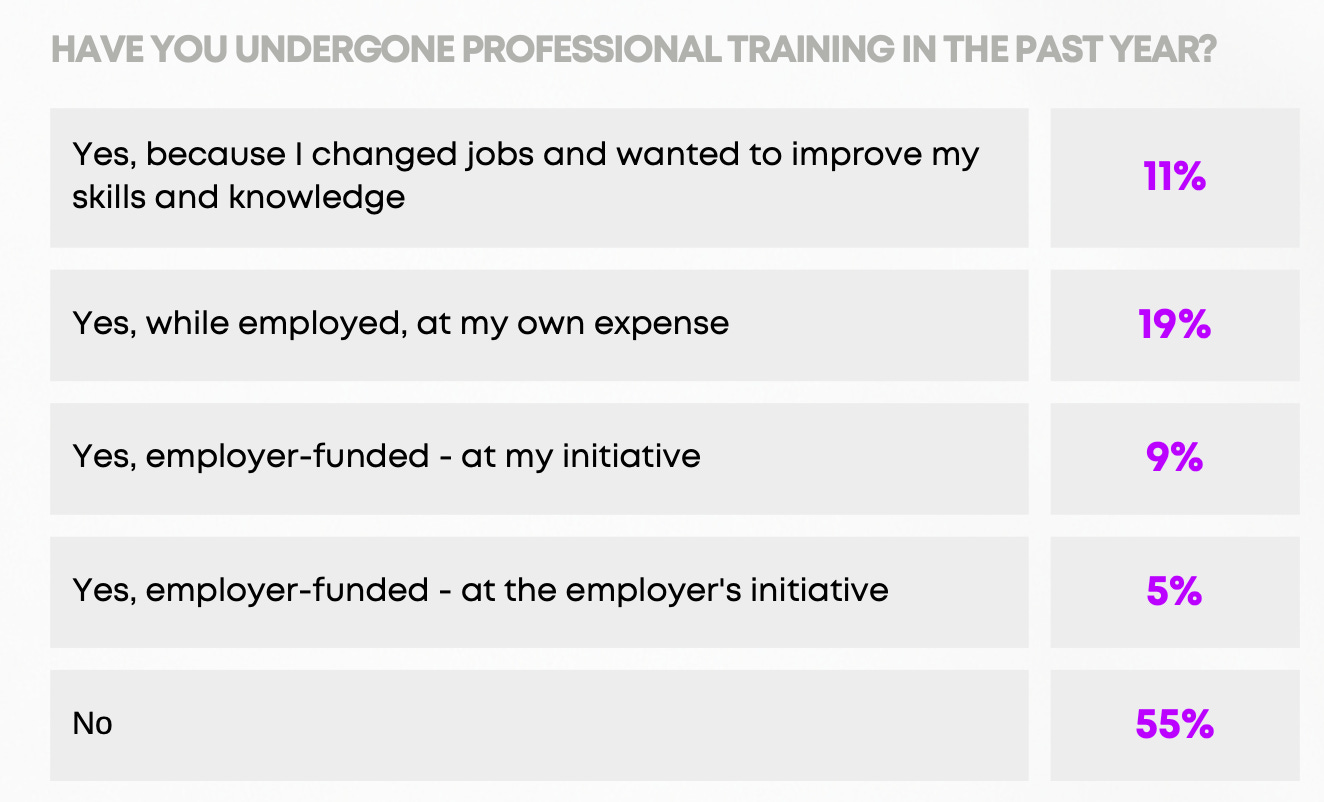
55% did not undergo any professional training in the last year. Only 14% of employees had their training paid for by companies.
Most companies don't have inclusivity specialists. More than half of the companies have no such plans.


32% of employees have faced gender discrimination; 26% - age discrimination; 17% - discrimination based on place of birth; 17% - language discrimination.


However, half (49%) observed gender discrimination; 34% - age discrimination.
The most important problems for employees in the workplace are burnout (more than half of employees noted this) and unprofessional or ineffective management (half of employees noted this as a problem).

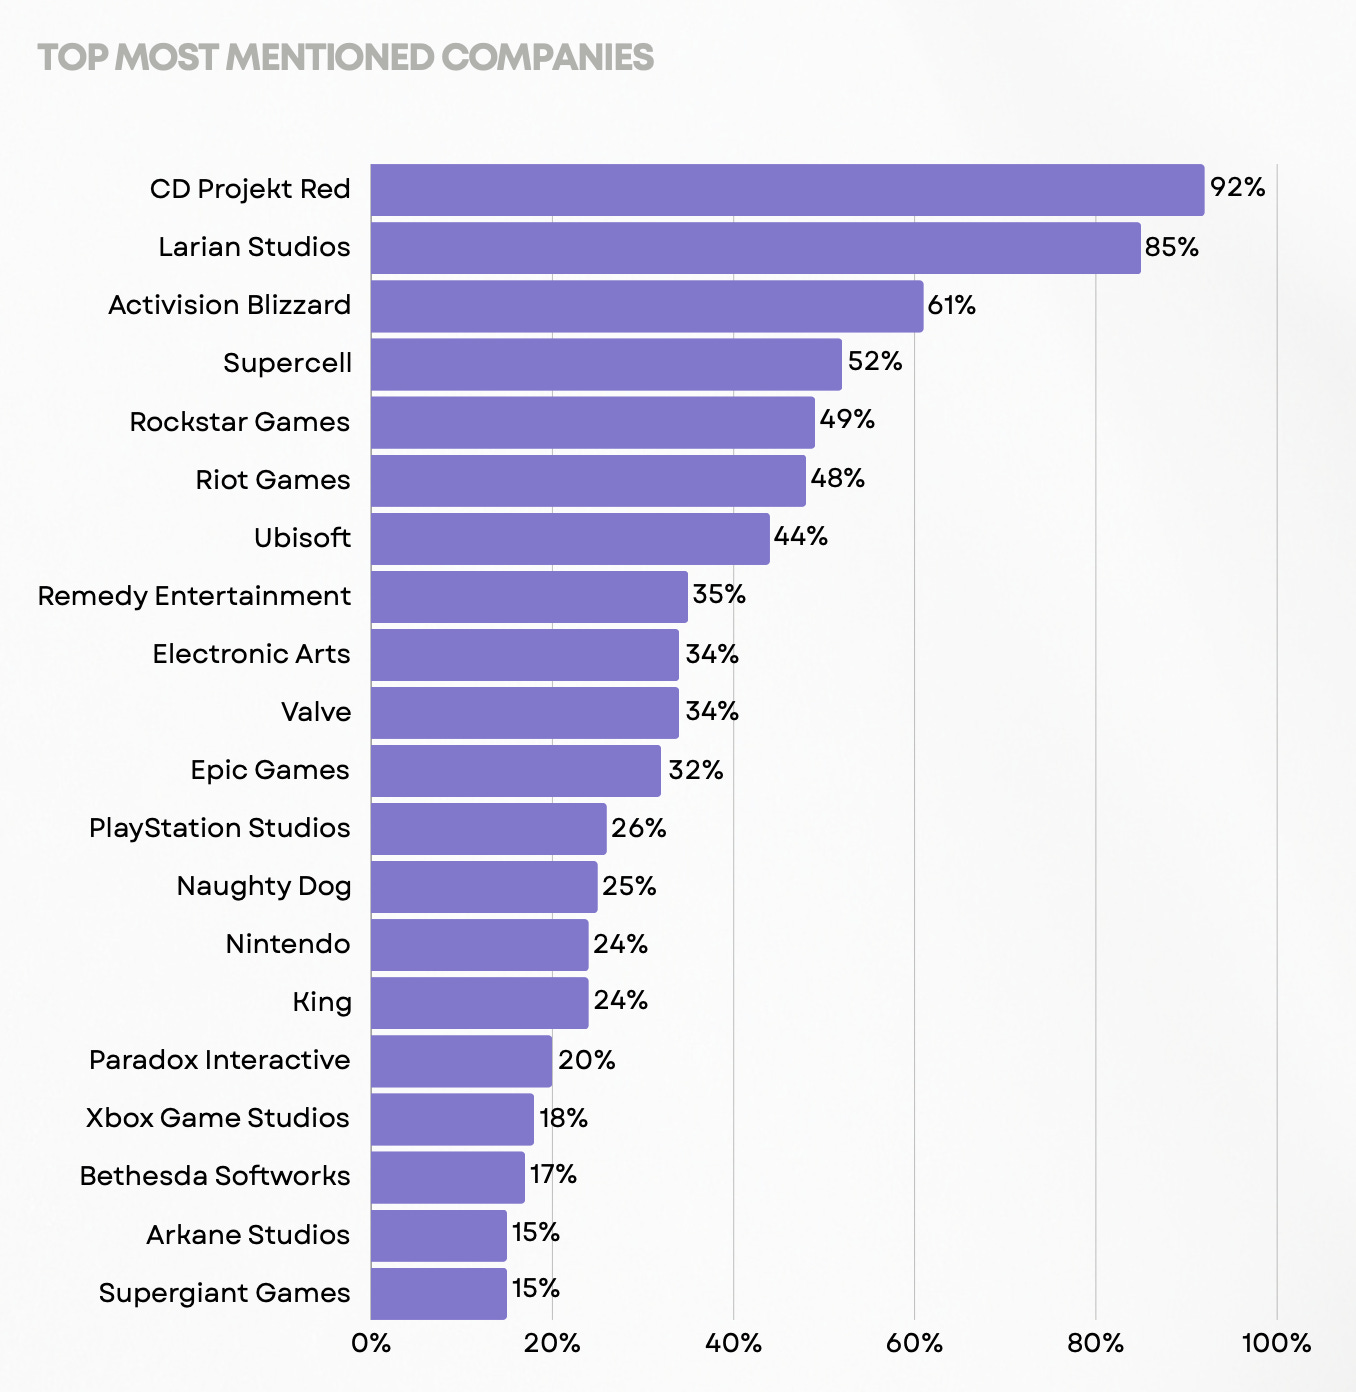
92% of respondents would like to work at CD Projekt RED, 85% - at Larian Studios.
TIGA: The UK Gaming Industry stays resilient and continues to grow

Over the 12 months from April 2023 to May 2024, the UK gaming industry grew by 4.8% YoY.
More than 28,500 people in the UK are professionally involved in game development. Of these, 3,625 are freelancers (their number has increased more than 3 times, apparently, companies are switching to contract work to optimize costs). Overall, the number of people employed in the UK gaming industry increased by 13.9%.
The number of new jobs exceeded the number of layoffs. From April 2023 to May 2024, 3,932 full-time vacancies were opened. During the same period, 2,353 positions were cut.
Consider subscribing to the GameDev Reports Premium tier to support the newsletter. Get access to the list of curated articles & archive of Gaming Reports that I’ve been collecting since 2020.
The number of game studios in the UK decreased from 1,801 in April 2023 to 1,757 in May 2024.
248 gaming companies decided to close during the survey period. This is 10.4% of all gaming companies in the country - a record (anti-record?).
In the period from April 2023 to May 2024, 166 startups were launched. In the previous year, there were 251 such companies.
Companies owned by foreign shareholders employ 62% of all workers in the UK industry.
WKO: Austrian Gaming Industry in 2024

There are about 150 gaming companies operating in the country. This is 71.3% more than in 2018.
In 2023, the revenue of Austrian gaming companies amounted to €188.7 million.
Gaming companies have created around 2,260 jobs in the country.
Most employees in gaming companies in the country are between 25 and 34 years old. 80% of them have completed university education.
The main platforms for Austrian developers are PC and mobile devices.
One-third of local gaming companies have applied for government support.
Lumikai & Google: Indian Gaming Market to Grow to $9.2B by 2029

Overall market state
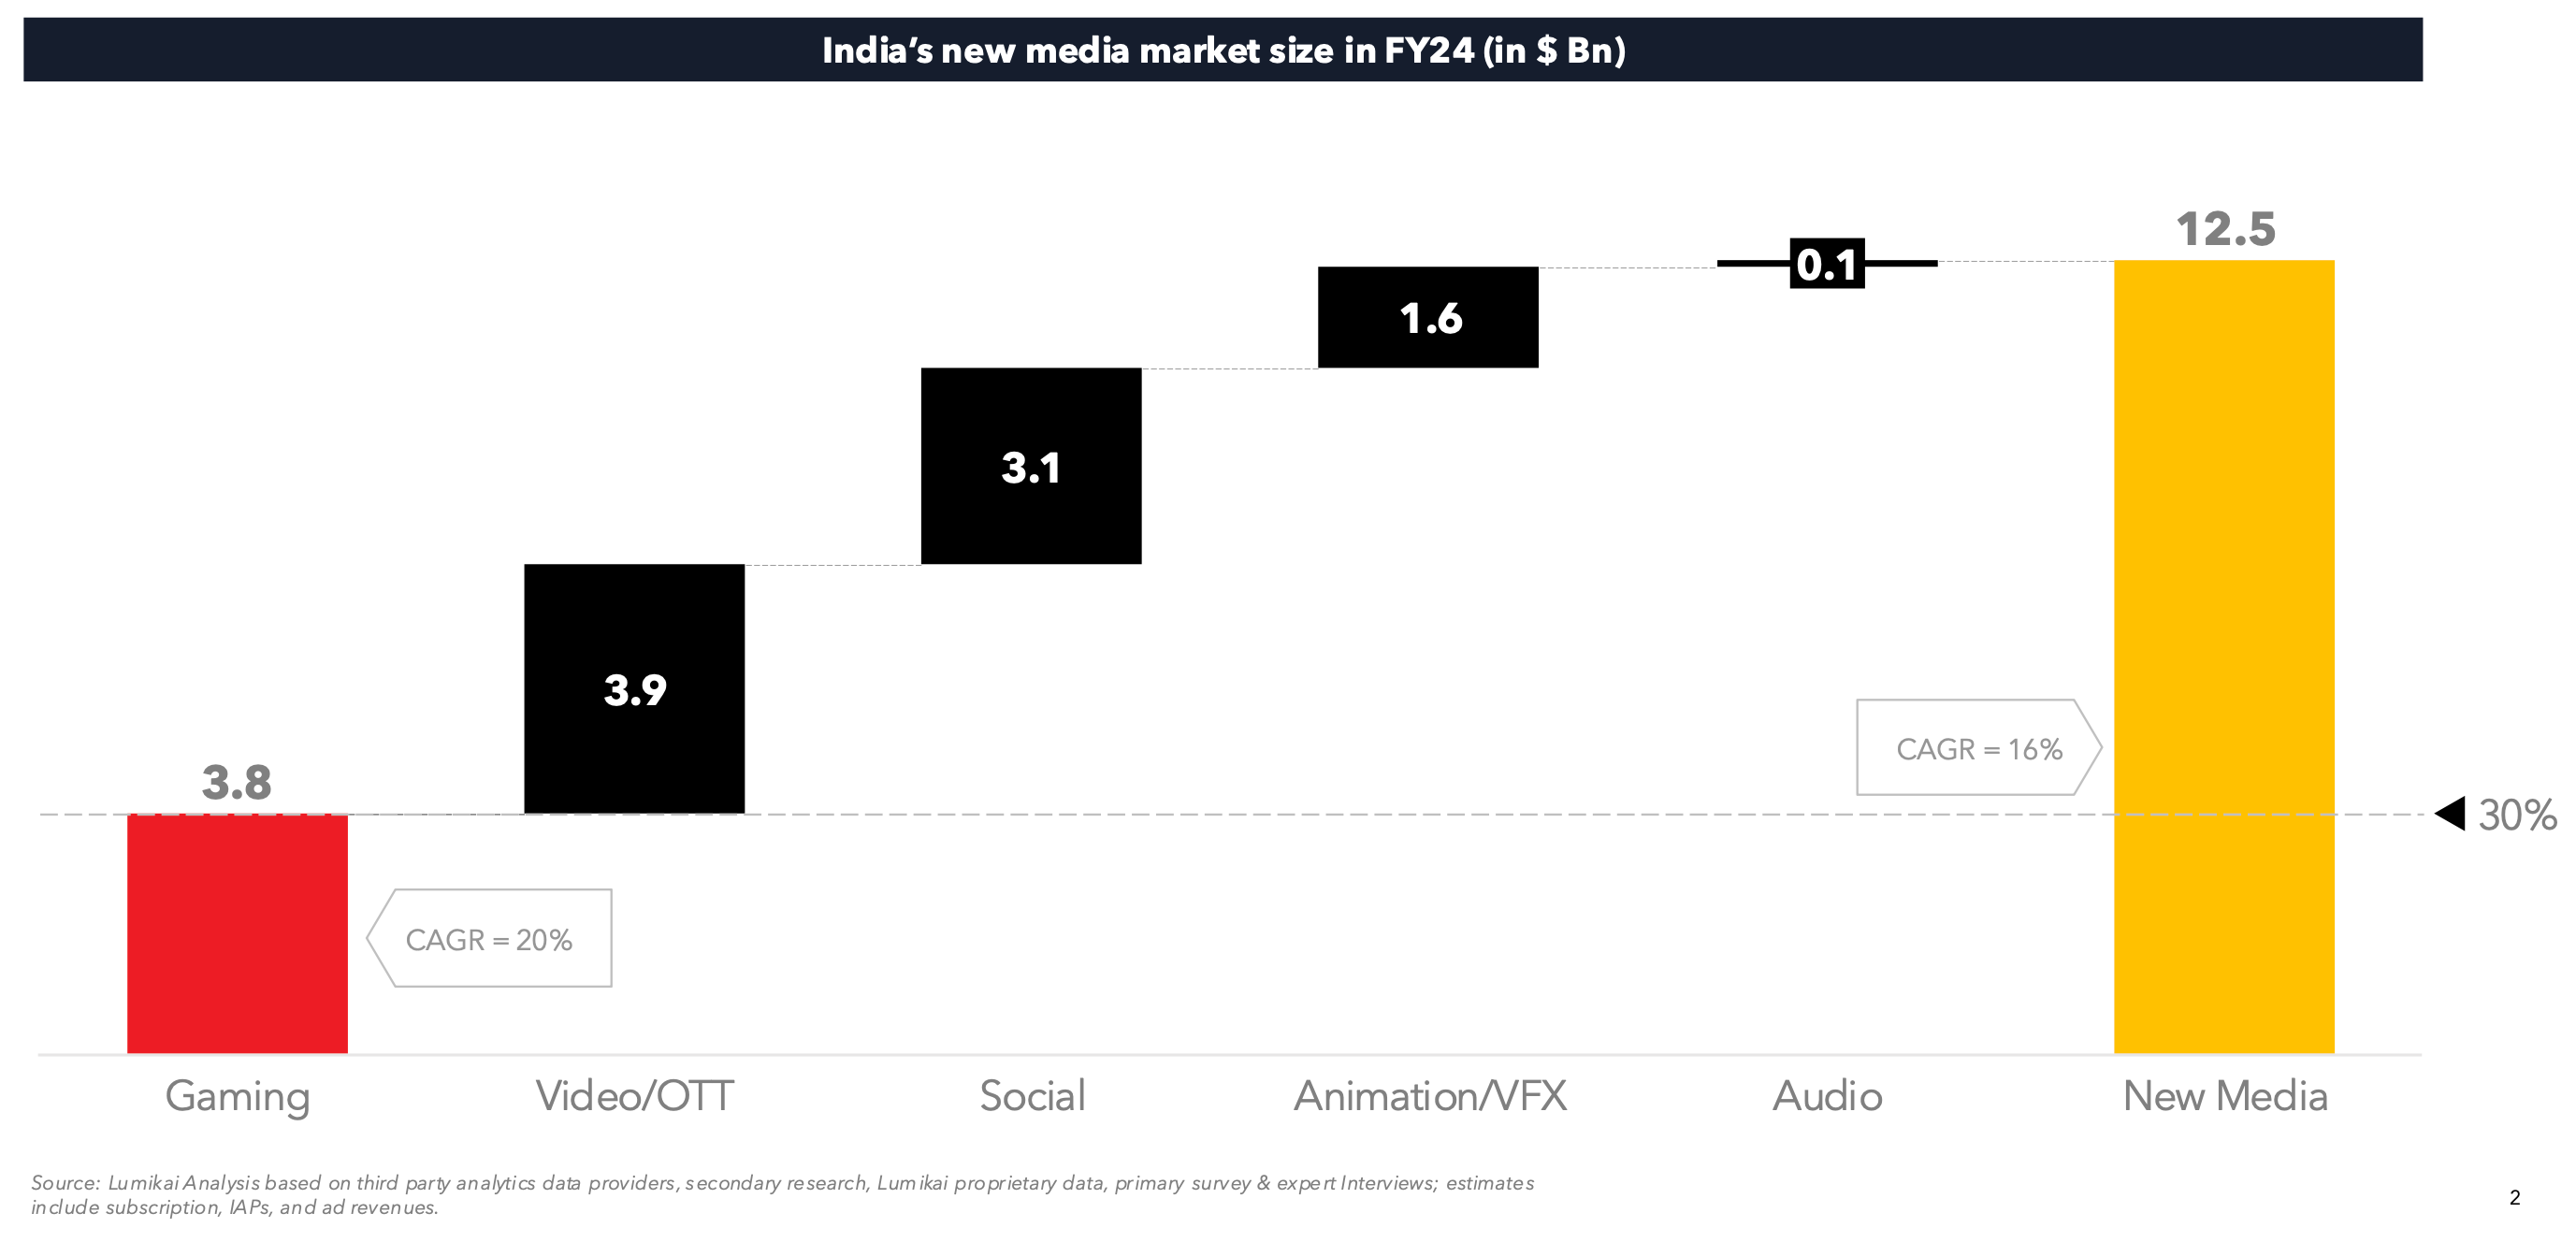
India's gaming market is estimated to reach $3.8 billion in 2024, accounting for 30% of the entire "new media" market, which includes video/OTT, social media, animation, and VFX services, and audio.
It's important to note that as of 2024, 63% of India's gaming market consists of Real-Money Gaming.
By the 2029 fiscal year, the Indian market is expected to reach $9.2 billion, showing a 20% 5-year compound annual growth rate (CAGR). In-game purchases will grow the fastest (44% CAGR), followed by advertising (15% CAGR). The RMG segment's growth will slow down to 8% per year.

By 2029, the size of the traditional gaming market in India is expected to be almost twice the size of the RMG segment.
In 2024, India will have 591 million gamers. This is the second-largest market in the world for game downloads, 3.5 times larger than the USA and Brazil. The average weekly gaming time increased from 10 hours in 2023 to 13 in 2024.

Revenue
Revenue from IAP (In-App Purchases) in mid-core games grew by 53% year-over-year. The biggest growth was seen in Battlegrounds Mobile India, Garena Free Fire Max, and Clash of Clans, speaking of midcore.

IAP revenue for casual and hypercasual games grew by 10%.
Changes in RMG game regulations in India led to a 50% decrease in profitability and a 30% decrease in margins. 25% of companies in the segment reported financial difficulties. Despite this, the segment grew by 20% in 2024.
Consider subscribing to the GameDev Reports Premium tier to support the newsletter. Get access to the list of curated articles & archive of Gaming Reports that I’ve been collecting since 2020.
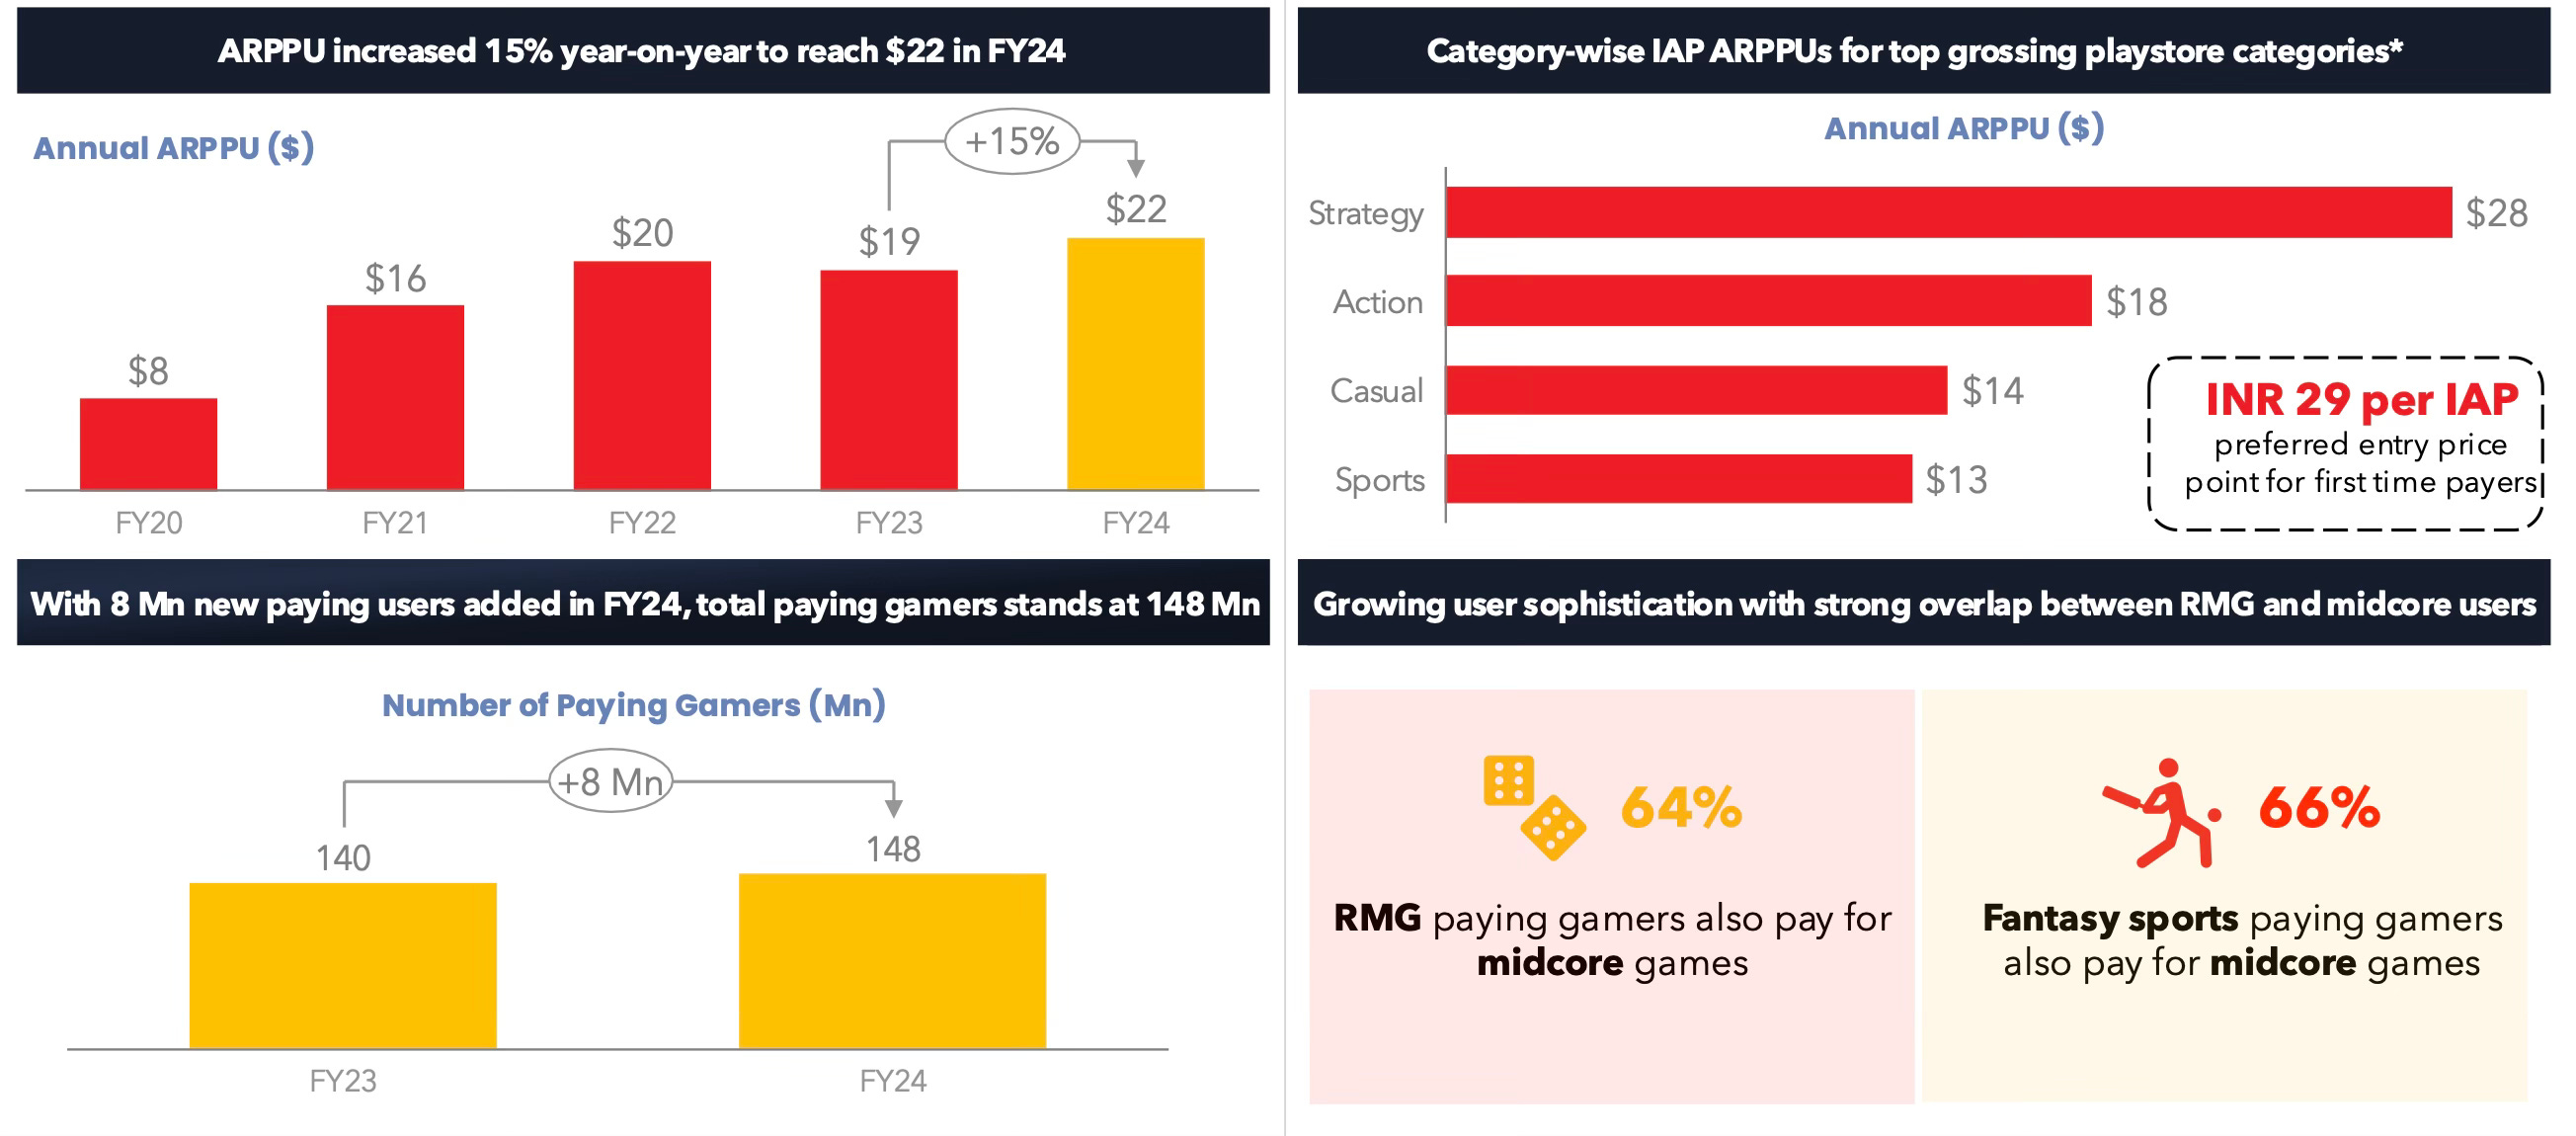
In 2024, the annual ARPPU of an Indian gamer was $22 - 15% more than in 2023.
The number of paying players reached 148 million, which is 25% of the total number of players. More than 60% of RMG players also pay in mid-core games.
❗️The report does not specify whether these figures include the RMG segment.
Player Profile
56% of players are male; 44% are female (up from 41% last year).
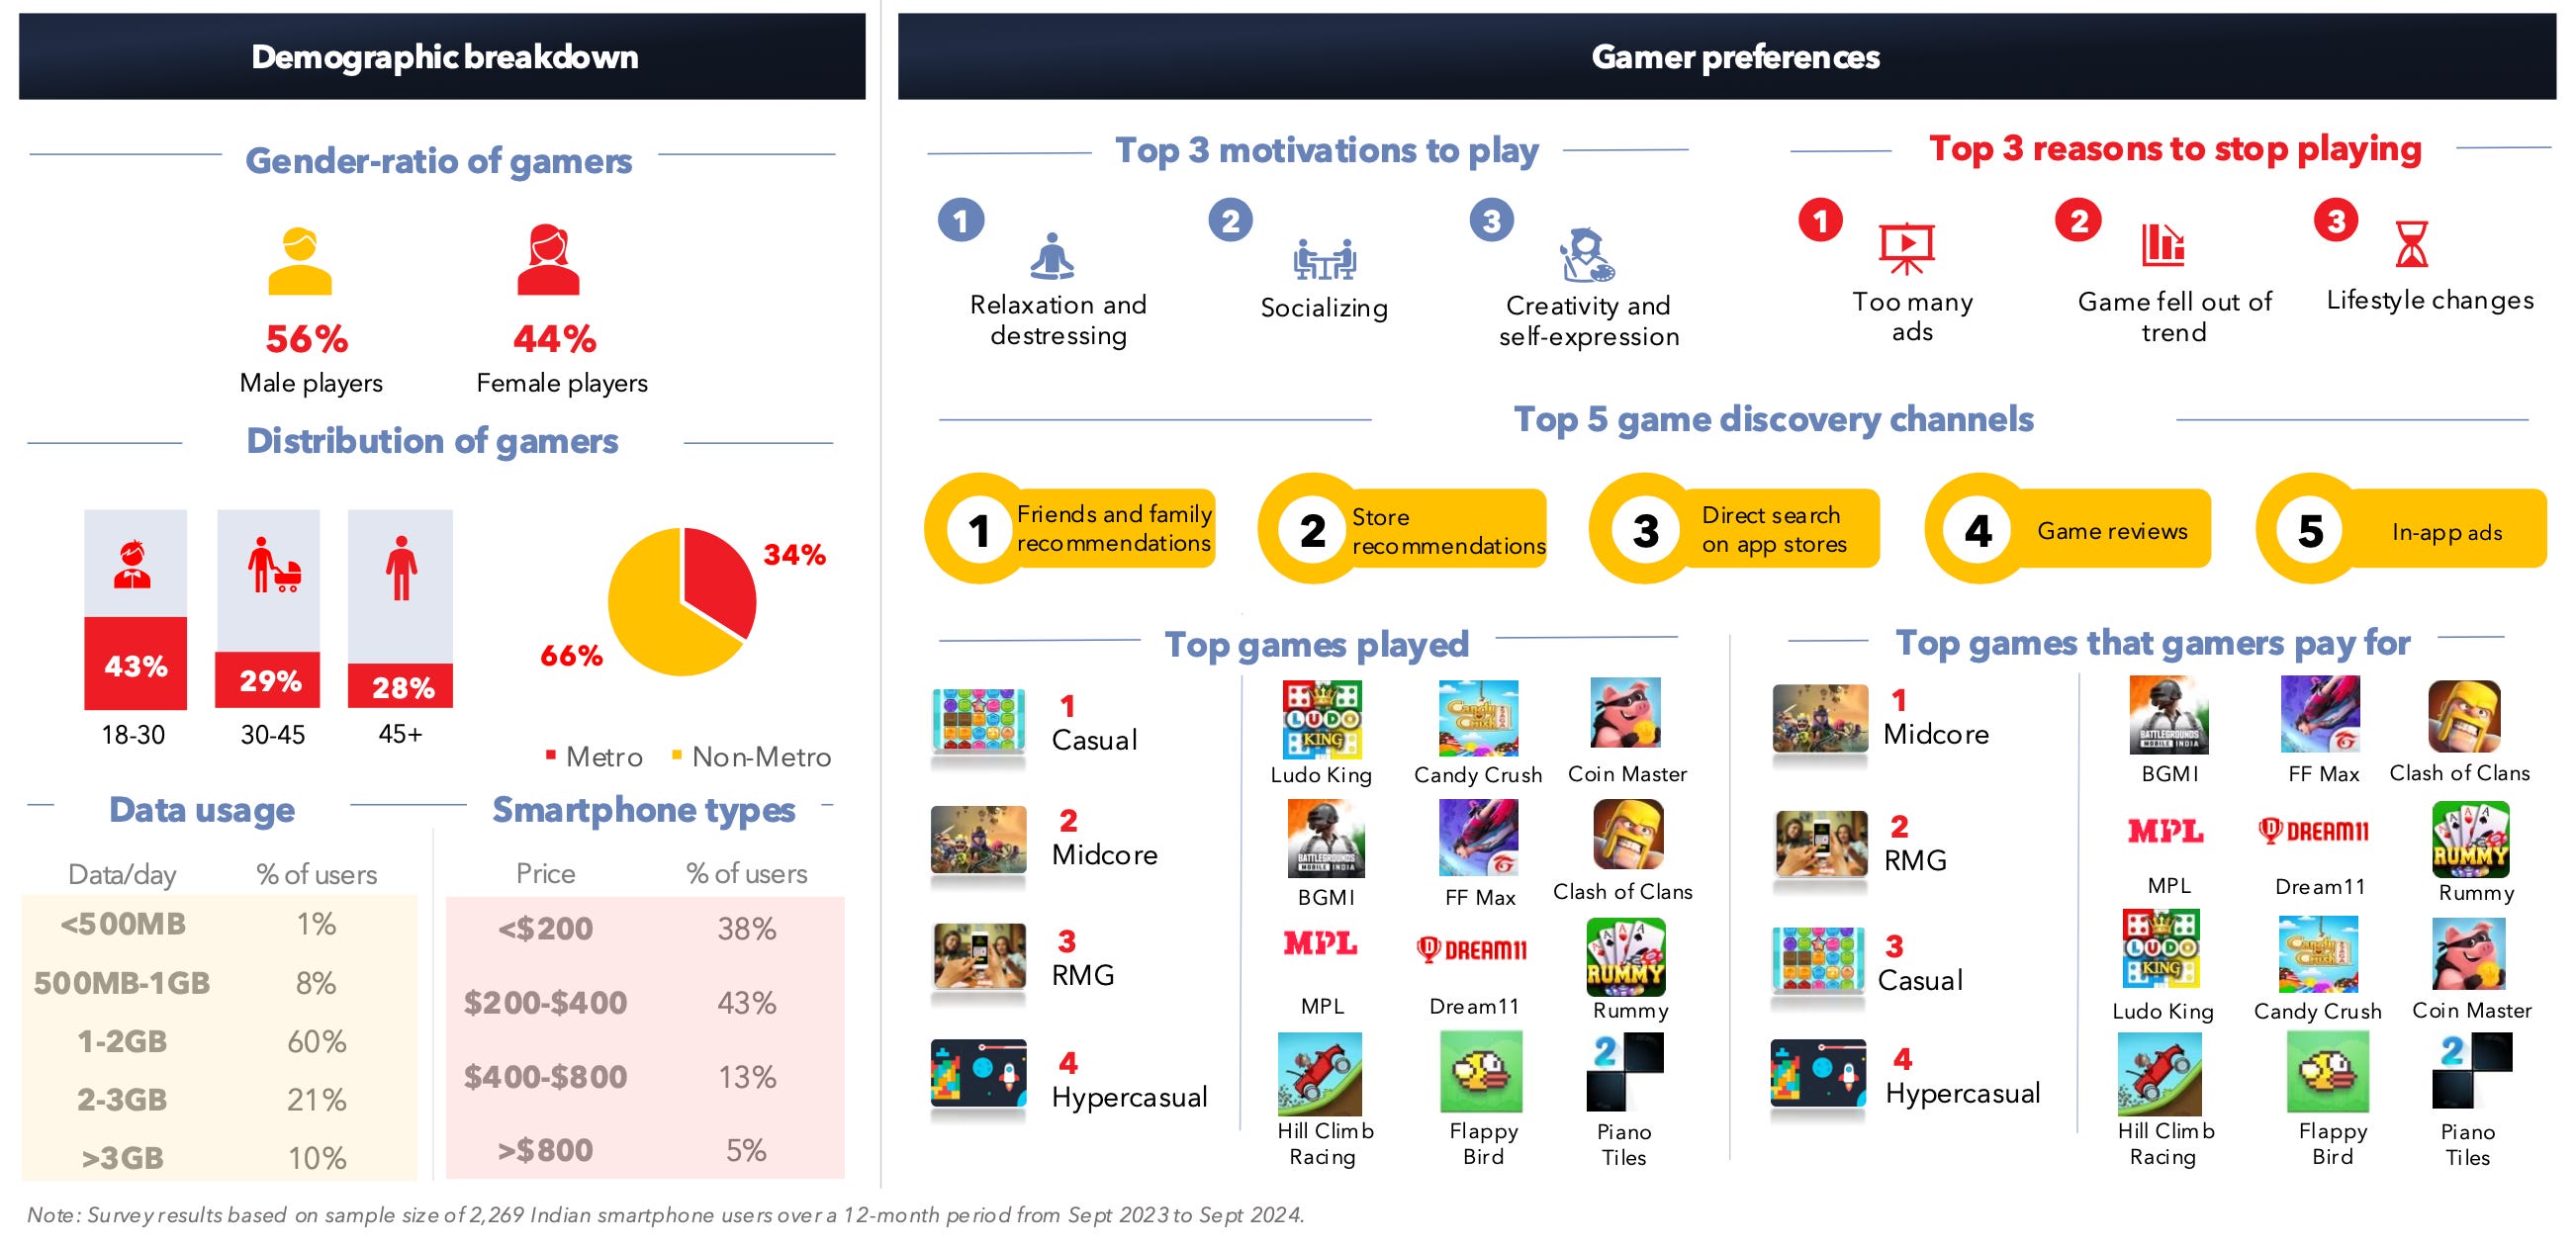
43% of players are aged 18 to 30; 29% are 30 to 45; 28% are over 45.
66% of players live outside large metropolitan areas.
The vast majority (81% of players) have smartphones costing no more than $400. 90% of the audience uses no more than 3GB of mobile data per month.
People played 20% more casual games in 2024. 25% of users noted that they started spending more money.

83% of users use UPI and digital wallets for payments. Bank card penetration is 16%.
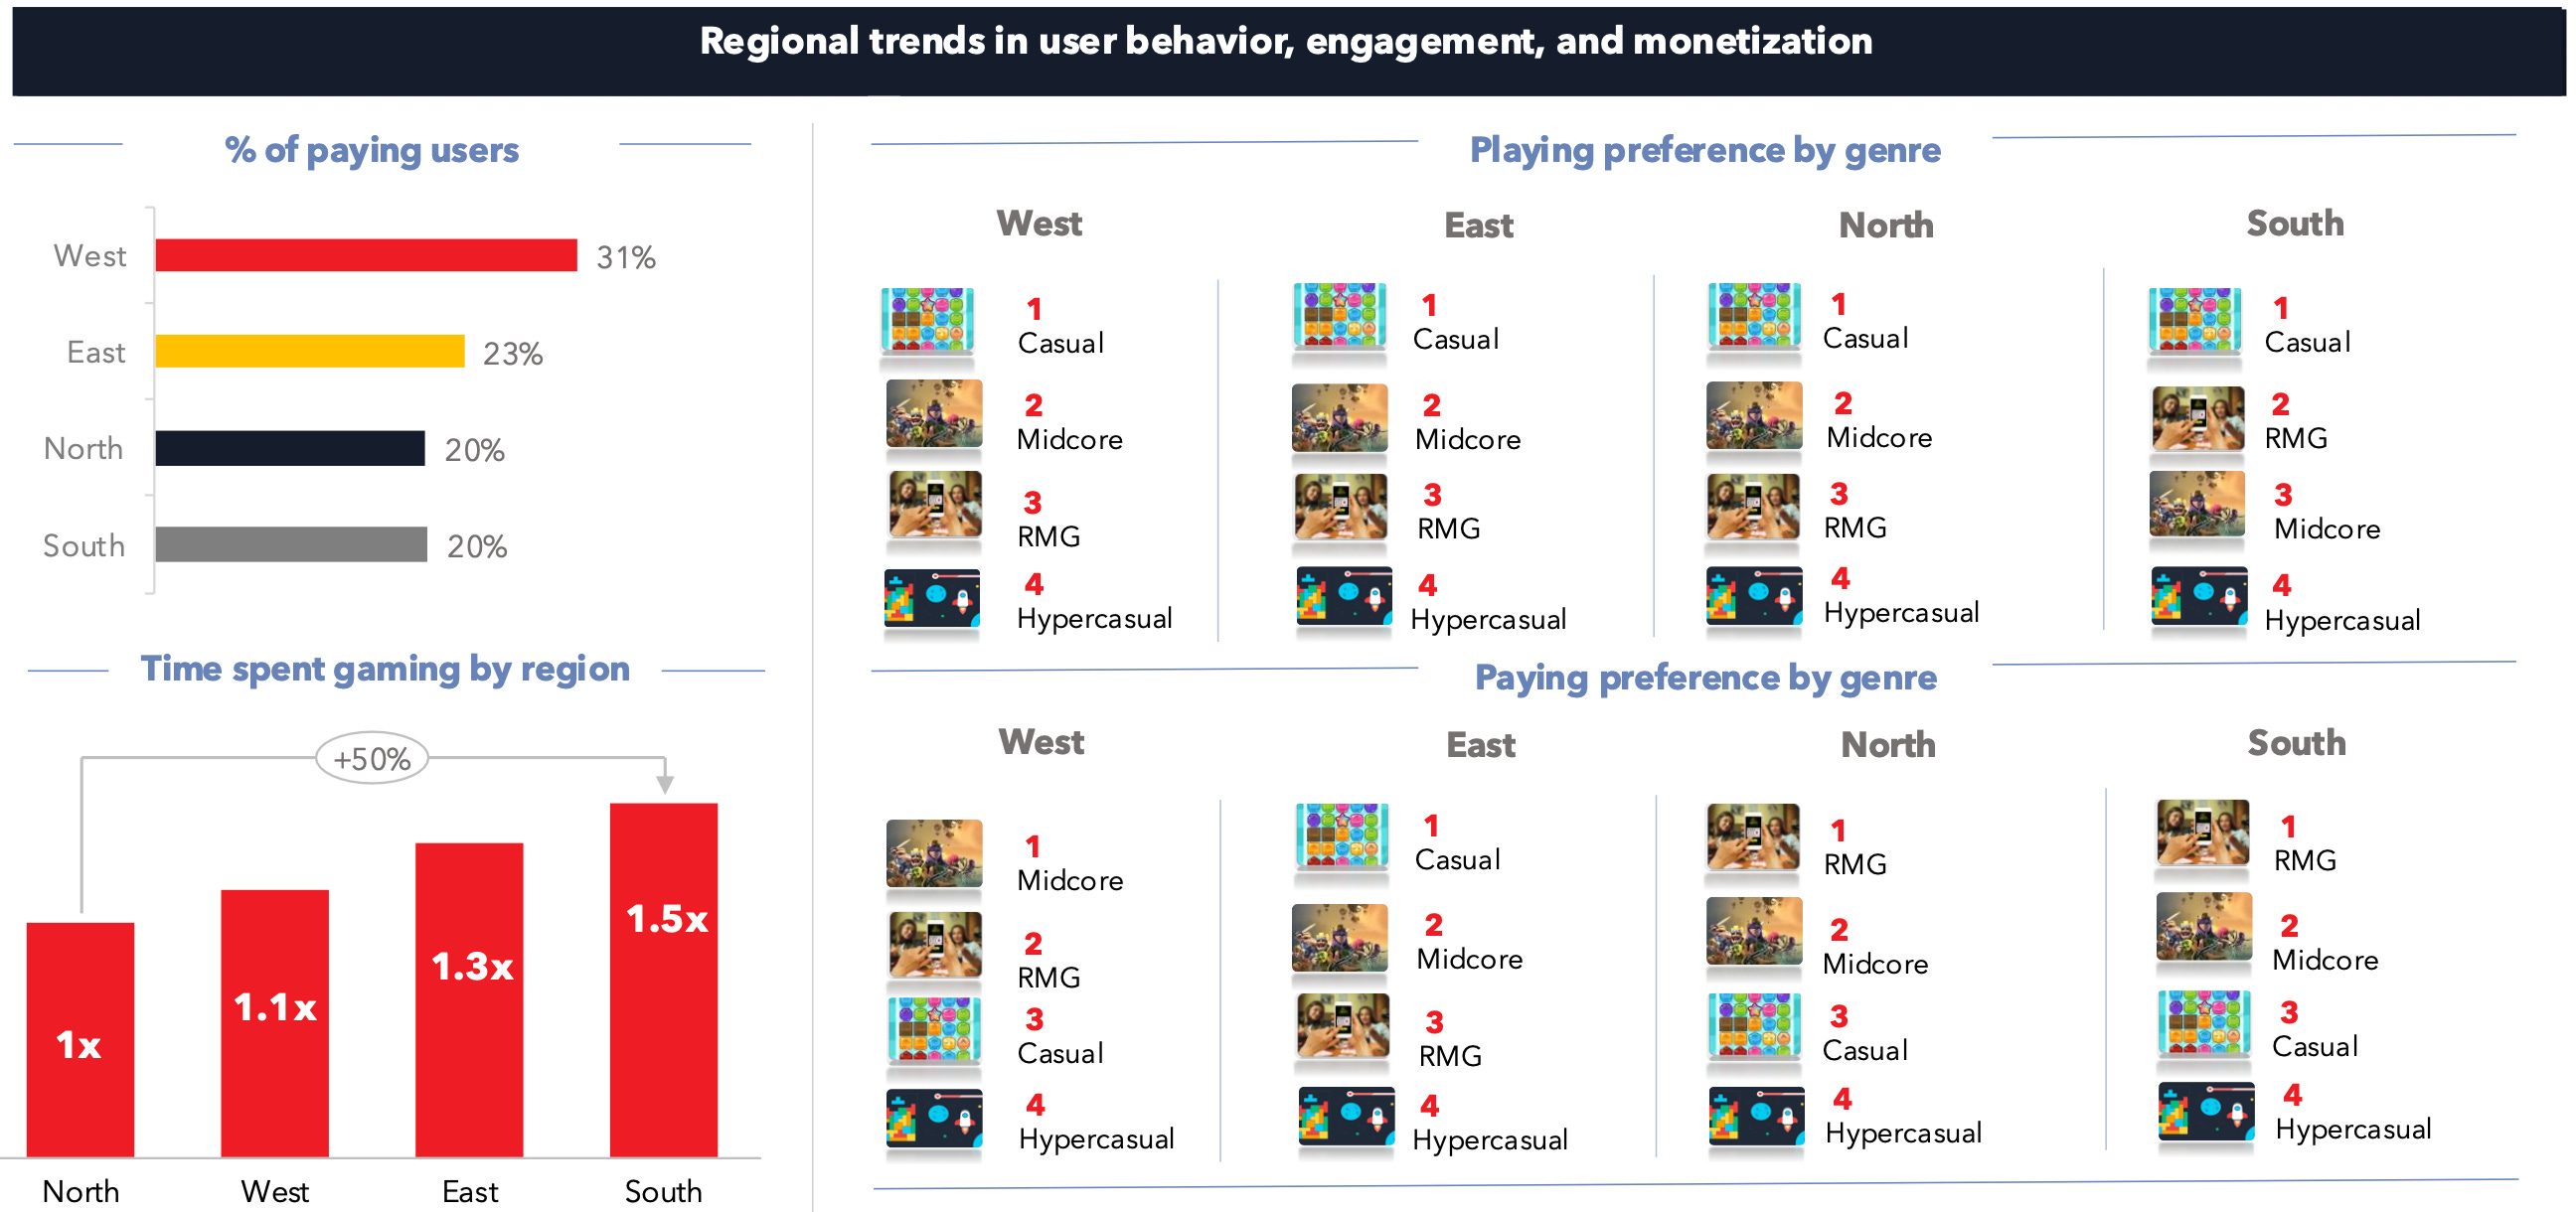
The highest percentage of paying users is in the western part of India. The most active players are in the south.
47% of users are willing to encounter ads to avoid paying for a subscription.
Sensor Tower: Popularity of Puzzles is growing in the South Korean Market

As of 2024, the share of puzzles in total downloads reached 23%, while the revenue share was 7.5%. This is the highest in the last 7 years.

In terms of downloads, puzzles are the largest genre in South Korea. In terms of revenue, puzzles are in third place, behind RPGs and strategy games.
The top 5 by downloads in 2024 are Block Blast!; Royal Match; Melon Maker: Fruit Game; Wood Nuts & Bolts Puzzle and Sudoku. Melon Maker: Fruit Game is the first Korean game since 2020 to make it into the top.

The revenue leader is Royal Match. In 2024, the game earned around $90 million in the country. South Korea is the 5th market by revenue for the project and 12th by downloads.

ESA: 76% of American children want gifts related to video games for the Holidays
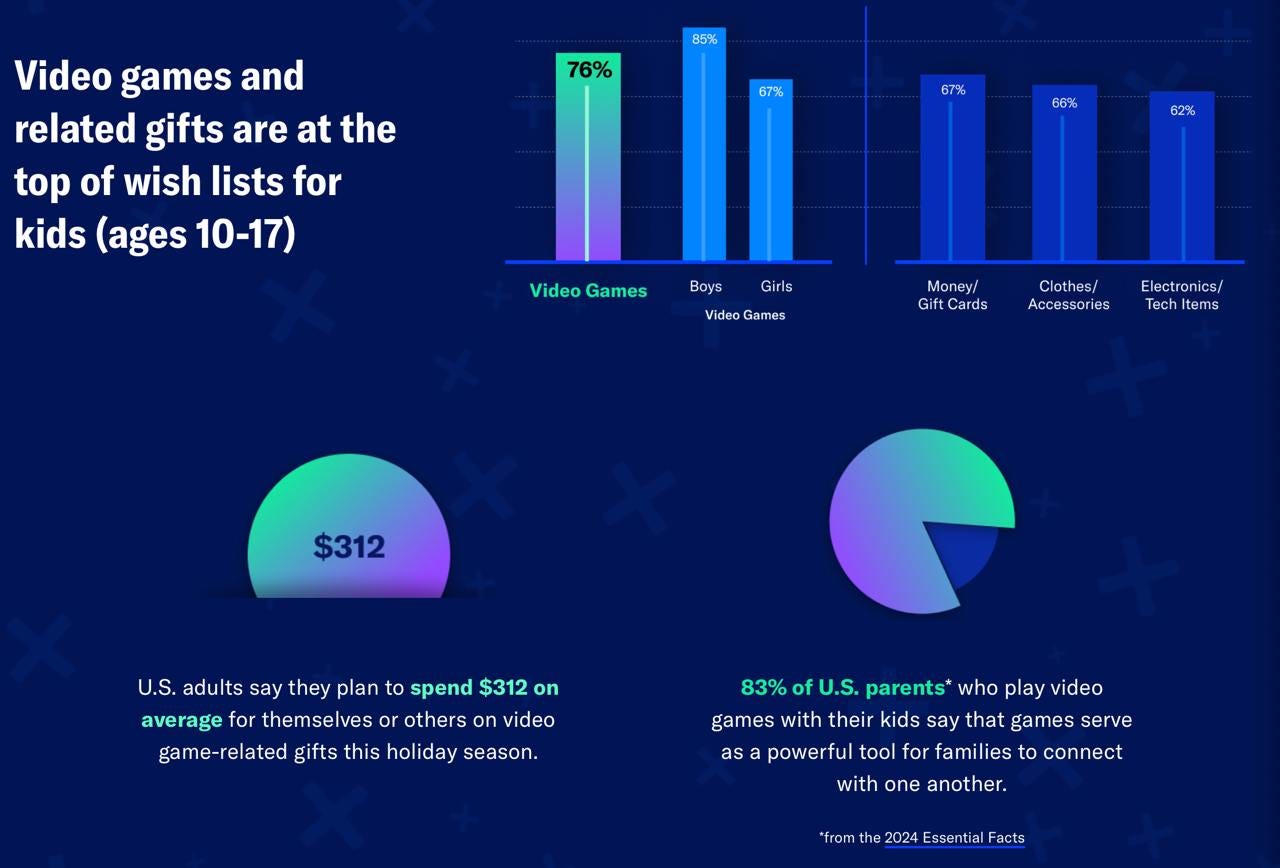
Among those who want gifts related to video games, there are more boys (85%) than girls (67%). Additionally, children and teenagers want money (67%), clothing (66%), and gadgets (62%) as gifts.
American adults plan to spend $312 on gifts related to video games this year.
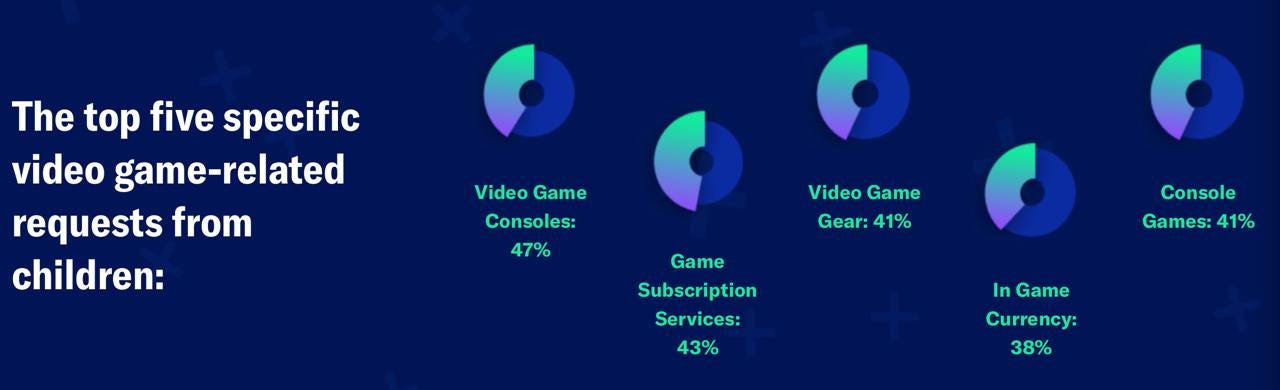
Children aged 10 to 17 want gaming consoles (47%), service subscriptions (43%), gaming equipment (41%), console games (41%), and in-game currency (38%) as gifts.
GSD & GfK: Game sales in Europe increased in October 2024

The analytical platforms only report actual sales figures obtained directly from partners. The mobile segment is also not taken into account.
Game Sales
18.5 million games were sold in Europe in October. This is 12.4% more than last year.
This is largely because Call of Duty: Black Ops 6 was released in October this year. Last year, Call of Duty: Modern Warfare 3 was released in November. The series traditionally has a significant impact on sales.
CoD: Black Ops 6 sold 5% better in Europe in the first two weeks compared to CoD: Modern Warfare 3. However, compared to CoD: MW2, released in 2022, Black Ops 6 started 28% worse.
❗️This year, Call of Duty became available on Game Pass at launch. This affects numbers.
If we consider Black Ops 6 sales only on PlayStation consoles, where Game Pass is not available, the game's sales are 26% better than Modern Warfare 3 and 2% better than Modern Warfare 2.
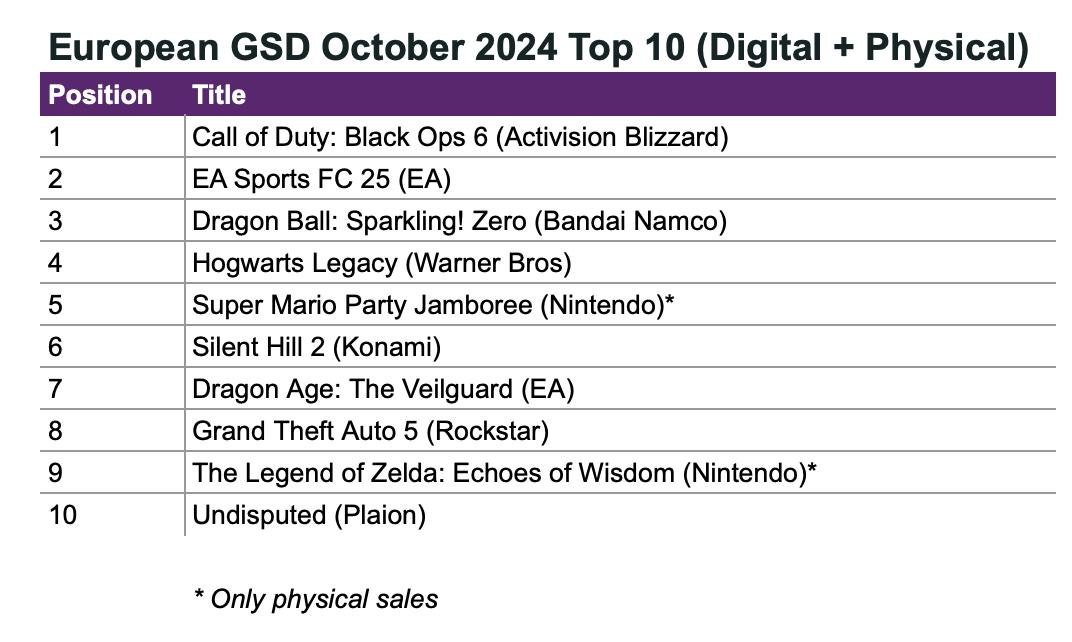
EA Sports FC 25 is in second place. The game's sales are 2% lower than its predecessor in the same month.
Dragon Ball: Sparking! Zero is in third place. In its first month, the game sold twice as well in Europe as the previous series project - Dragon Ball Z: Kakarot.
Silent Hill 2 is in 6th place in sales. The game had a good start, but initial sales are 57% worse than the Resident Evil 4 remake and 31% worse than the Dead Space remake.
Dragon Age: Veilguard started in 7th place. Initial sales are 18% worse than Dragon's Dogma 2 and 21% worse than Final Fantasy VII: Rebirth.
In 11th place is Metaphor: Refantazio - the game sold 32% worse than Persona 5 in its first month. Which, however, is not so bad for a new IP.
Consider subscribing to the GameDev Reports Premium tier to support the newsletter. Get access to the list of curated articles & archive of Gaming Reports that I’ve been collecting since 2020.
Hardware and Accessories Sales
422 thousand consoles were sold in October 2024 in Europe. This is 26% lower than in 2023.
PS5 sales fell by 29% YoY; Nintendo Switch - by 10%; Xbox Series S|X - by 49%.
Taking the first 10 months of 2024, console sales are 28% worse than the previous year.
1.4 million accessories were sold in Europe in October. This is 13% less than last year.