


Reports of the week:
Circana: The U.S. Video Game Market in August 2026
SocialPeta & Gamota: Mobile Game Marketing in Southeast Asia in 2026
GameDiscoverCo: Top Games on Steam and Consoles in September 2026
Aream & Co.: Game Investments in Q3'26 | GameDev Reports is powered by Mellow
Singular: Ad Creative Benchmarks in 2026
Alinea Analytics: Games Based on Non-Game IP Earned Over $900 Million in 2026 | GameDev Reports is powered by Mellow
Circana: The U.S. Video Game Market in August 2026
Circana data on the U.S. market. Mobile figures provided by Sensor Tower.
Market
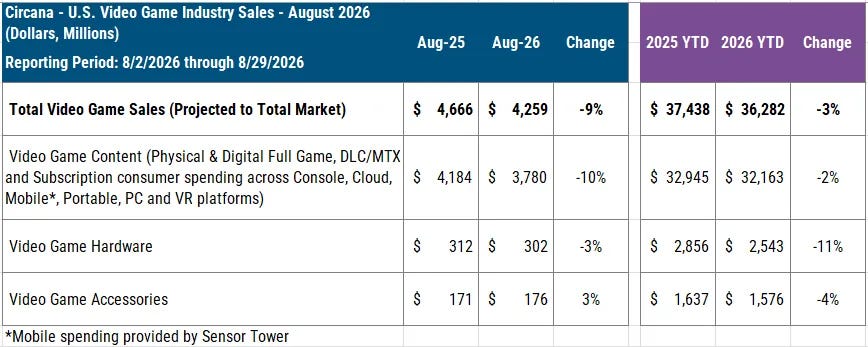
In August 2026, Americans spent $4.259 billion on games (-9% YoY), down from $4.666 billion a year earlier.
Content spending was $3.78 billion (-10% YoY). Mobile game spending fell the most, down 18% YoY. Console game spending declined 7%. PC content purchases, however, grew 13%, and subscriptions grew 3%.
❗️I’ll note again that part of mobile revenue is missed because of D2C’s growing popularity. The real picture for mobile content is likely better than the one Circana shows.
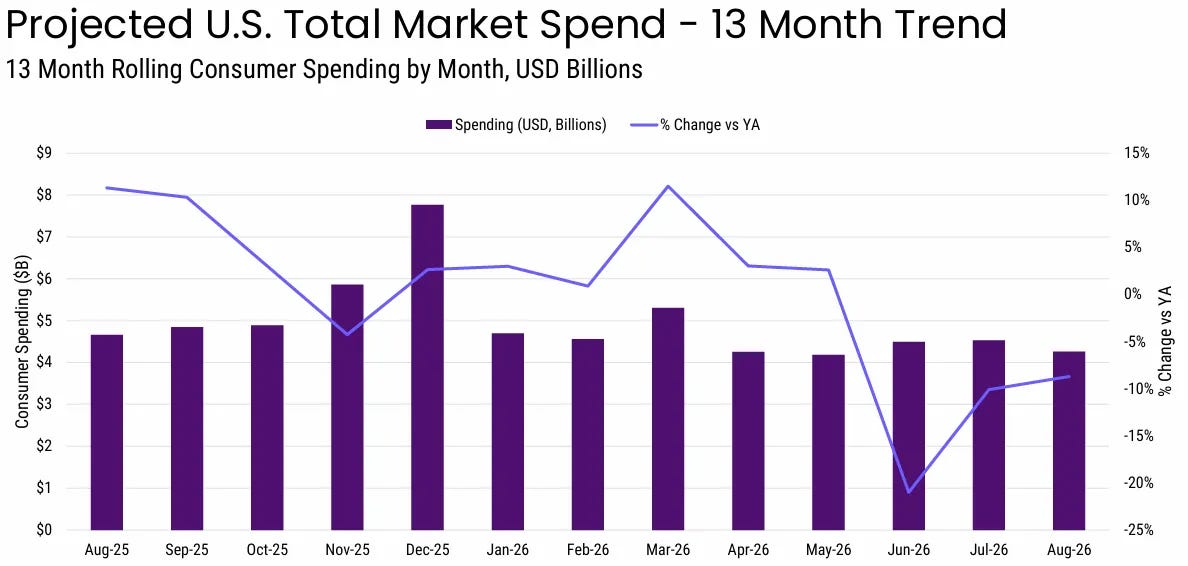
The U.S. market has been declining for three months in a row. Over the first eight months of 2026, Americans spent $36.282 billion on games (-3% YoY). After seven months, the gap was 2% compared with last year.
Content spending over eight months stands at $32.163 billion (-2% YoY).

Managing a distributed dev team shouldn’t mean managing a compliance headache. Mellow’s Contractor Management gives you ready-made contracts, IP compliance, and automated payouts for contractors in 150+ countries — for $35/month per contractor.
Spending on new physical games grew 5% YoY to $738 million. All growth came from Game-Key Cards (Switch 2 boxes that contain only a download key); spending on them rose 631%. All other physical formats fell 3%.
Hardware and Accessories
In August, Americans spent $302 million on gaming hardware (-3% YoY). Over eight months, they spent $2.543 billion (-11% YoY).
Unit sales fell more sharply, down 15% YoY to 559,000 consoles. That’s the worst August since 2013 (when 423,000 units were sold).
Nintendo Switch 2 led in both units and dollars in August and year-to-date. PlayStation 5 was second. Mat Piscatella of Circana notes that Switch 2 is selling fine, but recent price increases have slowed its momentum.
PlayStation 5 dollar sales grew 17% YoY. At the same time, PlayStation unit sales fell 11%, the platform’s worst August since 2013. The gap likely reflects console price increases.
Xbox Series and Switch 2 hardware spending both fell 13% YoY. Xbox unit sales dropped 31% (the worst August since 2020), and Nintendo’s fell 15%.
The average price of a new console in the U.S. in August was $541. That’s an August record; the previous one ($476) was set a year earlier. In July, for comparison, it was $542. Piscatella says plainly that gaming hardware is too expensive.
Over the first eight months of 2026, Xbox unit sales fell 33% YoY, and PlayStation’s fell 25%. For Xbox, that’s an all-time low; for PlayStation, the lowest since 2013.
The average price of an Xbox over eight months was $529 (+26% YoY), and a PlayStation was $597 (+20% YoY). Both are all-time U.S. highs. According to Piscatella, players’ price sensitivity is becoming a real problem.
Piscatella suggests the November release of GTA VI may partly ease the decline. But much will depend on console availability amid the RAM and component crisis, as well as pricing. In his view, the U.S. hardware market hasn’t been in such a precarious position since the early ’80s.
Piscatella says a market recovery is possible if the component crisis ends around 2028 and consoles get cheaper.
Accessories spending grew 3% YoY in August to $176 million. Over eight months, it reached $1.576 billion (-4% YoY).
The PlayStation Portal in Midnight Black was the third-best-selling accessory of the month in dollar sales. Only the DualSense and DualSense Edge in the same color sold more.
Game Sales
❗️Circana uses a methodology that combines projected estimates with actual sales. Mobile games and DLC are not included in the charts.
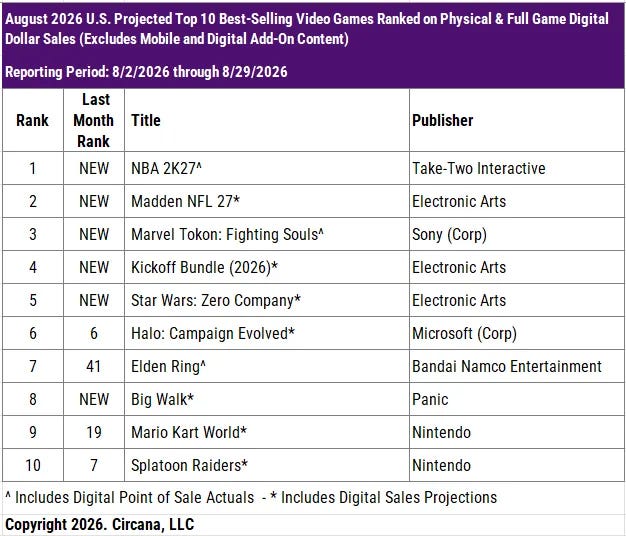
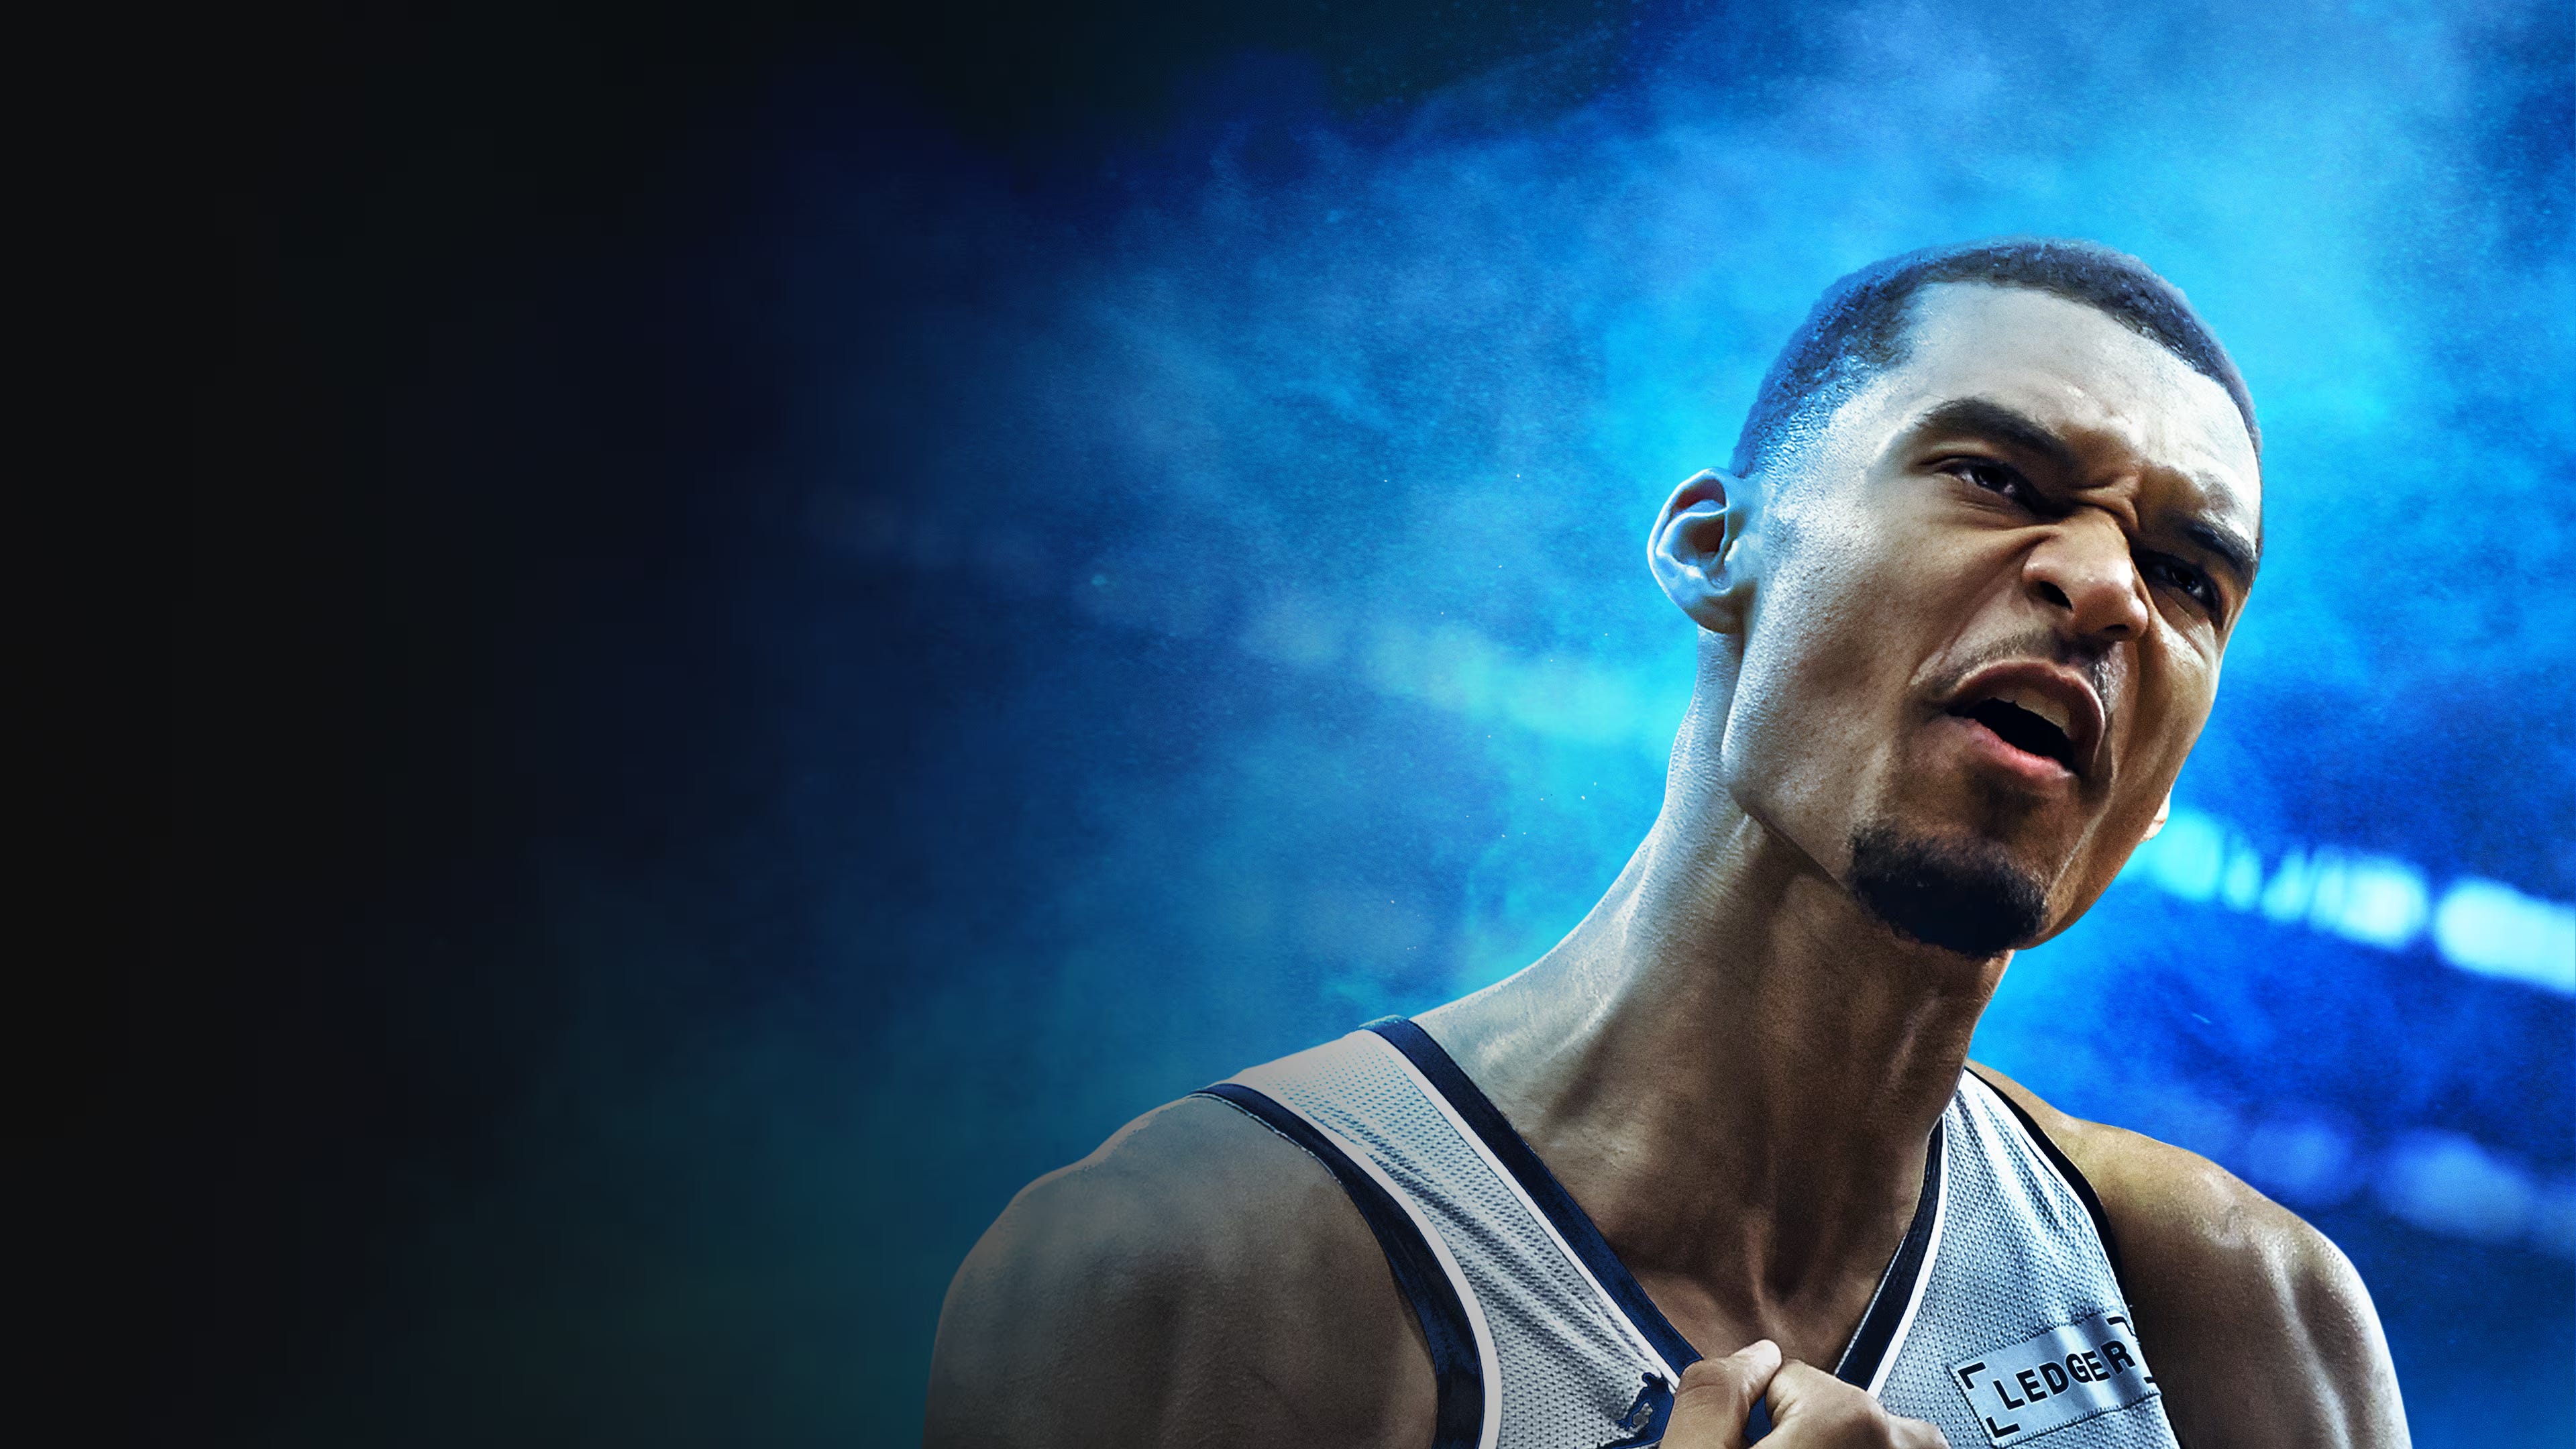
NBA 2K27 was the best-selling game of August in the U.S. According to Piscatella, it outsold Madden NFL 27 and all of its bundles combined.
Madden NFL 27 was second, and Marvel Tokon: Fighting Souls third. Six new releases made August’s top 10.
Elden Ring climbed from 41st to 7th place. The Nintendo Switch 2 version came out in August.
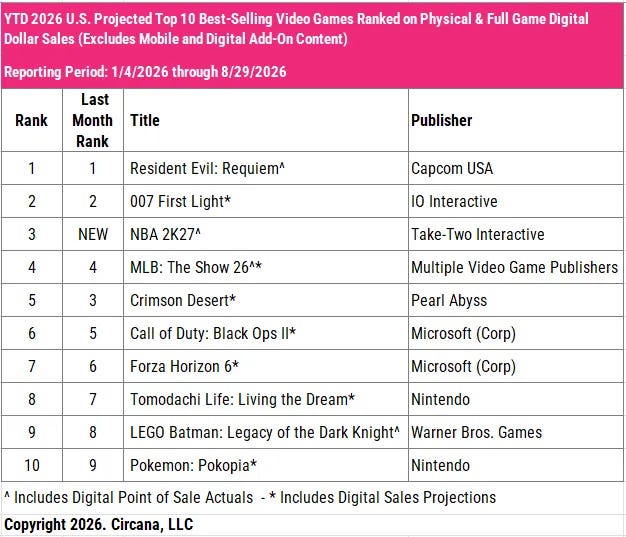
Over the first eight months of 2026, Resident Evil: Requiem, 007 First Light, and NBA 2K27 were the top sellers. NBA 2K27 entered early access only on August 26, and Circana’s tracking period ended on August 29.
On mobile (Sensor Tower data), the top two U.S. revenue spots didn’t change: MONOPOLY GO! and Royal Match. Candy Crush Saga took third place.
Pokémon GO dropped four spots, to 7th. In July, it climbed 10 spots to third place, thanks to 10th-anniversary events. Sensor Tower links the decline to the end of the anniversary hype.
Last War: Survival fell out of the top 10. Royal Kingdom (8th) and Roblox (10th) entered the top 10.
SocialPeta & Gamota: Mobile Game Marketing in Southeast Asia in 2026

SocialPeta provides advertising data for January-July 2026. Gamota, one of Vietnam's largest publishers, estimates H1'26 downloads and revenue based on several mobile analytics services.
❗️SocialPeta counts advertisers and creatives, not ad budgets.
The Southeast Asian Market

Indonesia leads the region in mobile game downloads: ~1.85 billion in H1'26 (-2.3% YoY). The Philippines (~800 million, -2.5% YoY) and Vietnam (~775 million, -1.9% YoY) follow.
Downloads are growing only in Cambodia (+11.8% YoY), Singapore (+8.6% YoY), and Malaysia (+0.5% YoY).

From concept art to launch-day marketing, most game studios rely on contractors in multiple countries. Mellow makes it simple to hire, pay, and stay compliant with talent in 150+ countries — no legal entity required.
The IAP revenue ranking looks different: Thailand leads (~$195 million, -0.5% YoY), followed by Malaysia (~$160 million, +1.4% YoY) and Indonesia (~$150 million, +2.4% YoY). Singapore comes next (~$140 million, -4% YoY), even though it ranks last in downloads among the seven countries.
❗️This is store IAP revenue only. It excludes payments outside the store, and according to Niko Partners, almost a third of players in the region prefer to buy in-game content outside the usual storefronts. The estimates are also noticeably lower than Sensor Tower's: there, players in Thailand spent $162 million in Q1'25 alone. The revenue here may be net of store fees.
The Region's Ad Market
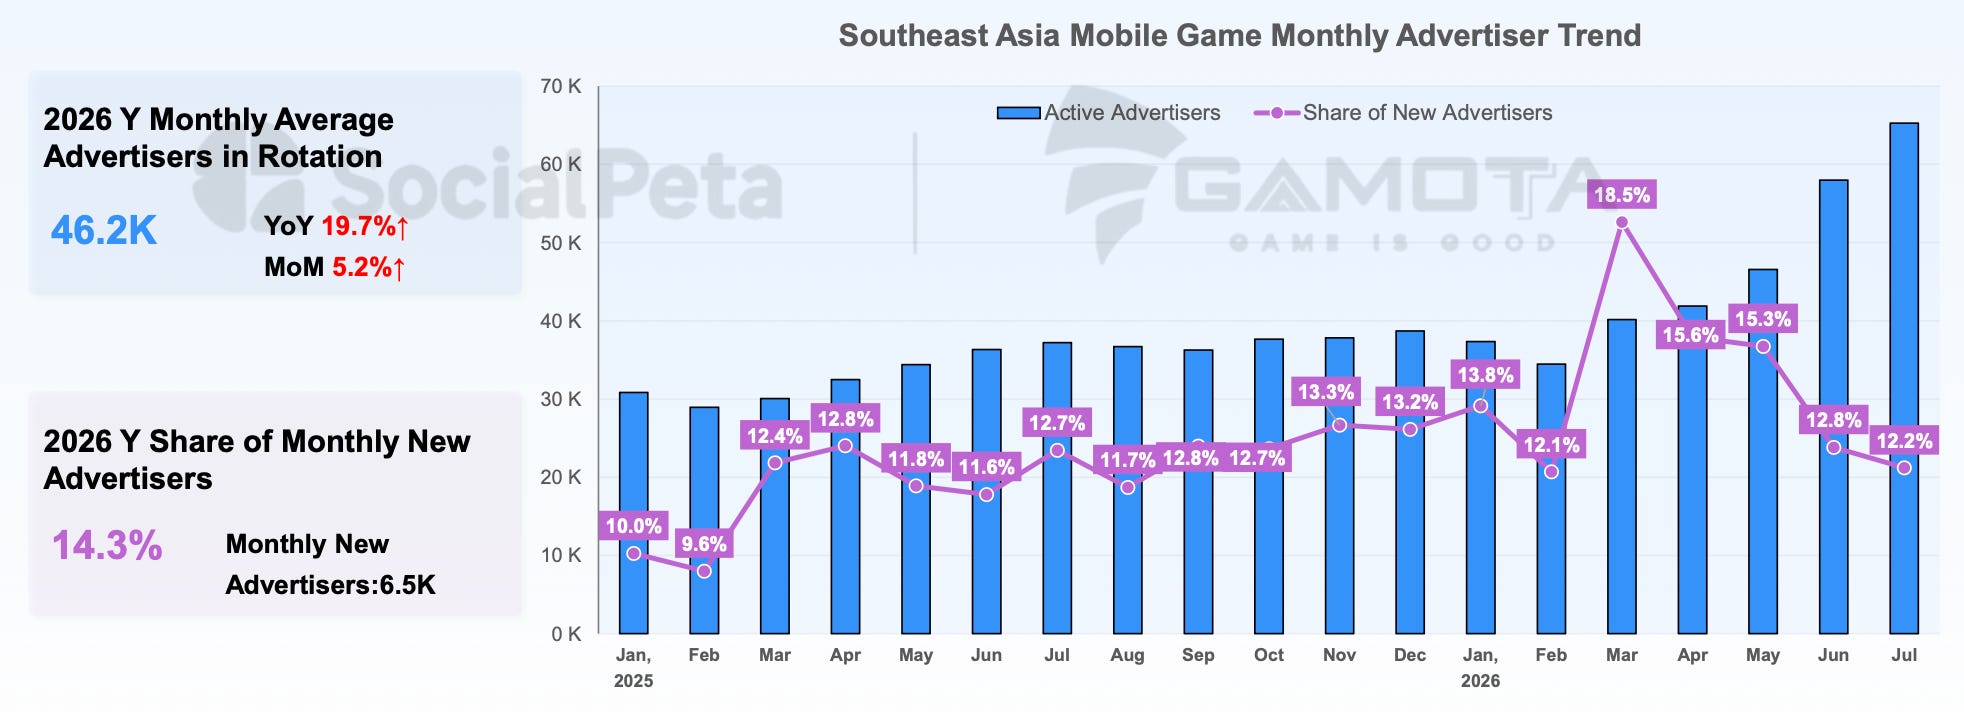
In January-July 2026, Southeast Asia had an average of 46,200 active mobile game advertisers per month (+19.7% YoY). In its 2024 report, SocialPeta reported 9.5% growth.
The number of advertisers grew the most in the summer. In July 2026, there were already more than 65,000.
On average, 6,500 new advertisers appear each month (14.3%). SocialPeta notes that the market is growing mainly thanks to companies that already buy traffic in the region.
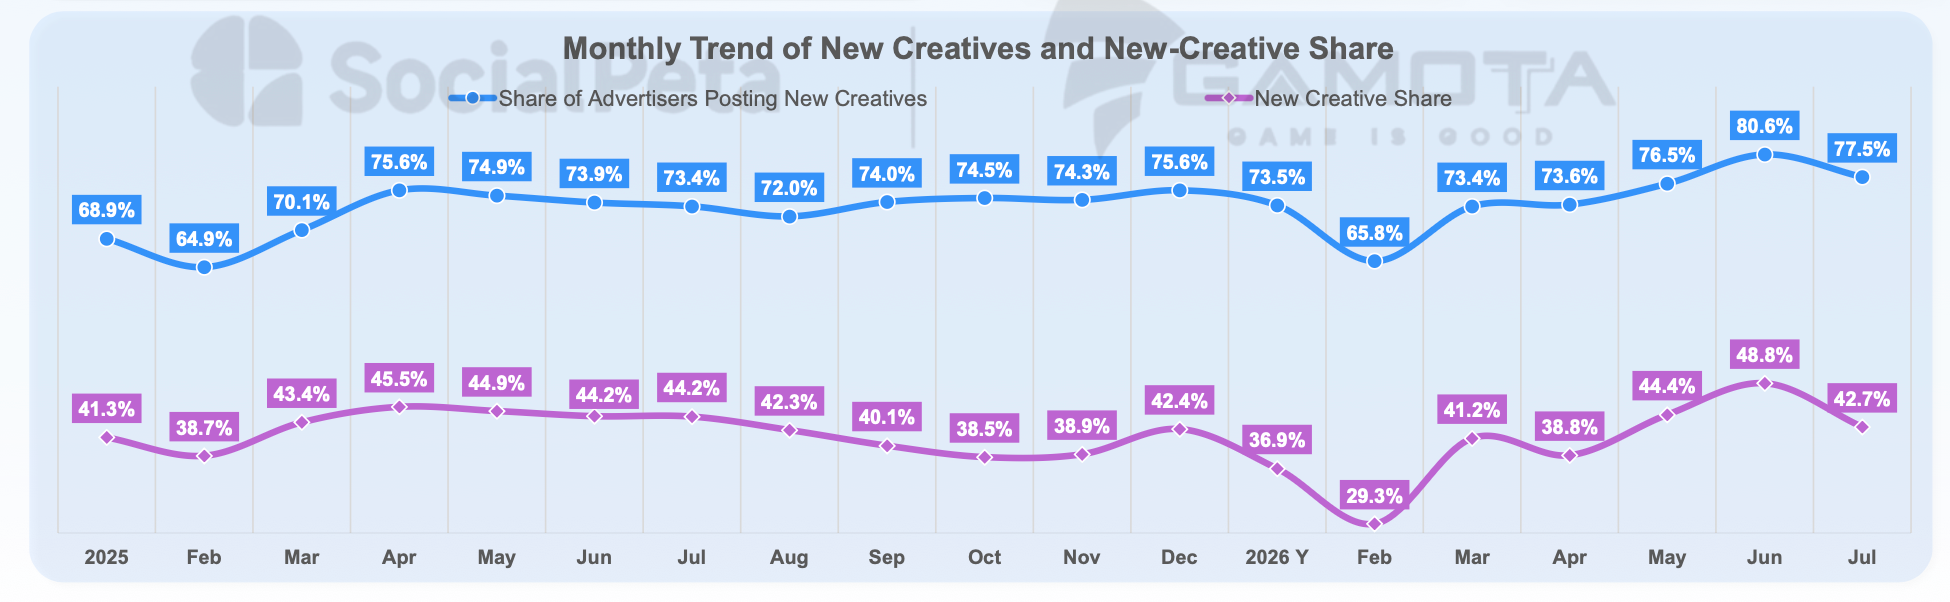
Every month, 74.4% of advertisers launch new creatives (+2.74 percentage points YoY). In 2024, the share was 63.8%.
At the same time, new creatives account for 40.3% of all creatives per month (-2.87 percentage points YoY). Most ads in the region are proven creatives and their variations.
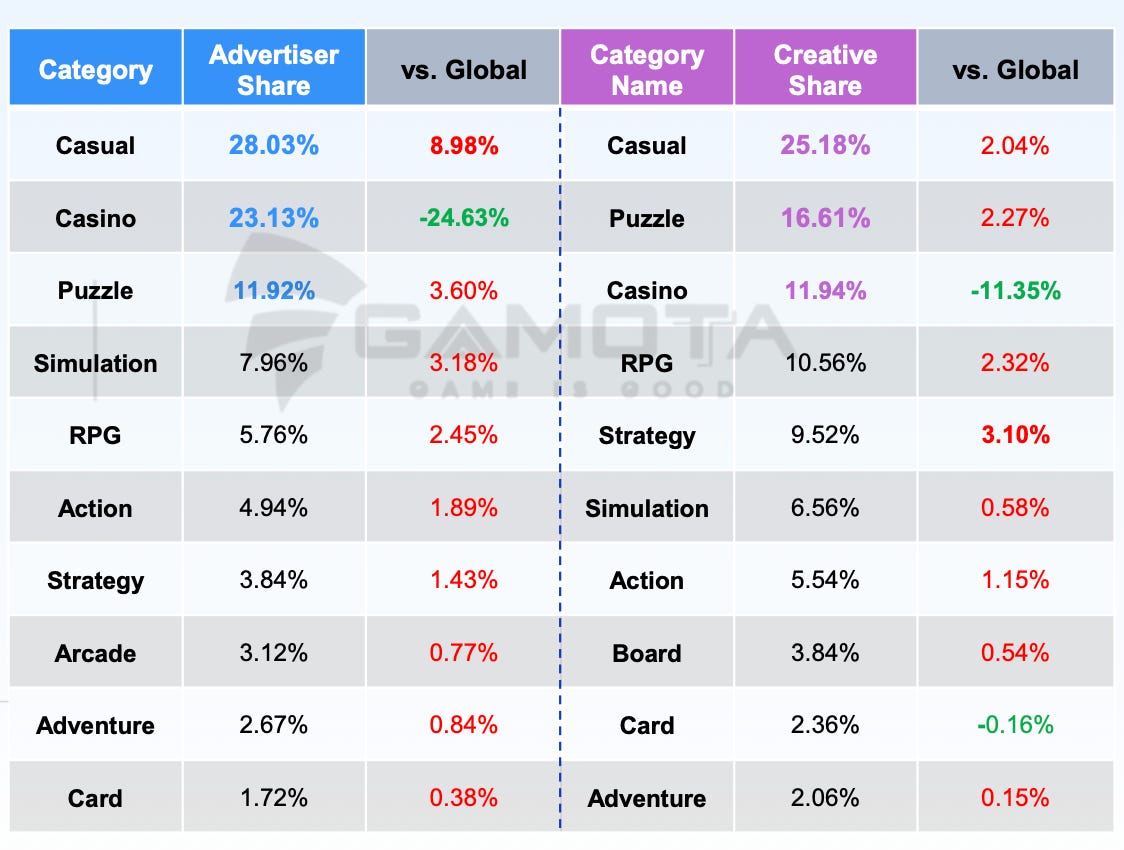
By genre, casual games (28.03%), casino (23.13%), and puzzle (11.92%) have the most advertisers. In 2024, casino accounted for 13.9% of advertisers. Globally, though, casino's share is even higher.
By number of creatives, casual games (25.18%), puzzle (16.61%), and casino (11.94%) lead. RPG, at 10.56%, ranks fourth, though in 2024 it accounted for 16% of creatives.
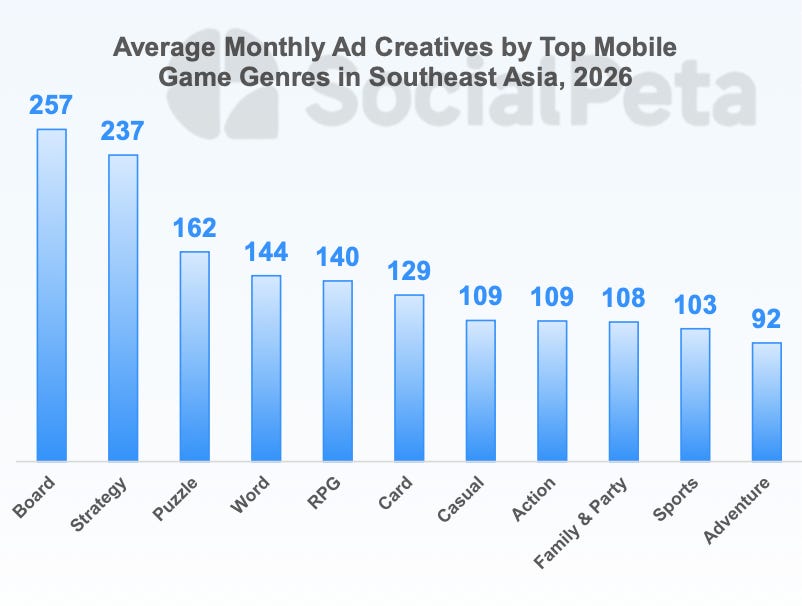
Board games (257), strategy (237), and puzzle (162) have the most creatives per advertiser per month.
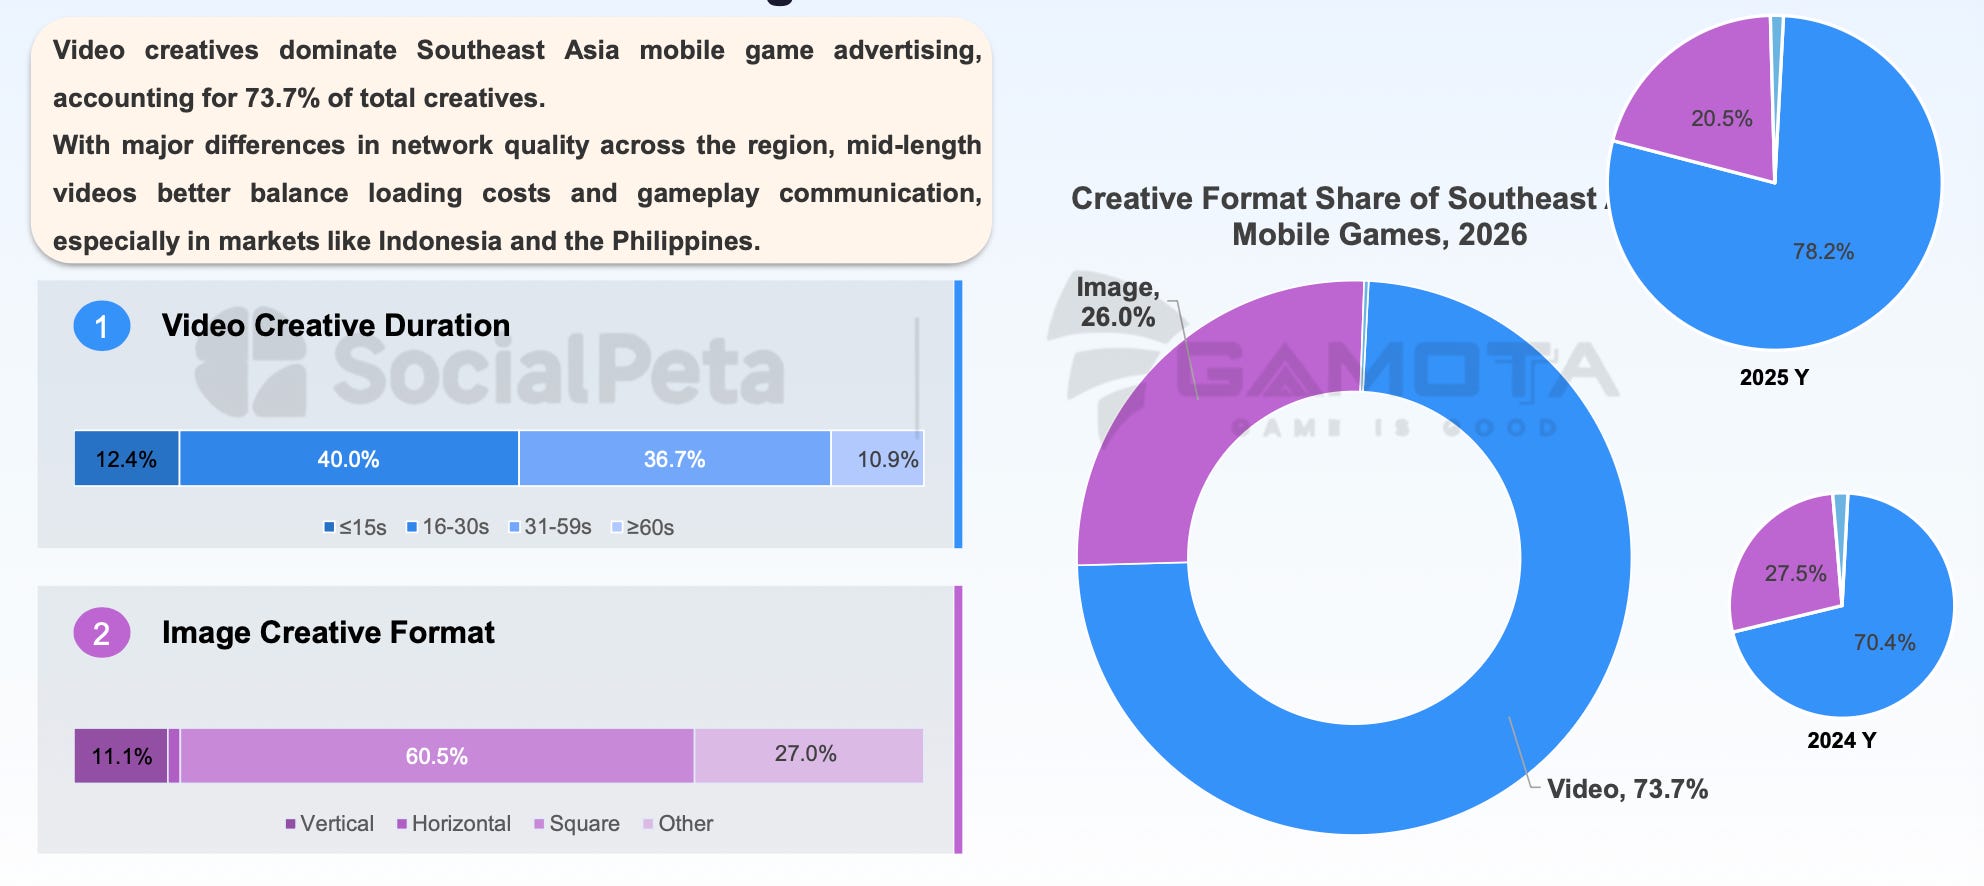
Video makes up 73.7% of creatives in the region, and static images 26%. In 2025, video made up a higher share (78.2%); in 2024, it was lower (70.4%).
The most common video lengths are 16-30 seconds (40%) and 31-59 seconds (36.7%). SocialPeta links this to mobile internet quality in the region: mid-length videos load faster and still give advertisers enough time to show gameplay.
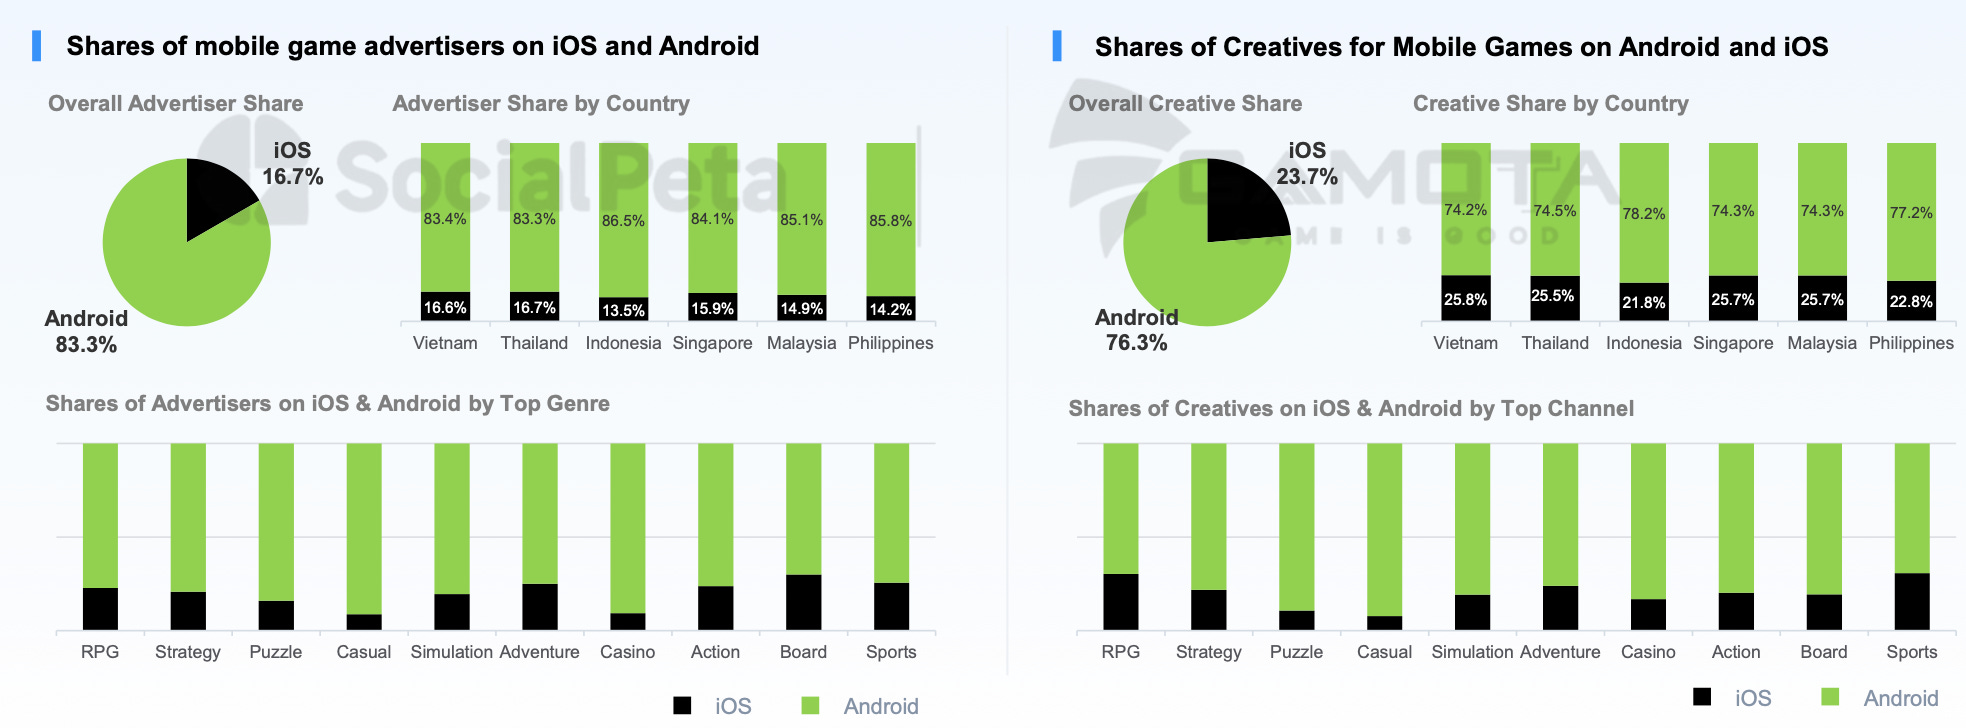
Android accounts for 83.3% of advertisers in the region, and iOS for 16.7%. In 2024, iOS's share was 24.5%. Indonesia has the lowest share of iOS advertisers (13.5%).
iOS has a higher share of creatives: 23.7%. For midcore and hardcore games, iOS creatives make up roughly twice as much as they do for casual games.
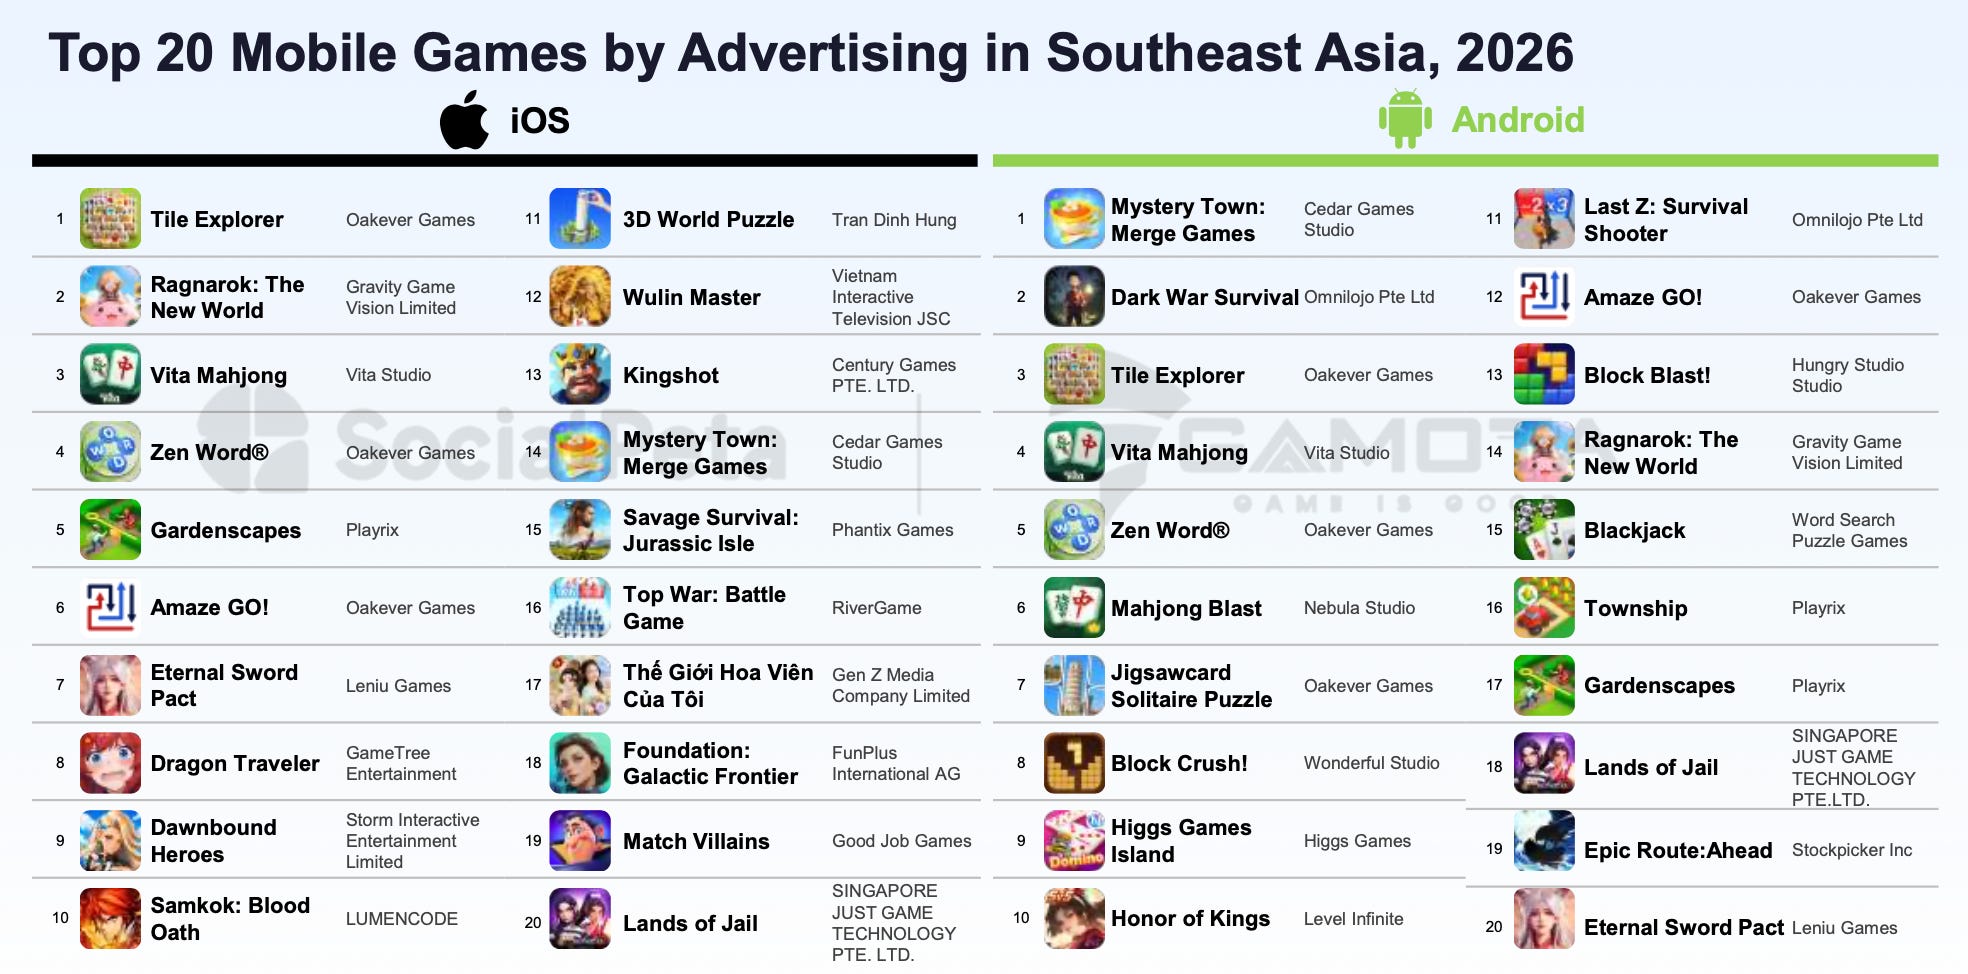
Tile Explorer, Ragnarok: The New World, and Vita Mahjong lead iOS advertising activity. On Android, Mystery Town: Merge Games, Dark War Survival, and Tile Explorer are on top. The leaders on both platforms have completely changed since 2024.
Oakever Games has three games in the iOS top 6 (Tile Explorer, Zen Word, and Amaze GO!) and four in the Android top 20.
Vietnam's Mobile Market
Gamota's Vietnam data covers only midcore games officially available in the country. The revenue calculation includes both IAP and local payment channels.
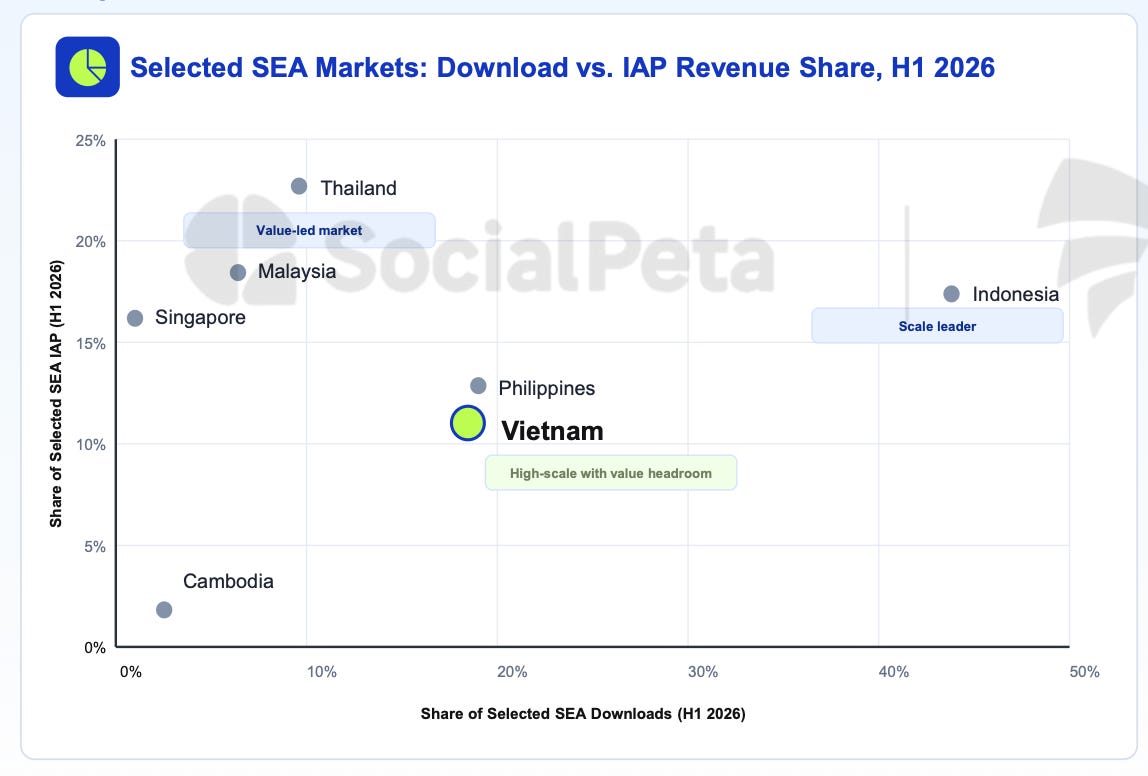
Vietnam accounts for 18.3% of mobile game downloads in the region, but only 10.6% of IAP revenue.
Regulation in the country is tightening. Decree 147/2024 introduced stricter rules on licensing, player verification, minor protection, and the sale of virtual items. Decree 174/2026 and the personal data protection law increased penalties and data-handling requirements.
❗️Only Vietnamese legal entities can obtain a game publishing license in Vietnam. Publishers must also verify users, limit playtime for players under 18, and host servers in the country.
Vietnam's GDP grew 8.18% YoY in H1'26, and consumer prices (CPI) rose 4.38%. Internet access is widespread.
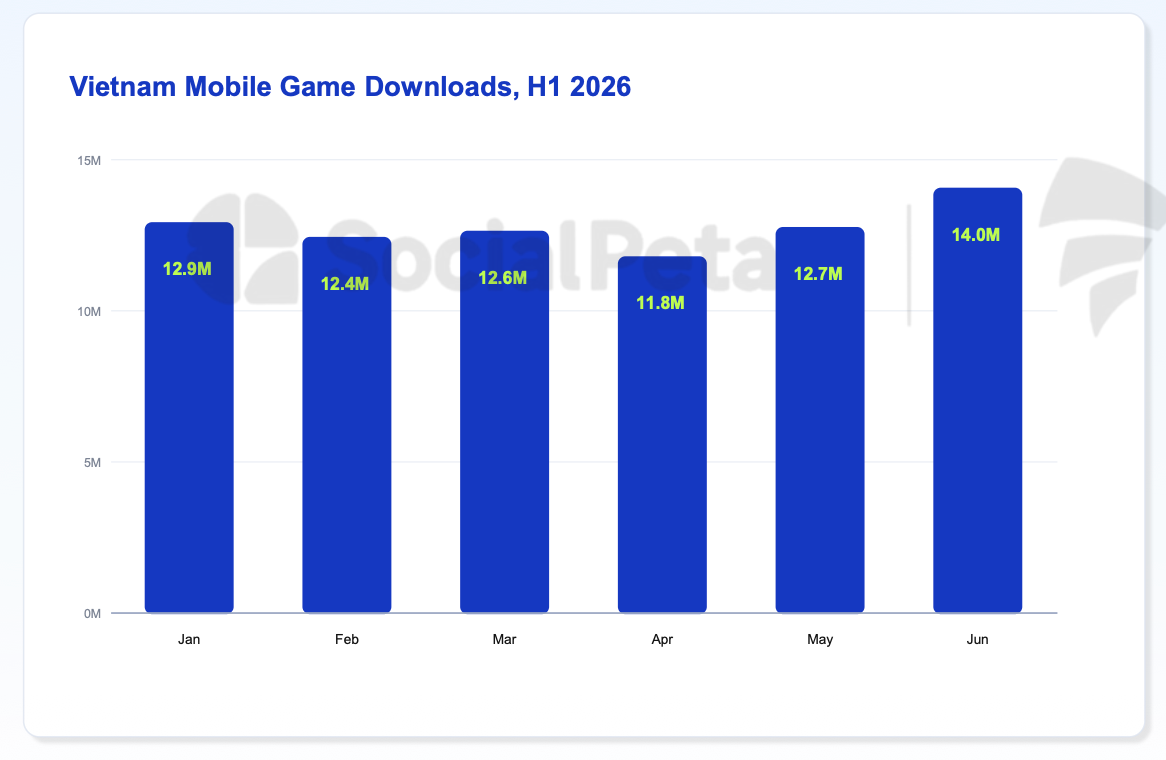
In H1'26, midcore games in Vietnam were downloaded 76.5 million times (-9.7% YoY). June led with 14 million downloads.
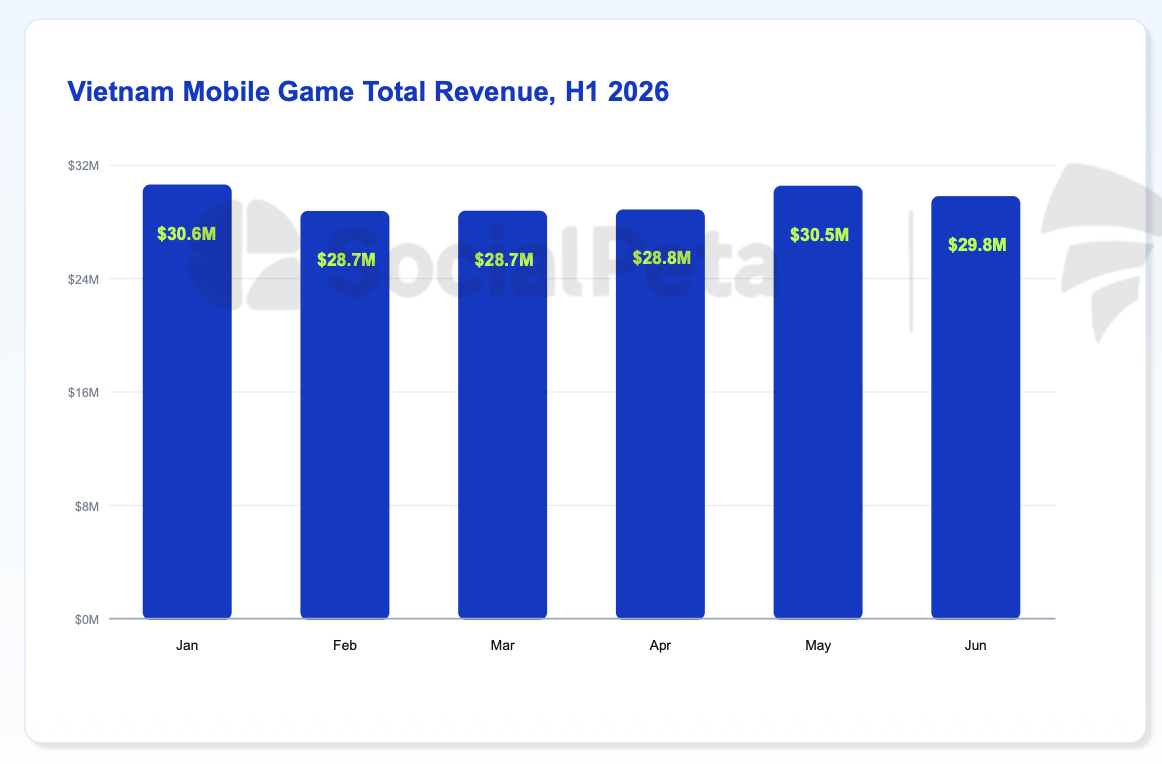
Revenue, meanwhile, grew to $177 million (+7.5% YoY). Midcore games in the country earn $28.7-30.6 million per month.
❗️On the regional chart, IAP revenue from all mobile games in Vietnam is ~$90 million for H1'26. Here, midcore games alone earned $177 million. So a significant share of payments in the country goes outside the stores. For comparison, OEG and Meridian Play estimated Vietnam's entire games market at $825 million in 2025.
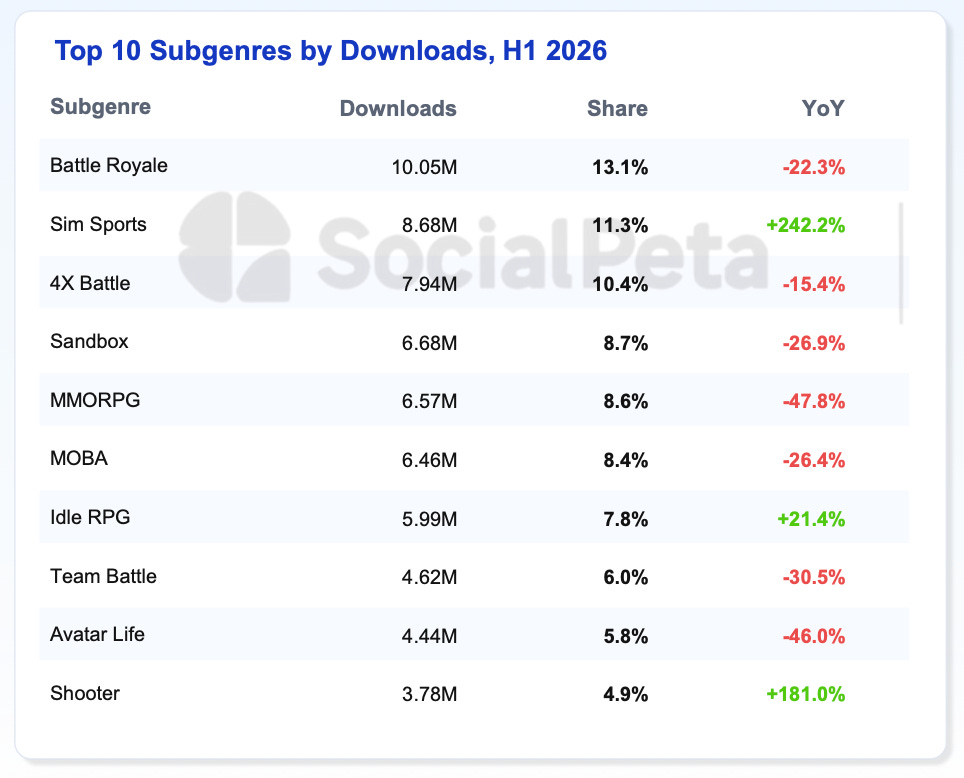
Battle Royale (10.05 million, -22.3% YoY), sports sims (8.68 million, +242.2% YoY), and 4X strategy (7.94 million, -15.4% YoY) lead in downloads.
Of the top 10 subgenres, besides sports sims, only shooters (+181% YoY) and Idle RPG (+21.4% YoY) are growing. Downloads fell the most for MMORPG (-47.8% YoY) and life sims (which SocialPeta, as far as I can tell, calls Avatar Life) (-46% YoY).
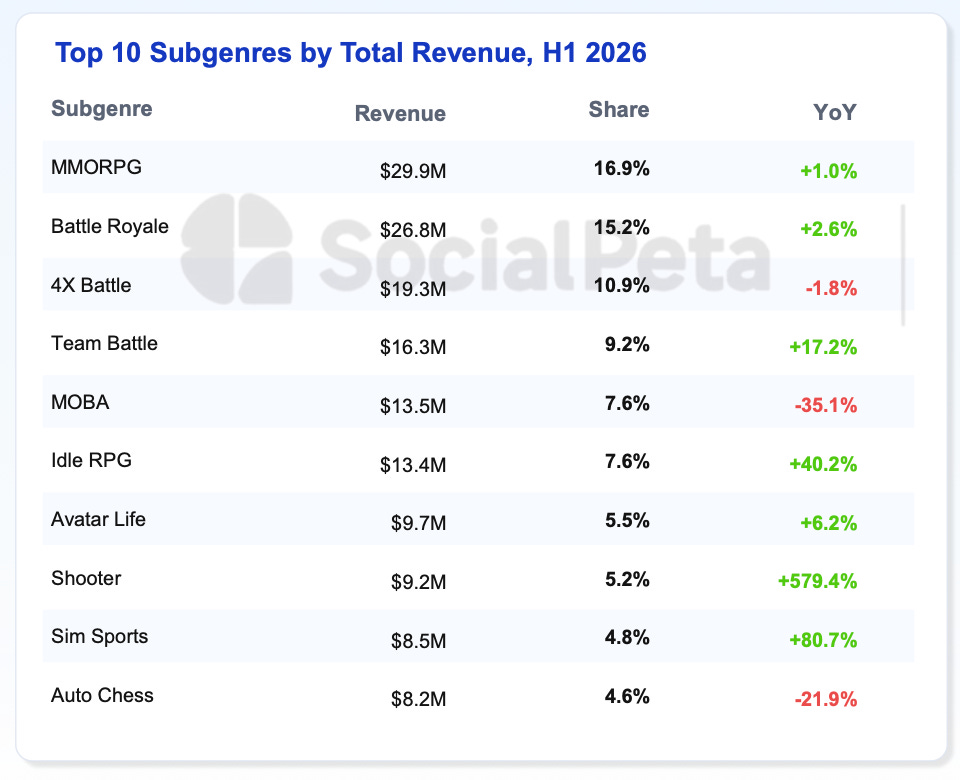
By revenue, MMORPG leads ($29.9 million, +1% YoY), followed by Battle Royale ($26.8 million, +2.6% YoY) and 4X strategy ($19.3 million, -1.8% YoY). These three subgenres account for 43% of all revenue.
Shooters ($9.2 million, +579.4% YoY), sports sims ($8.5 million, +80.7% YoY), and Idle RPG ($13.4 million, +40.2% YoY) are growing fastest. MOBA games, however, are falling sharply: in H1'26, they earned 35.1% less than a year earlier, at $13.5 million.
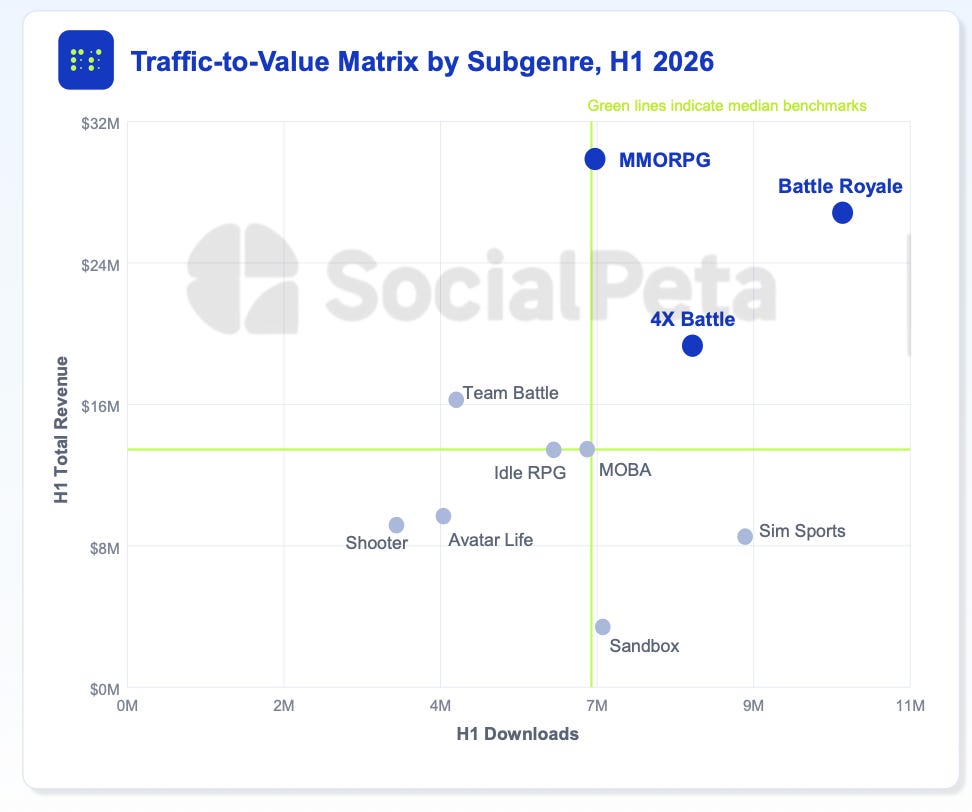
Team Battle, on the other hand, is earning more ($16.3 million, +17.2% YoY), even as downloads fell 30.5%.
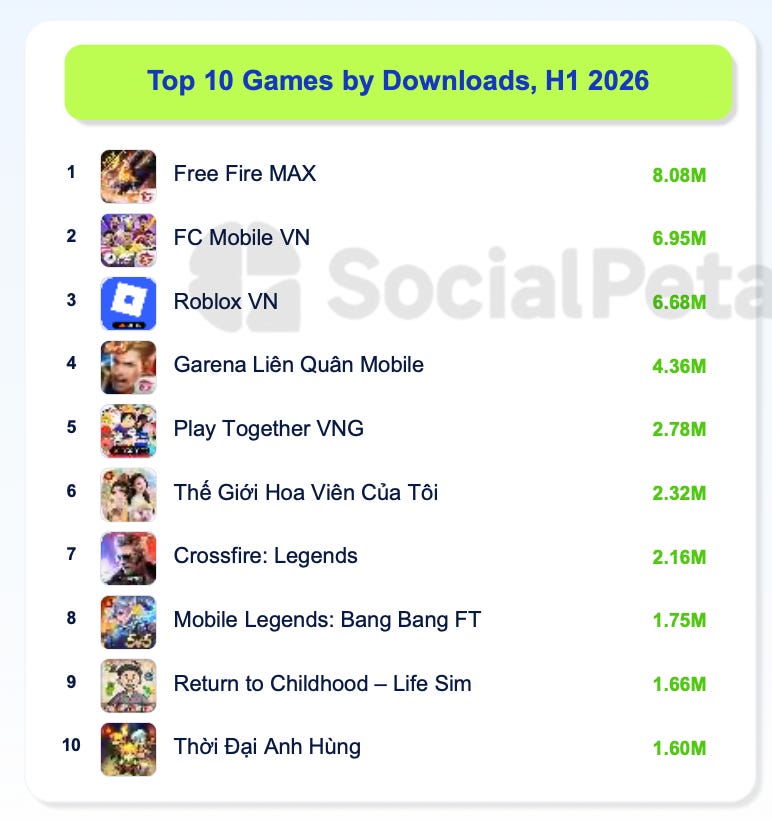
Free Fire MAX (8.08 million), FC Mobile VN (6.95 million), and Roblox VN (6.68 million) lead in downloads. The top 10 games account for 50.1% of all downloads. The growth of sports sims seems to be largely driven by FC Mobile VN.
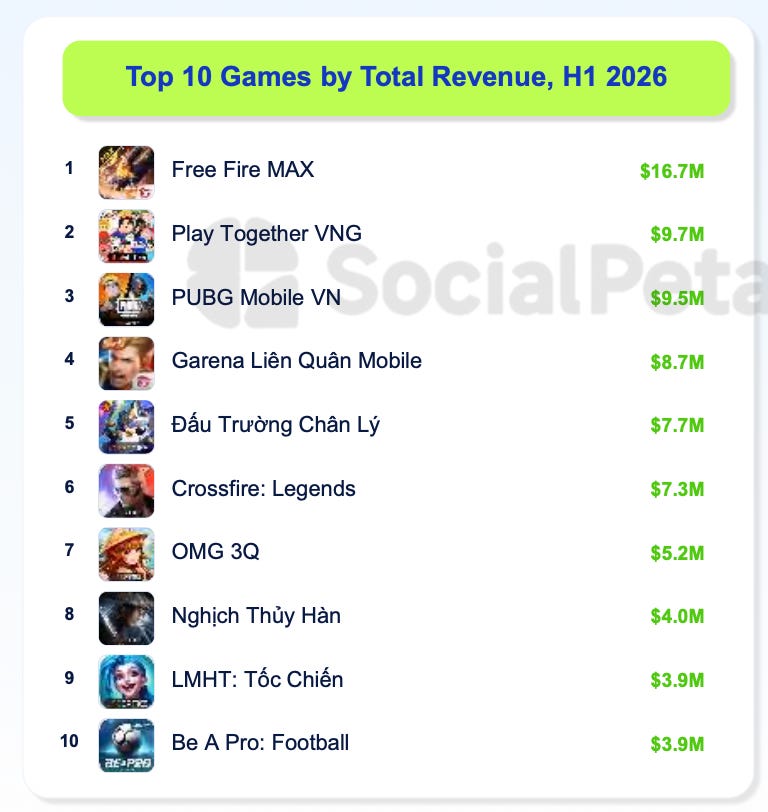
Free Fire MAX ($16.7 million), Play Together VNG ($9.7 million), and PUBG Mobile VN ($9.5 million) earned the most. The top 10 accounts for 43.2% of revenue, and no single game has more than 10% of the market.
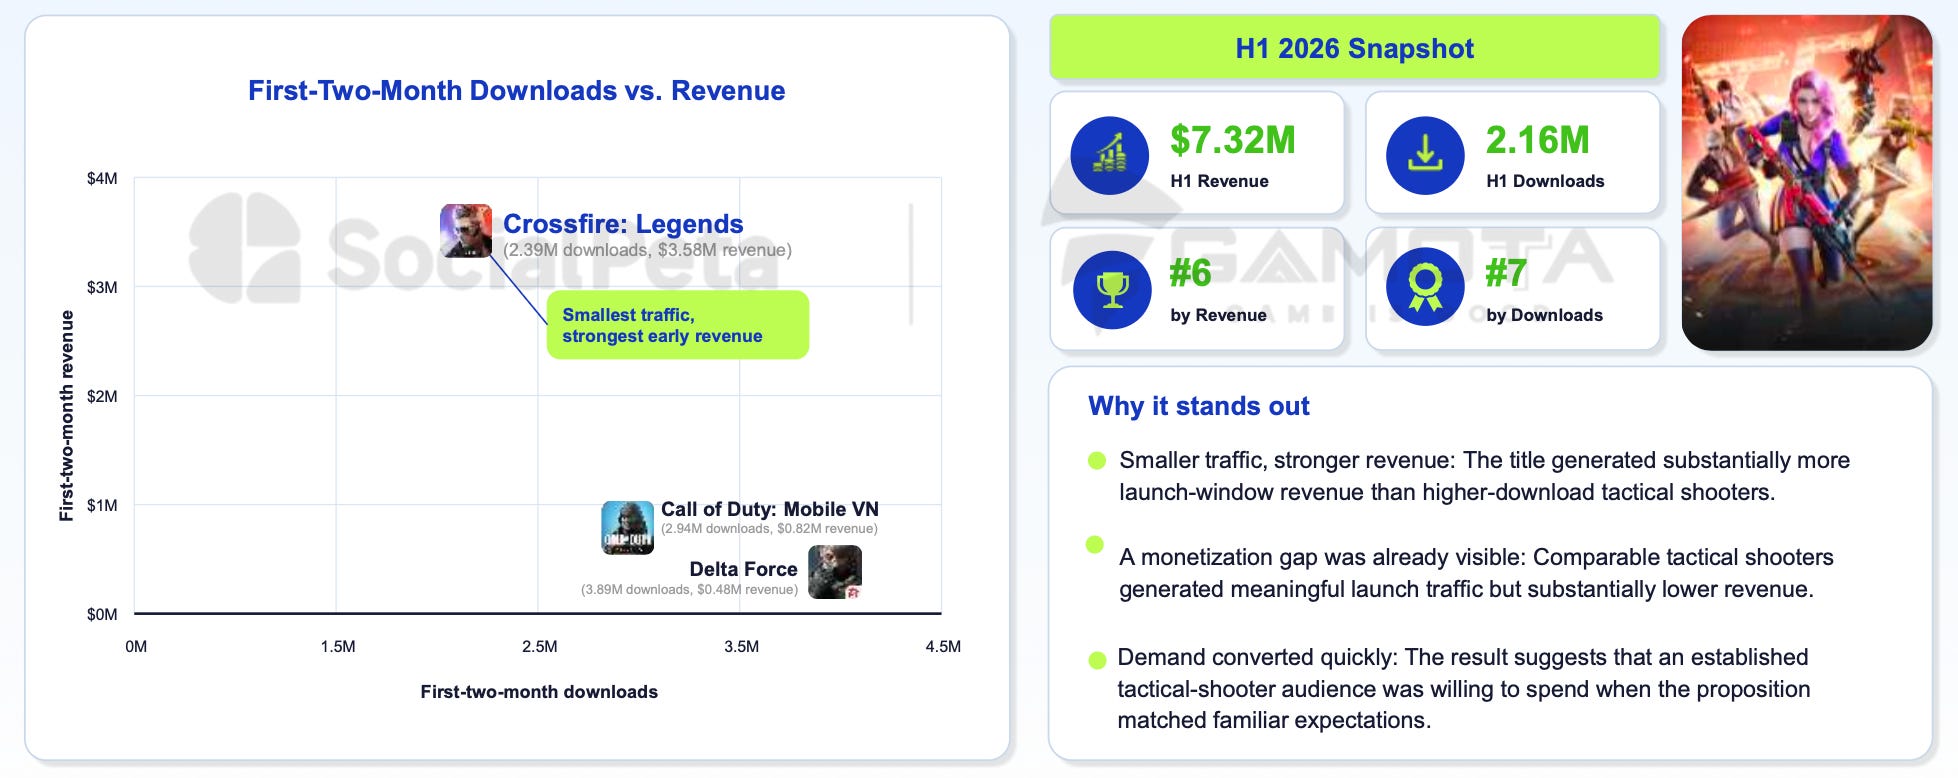
Gamota takes a closer look at Crossfire: Legends. In its first two months after launch, the game earned $3.58 million from 2.39 million downloads. Over the same period, Call of Duty: Mobile VN earned $0.82 million (2.94 million downloads), and Delta Force $0.48 million (3.89 million downloads).
In H1'26, Crossfire: Legends earned $7.32 million. Shooters category growth may be tied to its success.
Gamota attributes the game's success to familiar gameplay in the spirit of Crossfire and Counter-Strike, and to its monetization: weapon and character skins can give combat bonuses.
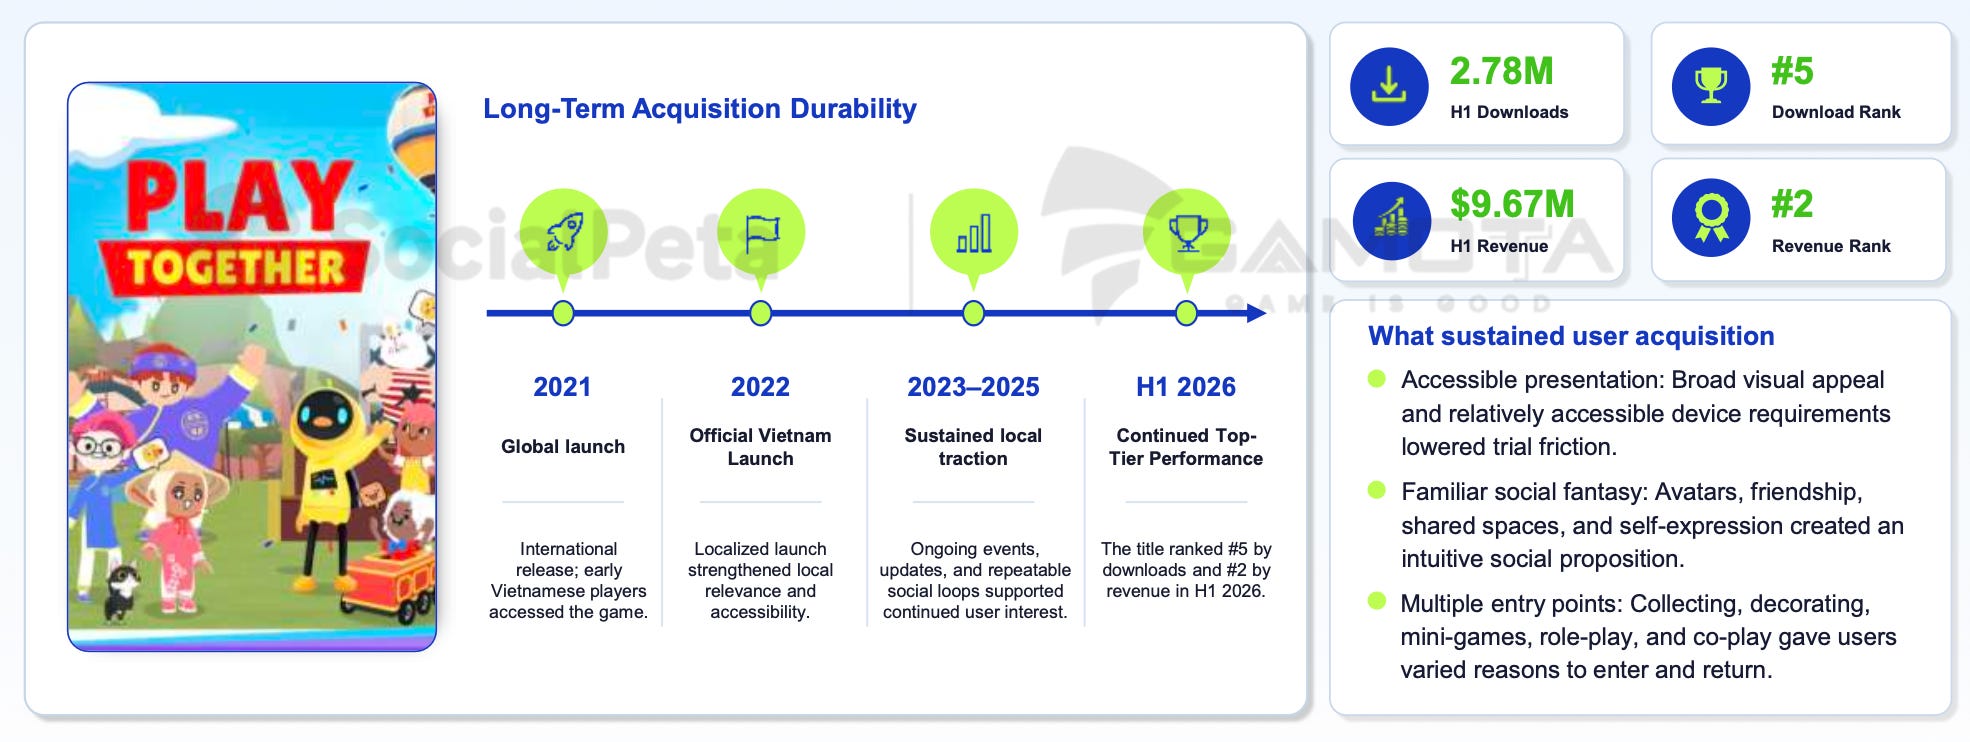
Play Together launched globally in 2021, with an official launch in Vietnam in 2022. In H1'26, the game still ranks fifth in downloads (2.78 million) and second in revenue ($9.67 million).
Marketing Cases
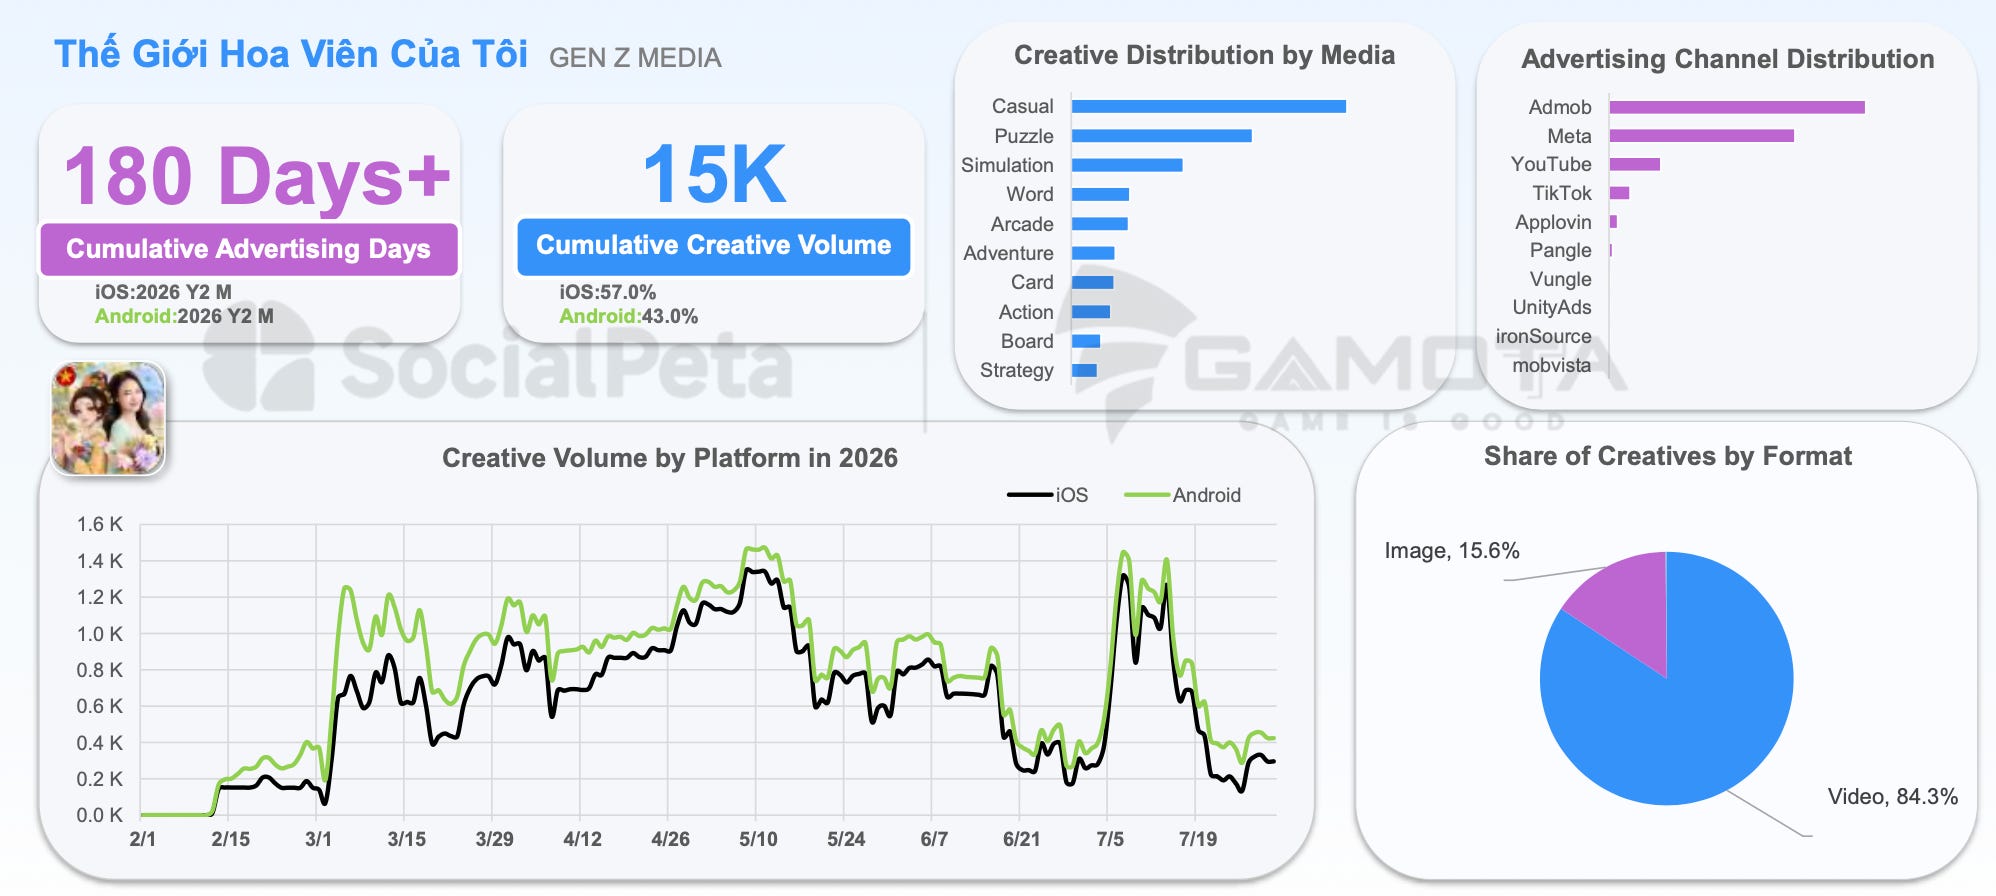
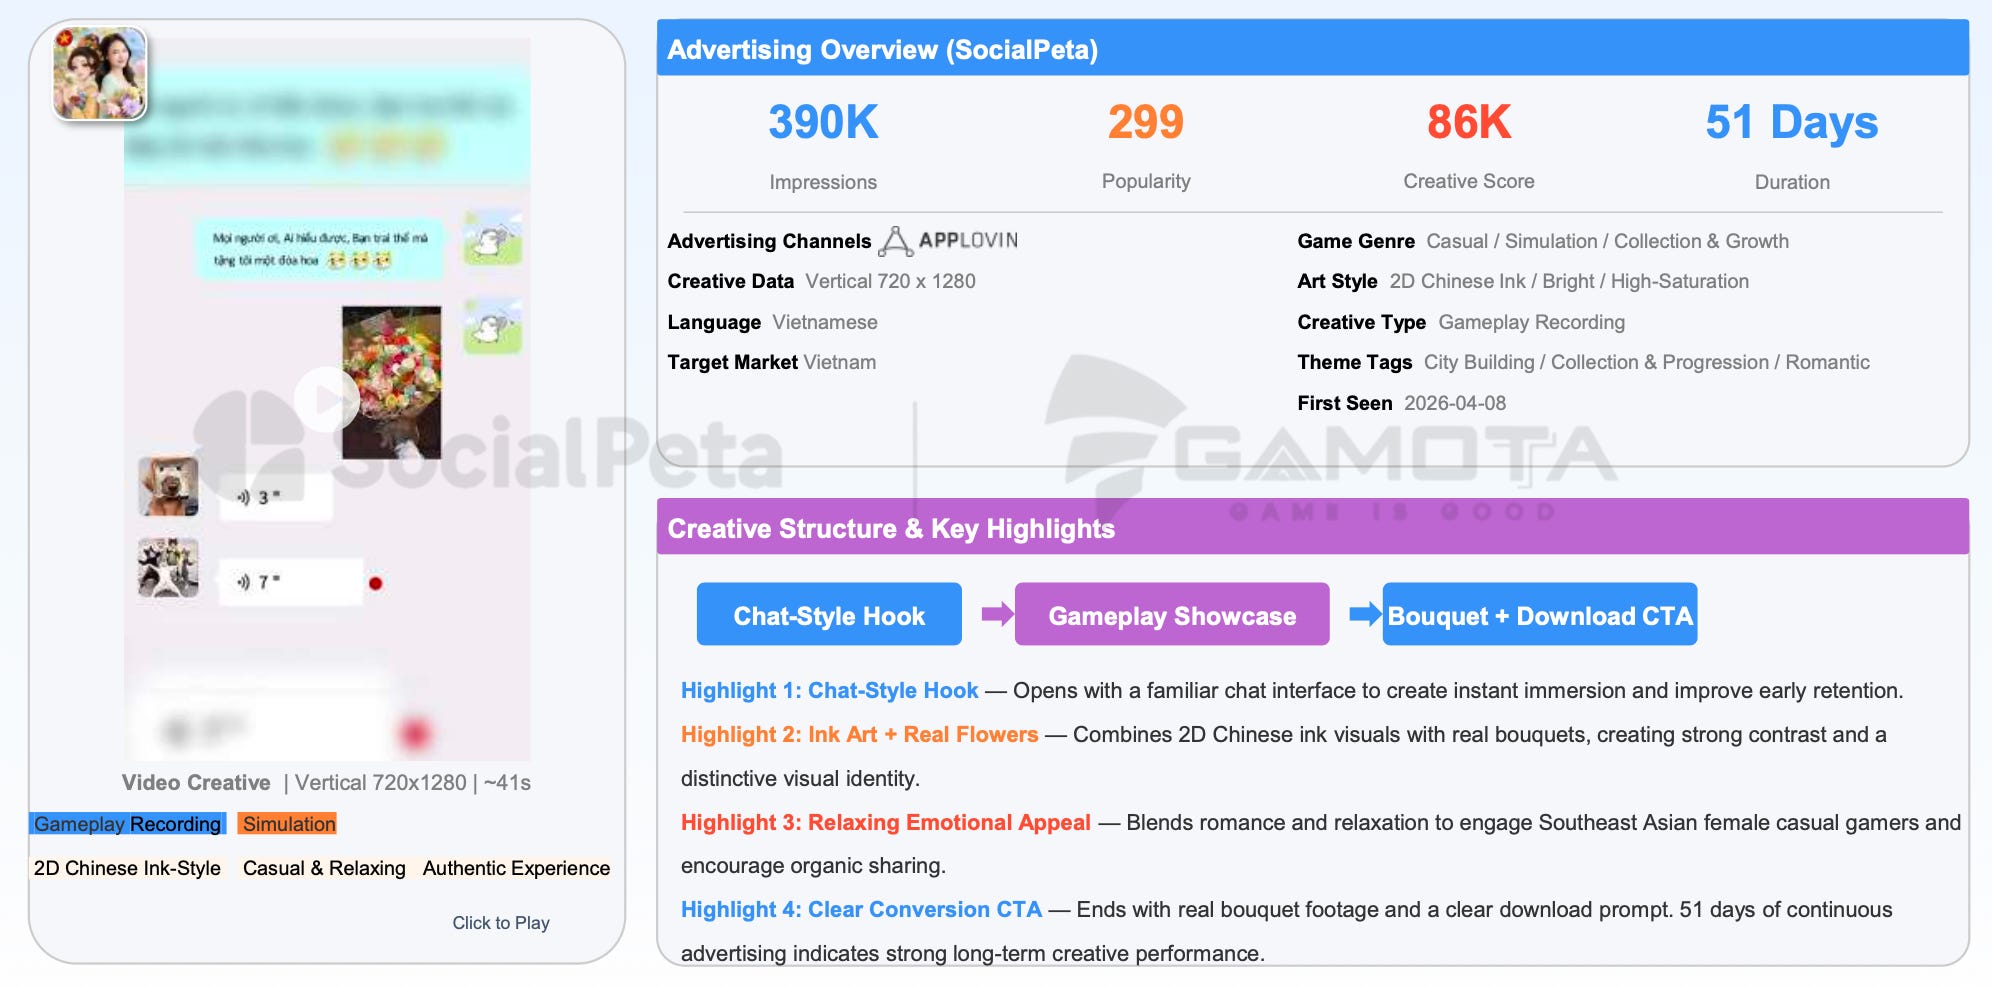
Thế Giới Hoa Viên Của Tôi from Gen Z Media is a Chinese flower-growing mini-game launched in Vietnam. Advertising began in February 2026, and 15,000 creatives have been released since. Video accounts for 84.3% of them. The main channels are AdMob and Meta. In H1'26, the game ranked sixth in Vietnam by downloads (2.32 million).
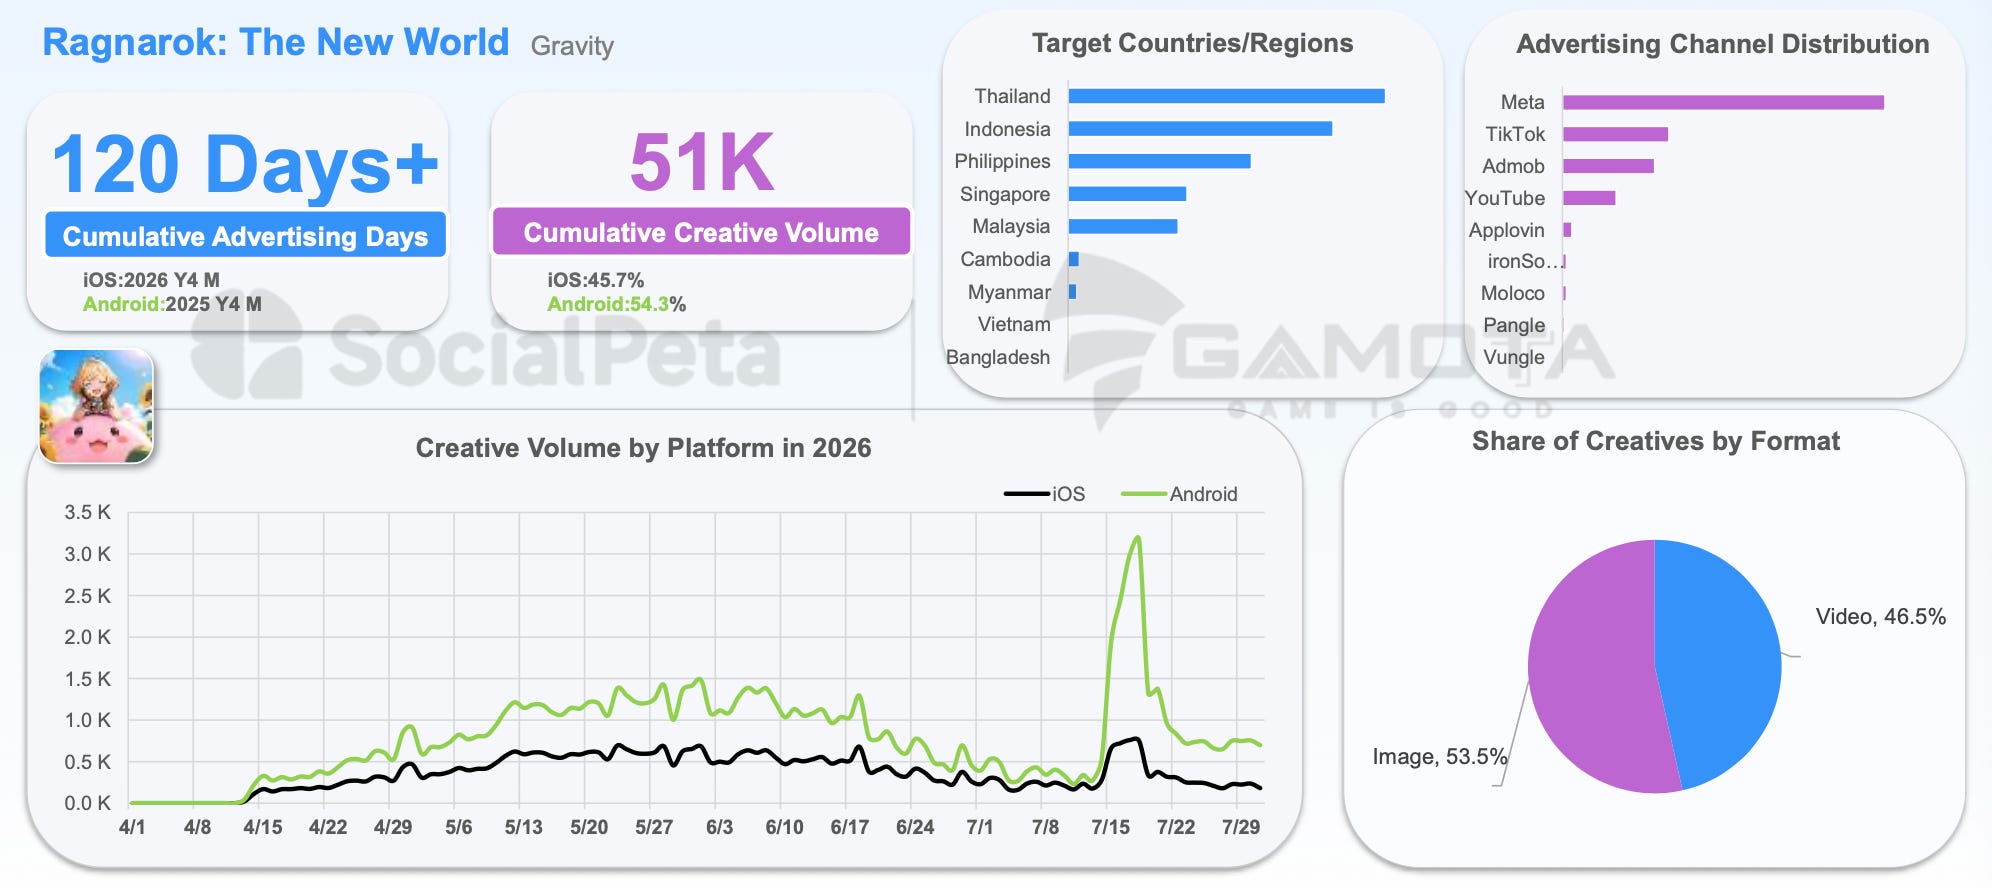
Ragnarok: The New World from Gravity has released 51,000 creatives over 120+ days. Most of its advertising goes to Thailand, Indonesia, and the Philippines, with Meta as the main channel. Interestingly, the game has more static creatives than videos (53.5%).
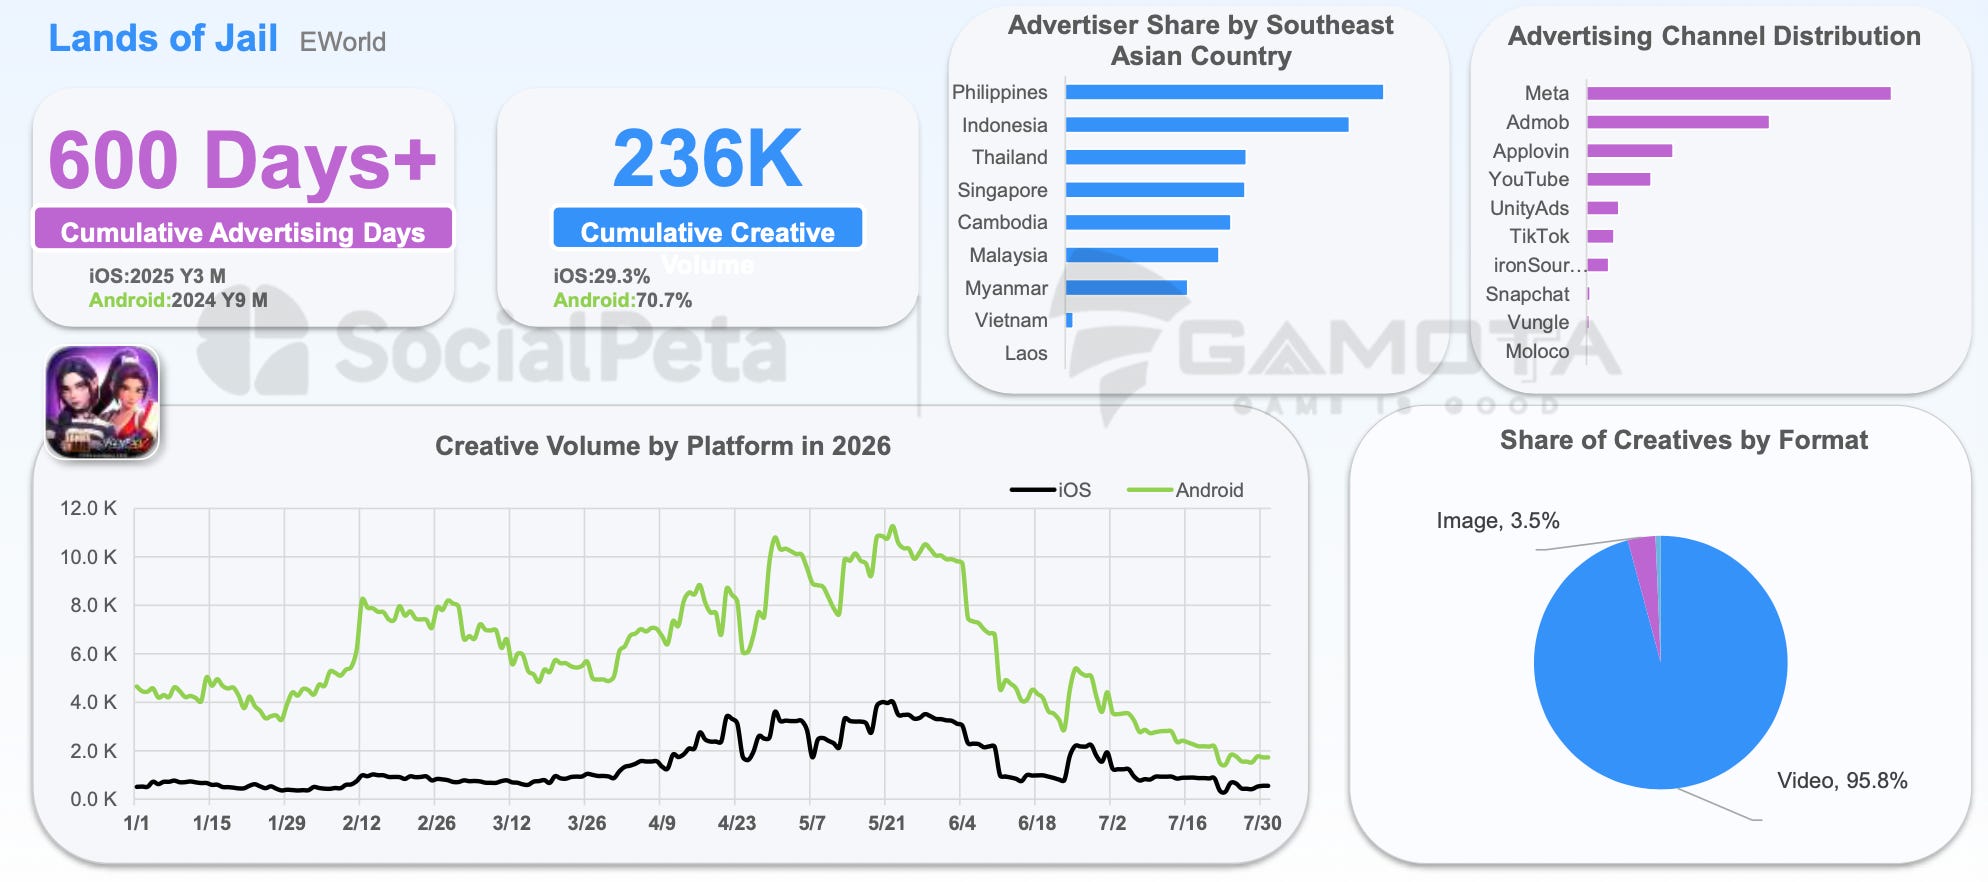
Lands of Jail has been active on the ad market for more than 600 days, releasing 236,000 creatives over that time. Of these, 95.8% are video, and 70.7% run on Android. In the region, the Philippines and Indonesia receive the most ad spend. The main channels are Meta, AdMob, and AppLovin.
RPG Games Marketing Approach
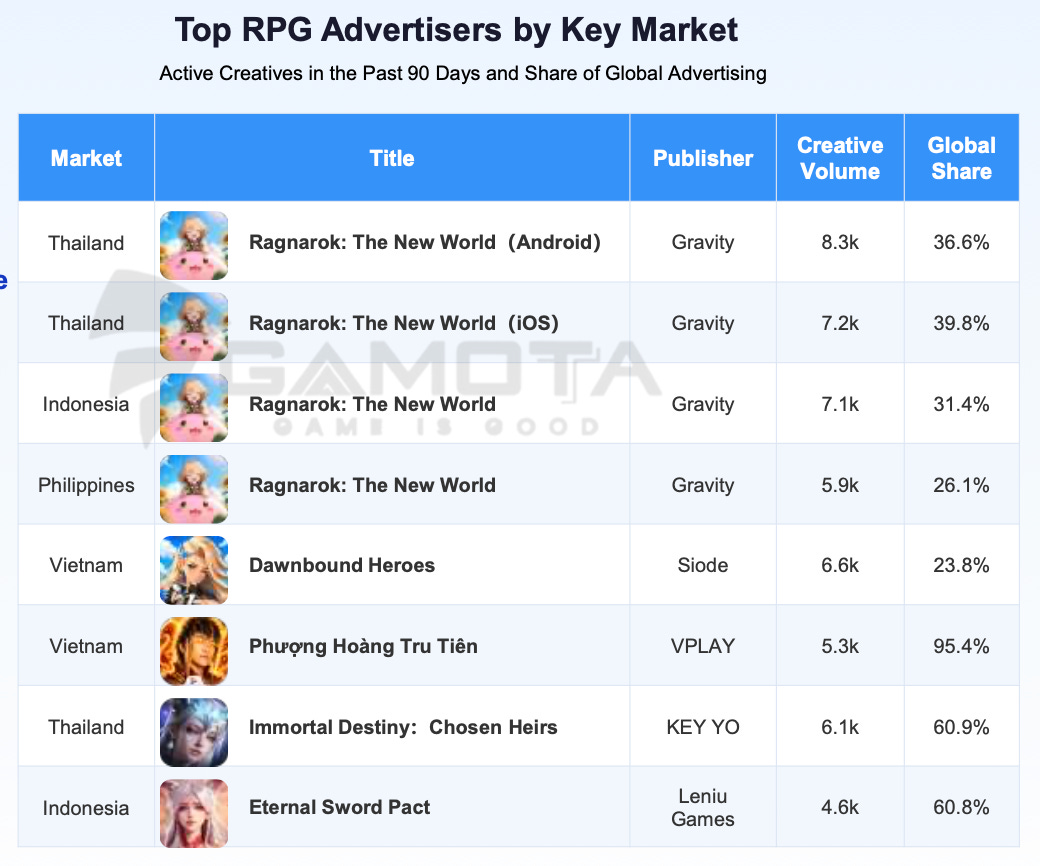
In January-July, Southeast Asia had 7,914 active RPG advertisers. Ragnarok: The New World leads by number of creatives in Indonesia, Thailand, and the Philippines. These countries account for 26-40% of the game's creatives worldwide.
In Vietnam, local publishers (VPLAY, WEPLAY, OEG, VTC, and VNG) lead with MMOs set in wuxia, xianxia, and Three Kingdoms. Of their creatives, 82-95% run only in Vietnam.
Chinese publishers are active across several markets: Habby (Dicero, Archero 2), Leniu (Eternal Sword Pact), and Century Games (Kingshot) advertise heavily in Southeast Asia.
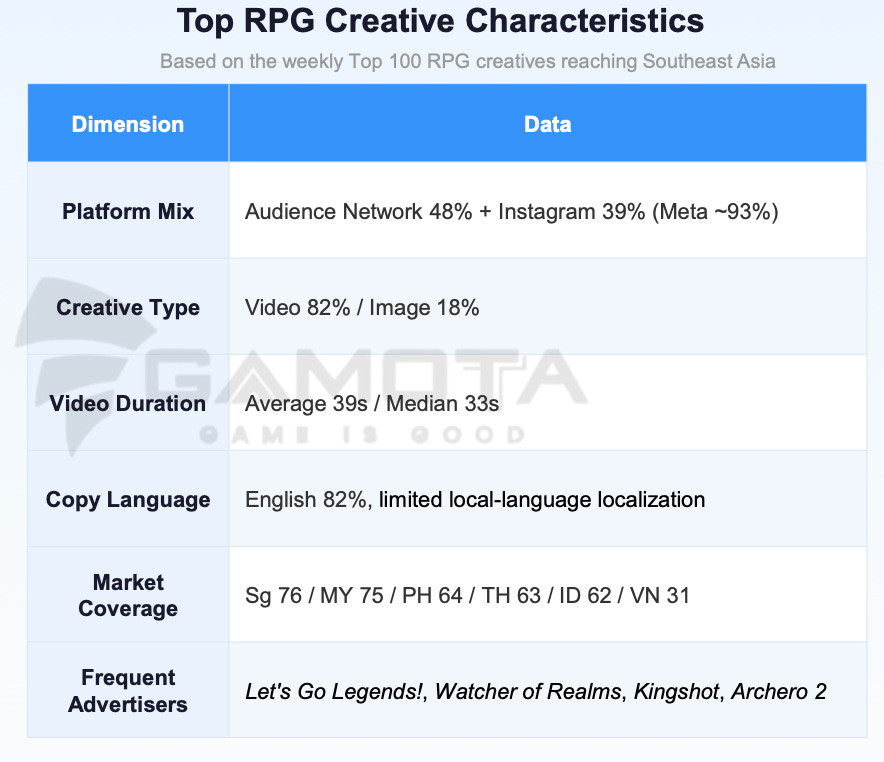
Meta's placements carry ~93% of top RPG creatives: Audience Network accounts for 48%, and Instagram for 39%. Video makes up 82% of creatives, and the average video is 39 seconds long.
From concept art to launch-day marketing, most game studios rely on contractors in multiple countries. Mellow makes it simple to hire, pay, and stay compliant with talent in 150+ countries — no legal entity required.
English is used in 82% of top creatives, and localization is fairly rare. These creatives most often run in Singapore (76%) and Malaysia (75%), and least often in Vietnam (31%).
Larger projects rely more on Google channels. Genshin Impact relies on AdMob (33%) and YouTube (29%); Honkai: Star Rail relies on YouTube (36%) and AdMob (35%).
Strategy Games Marketing Approach
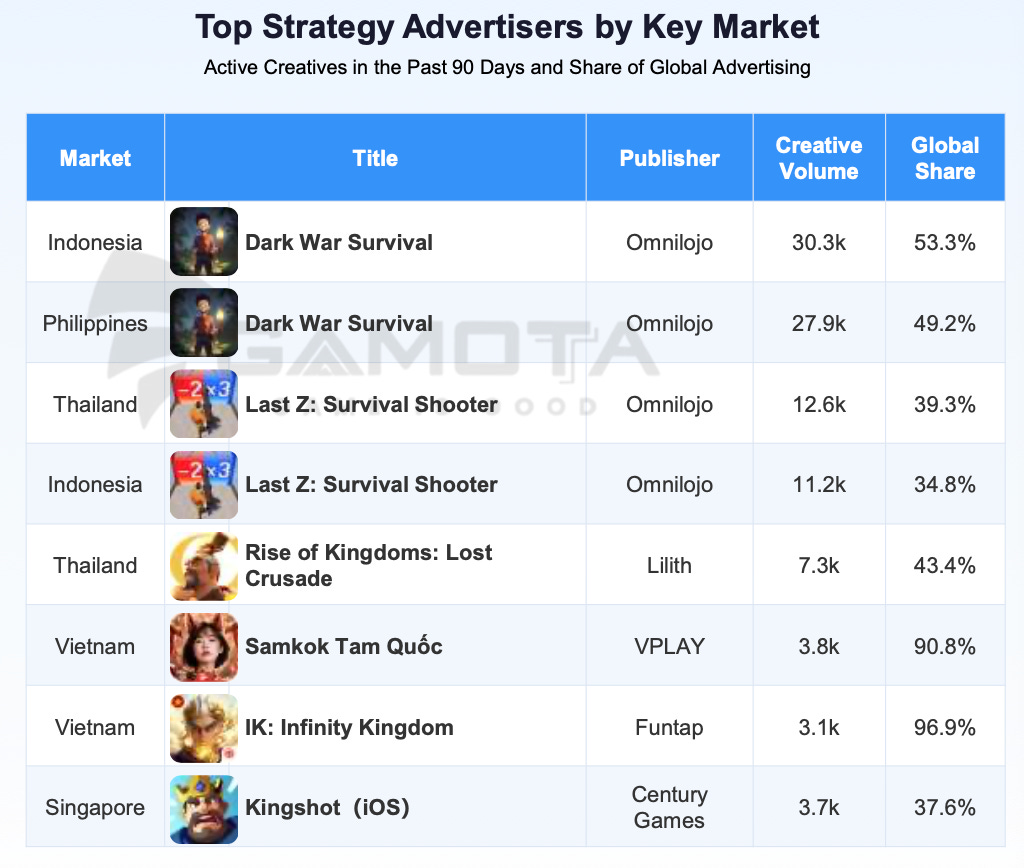
Strategy has 6,800 active advertisers. Survival strategy games from Omnilojo lead: Dark War Survival ranks first in Indonesia and the Philippines, and Last Z: Survival Shooter ranks first in Thailand.
Dark War Survival had 57,000 creatives over 90 days. Of these, 53.3% ran in Indonesia, and 49.2% in the Philippines.
Kingshot ranks second in Singapore on iOS, third in the Philippines and Thailand, and fifth in Indonesia.
In Vietnam, as with RPG, local publishers lead. VPLAY's Samkok Tam Quốc runs 90.8% of its creatives only in Vietnam; Funtap's IK: Infinity Kingdom, 96.9%.
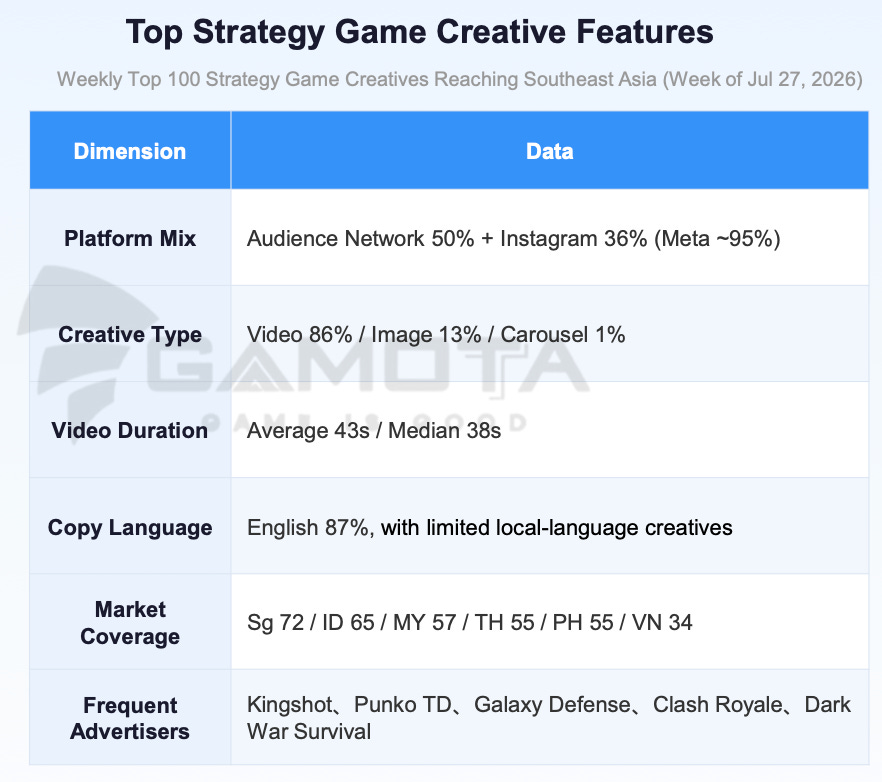
The creative picture is similar to RPG. Meta's placements carry ~95% of top creatives; video makes up 86%, the average video is 43 seconds long, and 87% are in English. Only 34% of these creatives run in Vietnam.
SocialPeta notes that strategy creatives are getting "lighter." The main hook is now showing TD gameplay and other simple mechanics.
GameDiscoverCo: Top Games on Steam and Consoles in September 2026
Data from GameDiscoverCo Pro. The unit charts include both direct Steam sales and keys sold outside the platform. The revenue charts include only direct Steam sales, and all revenue is gross (before platform fees and taxes).
Top 10 new Steam releases by copies sold
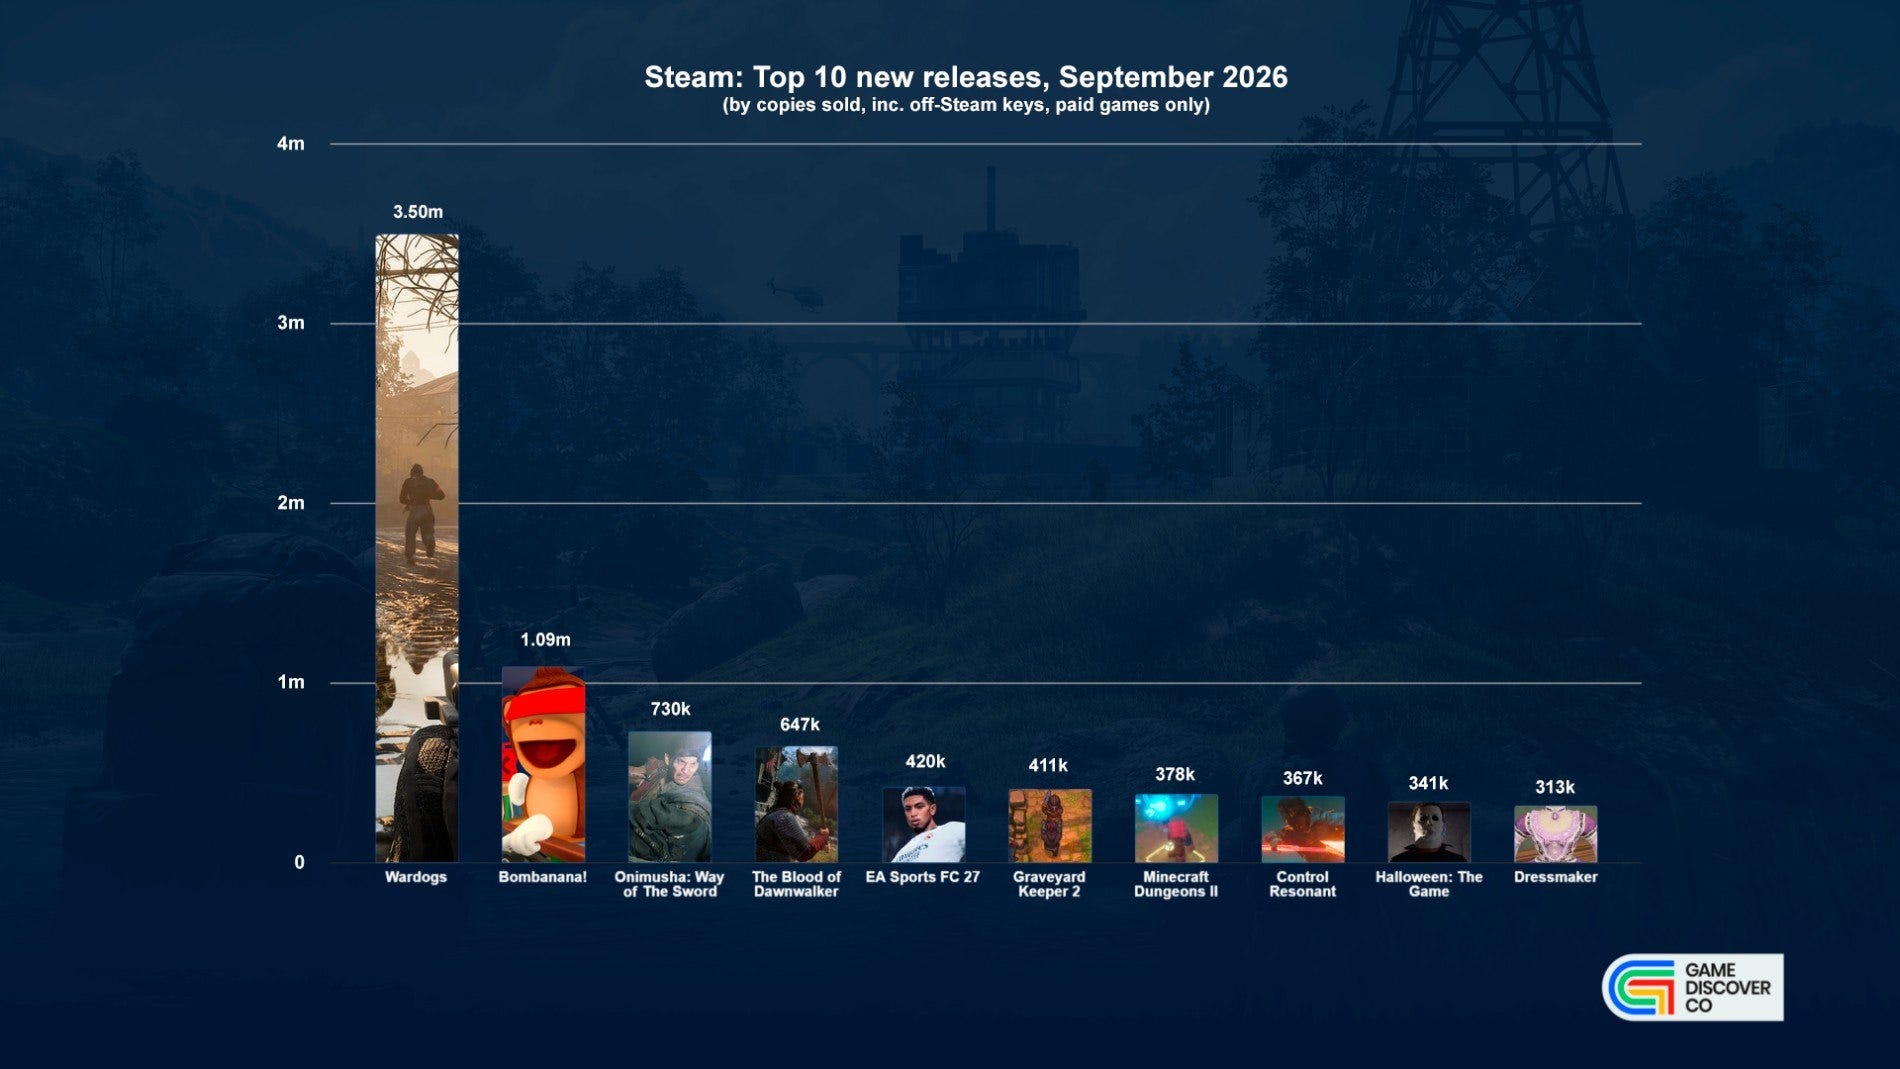
Wardogs is September's biggest hit by a wide margin. The 100-player tactical shooter launched in Early Access on September 10 and, by the end of the month, had sold 3.5 million copies on Steam.
At its peak, Wardogs had ~420k concurrent players. Its daily peak now holds at ~200k, so GameDiscoverCo sees no serious retention issues.
Co-op bomb disposal game Bombanana! is second with 1.09 million copies.
A word from our sponsor

Game studios run on contractors — artists, composers, QA testers, translators — often spread across a dozen countries. That’s a lot of contracts, tax rules, and IP clauses to track. Mellow handles all of it: compliant contracts, automated payments, and IP protection built in, for contractors in 150+ countries.
Onimusha: Way of the Sword sold 730k copies on Steam and almost 2 million across all platforms.
The Blood of Dawnwalker sold 647k copies on Steam and over a million across all platforms. GameDiscoverCo suggests its development budget was around $40 million.
Besides Bombanana!, two indies stood out: Graveyard Keeper 2 from Lazy Bear Games and tinyBuild (411k copies) and Dressmaker (313k). Dressmaker is a tailoring sim that launched at month's end.
Control Resonant only launched on September 24, but it has already sold 367k copies on Steam. On PlayStation and Xbox, it has over 200k copies combined. GameDiscoverCo notes, though, that the IP may not have the broad casual reach of some other big brands.
Top 10 new Steam releases by revenue
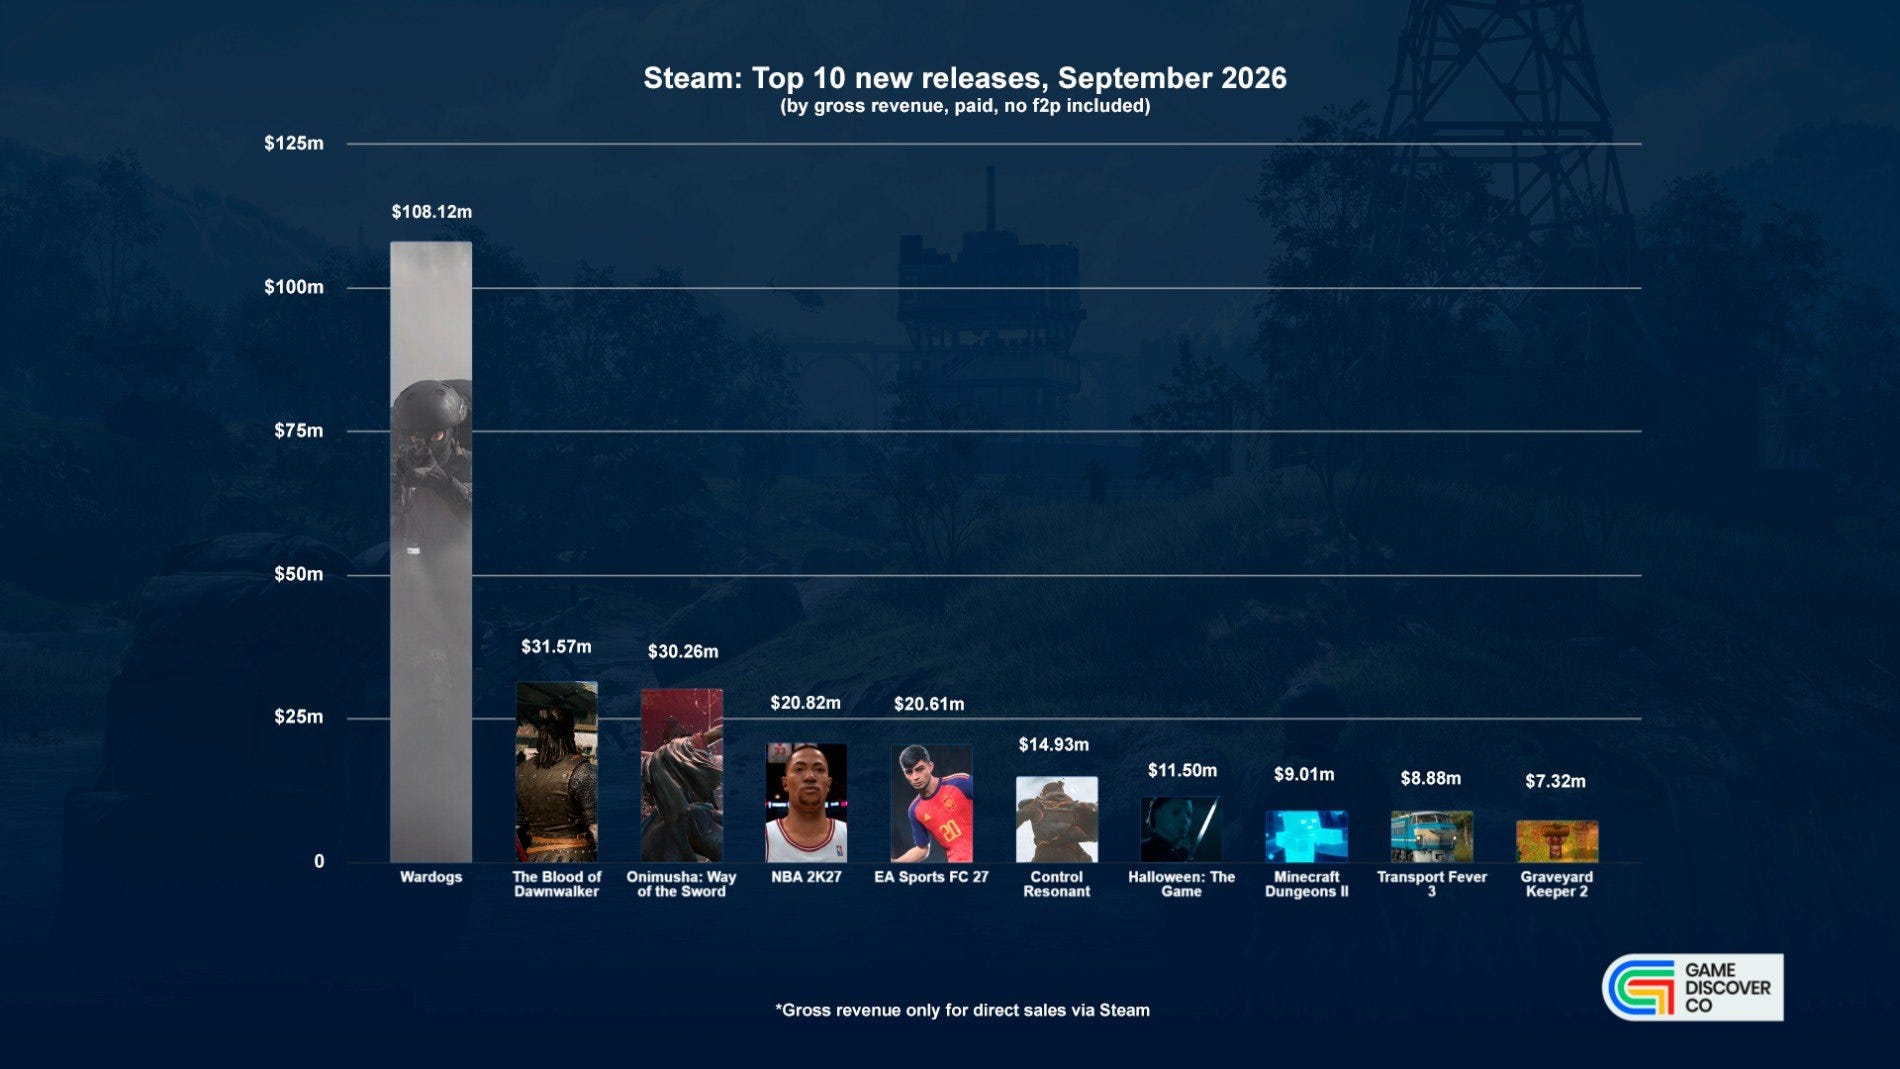
Wardogs earned $108.12 million. That is more than the next four new releases combined.
The Blood of Dawnwalker ($31.57 million) and Onimusha: Way of the Sword ($30.26 million) are right behind.
NBA 2K27 just missed the Top 10 by copies, but it is fourth by revenue ($20.82 million).
Minecraft Dungeons II ($9.01 million) and Transport Fever 3 ($8.88 million) launched at the very end of the month. The September chart covers only their first few days of sales.
In September, seven new releases cleared $10 million. In August, six did.
Top 10 Steam games by revenue (all games)
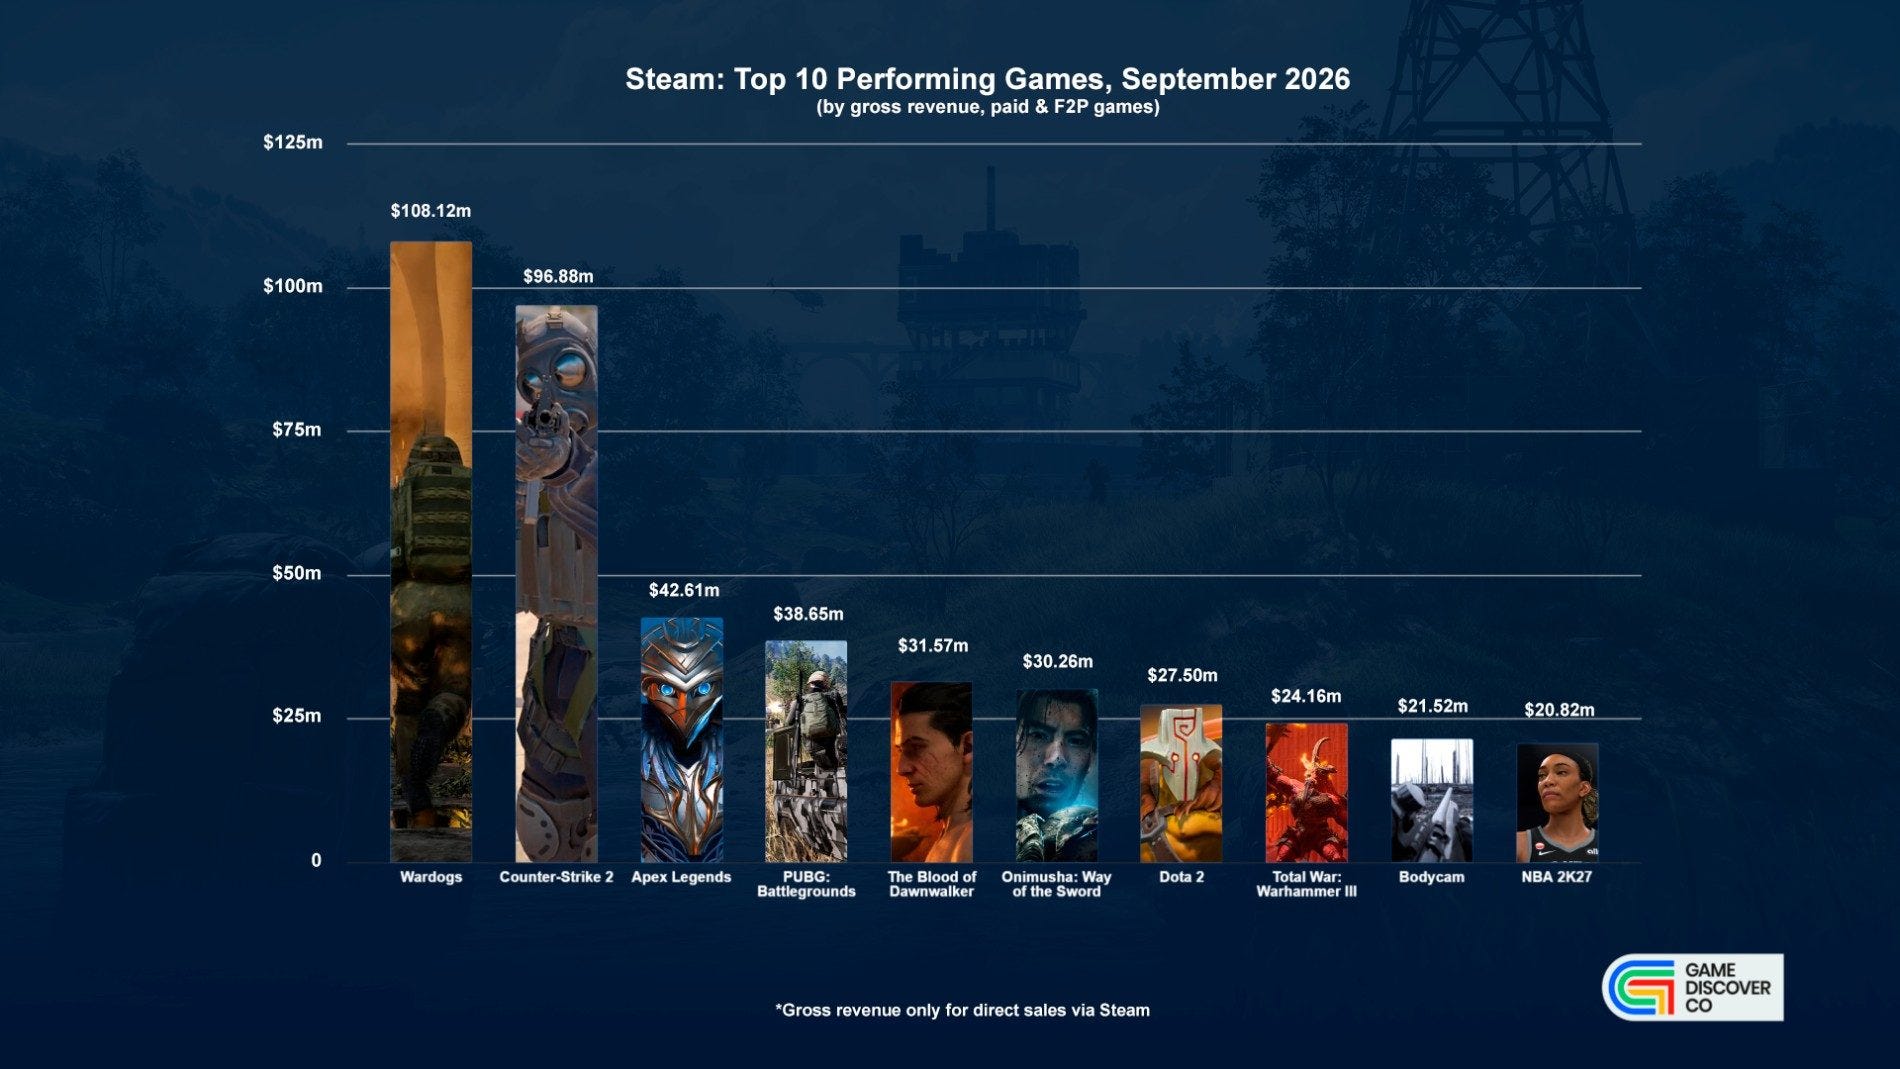
Wardogs overtook Counter-Strike 2 and took first place. CS2 earned $96.88 million in September ($131.2 million in August). GameDiscoverCo notes, though, that the numbers are very close, and the real order could go either way.
F2P titles Apex Legends ($42.61 million) and PUBG: Battlegrounds ($38.65 million) are next. In August, Apex Legends earned $88.95 million on the launch of a new season.
Total War: Warhammer III is eighth with $24.16 million, thanks to the big Lord of the End Times expansion. You can play it without the base game, but GameDiscoverCo suspects most buyers already own it.
Shooter Bodycam earned $21.52 million after a big free update. In total, GameDiscoverCo estimates the game has earned ~$70 million on Steam.
Top 11-30 on Steam by revenue
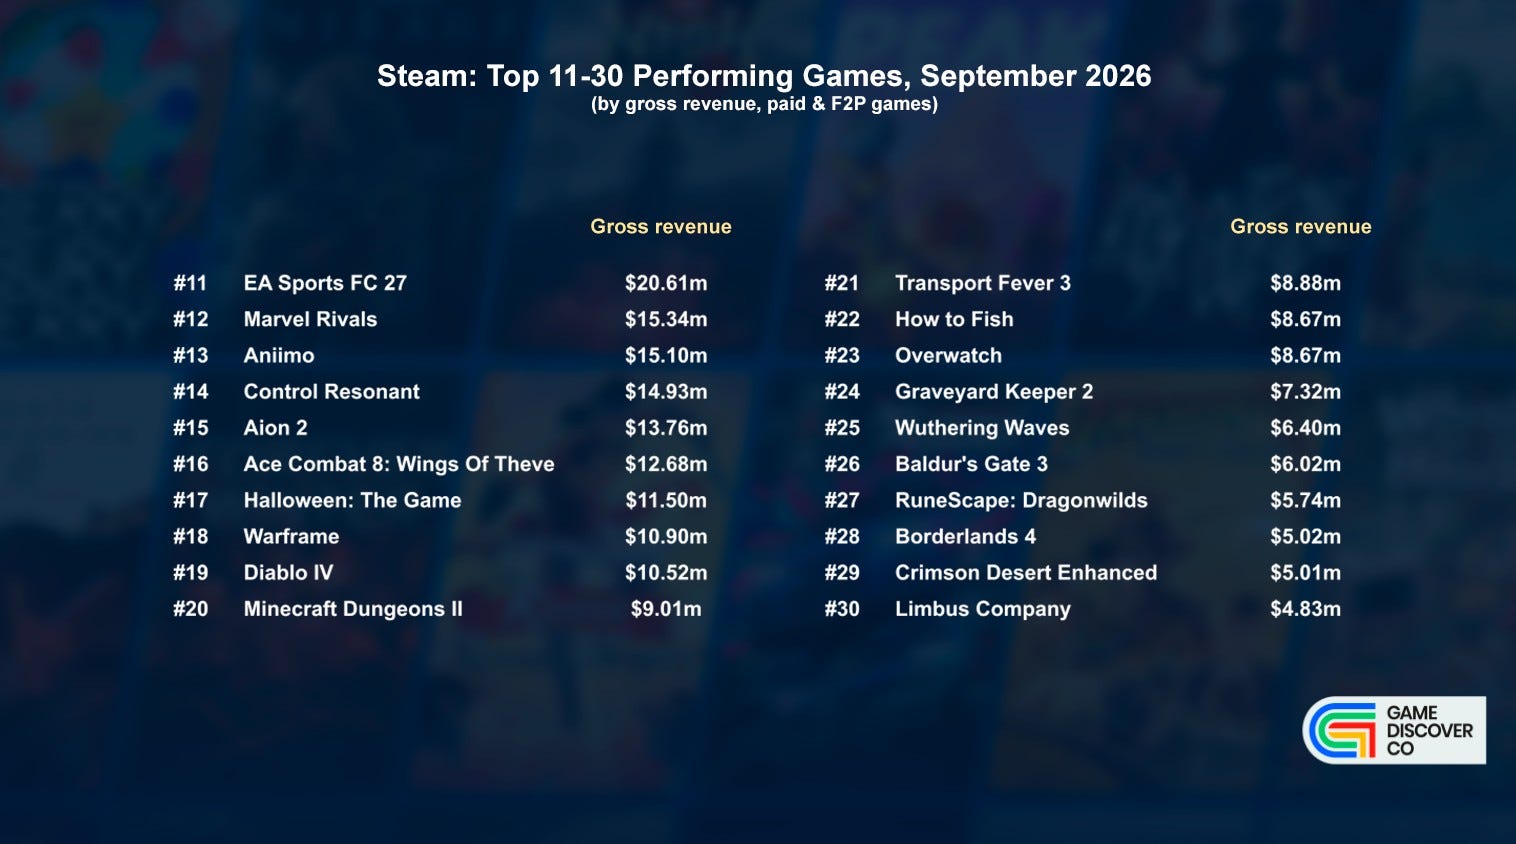
New F2P gacha creature collector Aniimo earned $15.1 million (#13). If GameDiscoverCo included F2P in the new releases chart, it would rank sixth.
August's biggest hit, How To Fish, earned another ~$6.5 million in September. It has now sold over 8.5 million copies, and its revenue has passed $38 million.
Console sales
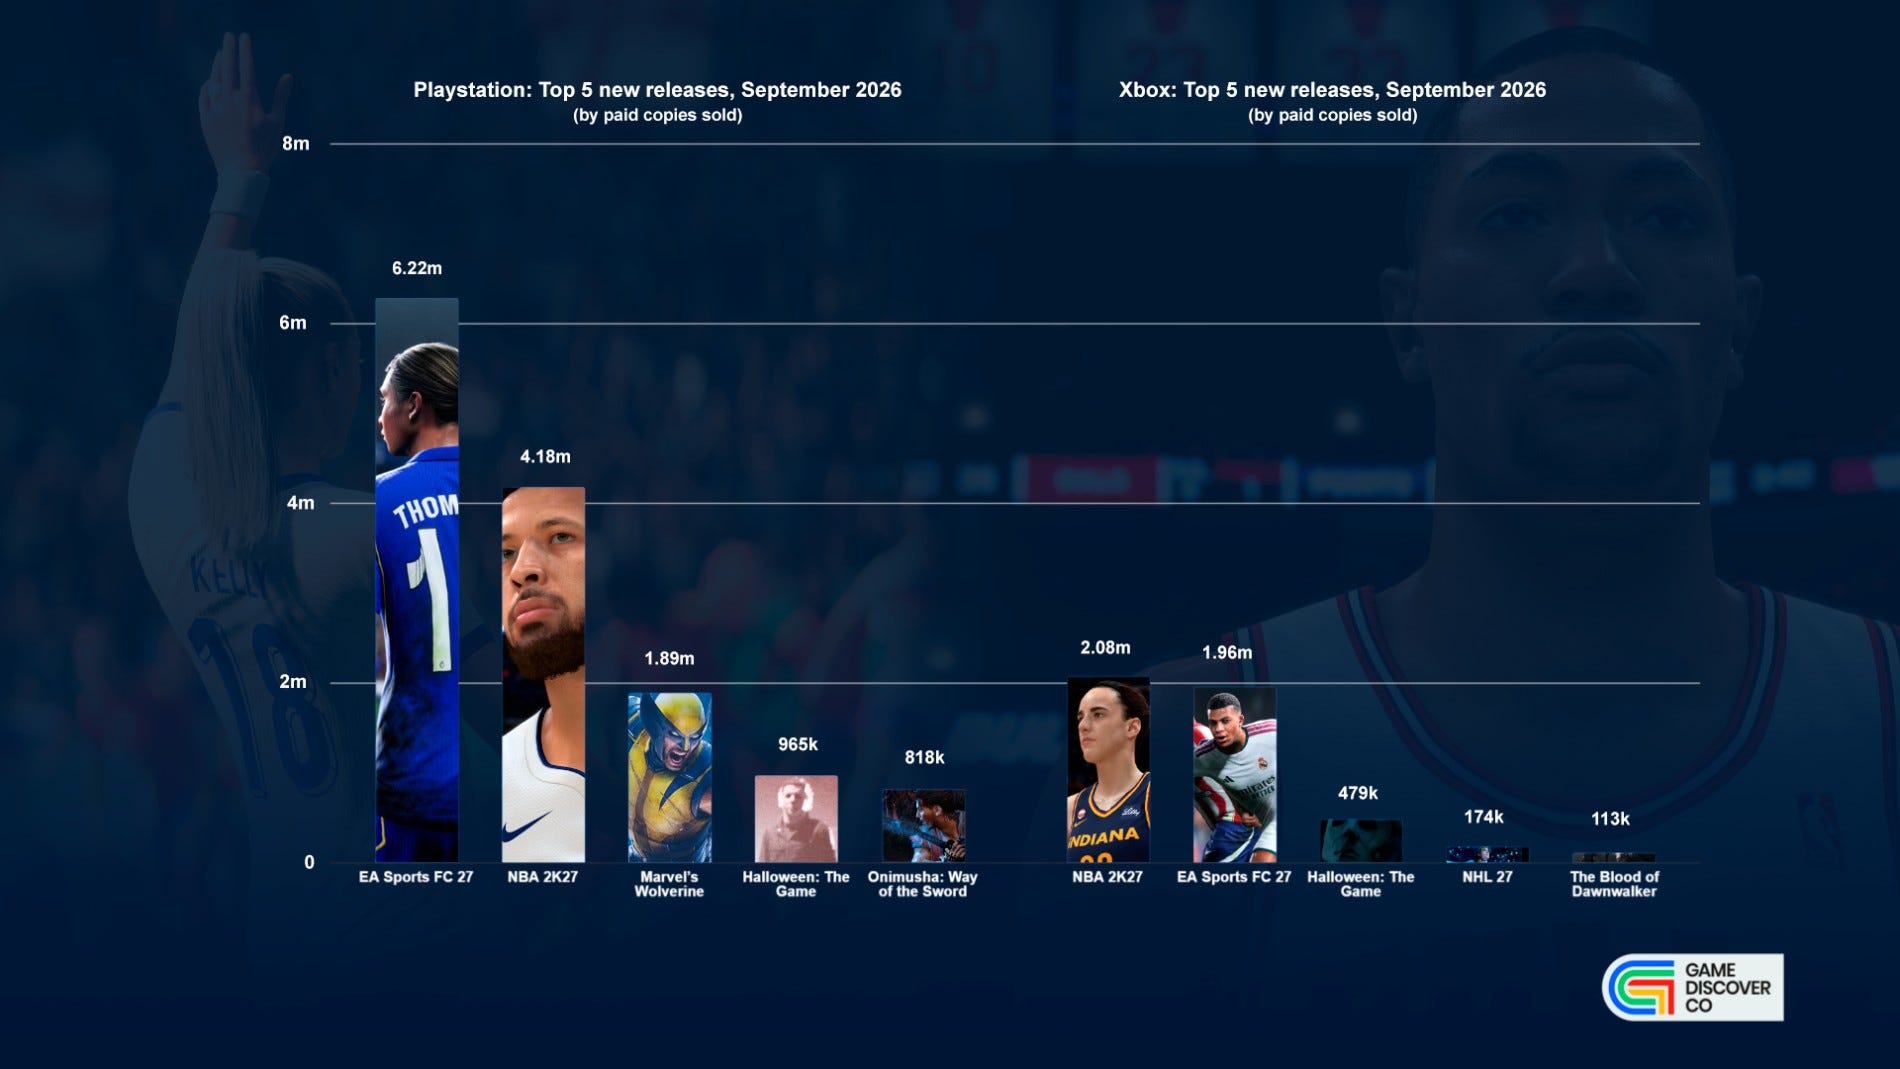
September was a busy month on PlayStation, led by sports franchises. EA Sports FC 27 sold 6.22 million copies on PlayStation and 1.96 million on Xbox. NBA 2K27 sold 4.18 million copies on PlayStation and 2.08 million on Xbox. And that is without subscription services.
PlayStation-exclusive Marvel's Wolverine debuted at #3 (1.89 million copies), and sales are still growing.
Asymmetric horror game Halloween: The Game sold 965k copies on PlayStation and 479k on Xbox. That is far more than on Steam (341k copies). On PlayStation, it even beat Onimusha: Way of the Sword (818k).
The next notable PlayStation debuts: The Blood of Dawnwalker (~400k copies), Silent Hill: Townfall (~200k), and Control Resonant (~175k).
In the Western eShop (based on US and UK charts), September's biggest new release is Nintendo's Fire Emblem: Fortune's Weave. It has around 500k digital sales, and even more on cartridges.
Indie hit Meccha Chameleon (over 200k copies) and co-op exclusive Orbitals (over 100k) are selling well. EA Sports FC 27, Diablo IV, and Minecraft Dungeons II also charted.
Twitch
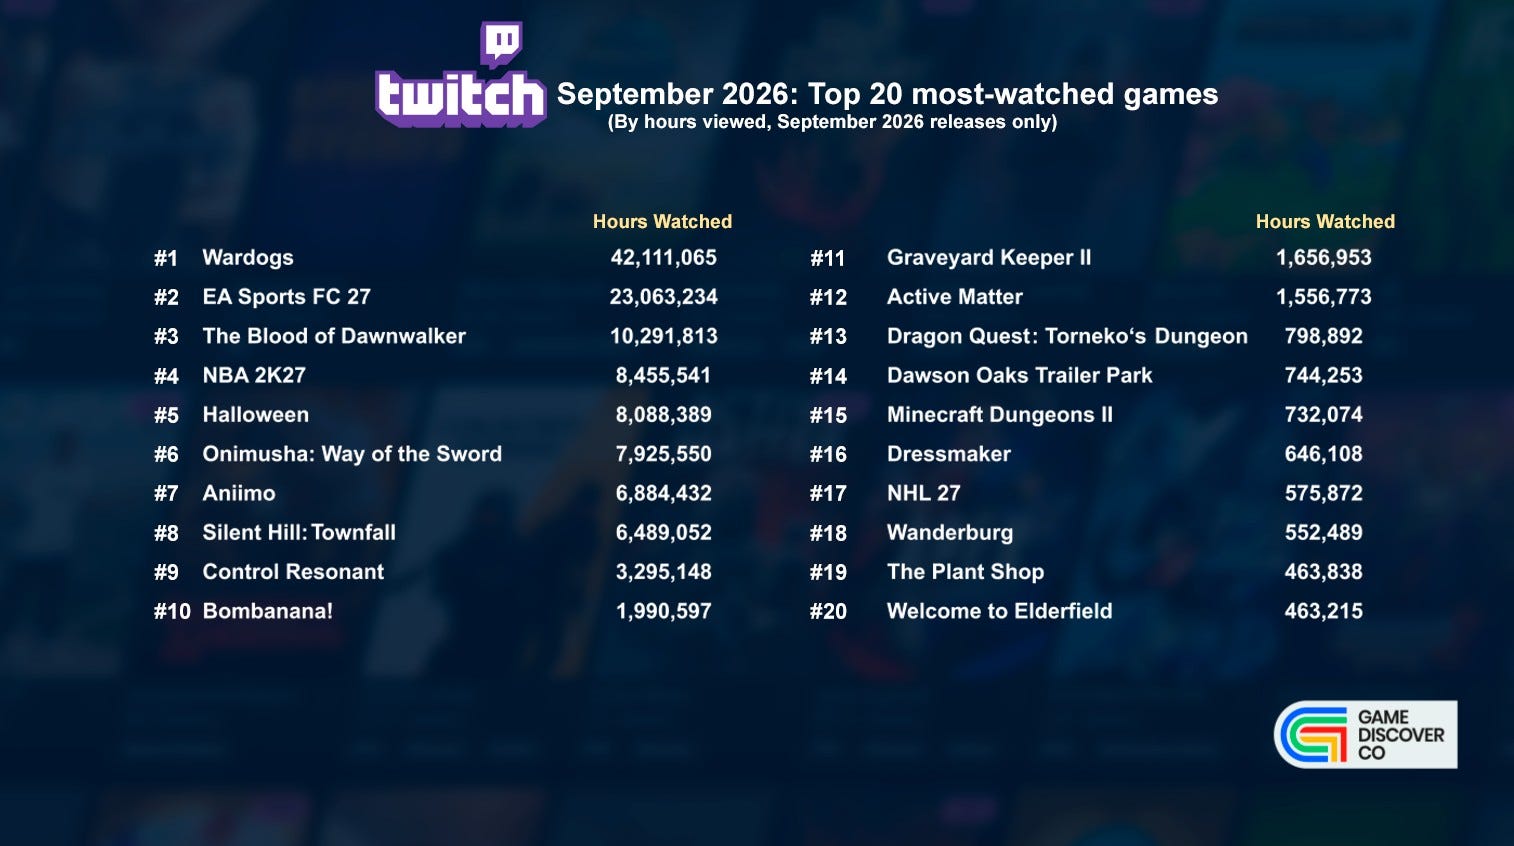
Among September's new releases, Wardogs was the most-watched with 42.11 million hours. It even beat EA Sports FC 27 (23.06 million hours). The Blood of Dawnwalker is third (10.29 million hours).
In August, Big Walk was the top new release on Twitch with 5.61 million hours, while Meccha Chameleon pulled 23.6 million hours in June.
Overall, the month was packed with releases. GameDiscoverCo suggests many publishers are trying to launch before GTA VI.
Aream & Co.: Game Investments in Q3'26 | GameDev Reports is powered by Mellow

Mobile market data comes from Sensor Tower; Steam and console data come from Alinea Analytics; deal and investment data come from InvestGame; and public market data comes from FactSet.
All numbers are as of September 30, 2026. LTM (last twelve months) figures are calculated as of the end of Q3.
Market overview
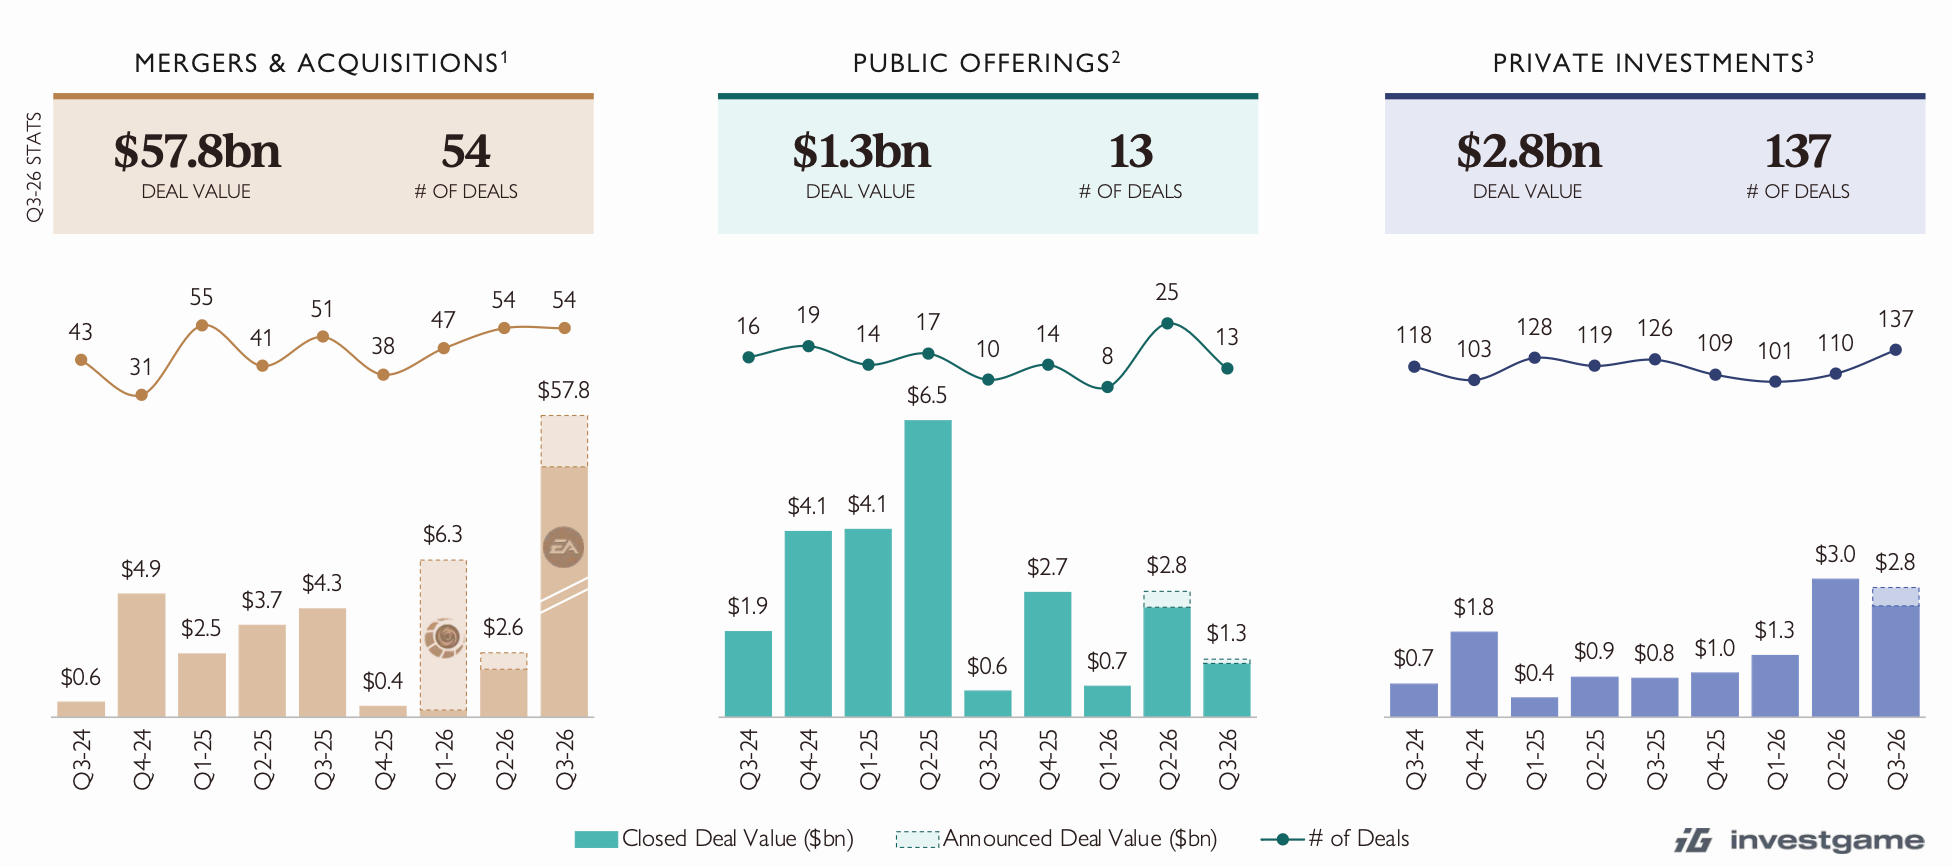
Q3'26 saw 54 M&A deals worth $57.8 billion. Almost all of that value came from the $55 billion acquisition of EA by a consortium of PIF, Silver Lake, and Affinity Partners, which closed in August. Without it, M&A value was ~$2.8 billion.
Public markets saw 13 deals worth $1.3 billion (+122% YoY).
A word from our sponsor

Need a freelance 3D artist, composer, or QA tester fast? Mellow’s AI Scout finds qualified talent in under 48 hours — free to try, no commitment. Describe the role, get a shortlist, hire when you’re ready.
Private investment more than tripled YoY to $2.8 billion, across 137 deals.
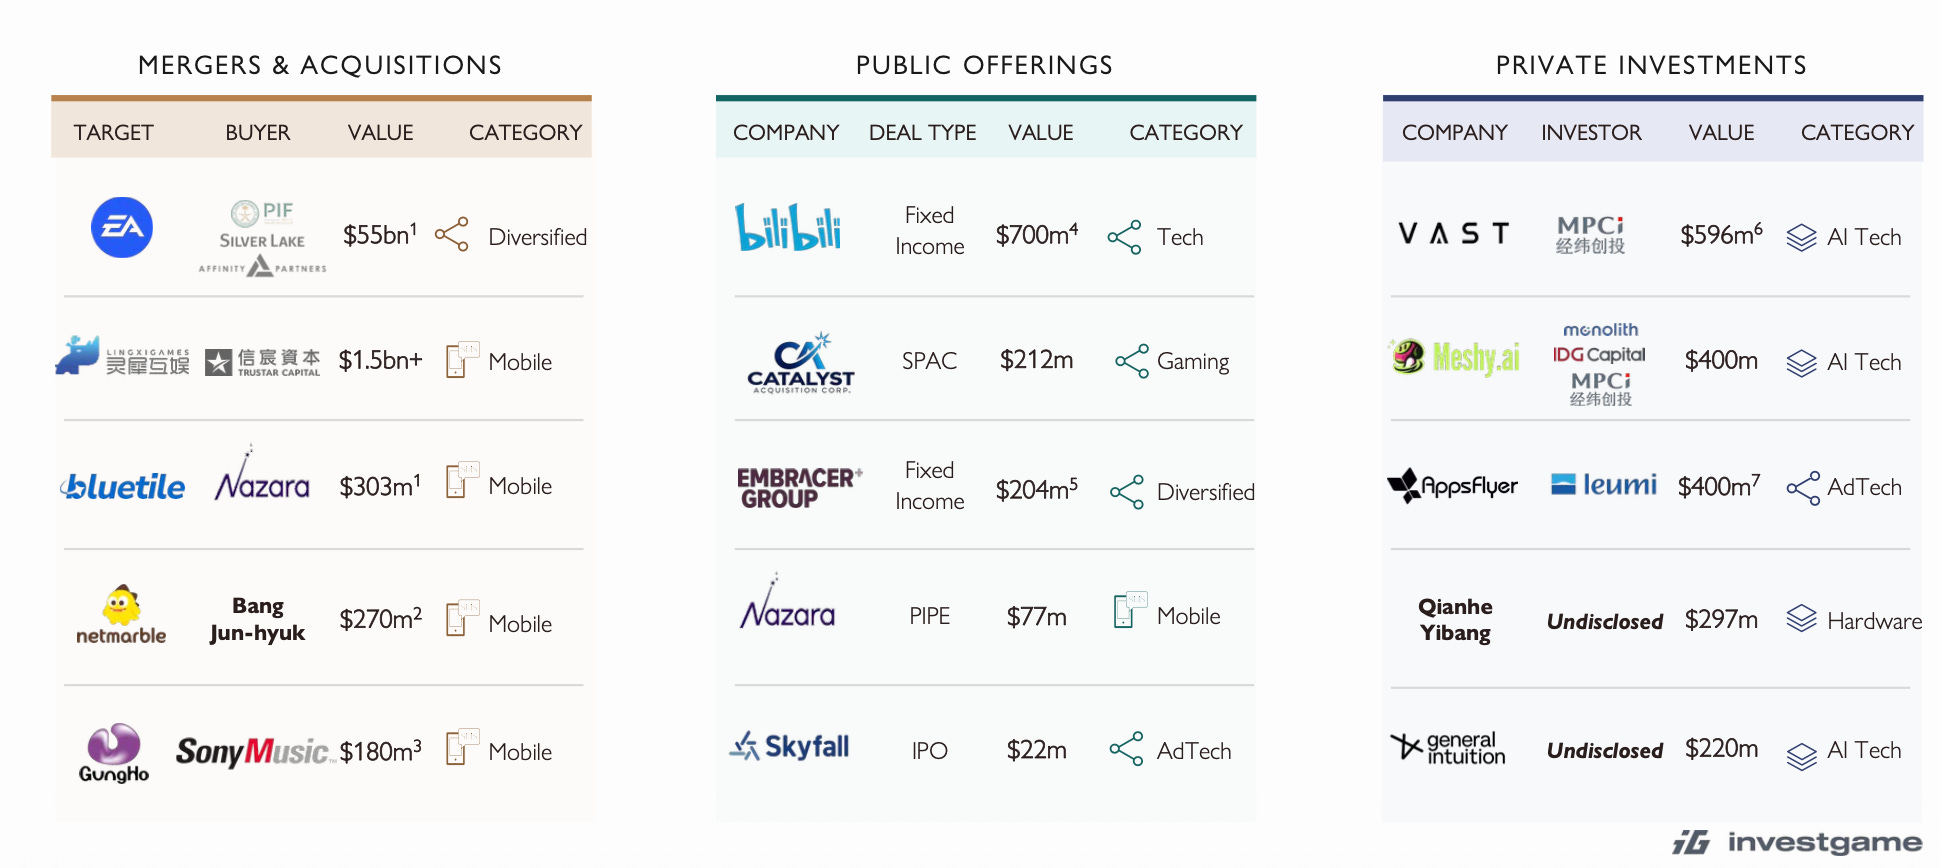
Aream & Co. notes that Asian companies led the quarter's most notable deals. Alibaba is selling Lingxi Games to Trustar Capital for more than $1.5 billion, Netmarble's founder bought out Tencent's stake in the company for $270 million, and Sony Music Entertainment is buying a stake in GungHo for $180 million.
Mobile market
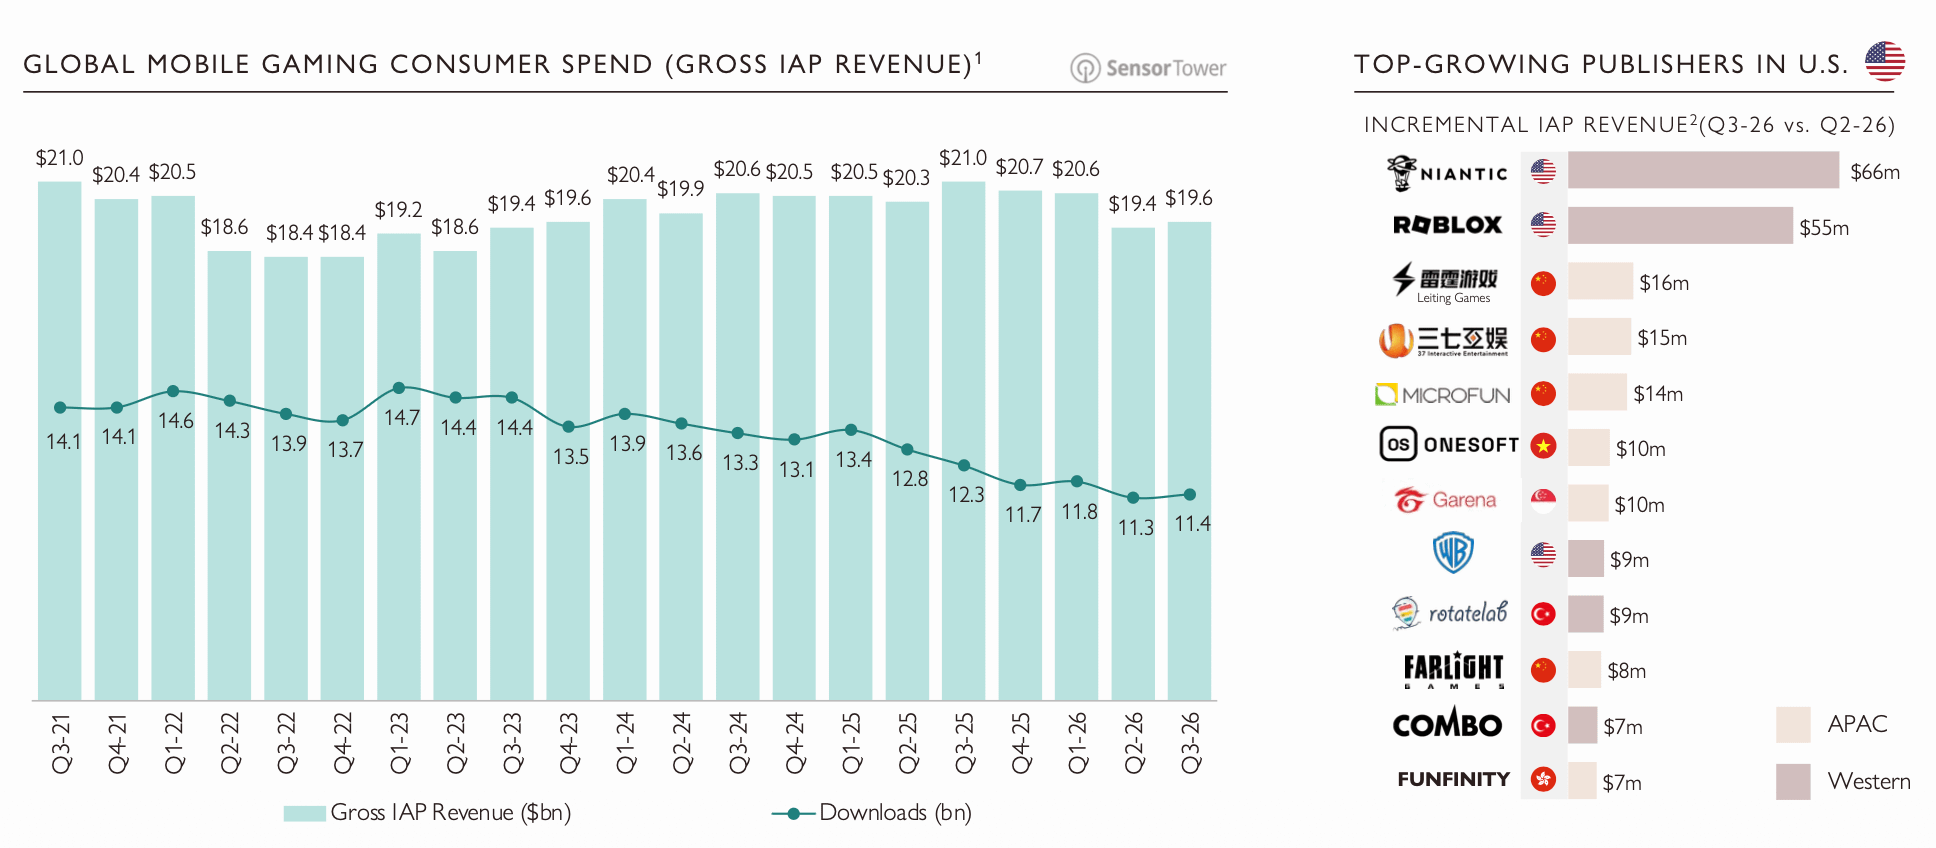
Mobile game IAP revenue in Q3'26 was $19.6 billion (-7% YoY). That is slightly more than in Q2'26 ($19.4 billion). Over the last 12 months, revenue declined 2%.
❗️Keep in mind that Sensor Tower only counts the App Store and Google Play, so D2C payments are not included. Part of the decline may come from players increasingly paying through web shops.
Downloads in Q3'26 came to 11.4 billion (-7% YoY). Over the last 12 months, installs fell 10%.
In the U.S., Niantic (+$66 million), Roblox (+$55 million), and Leiting Games (+$16 million) added the most revenue compared with Q2'26.
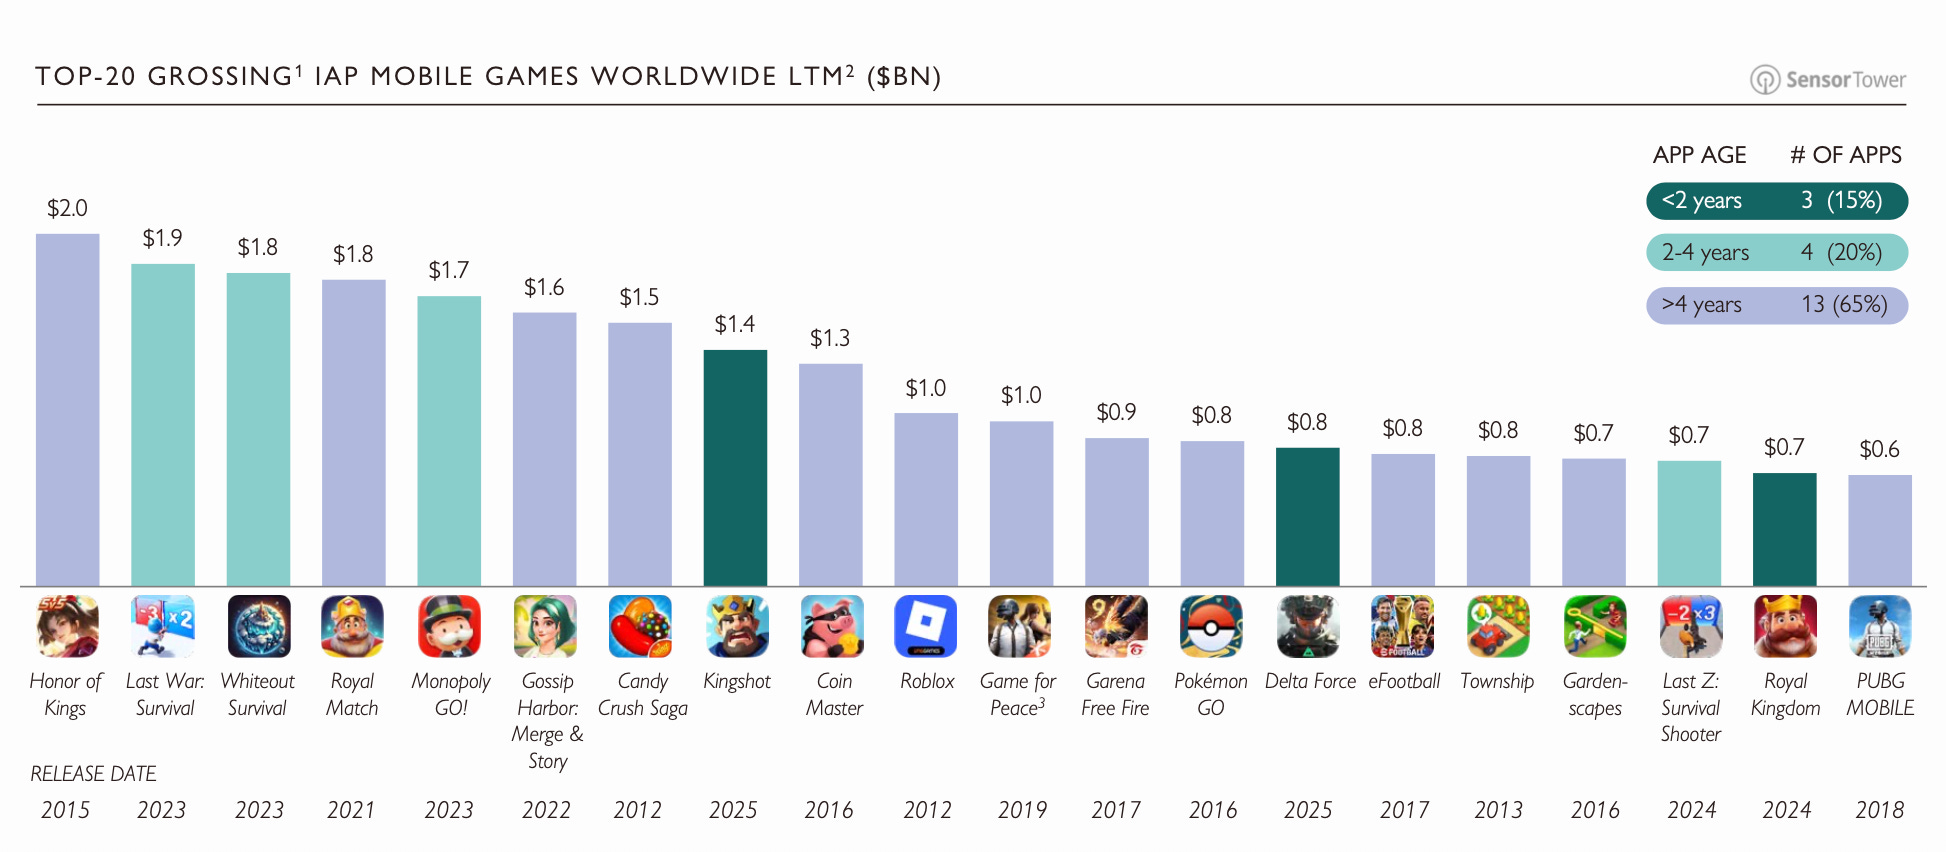
None of the top 20 mobile games by IAP revenue over the last 12 months are 2026 releases. Three games on the list are under two years old: Kingshot ($1.4 billion), Delta Force ($0.8 billion), and Royal Kingdom ($0.7 billion). Last quarter, two were. 13 of the 20 games (65%) are more than four years old.
Revenue leaders: Honor of Kings ($2 billion), Last War: Survival ($1.9 billion), and Whiteout Survival ($1.8 billion).
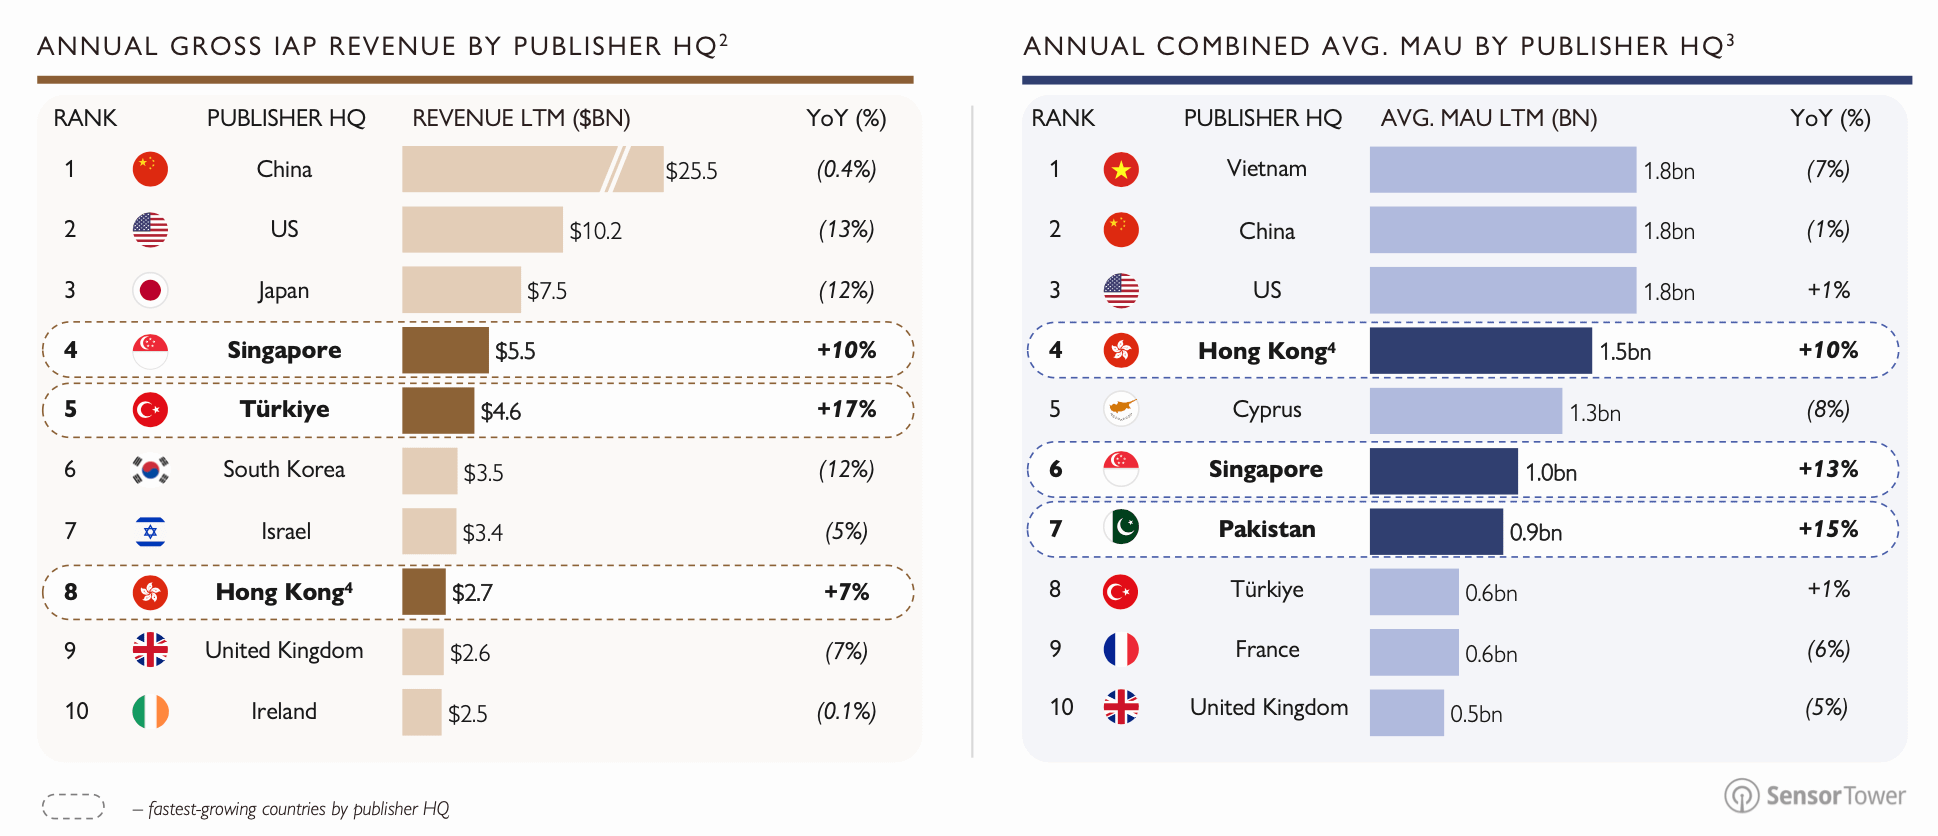
By IAP revenue over the last 12 months (countries are assigned by publisher HQ), China leads ($25.5 billion; -0.4% YoY), followed by the U.S. ($10.2 billion; -13% YoY) and Japan ($7.5 billion; -12% YoY).
In the top 10, only Singapore ($5.5 billion; +10% YoY), Türkiye ($4.6 billion; +17% YoY), and Hong Kong ($2.7 billion; +7% YoY) are growing. Growth has slowed, though: last quarter, Singapore was up 32% and Türkiye 25%.
By average MAU, Vietnam leads (1.8 billion; -7% YoY), followed by China (1.8 billion; -1% YoY) and the U.S. (1.8 billion; +1% YoY). Cyprus is fifth (1.3 billion; -8% YoY). Pakistan (+15%), Singapore (+13%), and Hong Kong (+10%) are growing the fastest.
PC/console market
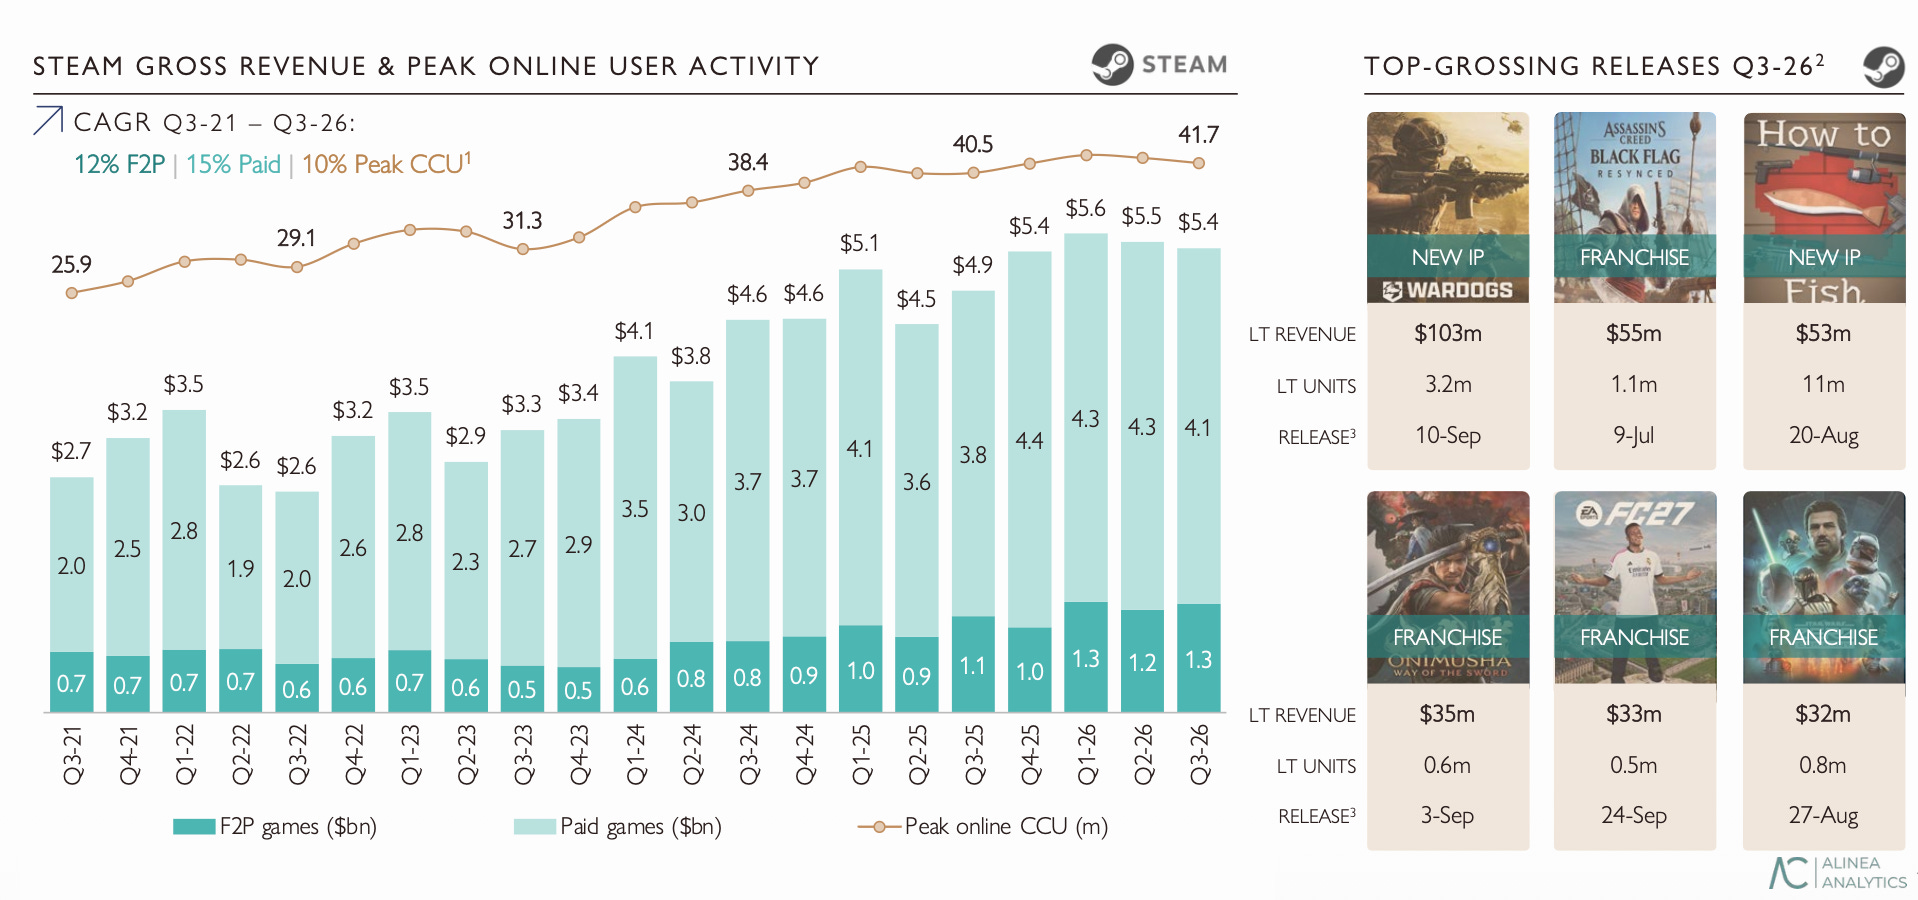
Steam continues to grow at double-digit rates: LTM revenue is up 14% YoY. In Q3'26, the platform earned $5.4 billion (+10% YoY), with $4.1 billion coming from paid games and $1.3 billion from F2P.
Peak CCU in Q3'26 was 41.7 million (40.5 million a year earlier). Steam's Q3'21-Q3'26 CAGR: 12% for F2P games and 15% for paid games; peak CCU grew 10% a year over the same period.
Team17's top-grossing release on Steam this quarter was its new IP, Wardogs ($103 million, 3.2 million copies). Assassin's Creed Black Flag Resynced ($55 million) and How to Fish ($53 million) follow. By copies sold, however, How to Fish beats everyone with 11 million.
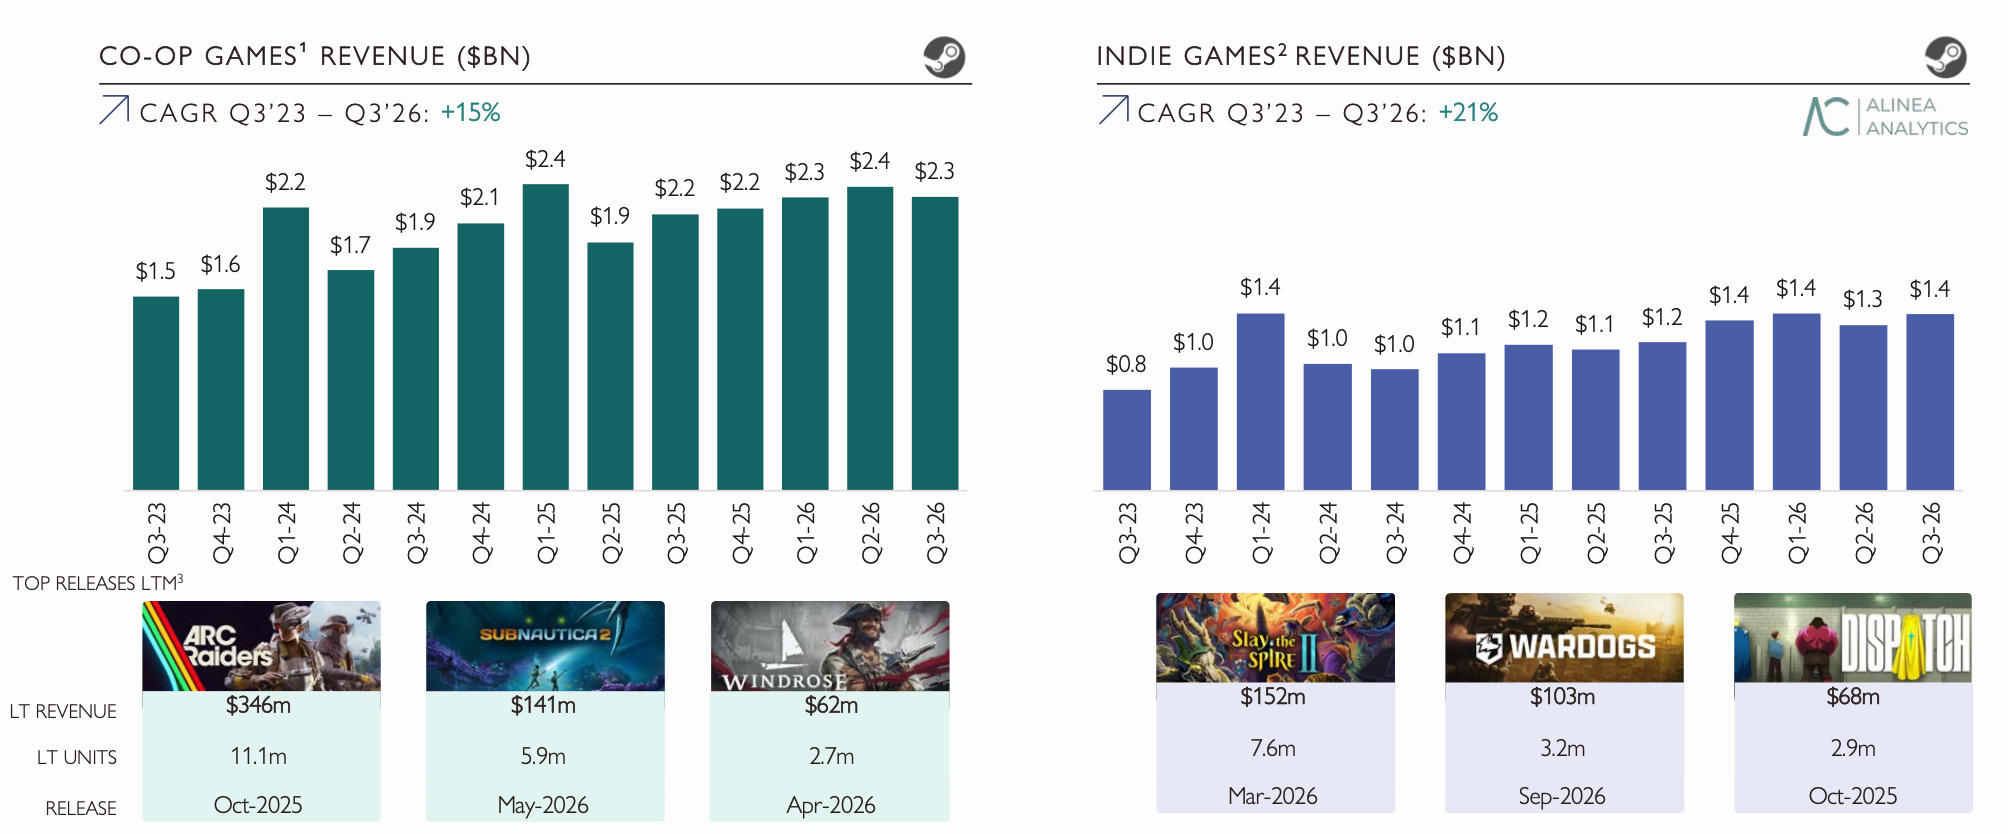
Co-op and indie games drive Steam's growth. Over the last 12 months, co-op game revenue grew 7% YoY, and indie revenue grew 20% YoY.
Among co-op releases of the last 12 months, ARC Raiders ($346 million, 11.1 million copies), Subnautica 2 ($141 million), and Windrose ($62 million) earned the most. Among indie titles, Slay the Spire II ($152 million), Wardogs ($103 million), and Dispatch ($68 million) lead.
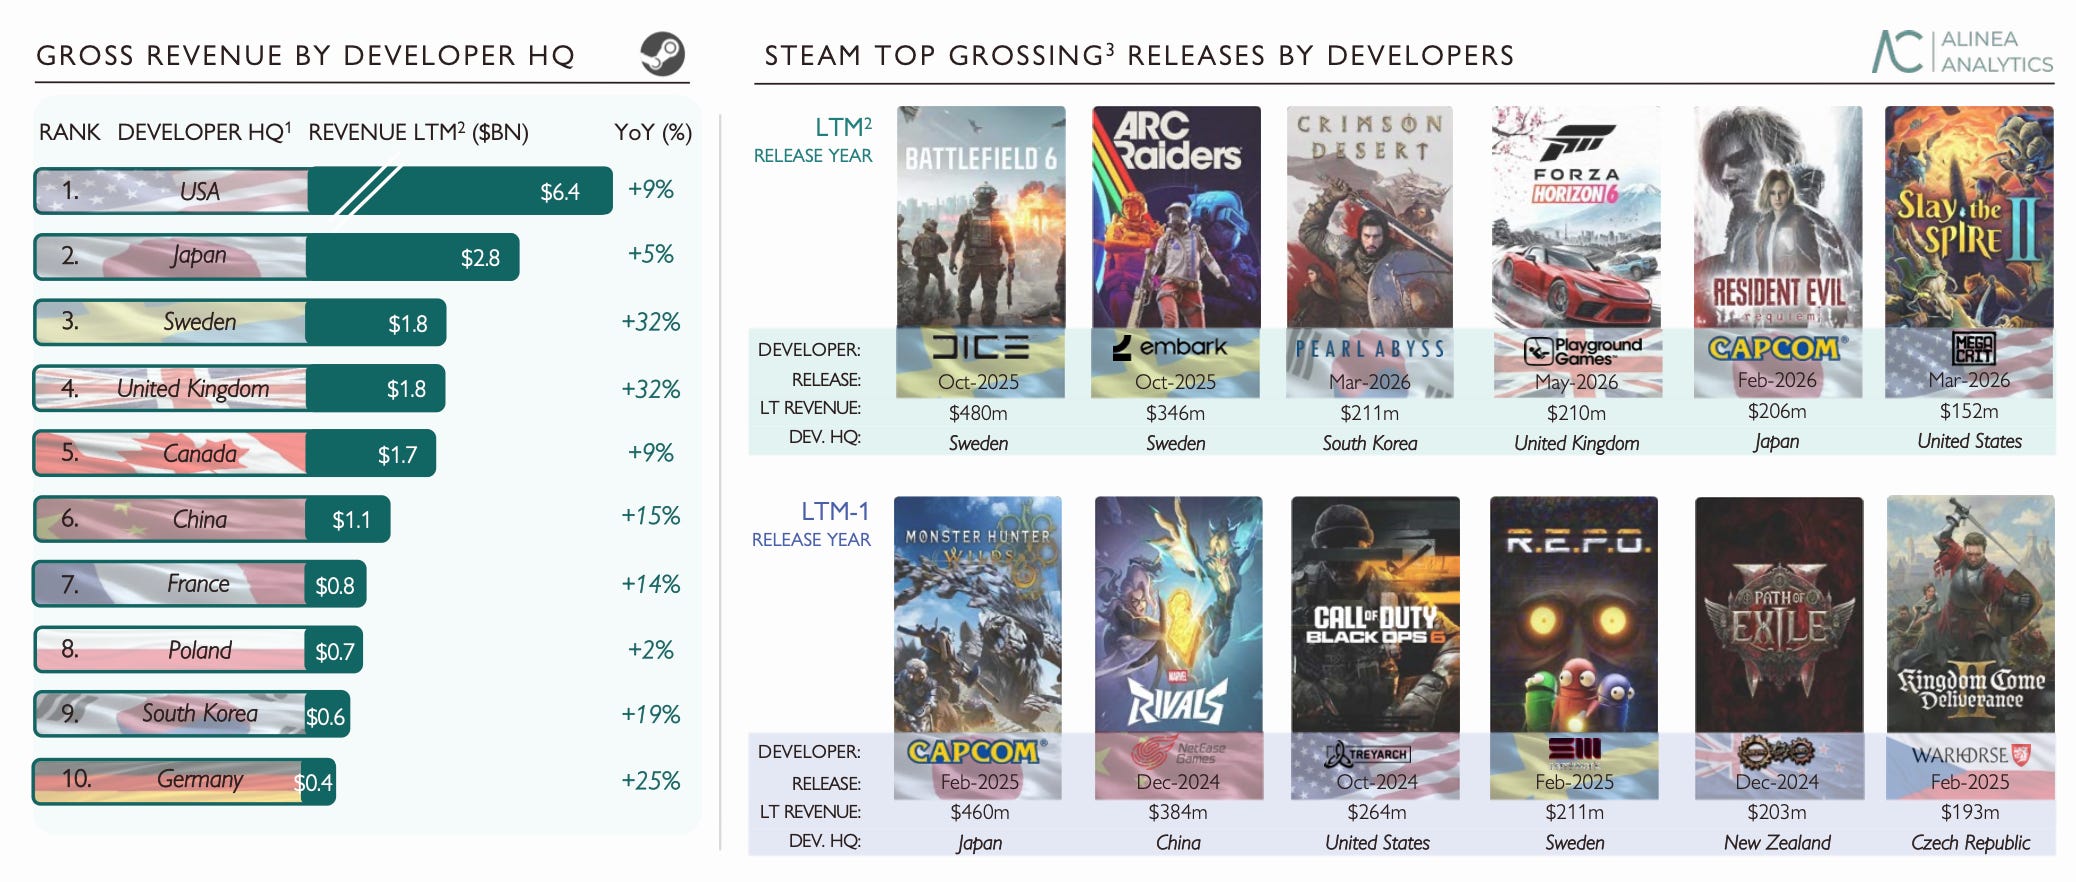
By Steam revenue over the last 12 months (countries are assigned by developer HQ), the U.S. leads ($6.4 billion; +9% YoY), followed by Japan ($2.8 billion; +5% YoY) and Sweden ($1.8 billion; +32% YoY). Sweden's growth came largely from Battlefield 6 ($480 million) and ARC Raiders ($346 million).
Western countries account for 75% of the top 10's revenue.
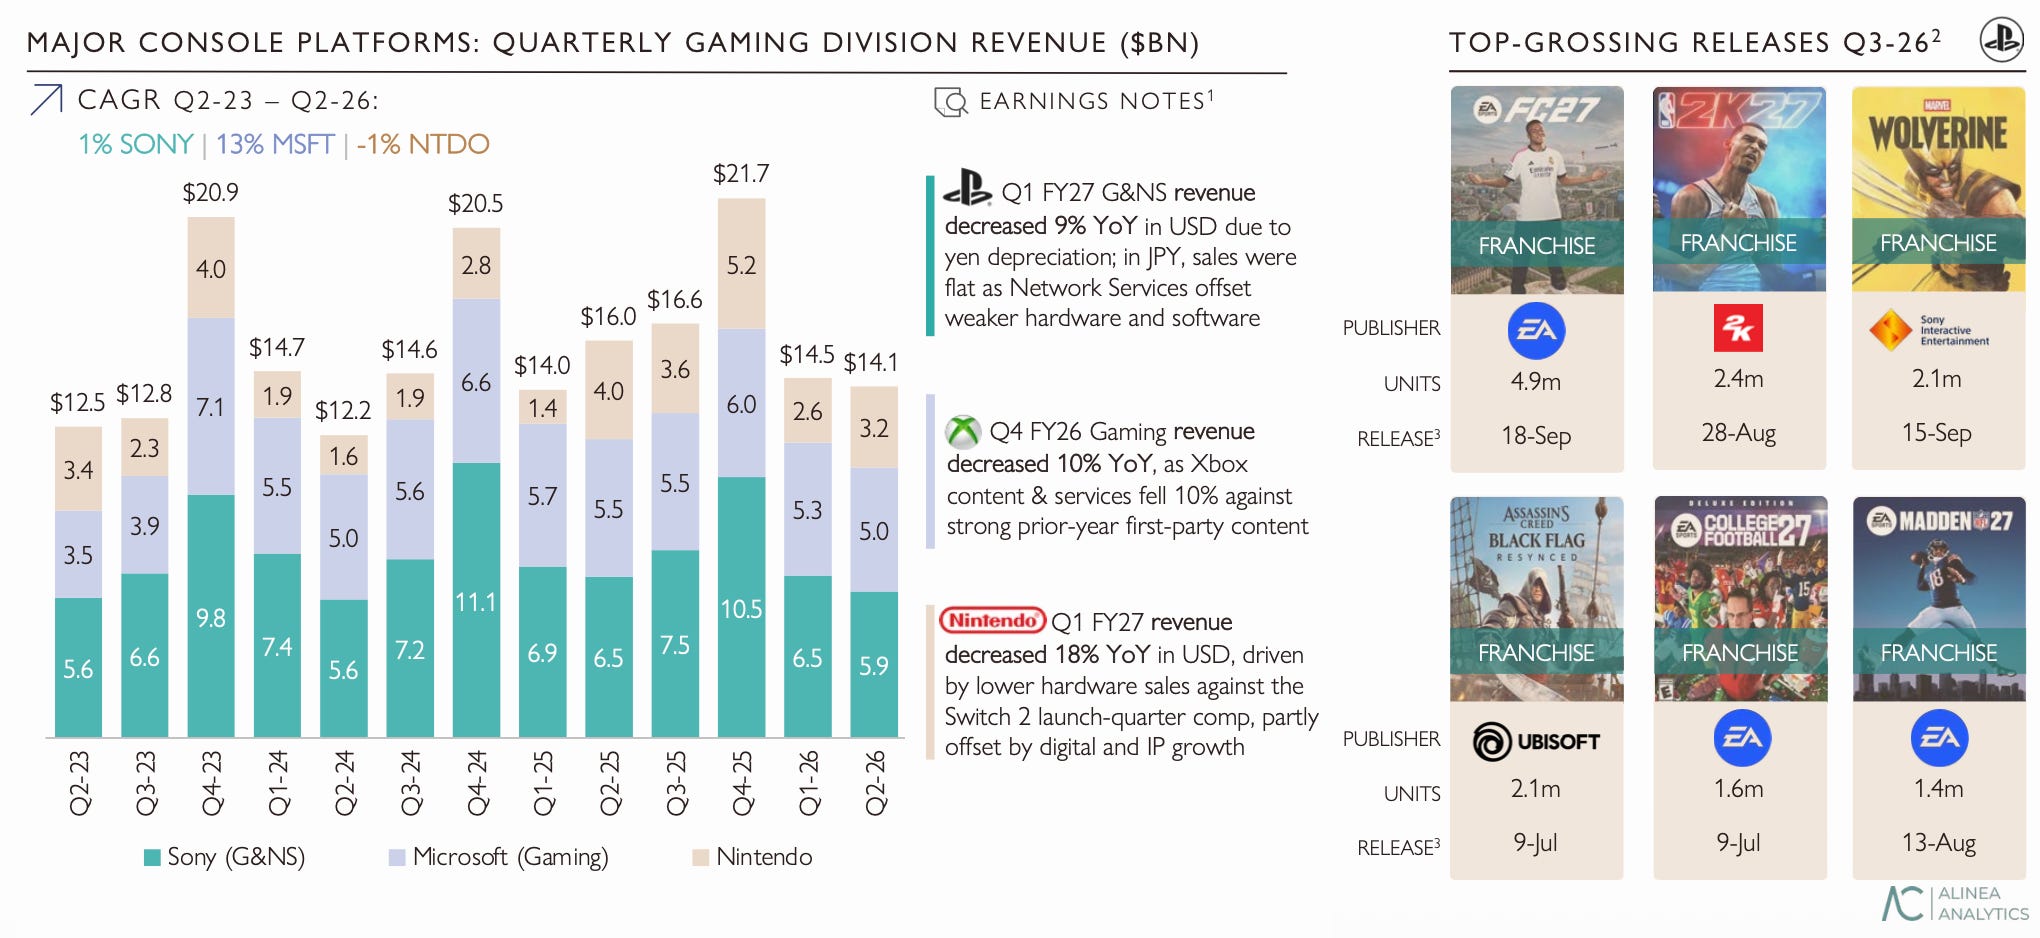
Gaming divisions of Sony, Microsoft, and Nintendo posted $14.1 billion in revenue for April-June 2026 (-12% YoY). Revenue fell at all three companies, and Aream & Co. notes that this is the steepest drop in two years. Last quarter, the console market grew 3%.
Sony's revenue fell 9% YoY in dollars due to the weaker yen; in yen, it was flat. Network Services growth offset weaker console and game sales.
Microsoft's revenue fell 10% YoY. Xbox content and services revenue dropped 10%, against strong first-party releases a year earlier.
Nintendo's revenue fell 18% YoY in dollars. But the decline is measured against a high base (the Switch 2 launch). Growth in digital sales and IP revenue partly offset it.
EA SPORTS FC 27 (4.9 million copies), NBA 2K27 (2.4 million), and Marvel's Wolverine (2.1 million) were the best sellers on PlayStation in Q3'26.
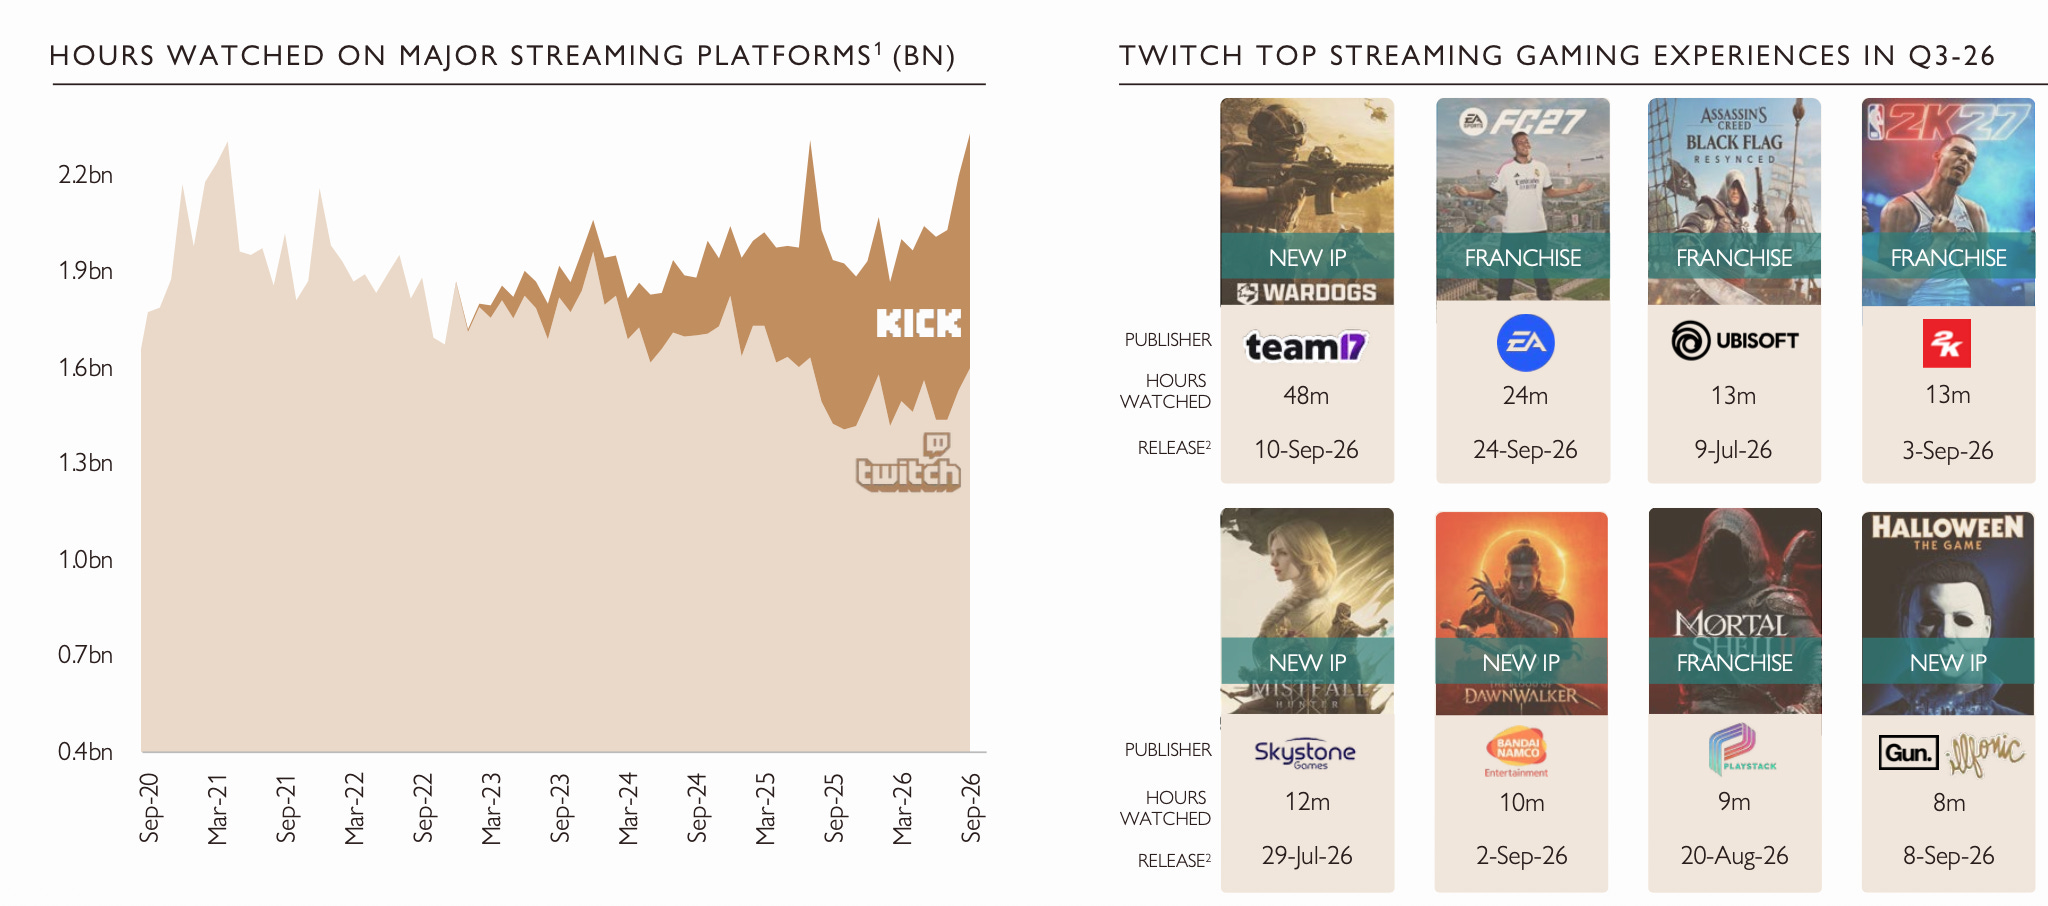
Hours watched on streaming platforms hit a record high. Kick drove the growth: its share of hours watched rose to 30%. Twitch stayed at last year's level.
The most popular Q3'26 releases on Twitch: Wardogs (48 million hours), EA SPORTS FC 27 (24 million), and Assassin's Creed Black Flag Resynced (13 million).
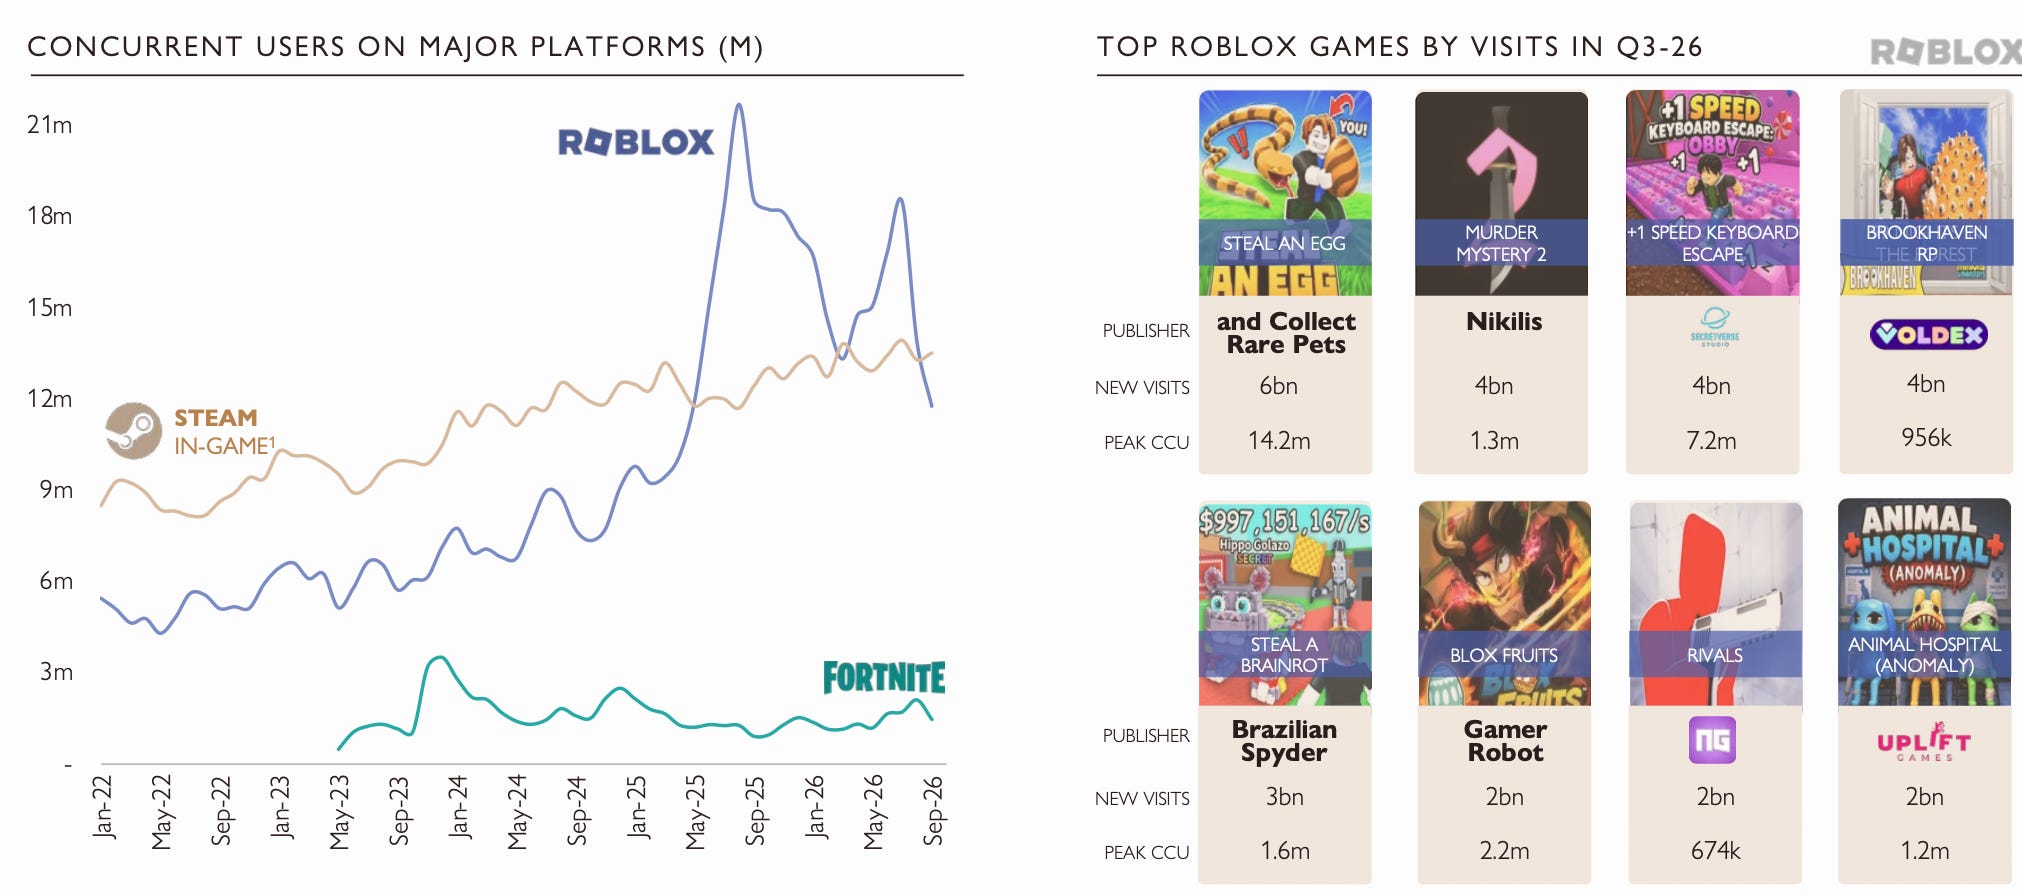
Steam CCU keeps growing, while Roblox dropped quite sharply from its record highs. Fortnite is fairly stable, though the platform is far smaller than both Steam and Roblox.
In Q3'26, Steal an Egg had the most visits on Roblox (6 billion, peak CCU of 14.2 million), followed by Murder Mystery 2 and +1 Speed Keyboard Escape (4 billion each). Steal a Brainrot, which led last quarter, is now fifth (3 billion).
M&A in detail
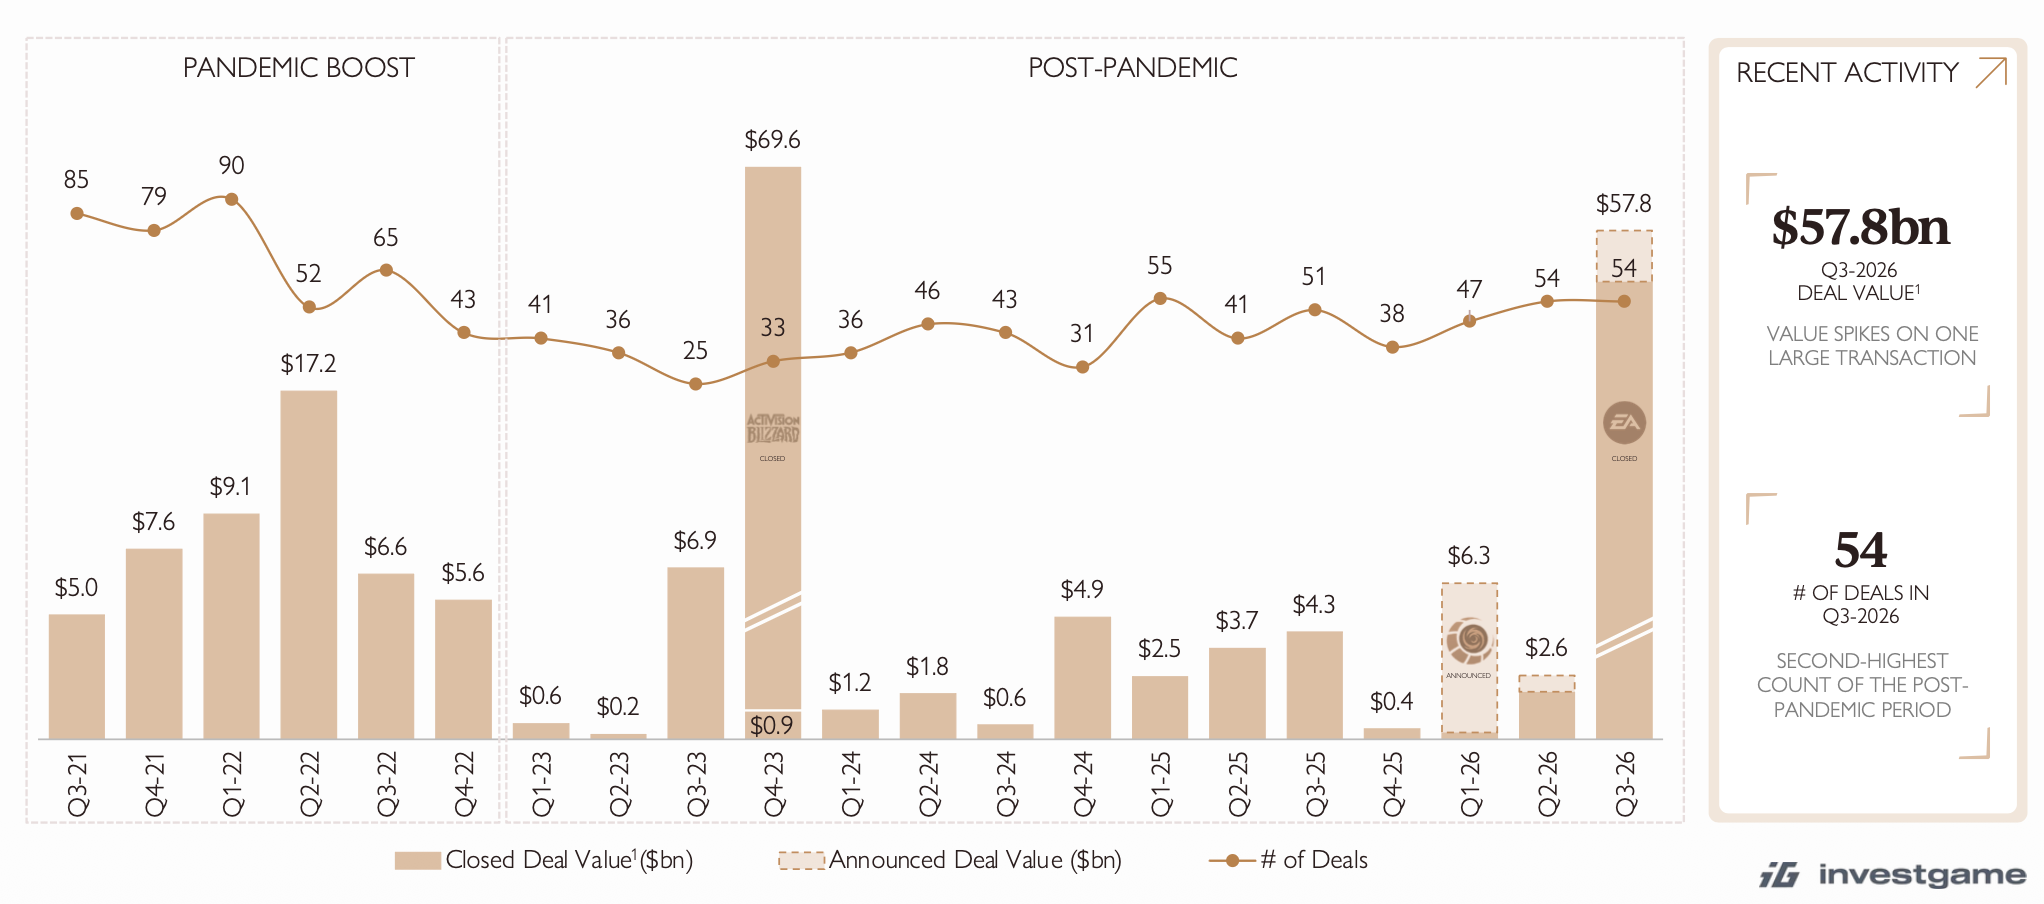
By deal count (54), Q3'26 matched the previous quarter. Only Q1'25 had more in the post-pandemic period, with 55 deals.
EA was acquired at 7.4x revenue and 21.2x EBITDA. The deal was announced in September 2025.


In 2026, there have already been 18 control acquisitions of developers and publishers valued above $100 million (including announced deals): 10 in H1'26 and 8 in Q3'26. That is nearly as many as in 2023-2025 combined (19 deals).
These deals totaled $57.2 billion in Q3'26, but that includes the EA deal. Excluding it, deal value is around ~$2.2 billion.
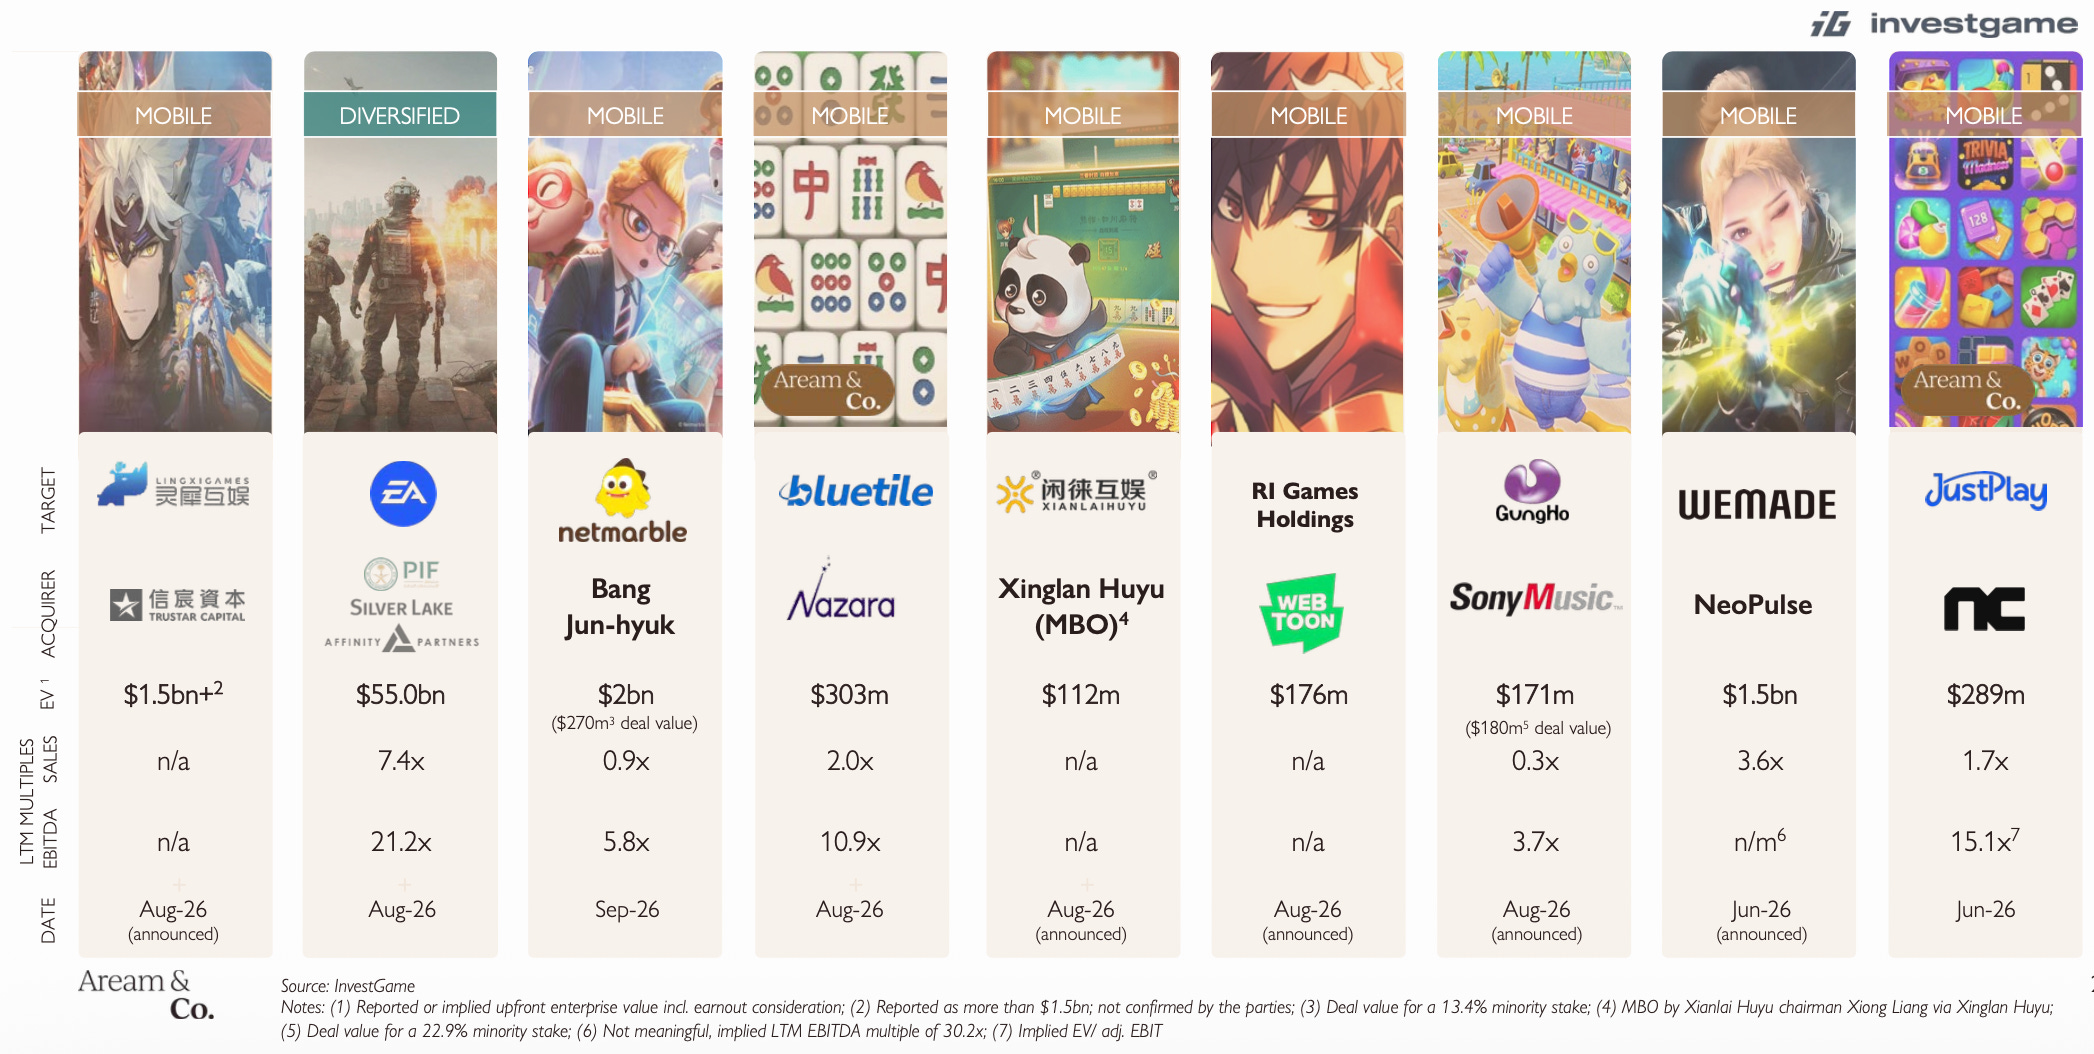
Aream & Co. notes that Asian companies lead M&A as both buyers and sellers. Almost all of the largest deals over the last 12 months involved Asian companies.
Bluetile was acquired at 2.0x revenue and 10.9x EBITDA, and JustPlay at 1.7x revenue. Asian mobile companies trade at noticeably lower multiples: the Netmarble deal was at 0.9x revenue and 5.8x EBITDA, and GungHo at 0.3x revenue and 3.7x EBITDA.
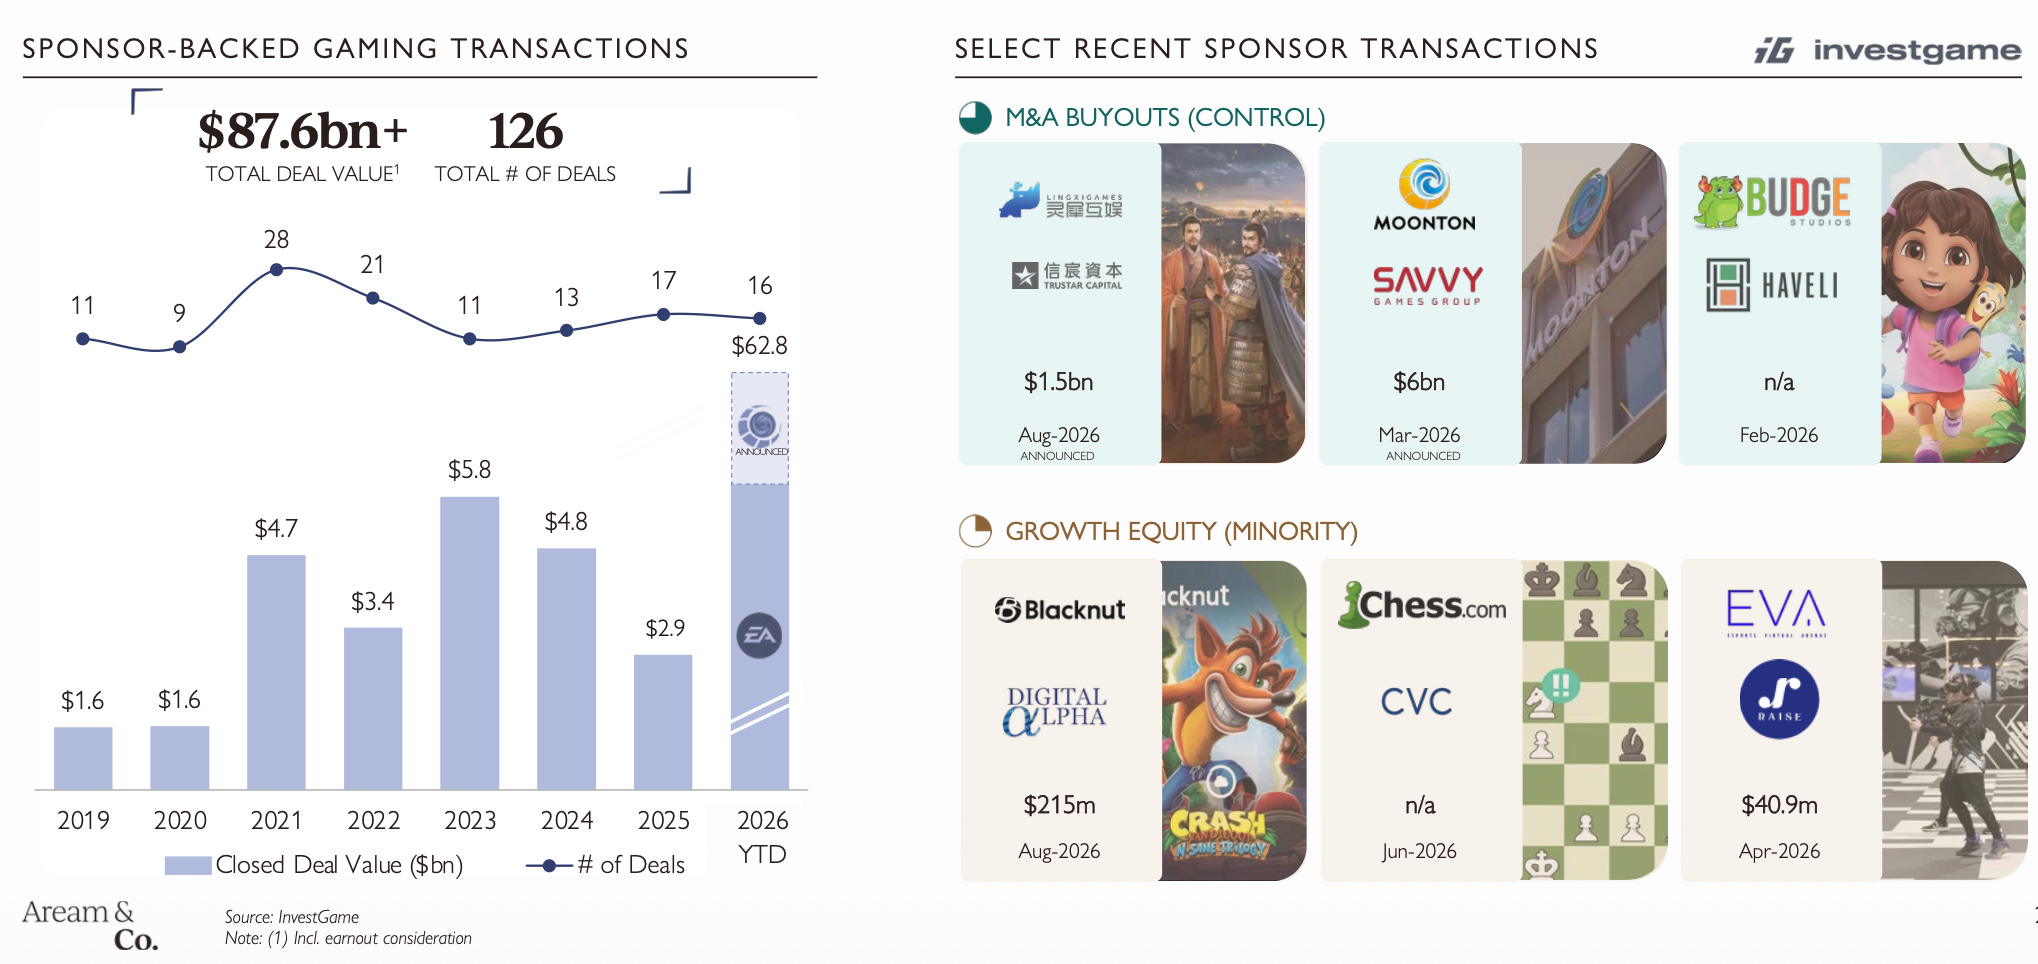
Total value of private-equity-backed deals since 2019 has topped $87.6 billion (126 deals). In 2026 alone, it is already $62.8 billion across 16 deals, but Electronic Arts accounts for most of that value.
Recent examples include Trustar Capital's acquisition of Lingxi Games, Digital Alpha's $215 million investment in the cloud gaming service Blacknut, and CVC's investment in Chess.com.
Public markets
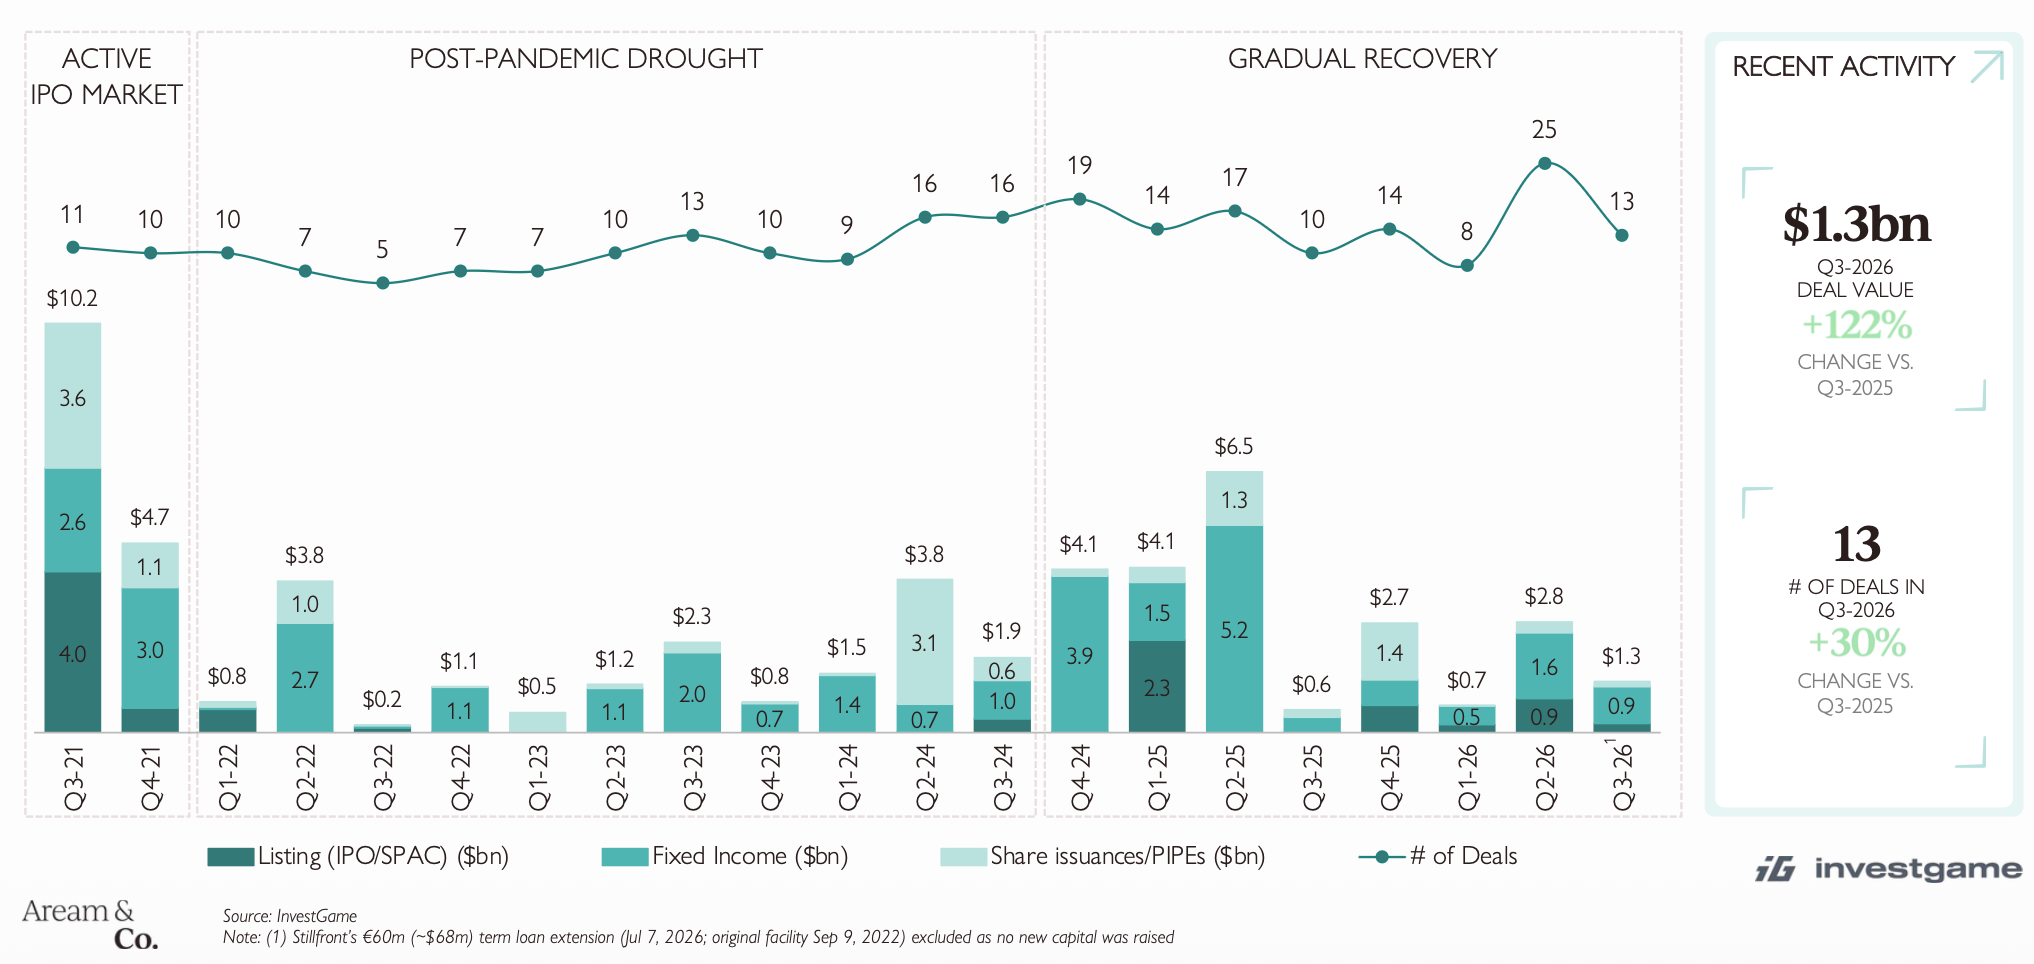
After a strong Q2'26 (25 deals worth $2.8 billion), public market activity slowed: Q3'26 saw 13 deals (+30% YoY) worth $1.3 billion (+122% YoY). Bond issues accounted for $0.9 billion of the total.
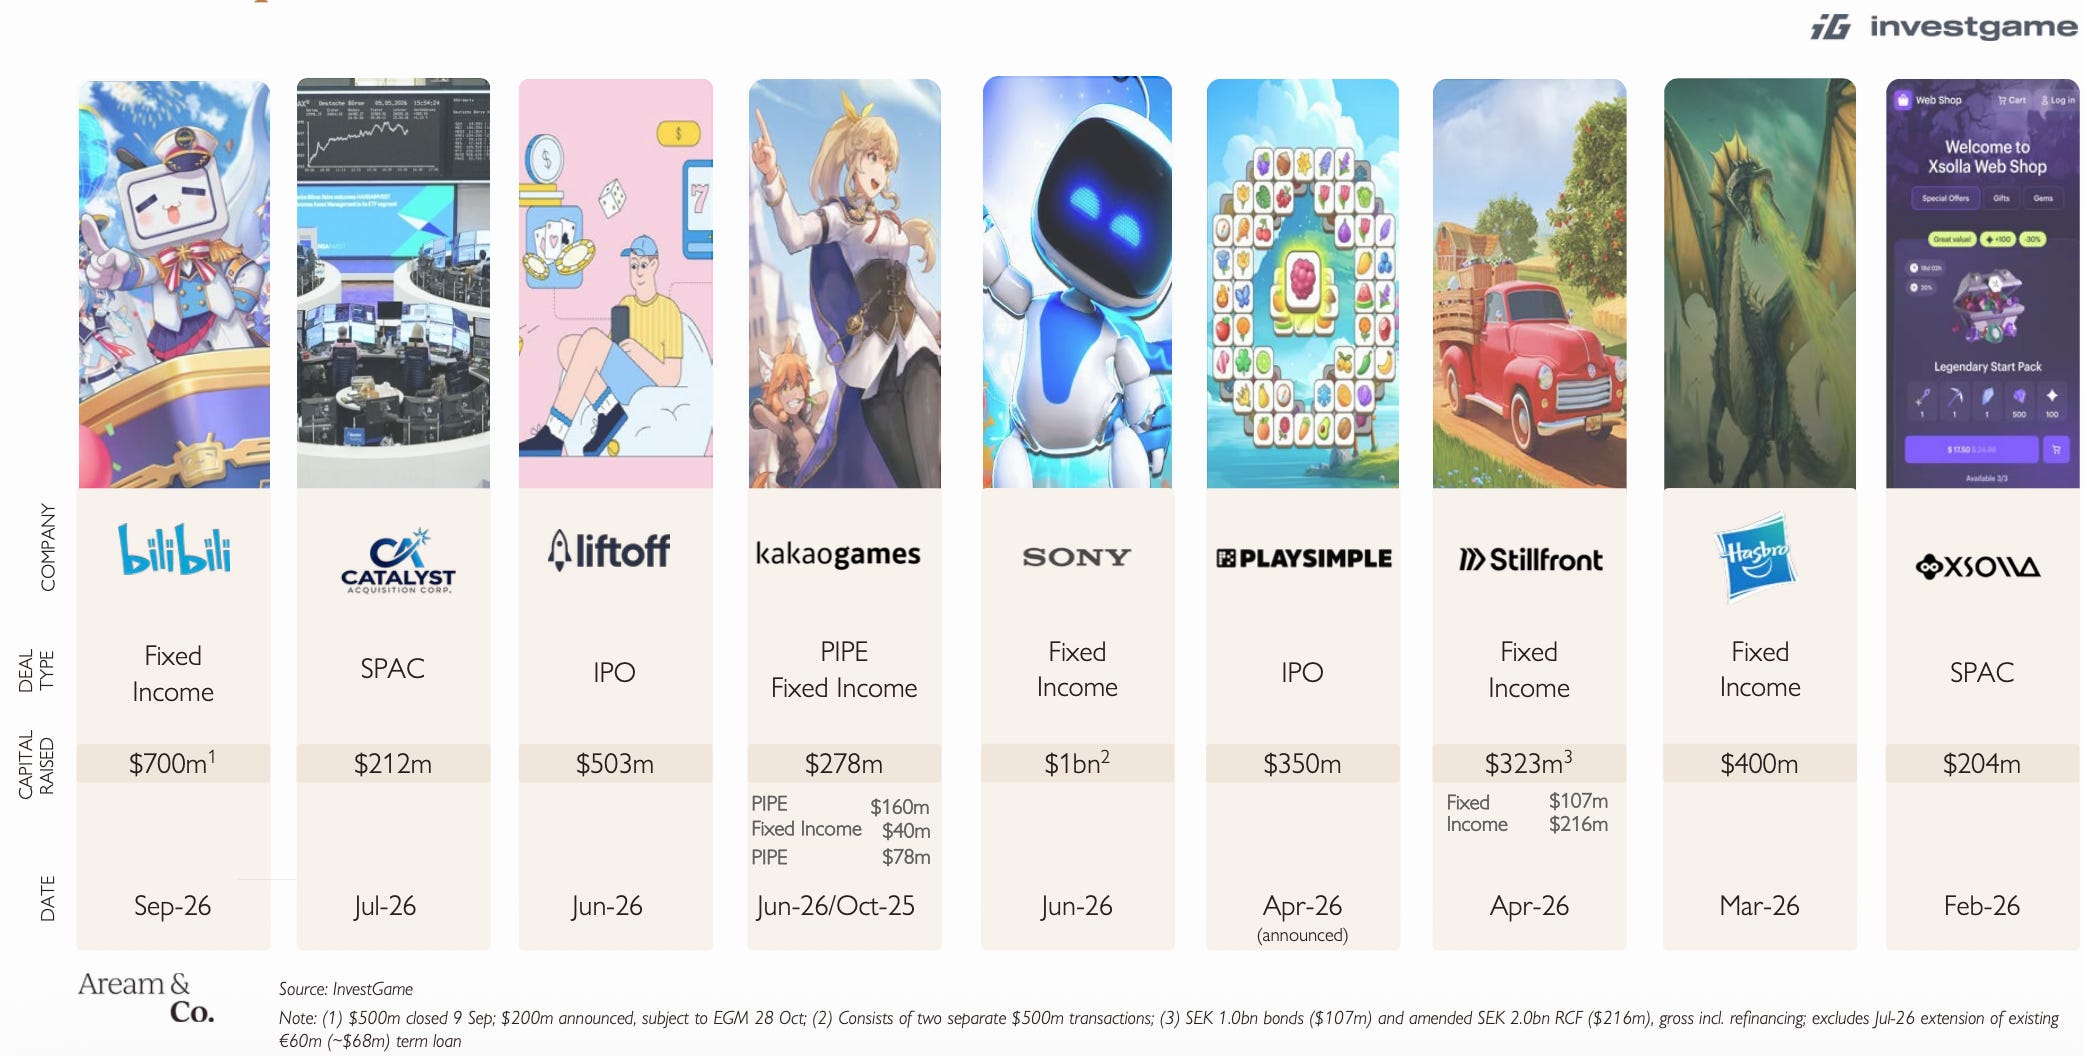
The quarter's largest deals: Bilibili issued $700 million in bonds ($500 million placed as of September 9, with another $200 million announced), the Catalyst SPAC raised $212 million, and Embracer secured a SEK 2 billion credit facility ($204 million).
Aream & Co. expects more listings: PlaySimple and Fellowship Entertainment are preparing to go public.
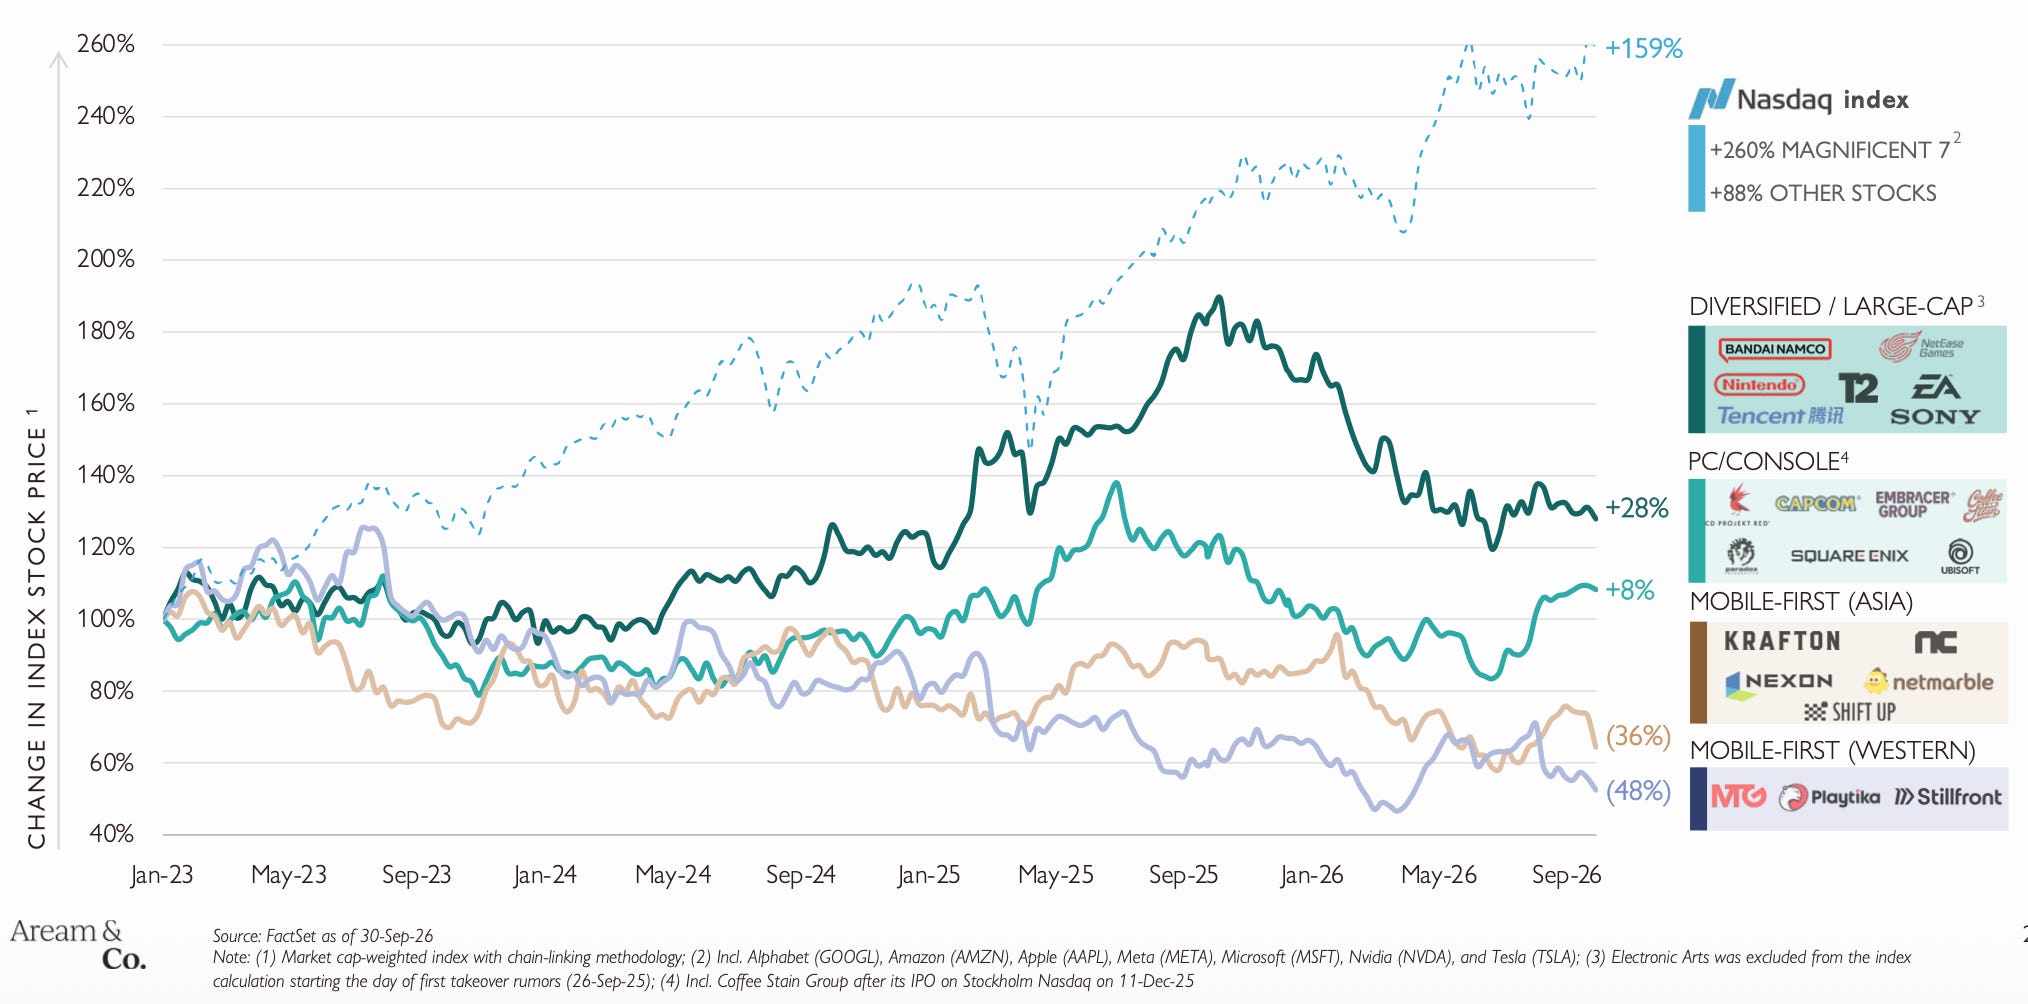
Gaming stocks leveled out a bit in Q3'26, with PC/console companies performing best. Since January 2023, the diversified holdings index is up 28%, and PC/console companies are up 8%. Mobile companies are in negative territory: Asian ones are down 36%, and Western ones are down 48%. The Nasdaq is up 159% over the same period.
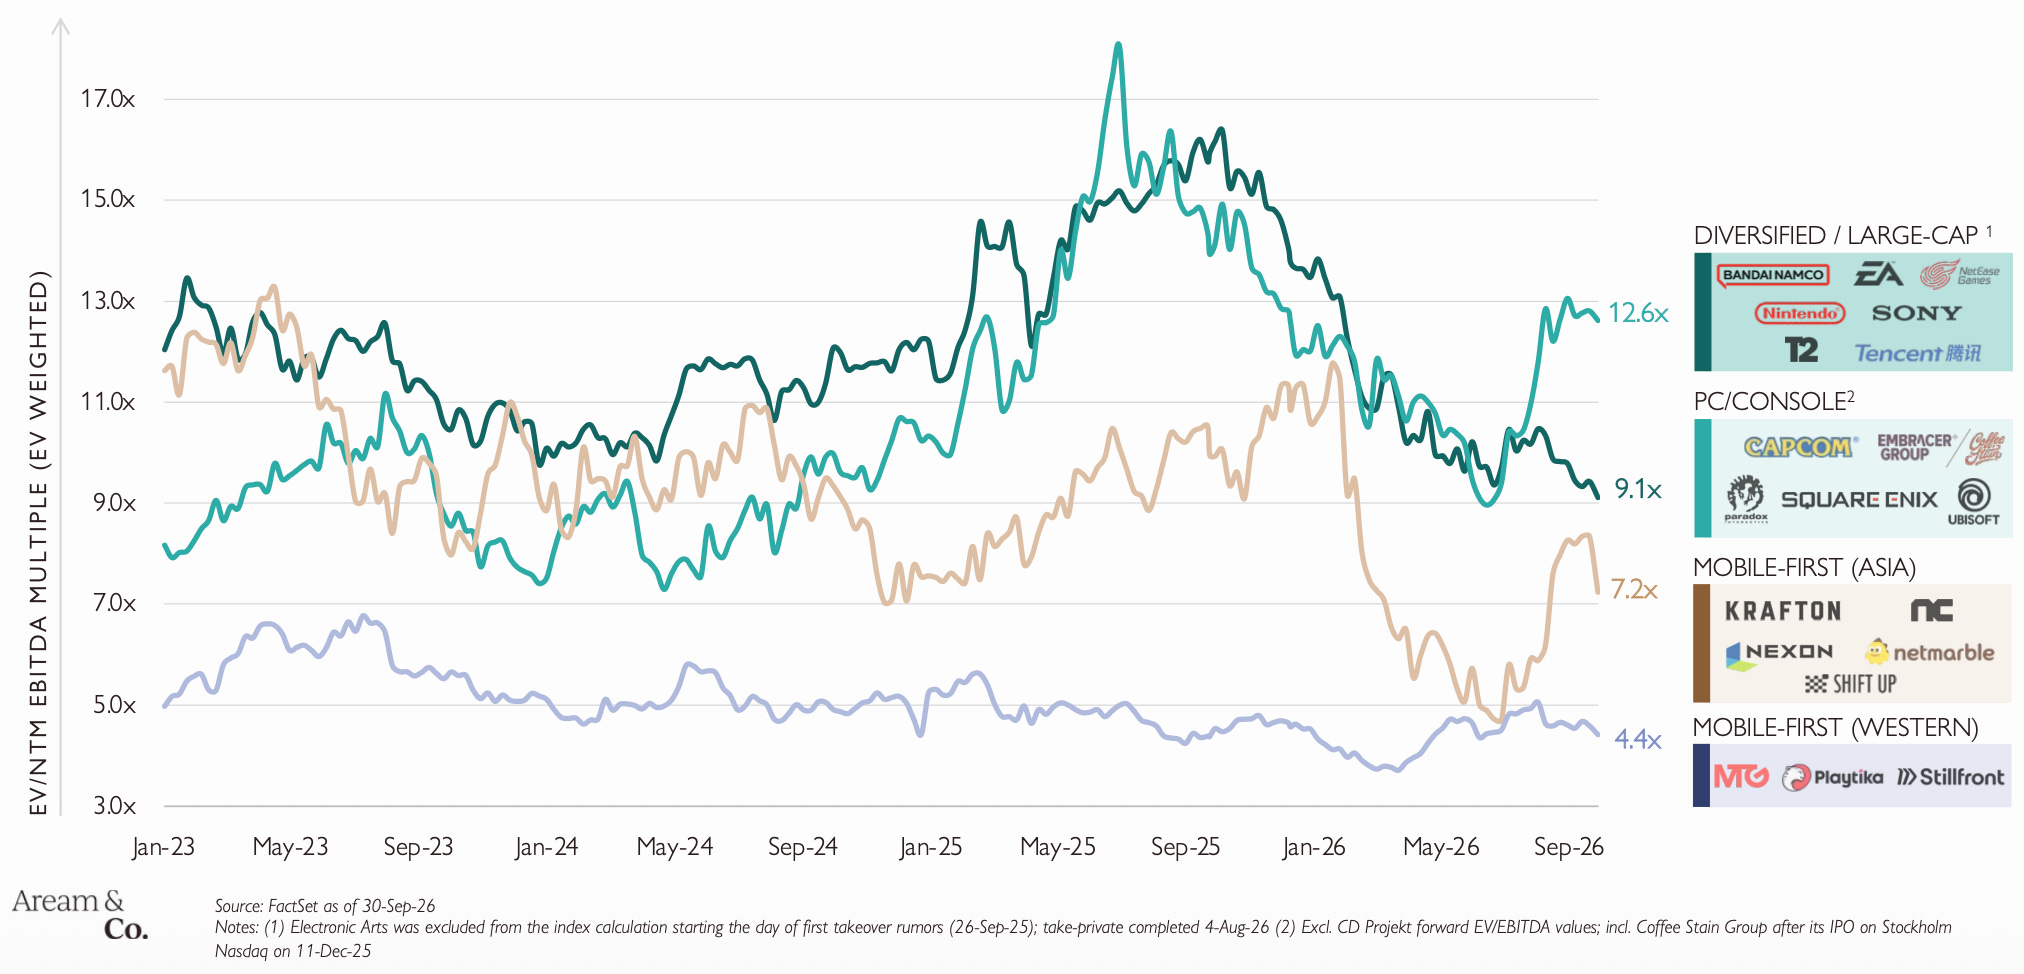
On strong releases, PC/console companies’ multipliers rose to 12.6x EV/NTM EBITDA. Last quarter, diversified holdings had the highest valuations (9.4x); now they are second (9.1x). Asian mobile companies re-rated from 4.7x to 7.2x, while Western mobile companies stayed roughly at the same level, at 4.4x EV/NTM EBITDA.
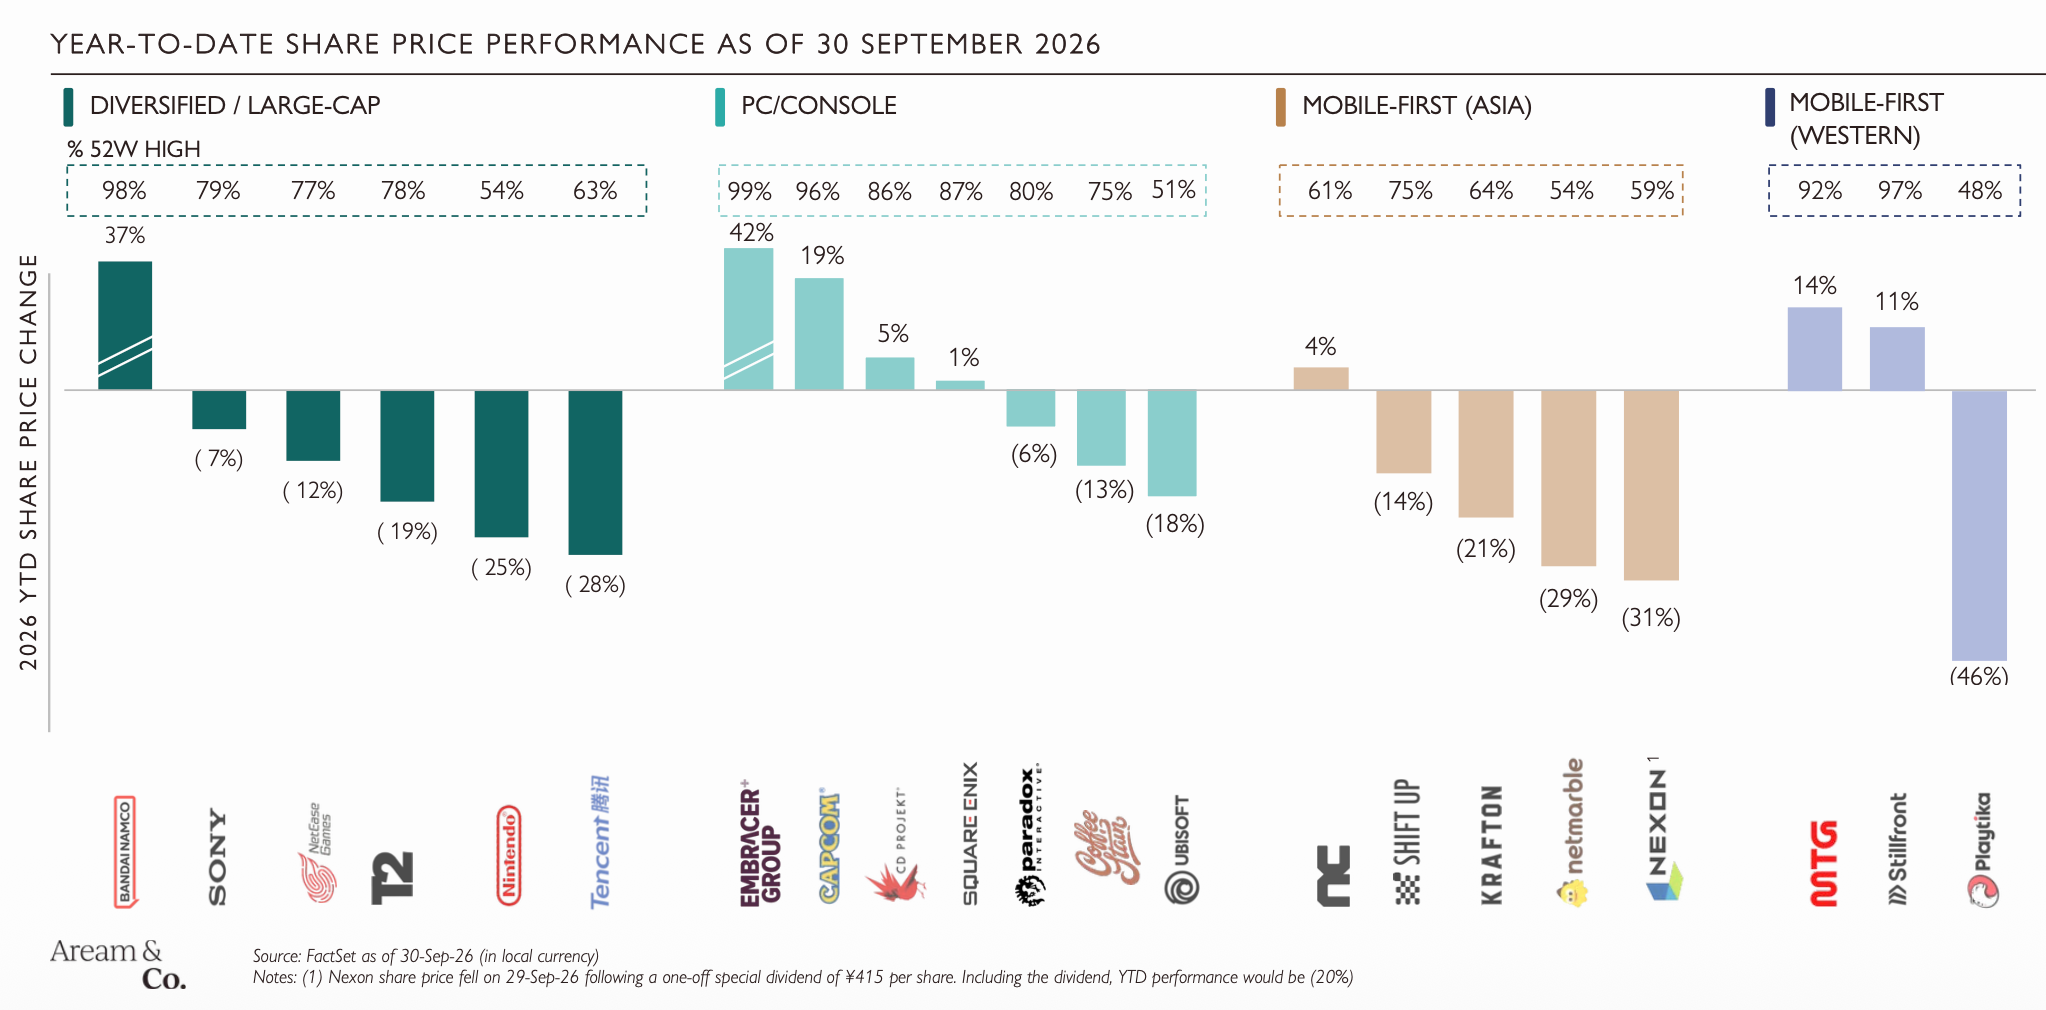
Year to date, Embracer (+42%), Bandai Namco (+37%), and Capcom (+19%) shares rose the most. Playtika (-46%), Nexon (-31%), and Netmarble (-29%) fell the most. Nexon's shares dropped after a special dividend payout on September 29; including the dividend, the decline is 20%.
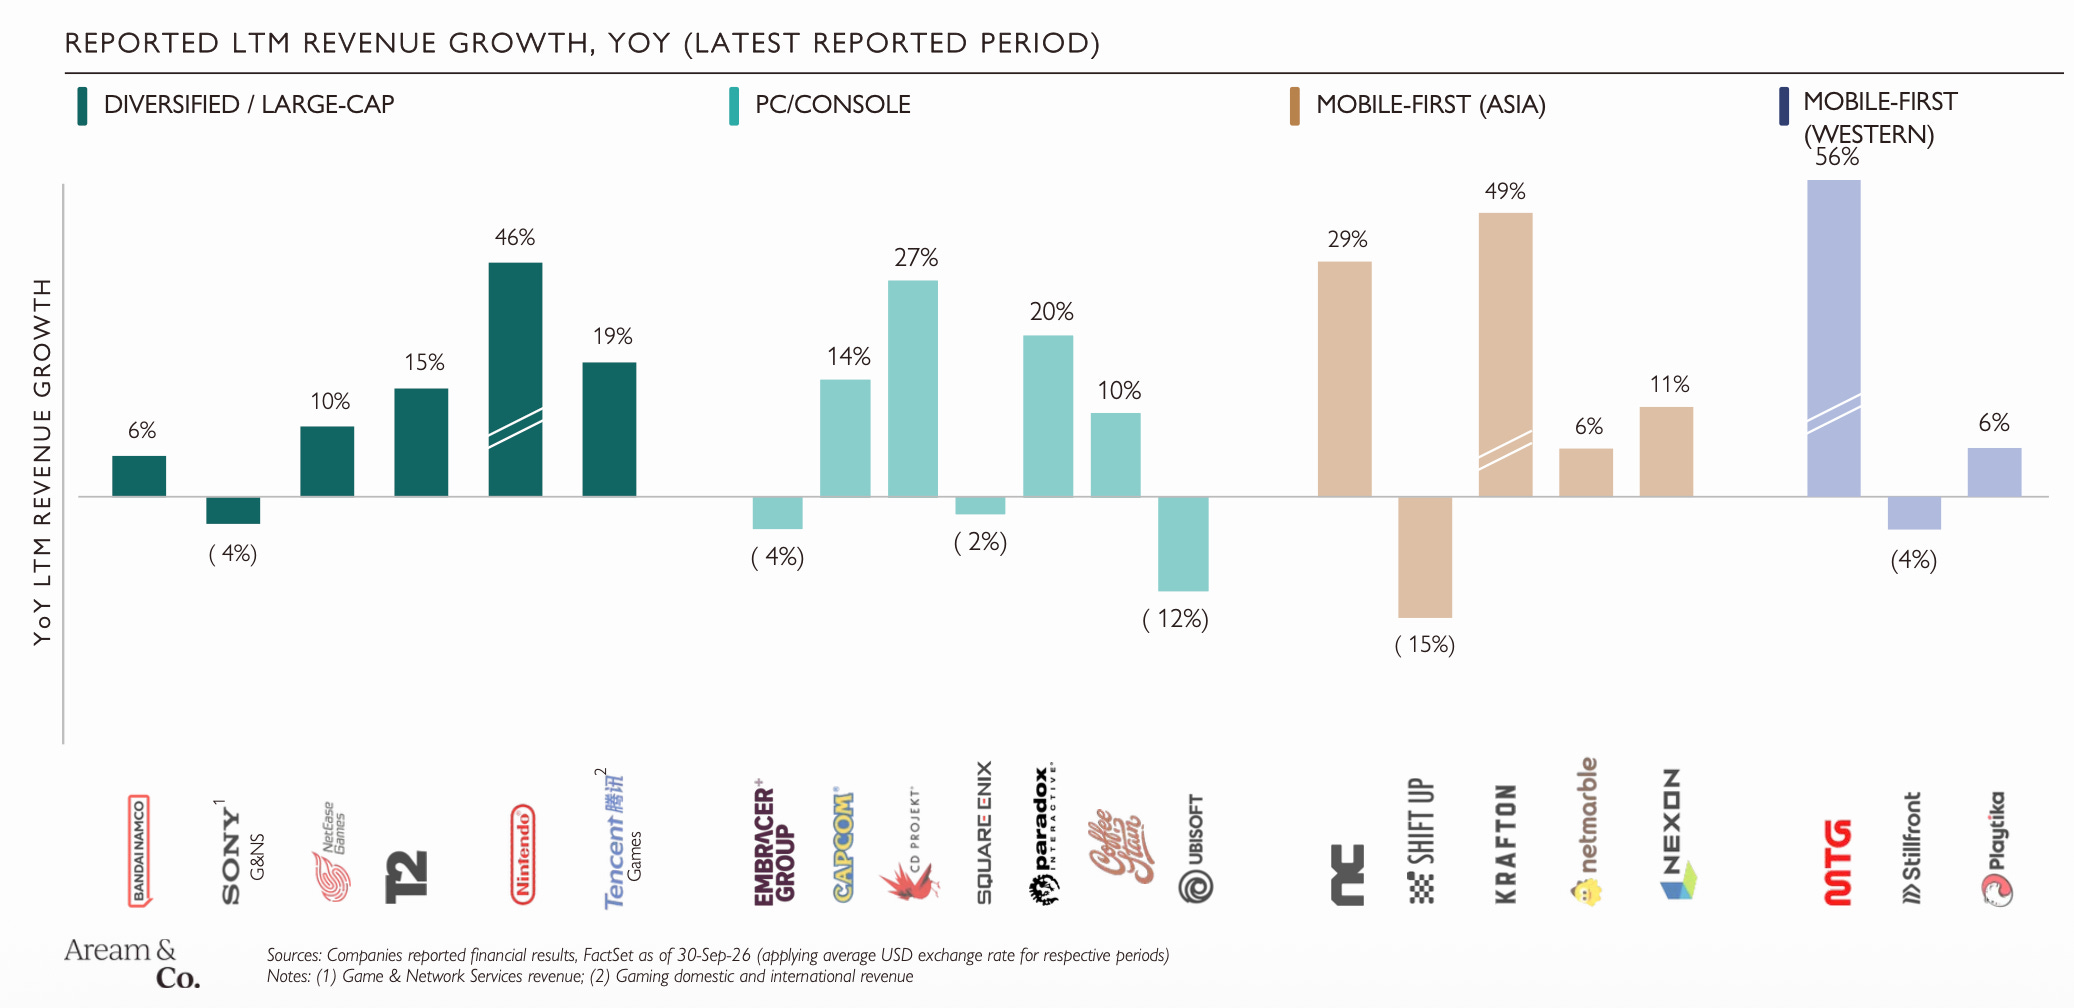
Meanwhile, most companies continued to grow revenue. Over the last 12 months, MTG (+56%), Krafton (+49%), and Nintendo (+46%) grew the fastest. Shift Up (-15%) and Ubisoft (-12%) saw the steepest revenue declines.
Private investments
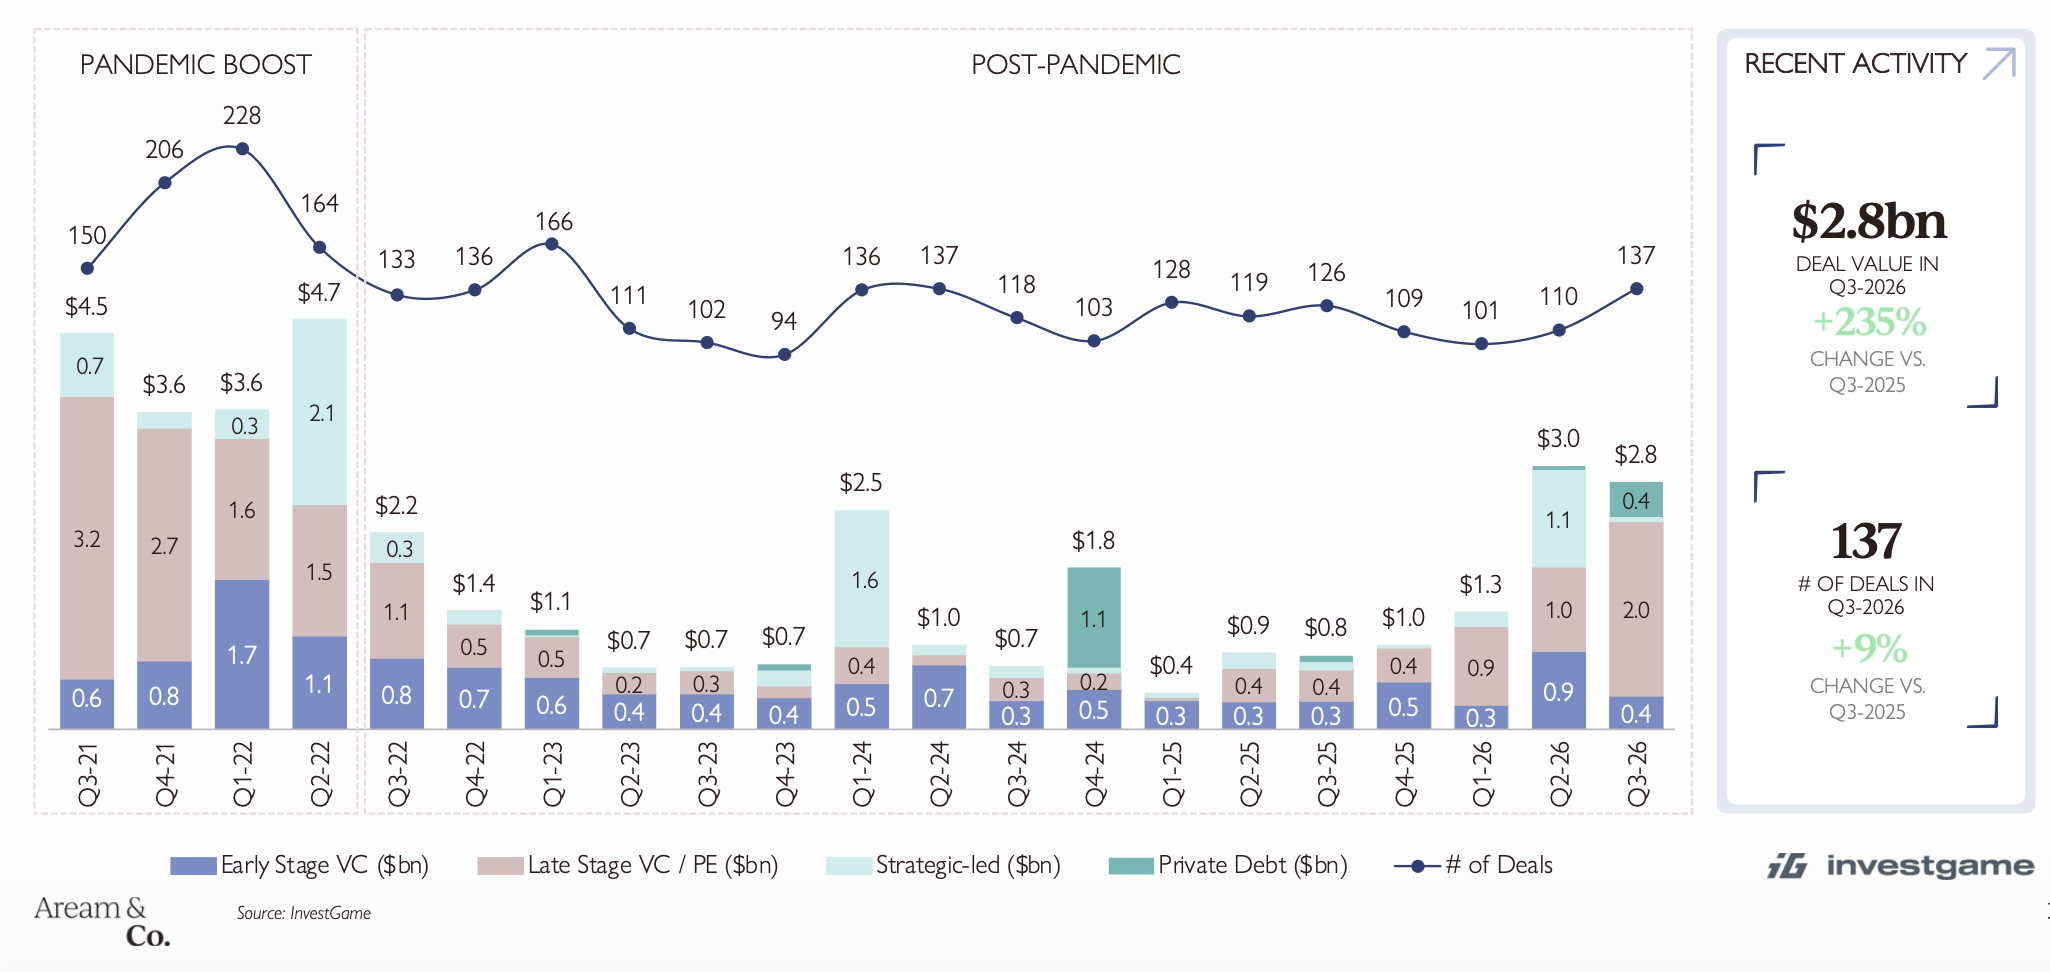
Private investment in Q3'26 totaled $2.8 billion (+235% YoY), and deal count grew 9% YoY.
Most of the money went into late-stage rounds: $2 billion. That is the highest since Q4'21.
AI companies raised the big rounds: VAST, Meshy, and General Intuition raised $1.2 billion combined.
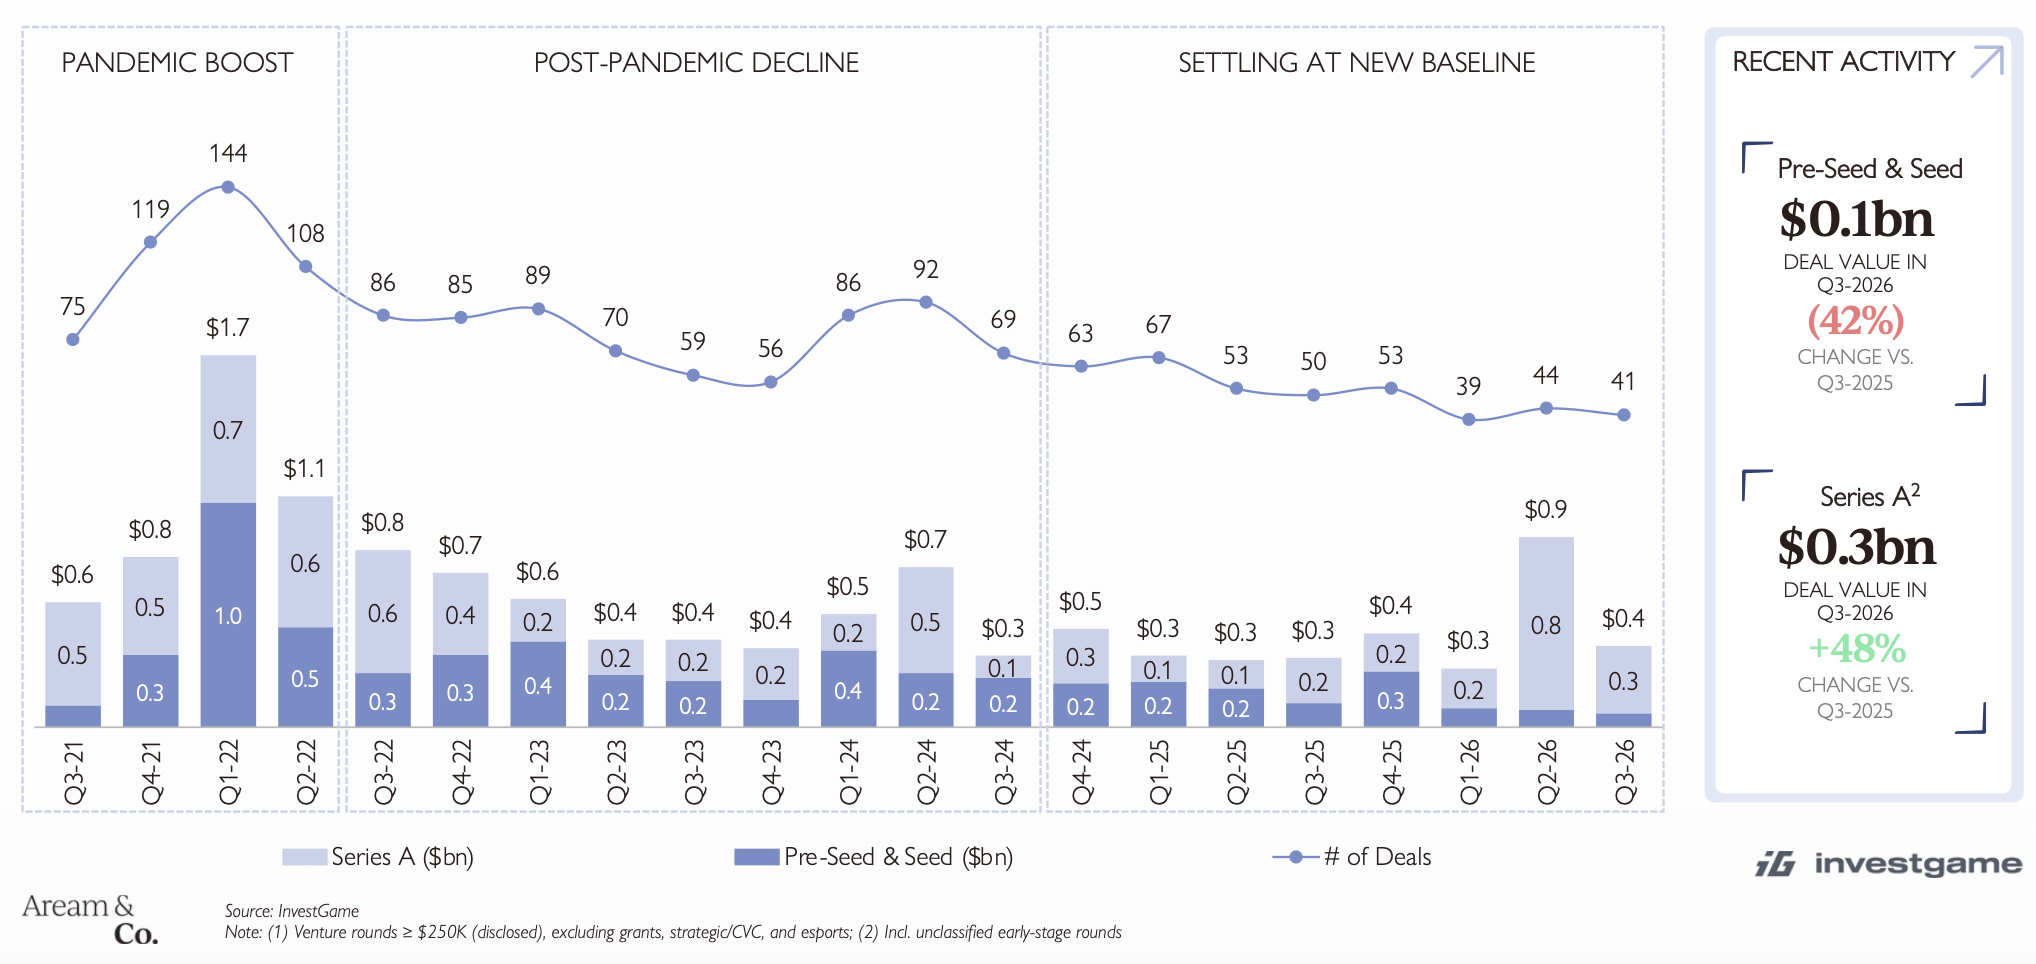
Pre-seed and seed rounds in Q3'26 totaled $0.1 billion (-42% YoY), a five-year low. Series A rounds, on the other hand, grew 48% YoY to $0.3 billion.
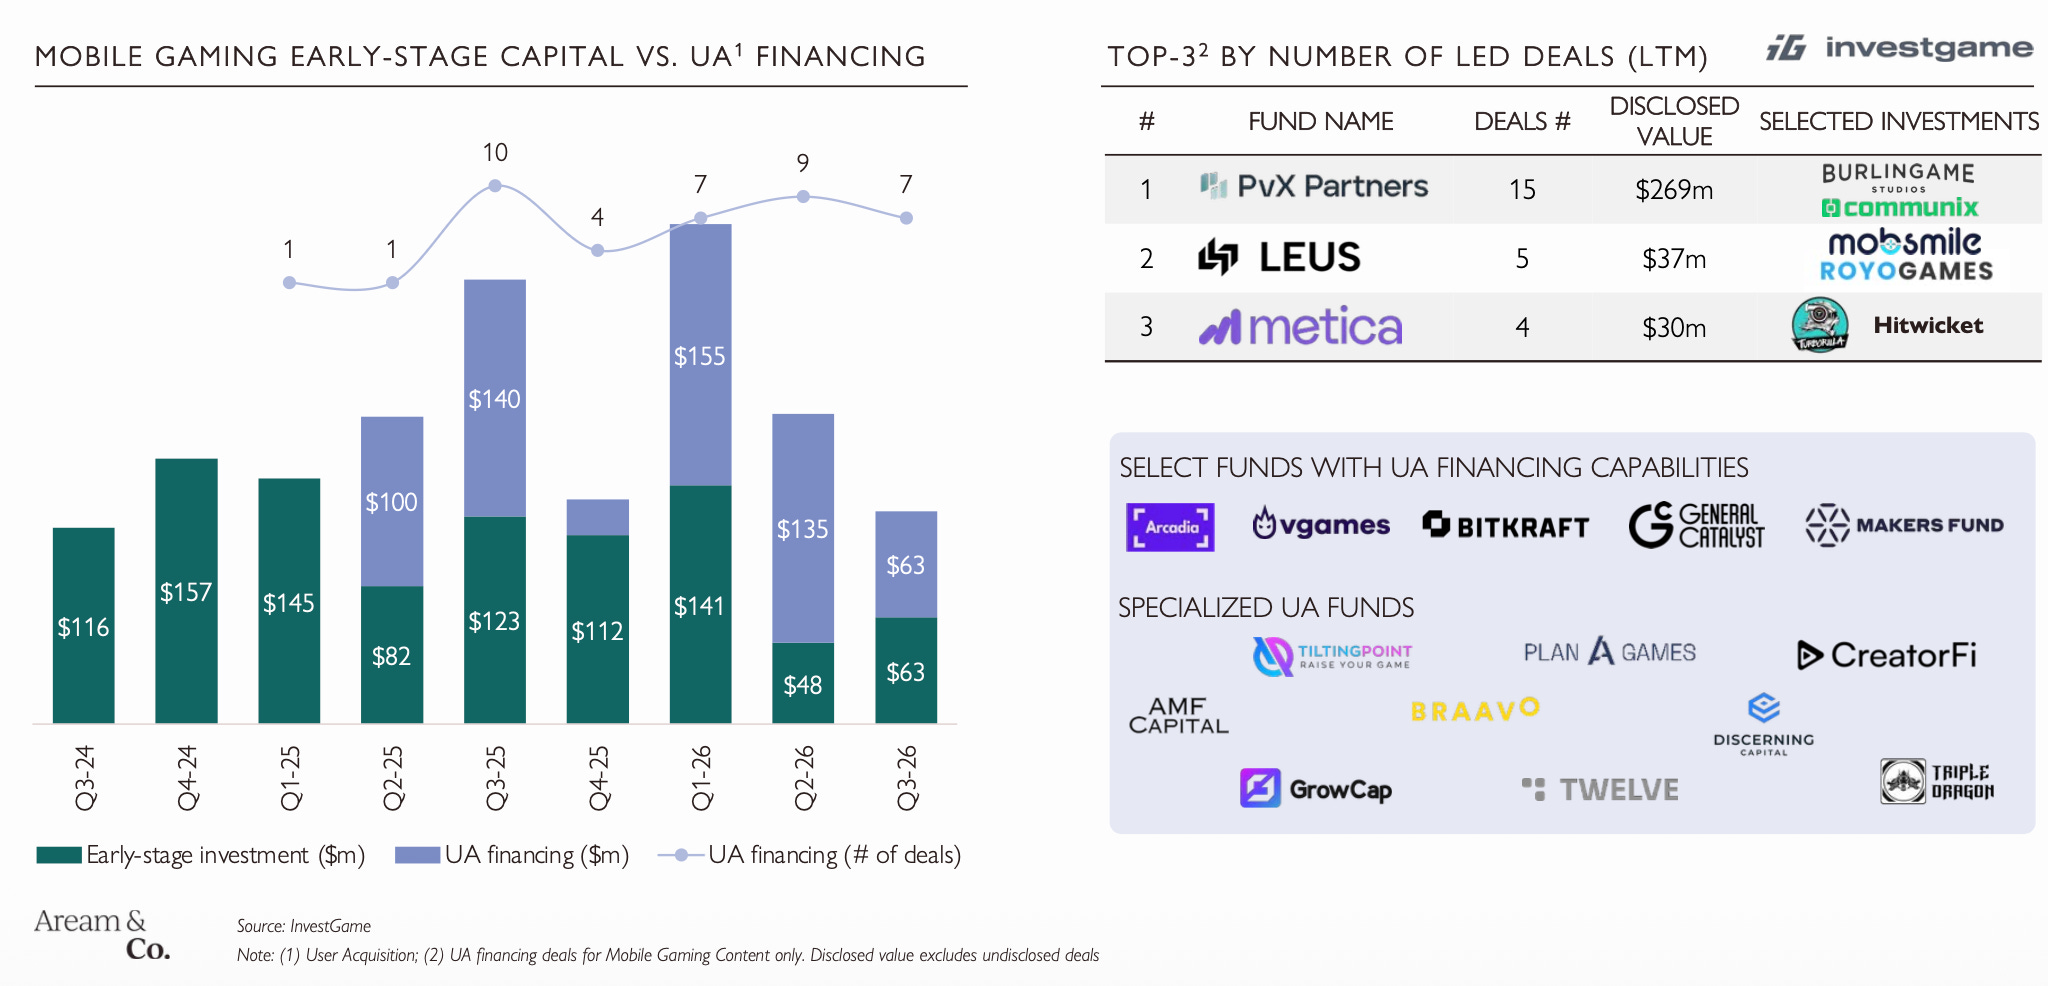
Aream & Co. calls UA financing a full-fledged alternative to equity investment in mobile gaming. Over the last 12 months, there were 27 such deals with $374 million in value. In Q3'26, 7 deals totaled $63 million, matching early-stage investment in mobile studios.
A word from our sponsor
Need a freelance 3D artist, composer, or QA tester fast? Mellow’s AI Scout finds qualified talent in under 48 hours — free to try, no commitment. Describe the role, get a shortlist, hire when you’re ready.
PvX Partners led the most UA deals over the last 12 months (15 deals worth $269 million), followed by LEUS (5 deals worth $37 million) and Metica (4 deals worth $30 million).
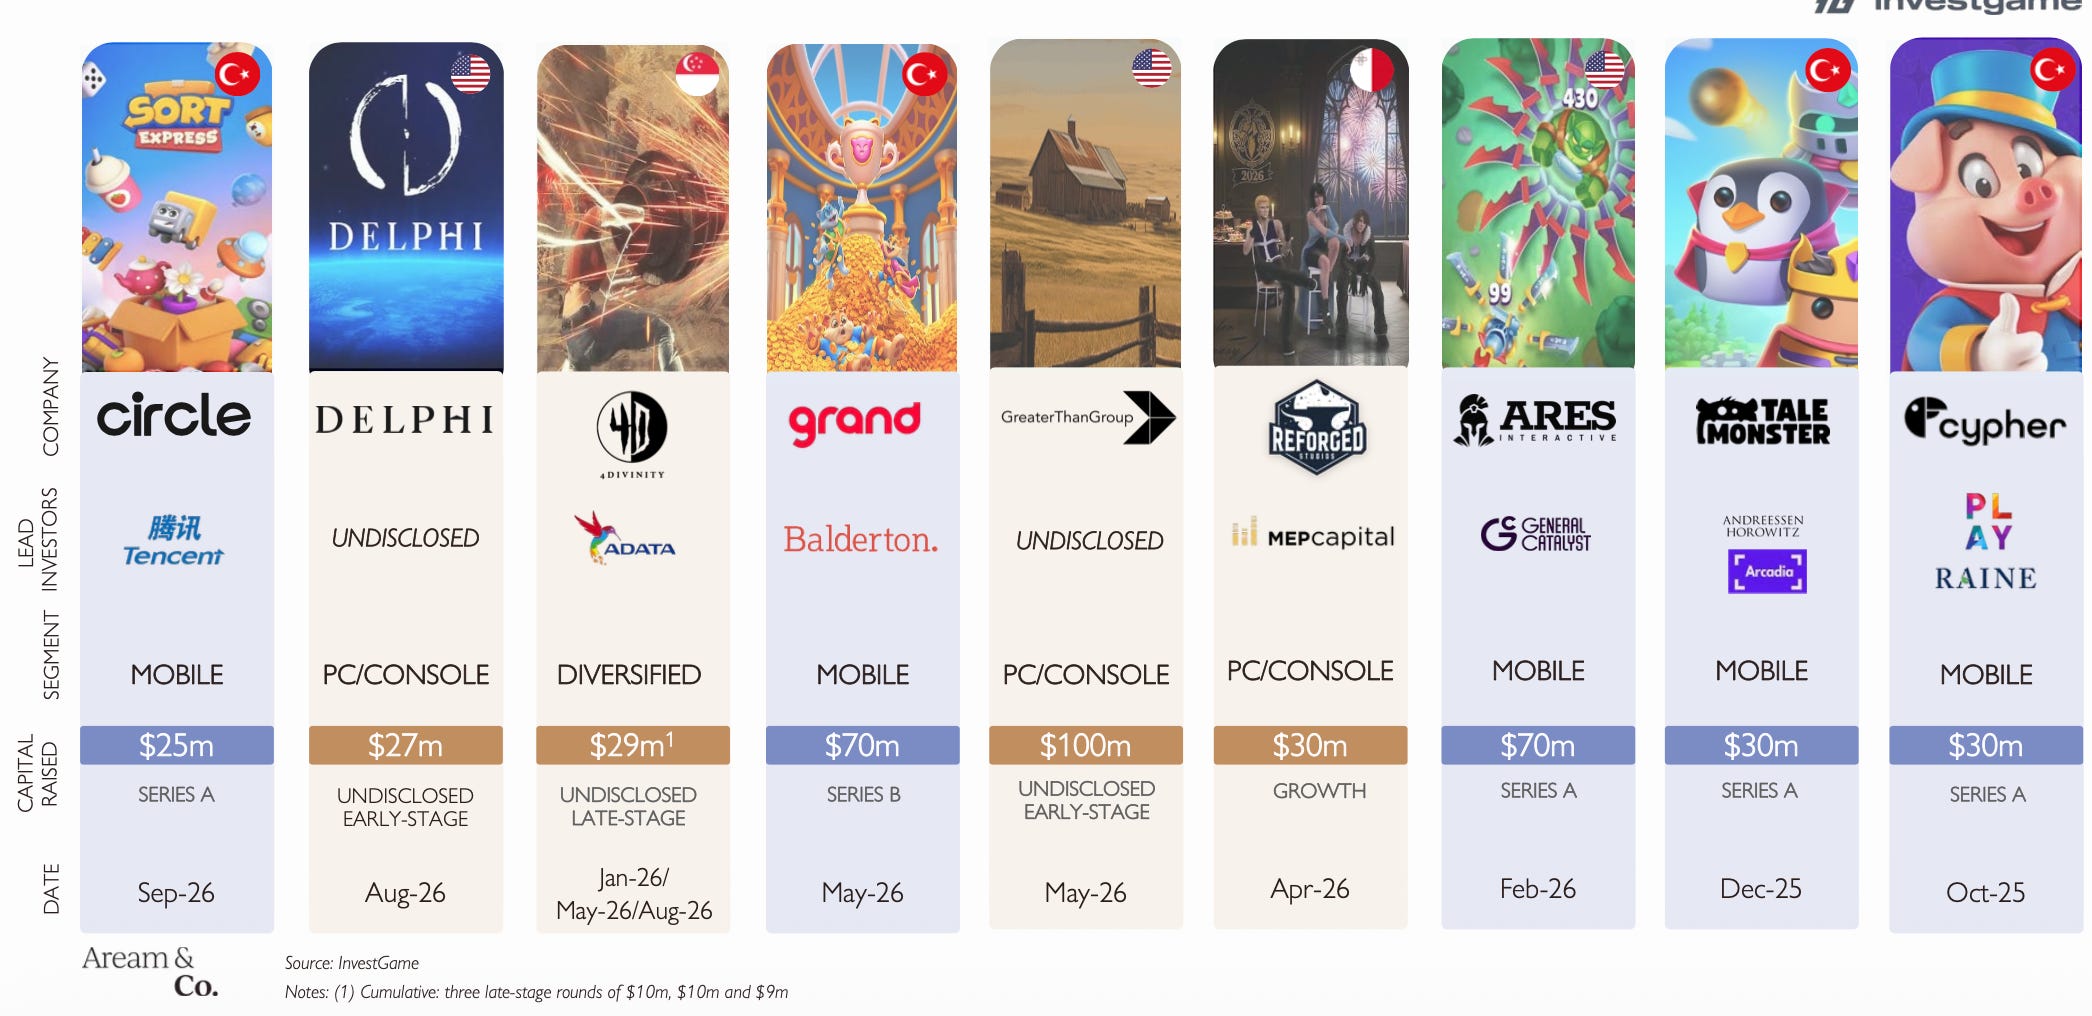
Large rounds for game studios are still rare. The biggest over the last 12 months were GreaterThanGroup ($100 million) and Grand and Ares Interactive ($70 million each). Four of the nine studios on the list are Turkish (Circle, Grand, Tale Monster, and Cypher).
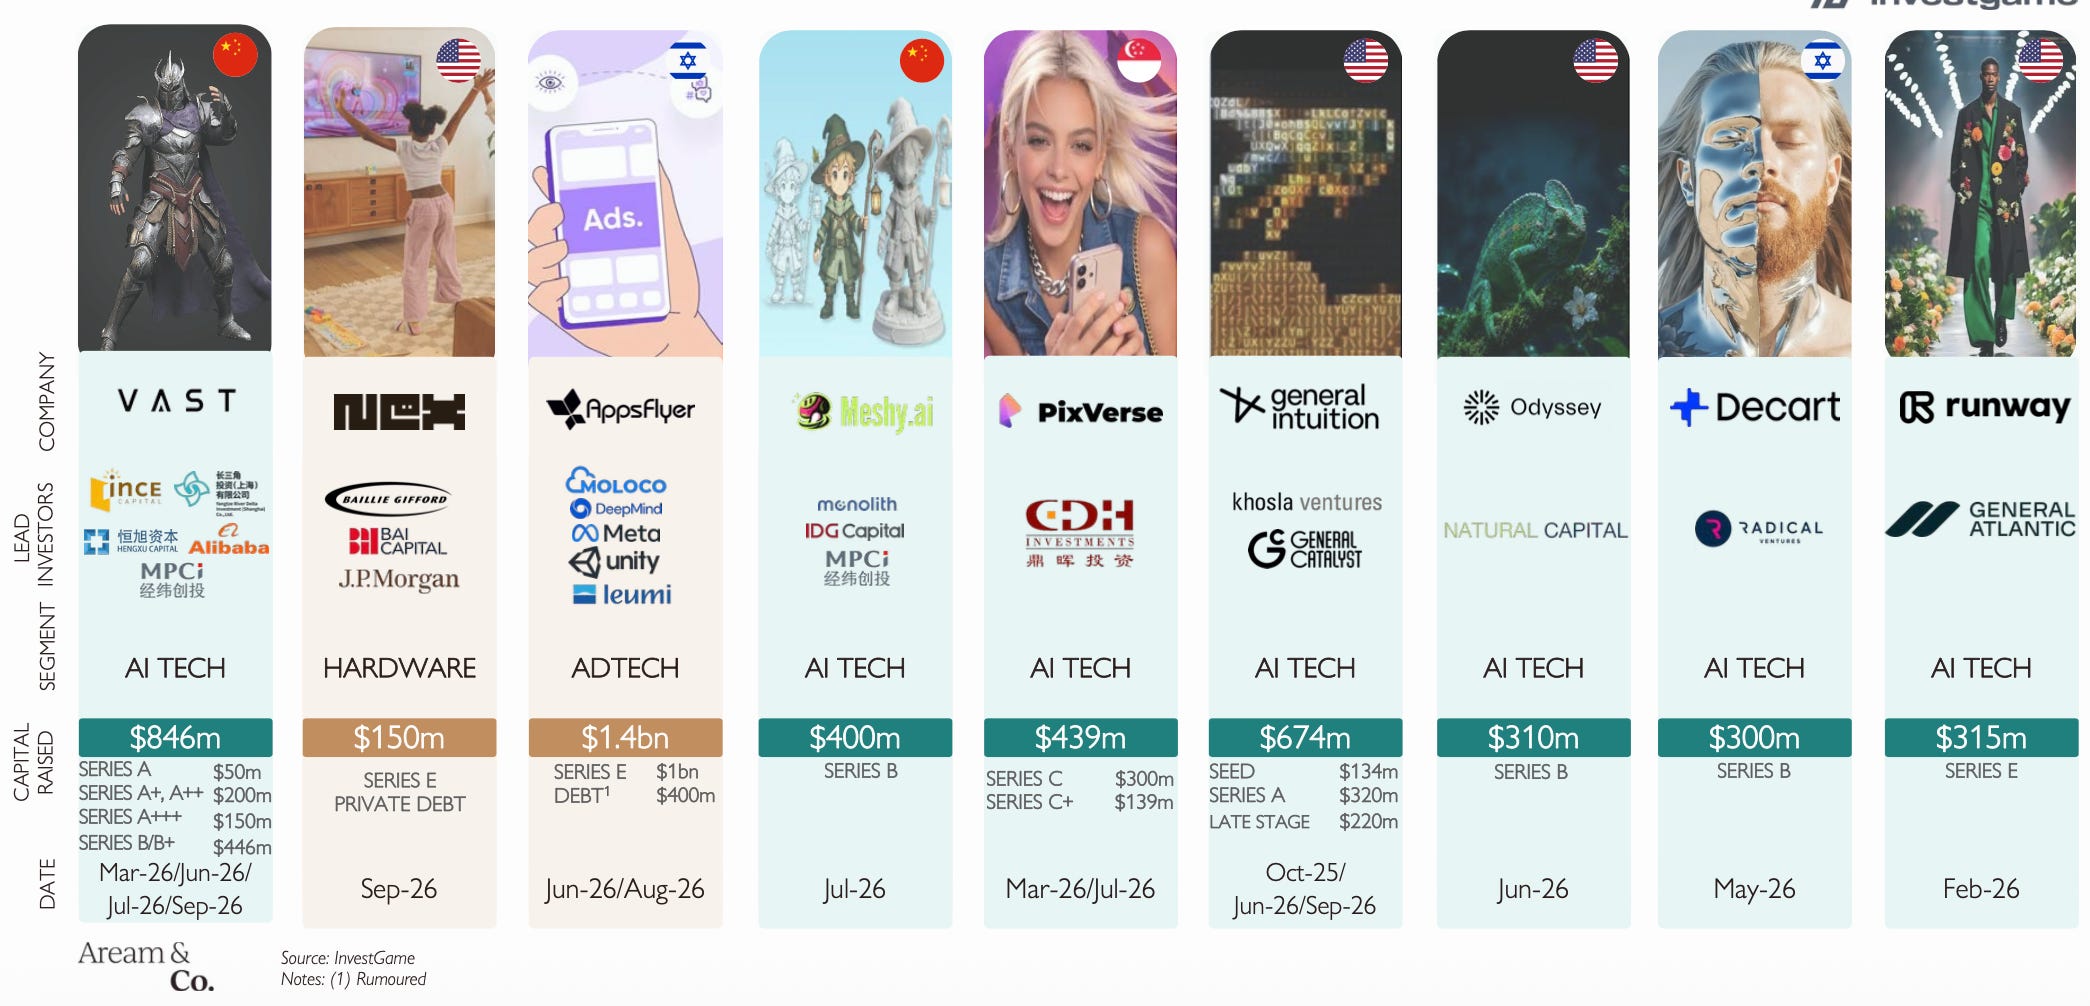
Seven of the nine largest private rounds over the last 12 months went to AI companies. AppsFlyer raised the most ($1.4 billion, though $400 million of that is reportedly debt), followed by VAST ($846 million) and General Intuition ($674 million).
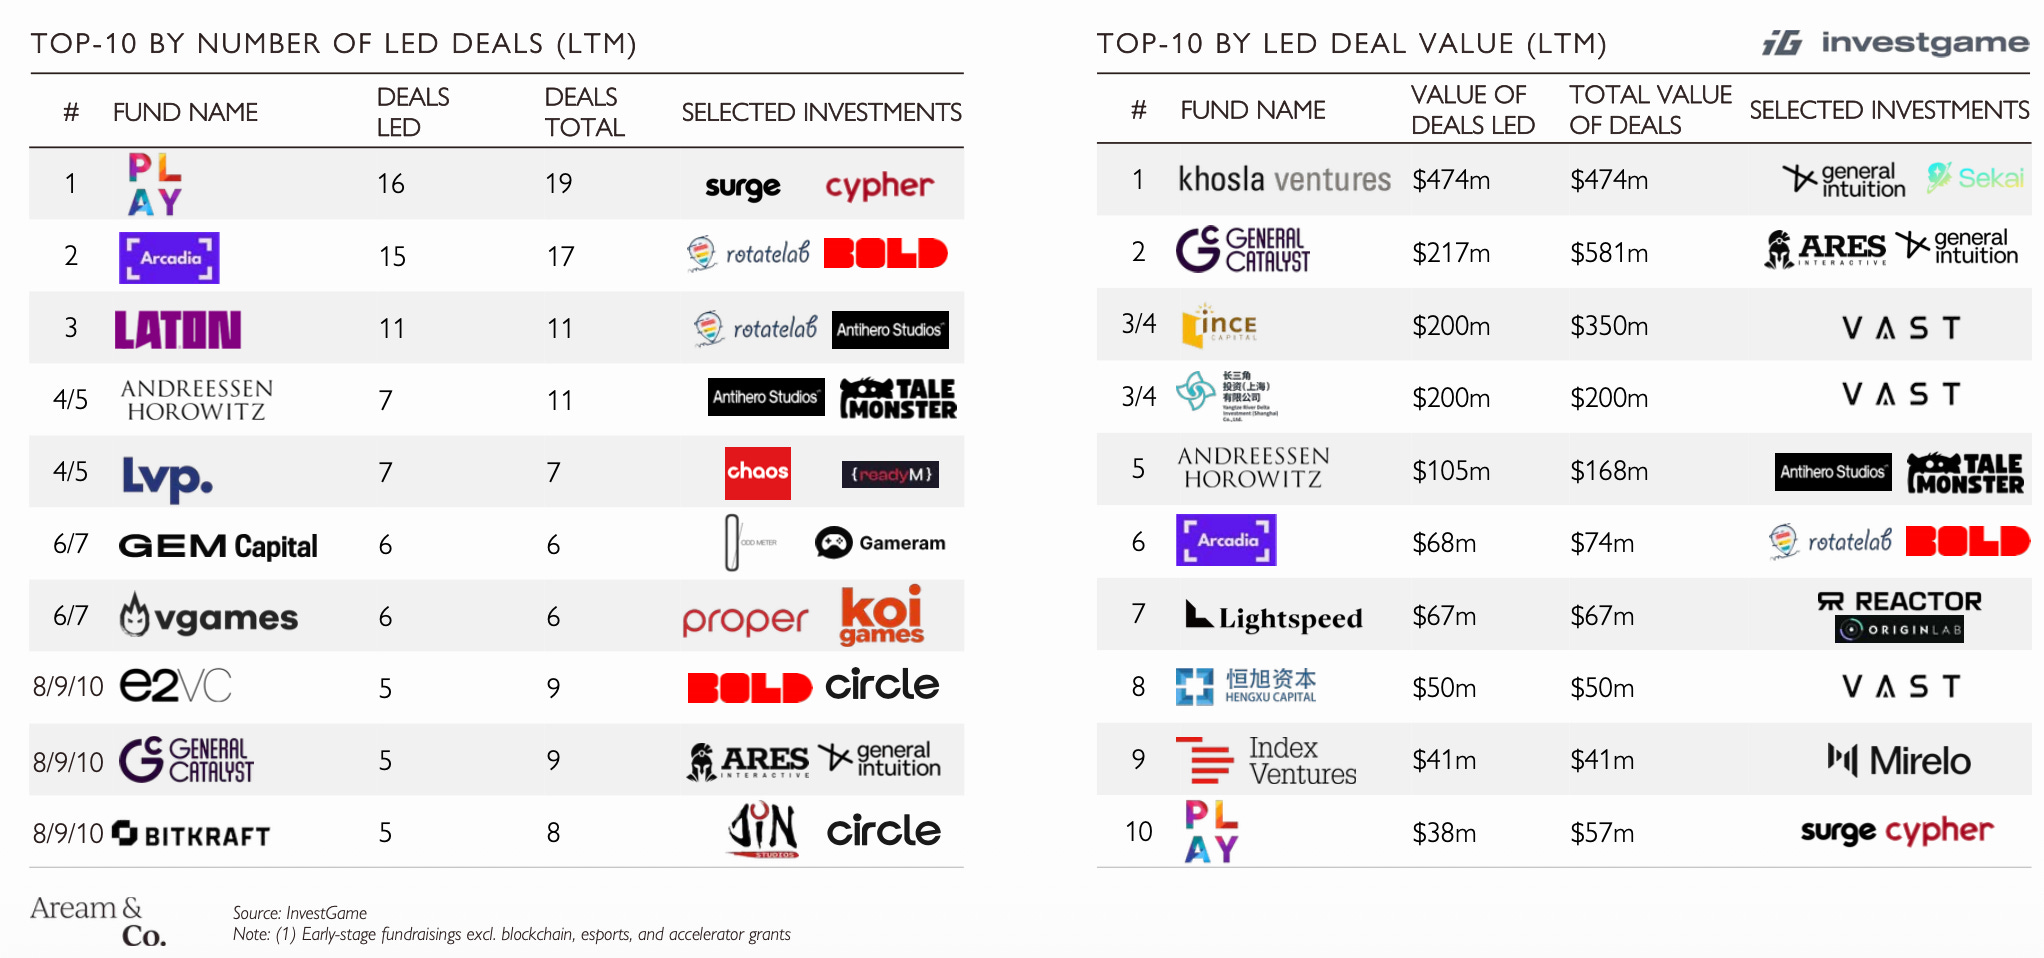
The most active funds by number of rounds over the last 12 months: Play Ventures (16), Arcadia (15), and Laton Ventures (11). By value, Khosla Ventures ($474 million), General Catalyst ($217 million), and Ince Capital ($200 million) lead.
Singular: Ad Creative Benchmarks in 2026
The report is based on aggregated Singular data from Q1'25 to Q1'26. Channels: Social, Search, and Display (programmatic placements on mobile and web). Verticals: Gaming, Finance, Entertainment, Shopping, Health & Fitness, Education, and Travel.
Creative Production
The median advertiser launches 13 new creatives per week. Advertisers in the bottom 25th percentile launch up to 3 creatives per week. The top 25% starts at 53 creatives per week.
Singular notes that in gaming, top-quartile advertisers often launch hundreds of new creatives per week.
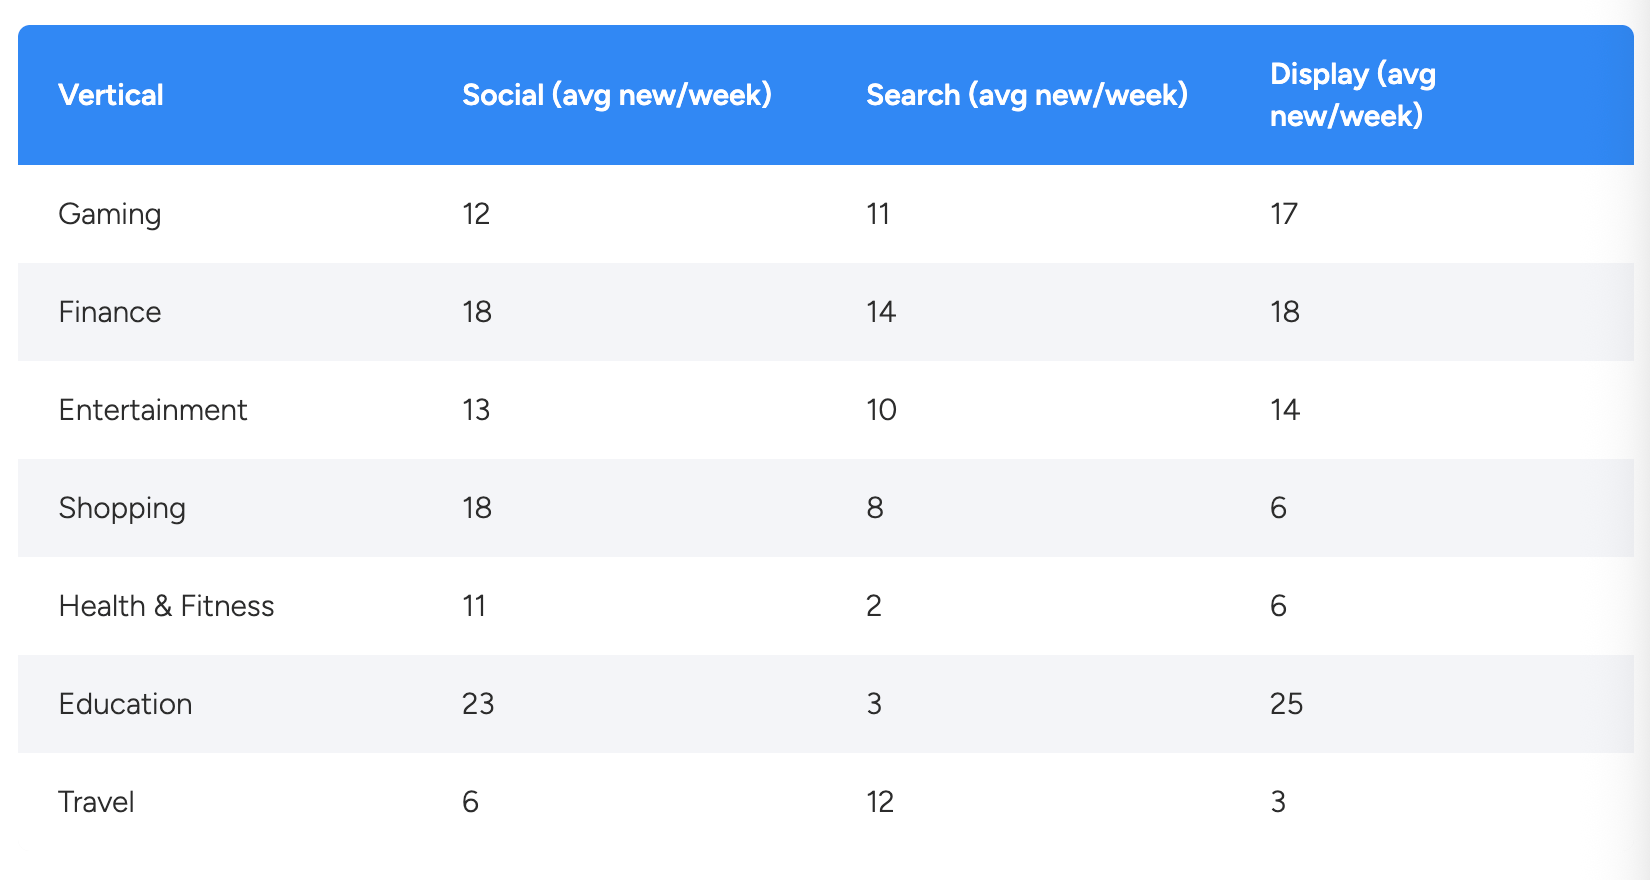
Gaming advertisers launch an average of 12 new creatives per week for Social, 11 for Search, and 17 for Display formats. Singular explains the high Display numbers by games using the channel for testing.
Managing a distributed dev team shouldn’t mean managing a compliance headache. Mellow’s Contractor Management gives you ready-made contracts, IP compliance, and automated payouts for contractors in 150+ countries — for $35/month per contractor.
Education apps produce the most Social creatives (23 per week), and travel apps the fewest (6 per week).
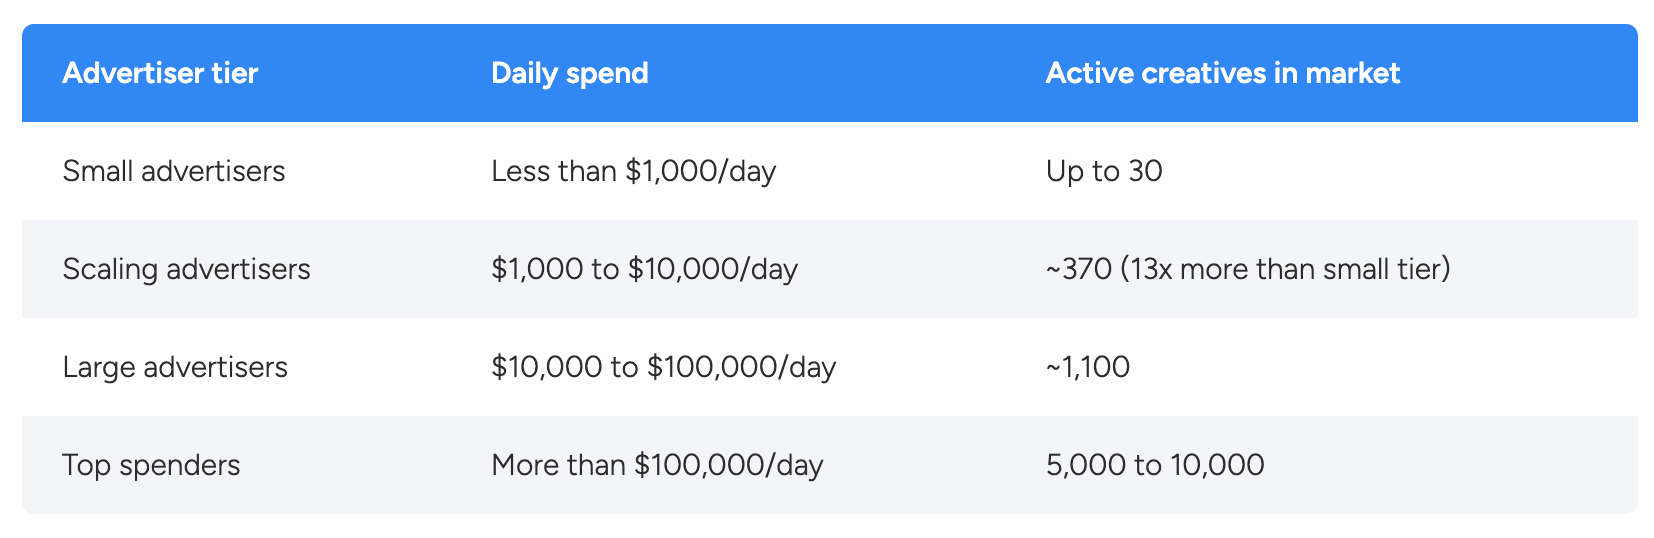
The more an advertiser spends, the more active creatives it runs. With spend under $1,000 per day, it's up to 30 creatives; at $1,000-10,000 per day, ~370 creatives; at $10,000-100,000 per day, ~1,100 creatives. Advertisers spending more than $100,000 per day run 5,000-10,000 creatives at once.
At the same time, Singular claims that creative count alone doesn't affect CTR, CVR, or ROI. Advertisers with similar creative counts can differ widely in performance. According to Singular, a large creative volume helps big advertisers feed more data to the networks' algorithms and reduces the risk of creative fatigue.
Spend Concentration

The top 10% of creatives account for 75-95% of ad spend. The more creatives an advertiser has, the higher the concentration: with up to 100 creatives, the top 10% get ~75% of the budget; with 1,000 or more, over 90%. For comparison, AppsFlyer reports that the top 10% of video creatives in games account for 85.6% of spend.
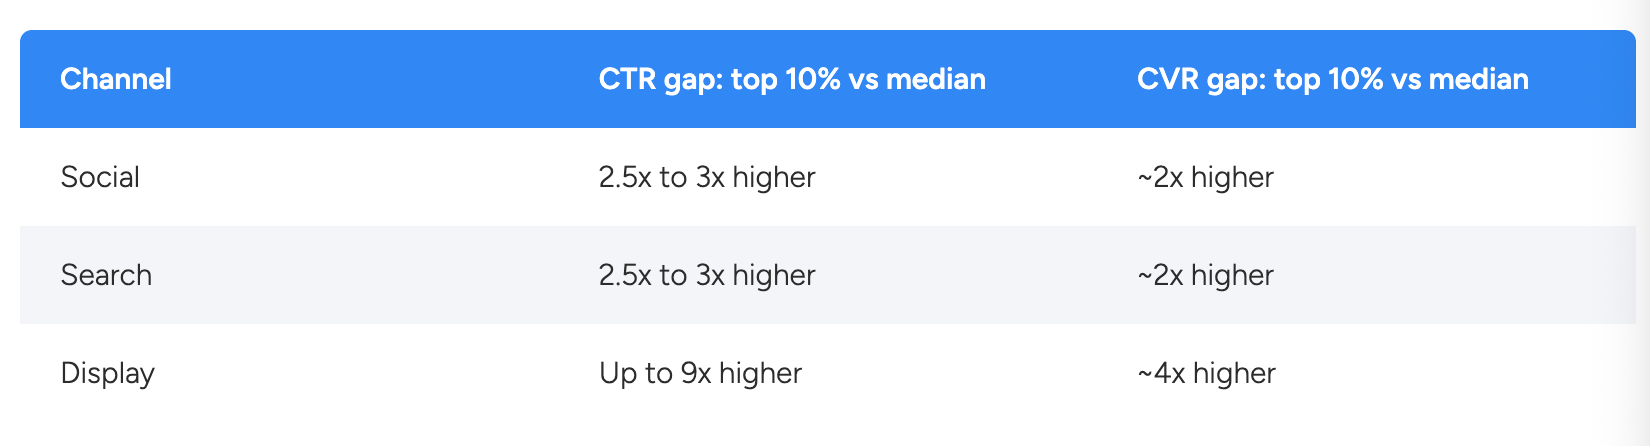
On Social and Search, the top 10% of creatives beat the median by 2.5-3x on CTR and by roughly 2x on CVR. In Display formats, the gap is even wider: up to 9x on CTR and roughly 4x on CVR.
Singular believes most advertisers could double their average CTR by shifting budgets toward creatives that already work. According to the company, the main constraint is how fast a team finds its best creatives.
Channel and Vertical Benchmarks
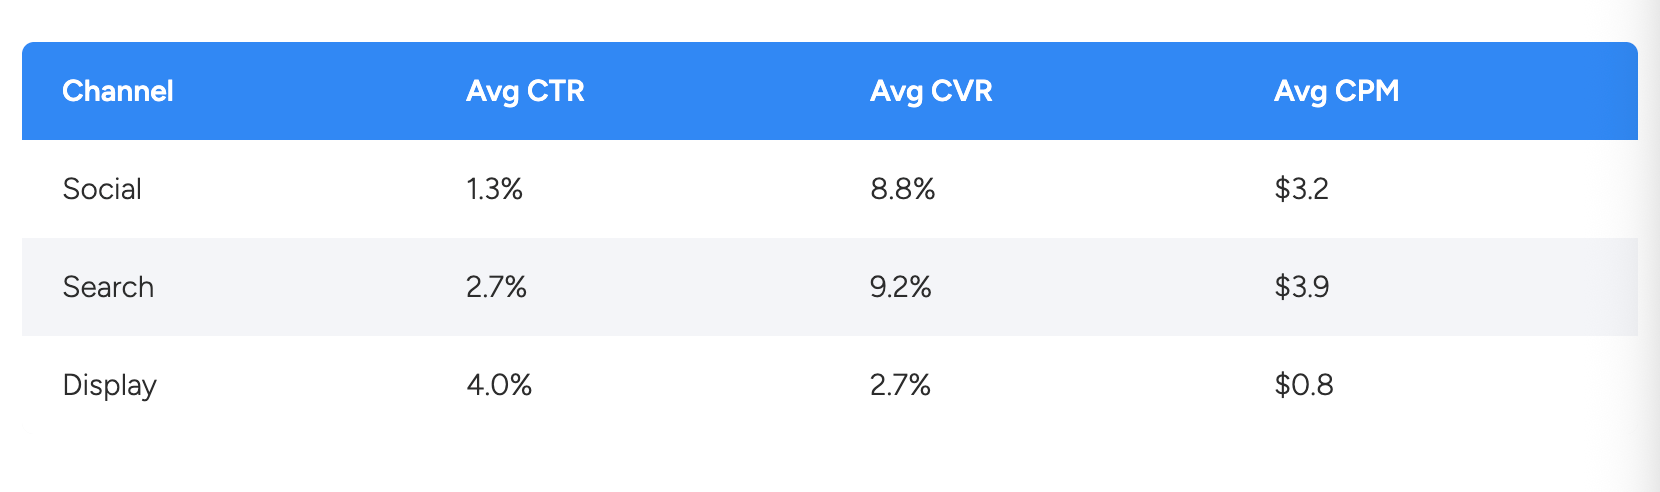
On Social, the average CTR is 1.3%, CVR is 8.8%, and CPM is $3.2. On Search, CTR is higher (2.7%), CVR is 9.2%, and CPM is $3.9.
In Display formats, CTR is 4.0%, but CVR is only 2.7%. It's also the cheapest channel: CPM is $0.8.
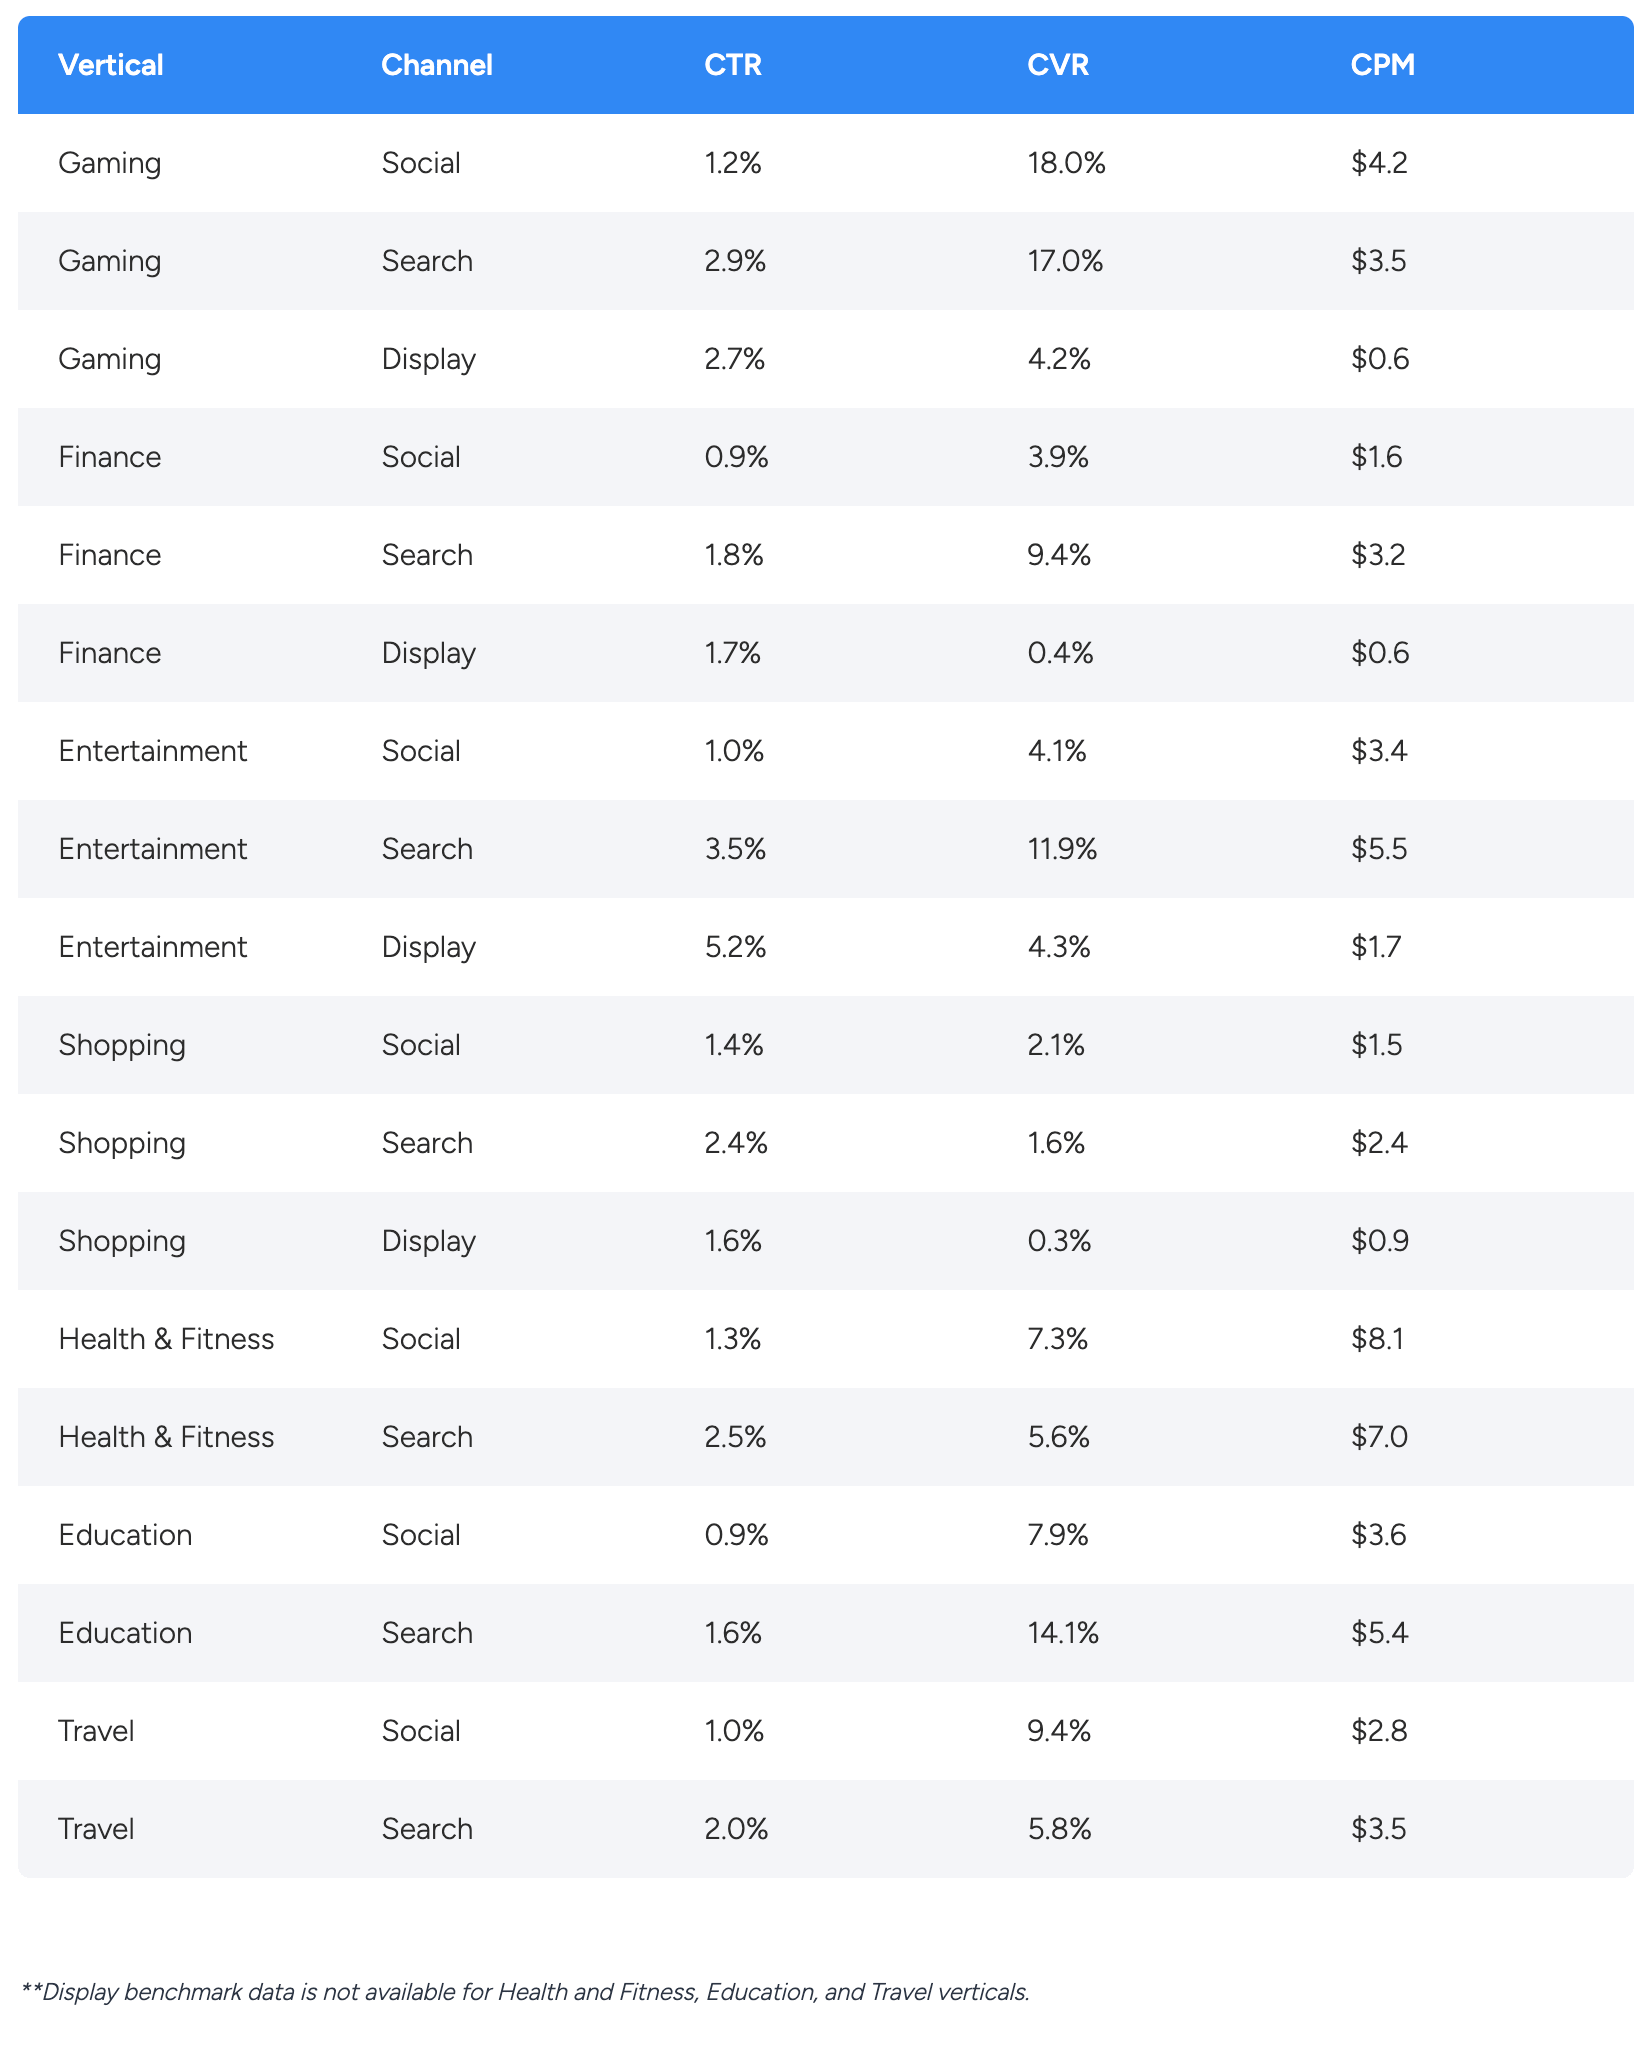
Gaming has the highest CVR of all verticals: 18.0% on Social and 17.0% on Search. CTR, meanwhile, is average: 1.2% on Social and 2.9% on Search. According to Singular, a gaming creative with a Social CVR below 15% is underperforming the market.
Gaming CPMs are $4.2 on Social, $3.5 on Search, and $0.6 on Display. Health & Fitness apps have the most expensive ads: $8.1 on Social and $7.0 on Search.
Because of the high CVR, Singular advises gaming teams to prioritize testing volume and speed over perfecting every creative.
In finance apps, Search CVR (9.4%) is 2.4x higher than Social CVR (3.9%). Singular links this to users learning about the product on Social and installing the app later when they search for it themselves.
Singular also cites its ROI Index 2026: in Meta campaigns, ROAS under multi-touch attribution was up to 50% higher than under last-touch. Singular believes some creatives may not convert users directly but still build awareness.
Alinea Analytics: Games Based on Non-Game IP Earned Over $900 Million in 2026 | GameDev Reports is powered by Mellow
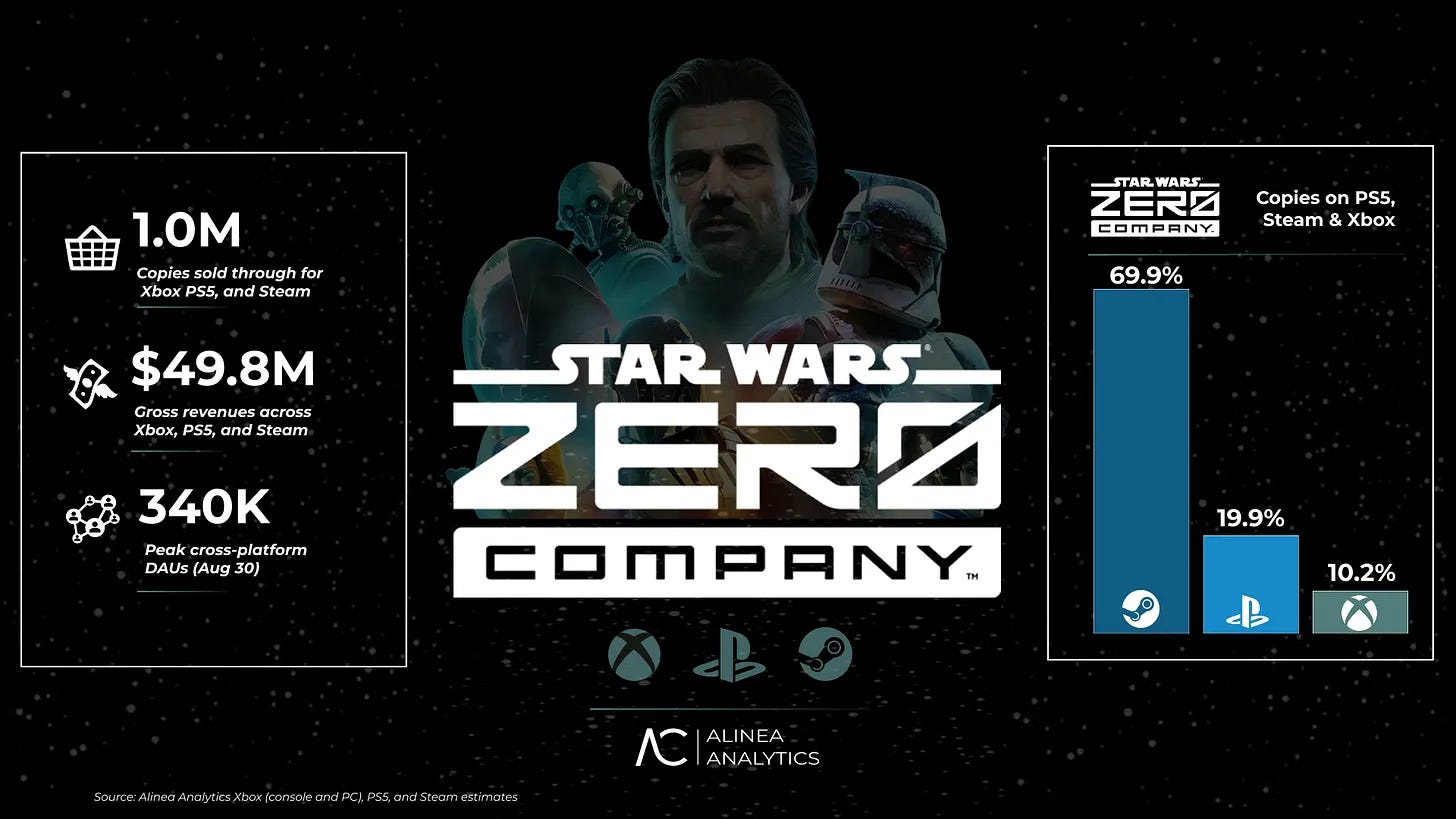
All numbers are Alinea Analytics estimates for Steam, PlayStation, and Xbox (including Xbox on PC). Revenue is gross.
Star Wars Zero Company
Star Wars Zero Company has sold over 1 million copies. Steam accounts for 69.9% of copies sold, PlayStation for 19.9%, and Xbox for 10.2%.
It is a turn-based tactics game set in the final days of the Clone Wars. Bit Reactor, a studio of Firaxis veterans (XCOM, Civilization), made it with support from Respawn. EA is the publisher.
The game has a Metacritic score of 86. That is the highest score for a Star Wars game in 22 years, since Knights of the Old Republic II in 2004.
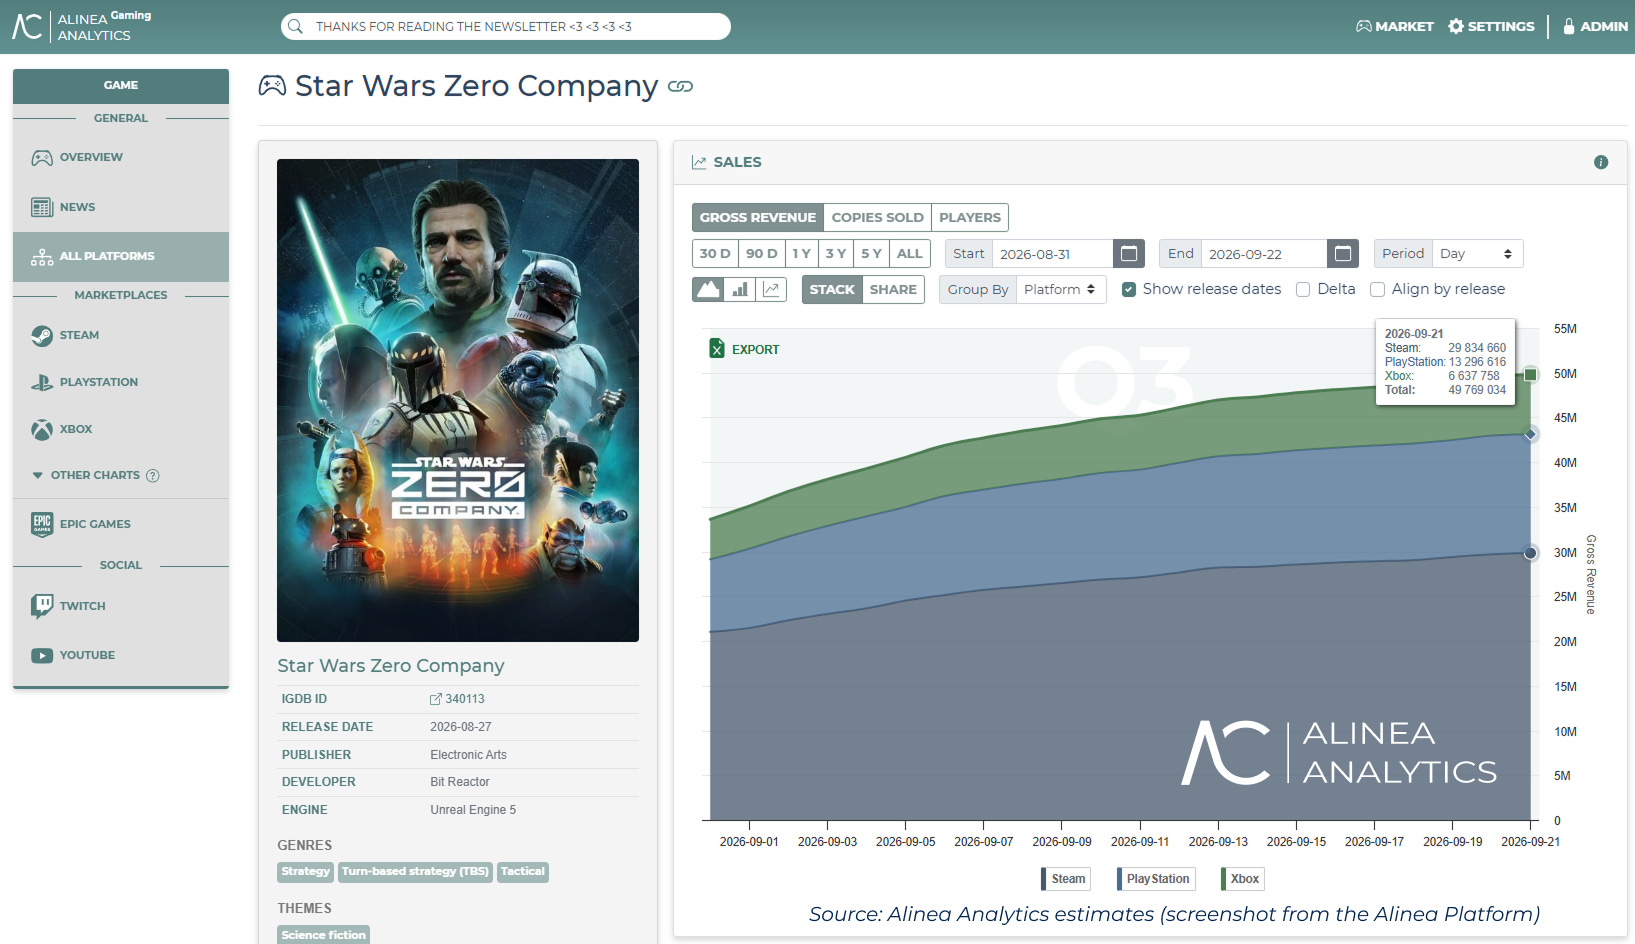
Since its August 27 release, Star Wars Zero Company has earned $49.8 million. Alinea Analytics considers this a strong result for the genre, especially given the competition.
Consoles account for 30.1% of copies sold but 40.1% of revenue (26.7% on PS5 and 13.3% on Xbox). Alinea Analytics attributes this to regional pricing: console players pay more per copy.
❗️According to GameDiscoverCo, Star Wars Zero Company earned $28.21 million on Steam in August alone. Alinea Analytics estimates the game's Steam revenue at $29.8 million as of September 21, and the chart suggests a significant portion came in September. The two services' estimates differ noticeably here.
90% of Star Wars Zero Company players live in North America and Europe; less than 5% are in Asia.
On Steam, the game has 82% positive reviews, but only 57% among Chinese users. Many complain about the lack of voice-over and localization. Alinea Analytics notes that Star Wars has never been more popular in Asia, and without proper localization, it only gets worse.
On Steam, 28% of Star Wars Zero Company players had previously played XCOM 2, and another 6% had played XCOM: Enemy Unknown. On PlayStation and Xbox, 32% had played XCOM 2.
From concept art to launch-day marketing, most game studios rely on contractors in multiple countries. Mellow makes it simple to hire, pay, and stay compliant with talent in 150+ countries — no legal entity required.
On Steam, 32% of players had played Star Wars: The Old Republic, and 24% each had played Battlefront 2 and Jedi: Fallen Order.
On consoles, Star Wars fans play an even bigger role. 63% of players on PlayStation had played Jedi: Fallen Order (85% on Xbox), 55% had played Jedi: Survivor (68%), and 40% had played Star Wars Outlaws (45%). Xbox shares are higher thanks to EA Play access through Game Pass Ultimate.
That said, according to Game File, most of the Bit Reactor team was put on unpaid furlough a few weeks before release. The studio had reportedly almost run out of money. Bit Reactor says the decision was its own, not EA's or Disney's.
Games Based on Non-Game IP in 2026
According to Alinea Analytics, games based on non-game IP have earned over $900 million in 2026. The top 20 includes titles like 007, Marvel, LEGO Batman, Jay and Silent Bob, and Starship Troopers.
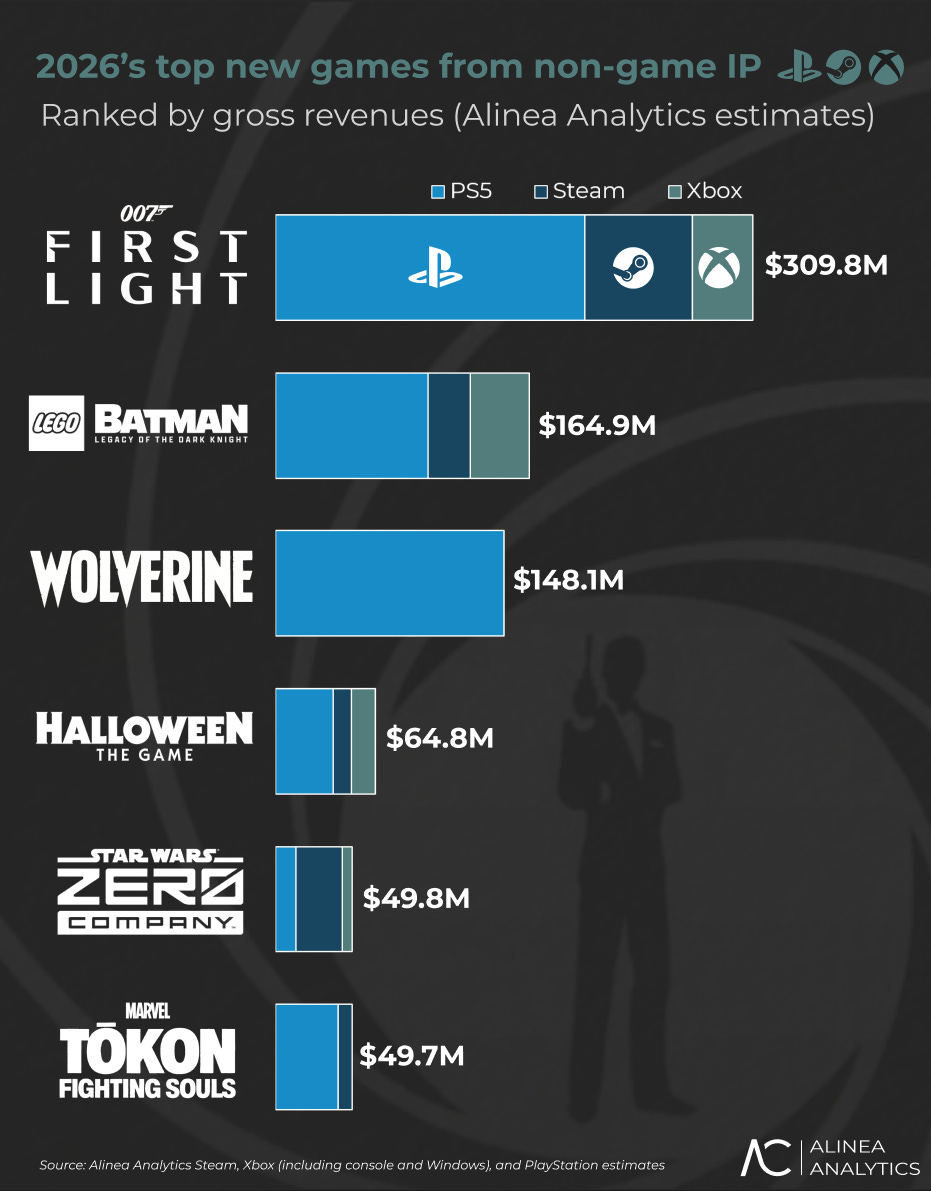
007 First Light leads with $309.8 million in revenue. PS5 accounts for $200.6 million (64.6%), Steam for $70 million (22.8%), and Xbox for $39.2 million (12.6%). The game has sold over 4.5 million copies, including 2.8 million on PS5.
007 First Light alone brings in over a third of the revenue of all games based on non-game IP this year. The top three account for about two-thirds of all revenue.
LEGO Batman: Legacy of the Dark Knight earned $164.9 million and sold 2.3 million copies. PlayStation accounts for $100 million, ~60% of revenue.
LEGO Batman's PlayStation audience seems to skew toward kids and teens: 78% of players had played Fortnite, 78% Spider-Man, and 76% GTA V.
A few months ago, PlayStation Plus Premium subscribers could try LEGO Batman for free. Over 100,000 people started the trial, and 3.1% bought the game.
Marvel's Wolverine earned $148.1 million in its first week after release, on PS5 alone.
Halloween: The Game earned $64.8 million and sold 1.5 million copies in its first two weeks. It is an asymmetrical 1v4 horror game in the vein of Dead by Daylight and IllFonic's own Friday the 13th.
Star Wars Zero Company ($49.8 million) and Marvel Tokon: Fighting Souls ($49.7 million) share fifth and sixth places.
Marvel Tokon has sold 750,000 copies: ~82% on PlayStation and ~18% on Steam. At launch, the game's DAU reached ~300,000; it has since fallen below 40,000 across all platforms. Last week, the game sold fewer than 15,000 copies. Alinea Analytics notes that technical, account, and DRM problems badly hurt the PC version.
Alinea Analytics concludes that Batman: Arkham, Marvel's Spider-Man, and Hogwarts Legacy are the exception, and it's not worth benchmarking against them. For many games based on non-game IP, mid-tier success, like that of Star Wars Zero Company and Marvel Tokon, is a more realistic target. $50 million for a turn-based tactics game or a team-fighting game in a crowded release window is a good result.
Analysts say such projects can be high-margin, help new studios land contracts, and keep interest in older IP alive. Expectations need to be recalibrated for both projections and budgets.