


Reports of the week:
Google & Newzoo: The H5 Gaming Audience in 2026
Omdia & FastSpring: D2C Game Monetization in 2026
Sensor Tower: The Premium PC/Console Gaming Market in 2026
Adjust: The Mobile Market of Türkiye in 2026
GameDiscoverCo: How Players of Different Ages Discover New Games
Bryter: Women Gamers in 2026
Google & Newzoo: The H5 Gaming Audience in 2026
Newzoo surveyed ~7,500 people aged 13-55 who play H5 games (browser-based games) at least once a month. The survey ran in February 2026 in the US and Canada, Brazil, the UK, Germany, South Korea, Japan, and India. In Brazil and India, the sample reflects urban residents with reliable internet access.
❗️In the introduction, Google and Newzoo write that H5 gaming is growing fast. However, according to Sensor Tower, visits to browser game sites grew only slightly in H1’26 (to 9.45 billion). All of that growth came from Asia, while traffic in Europe is declining.
The Audience
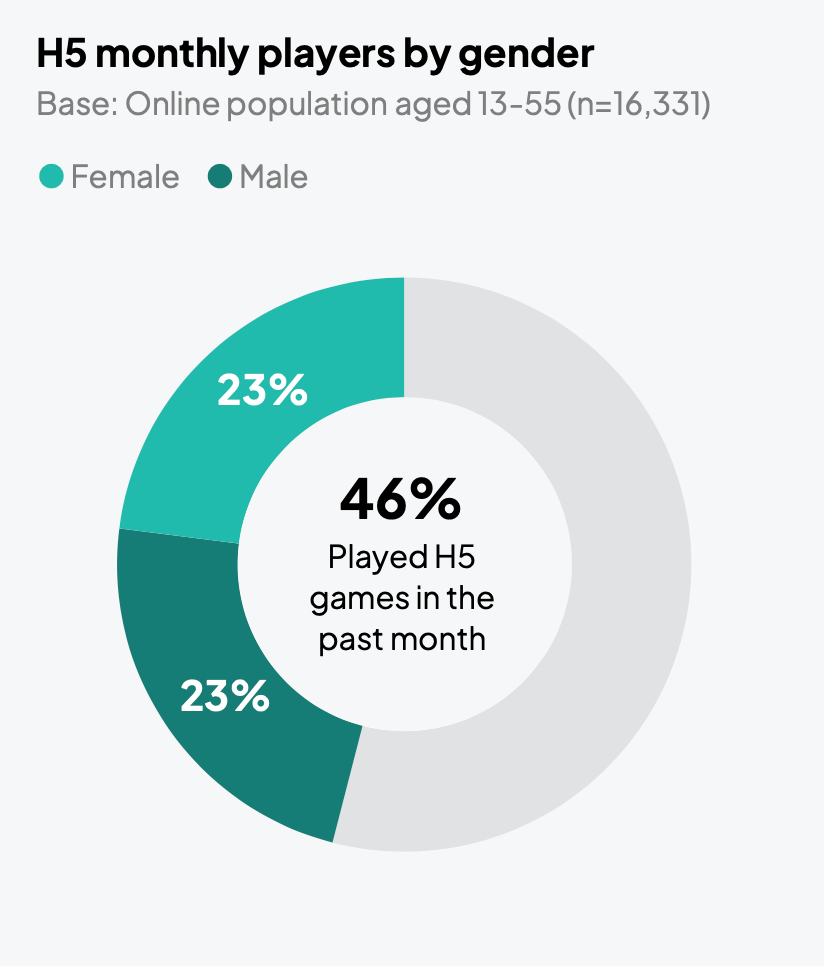
46% of internet users aged 13-55 in the surveyed countries played H5 games in the month before the survey. The share is highest in South Korea (54%), India (53%), and Brazil (52%), and lowest in Japan (34%).
A word from our sponsor

Need a freelance 3D artist, composer, or QA tester fast? Mellow’s AI Scout finds qualified talent in under 48 hours — free to try, no commitment. Describe the role, get a shortlist, hire when you’re ready.
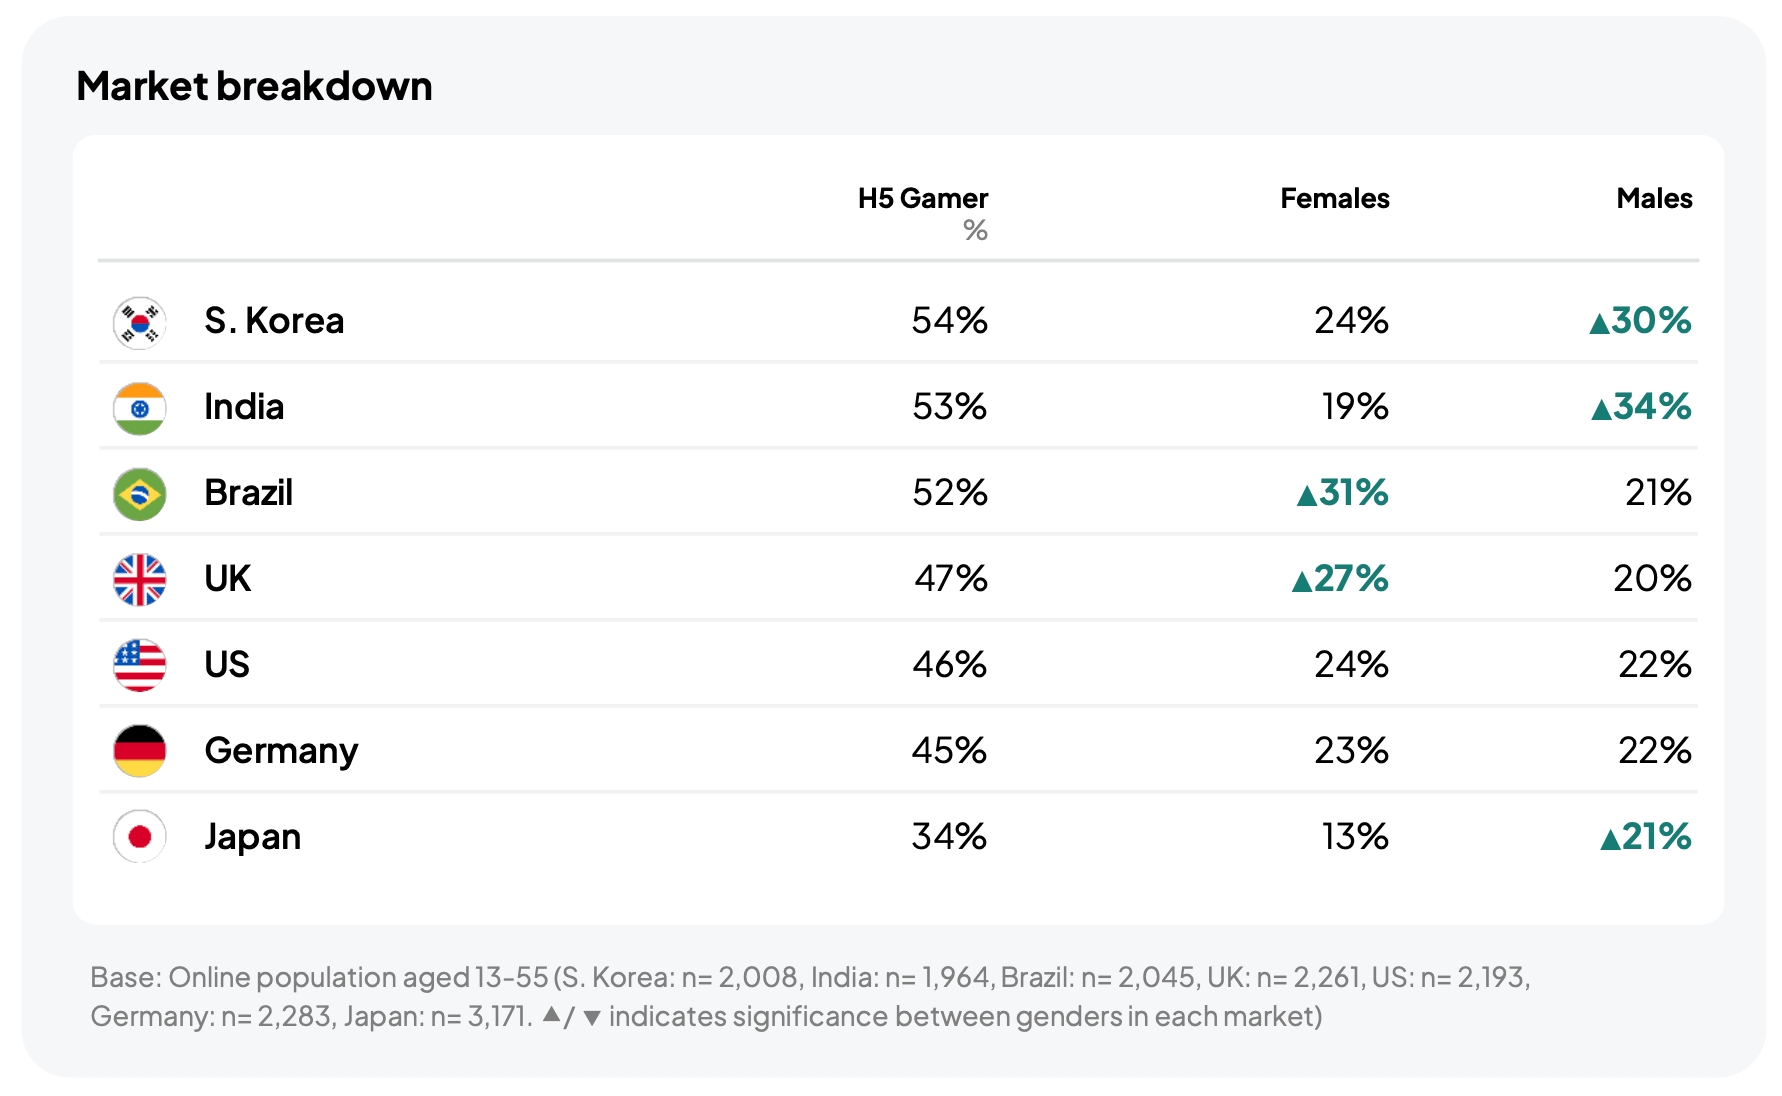
Browser game players are split evenly between men and women. Western countries skew slightly female, and Asian countries skew male.
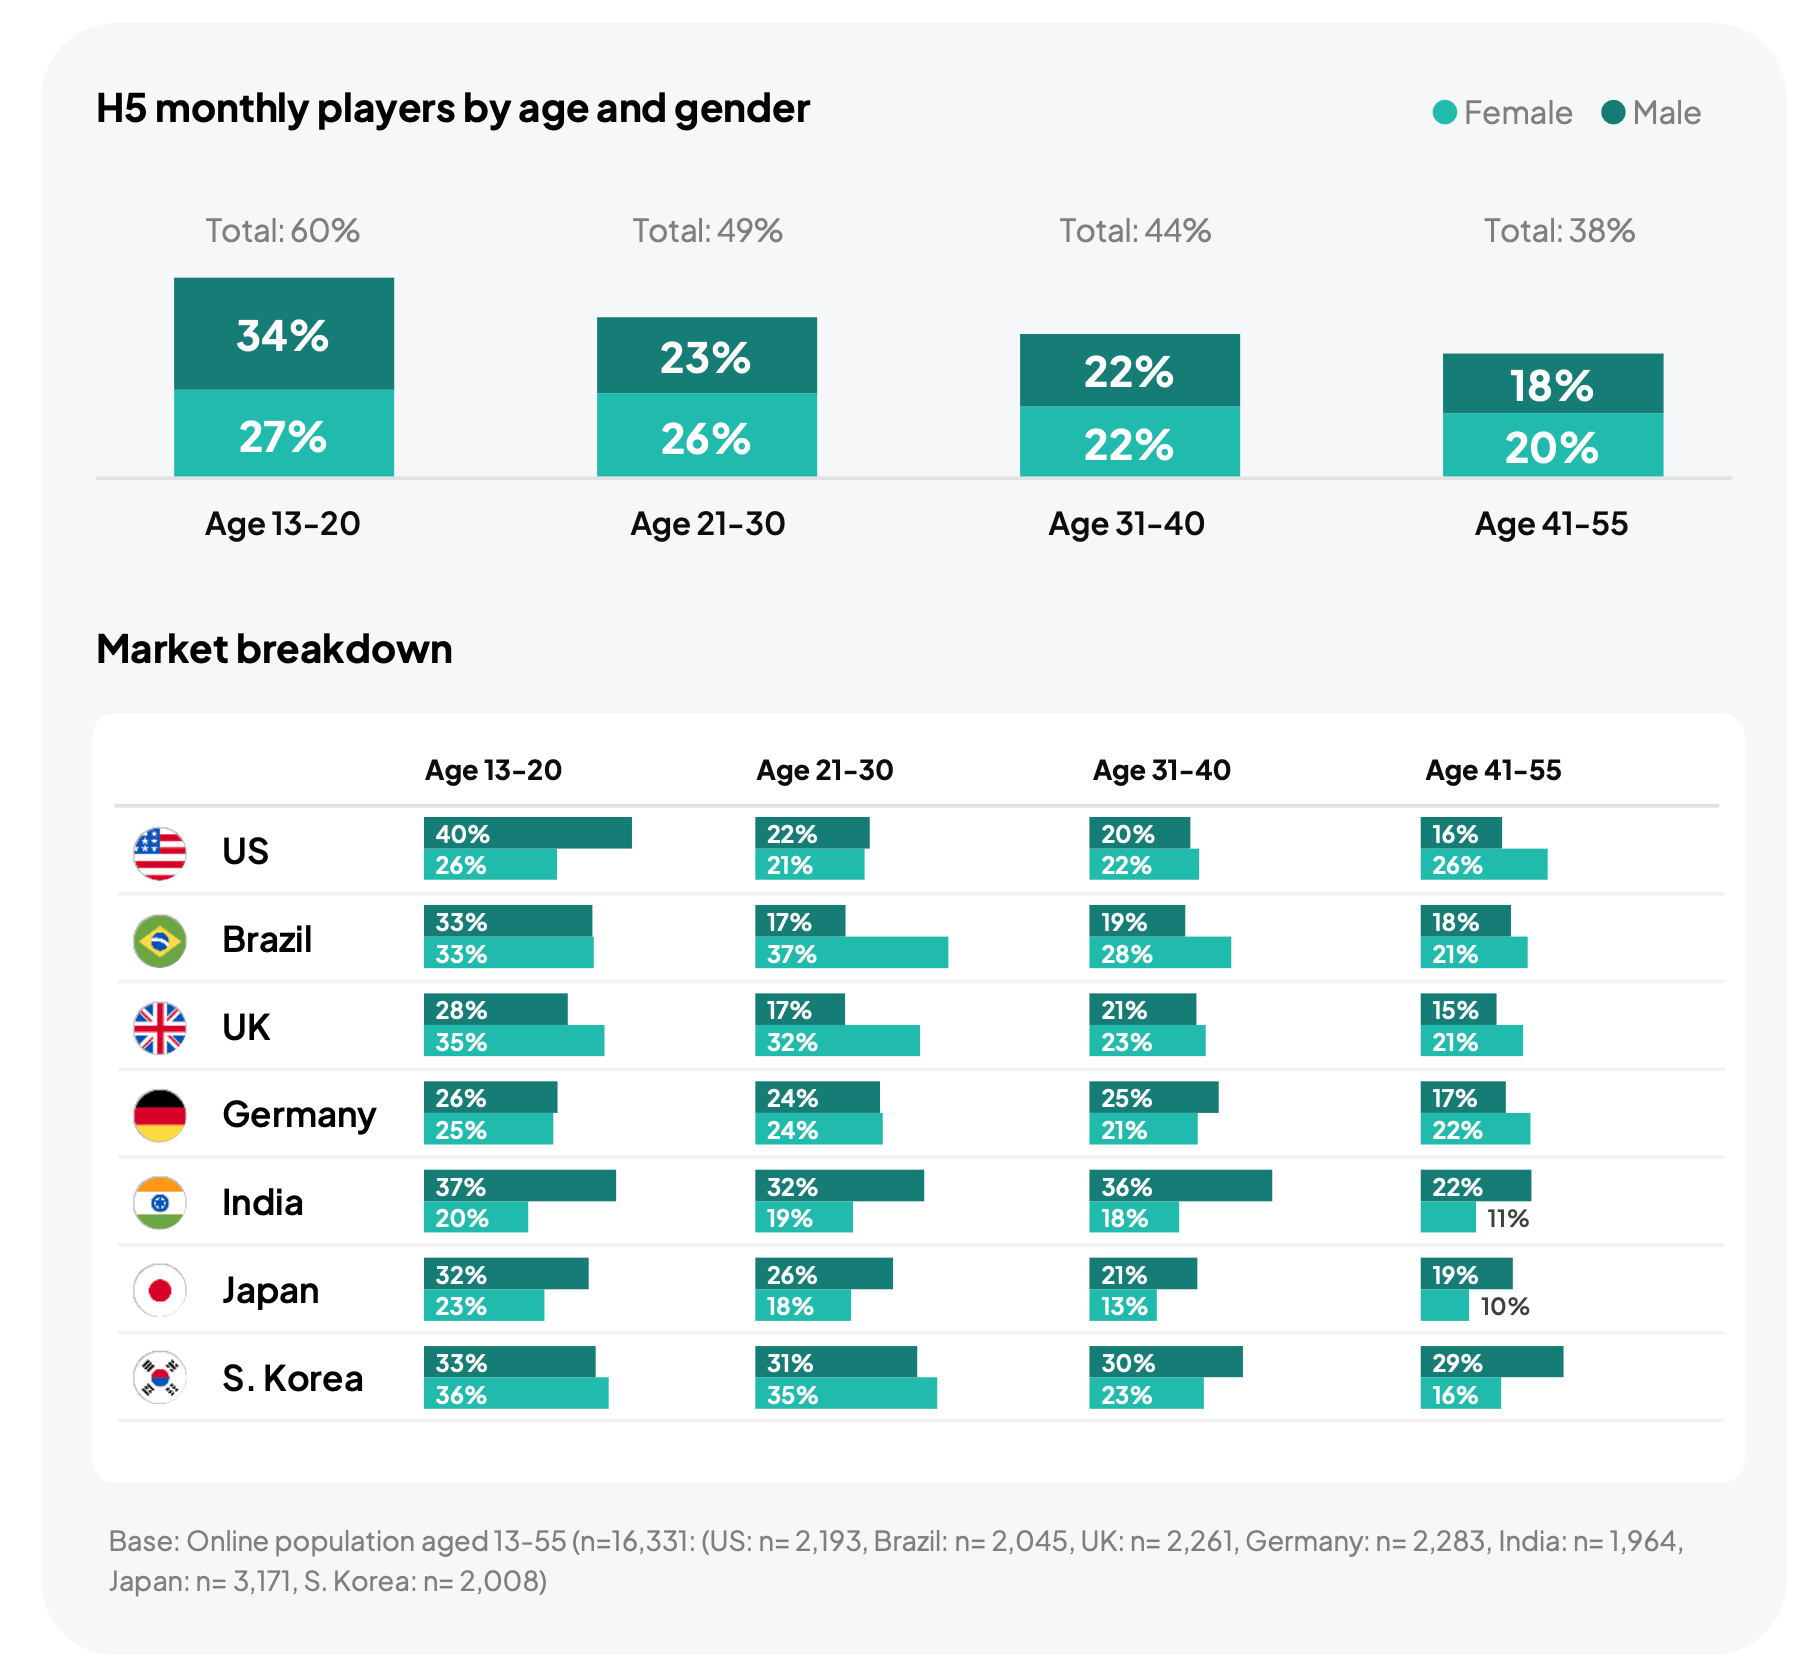
The younger the audience, the more often it plays browser games: 60% of people aged 13-20 play, compared with 38% of those aged 41-55.
In the 13-20 segment, noticeably more men play (34% vs. 27%). This is largely driven by the US, where 40% of young men and 26% of young women play H5 games. In the 41-55 group in the US, it is the other way around: there are more women (26%) than men (16%).
In Brazil, more than twice as many female gamers as male gamers are aged 21-30 (37% vs. 17%). In the UK, women play more in every age group. In India and Japan, by contrast, men play more.
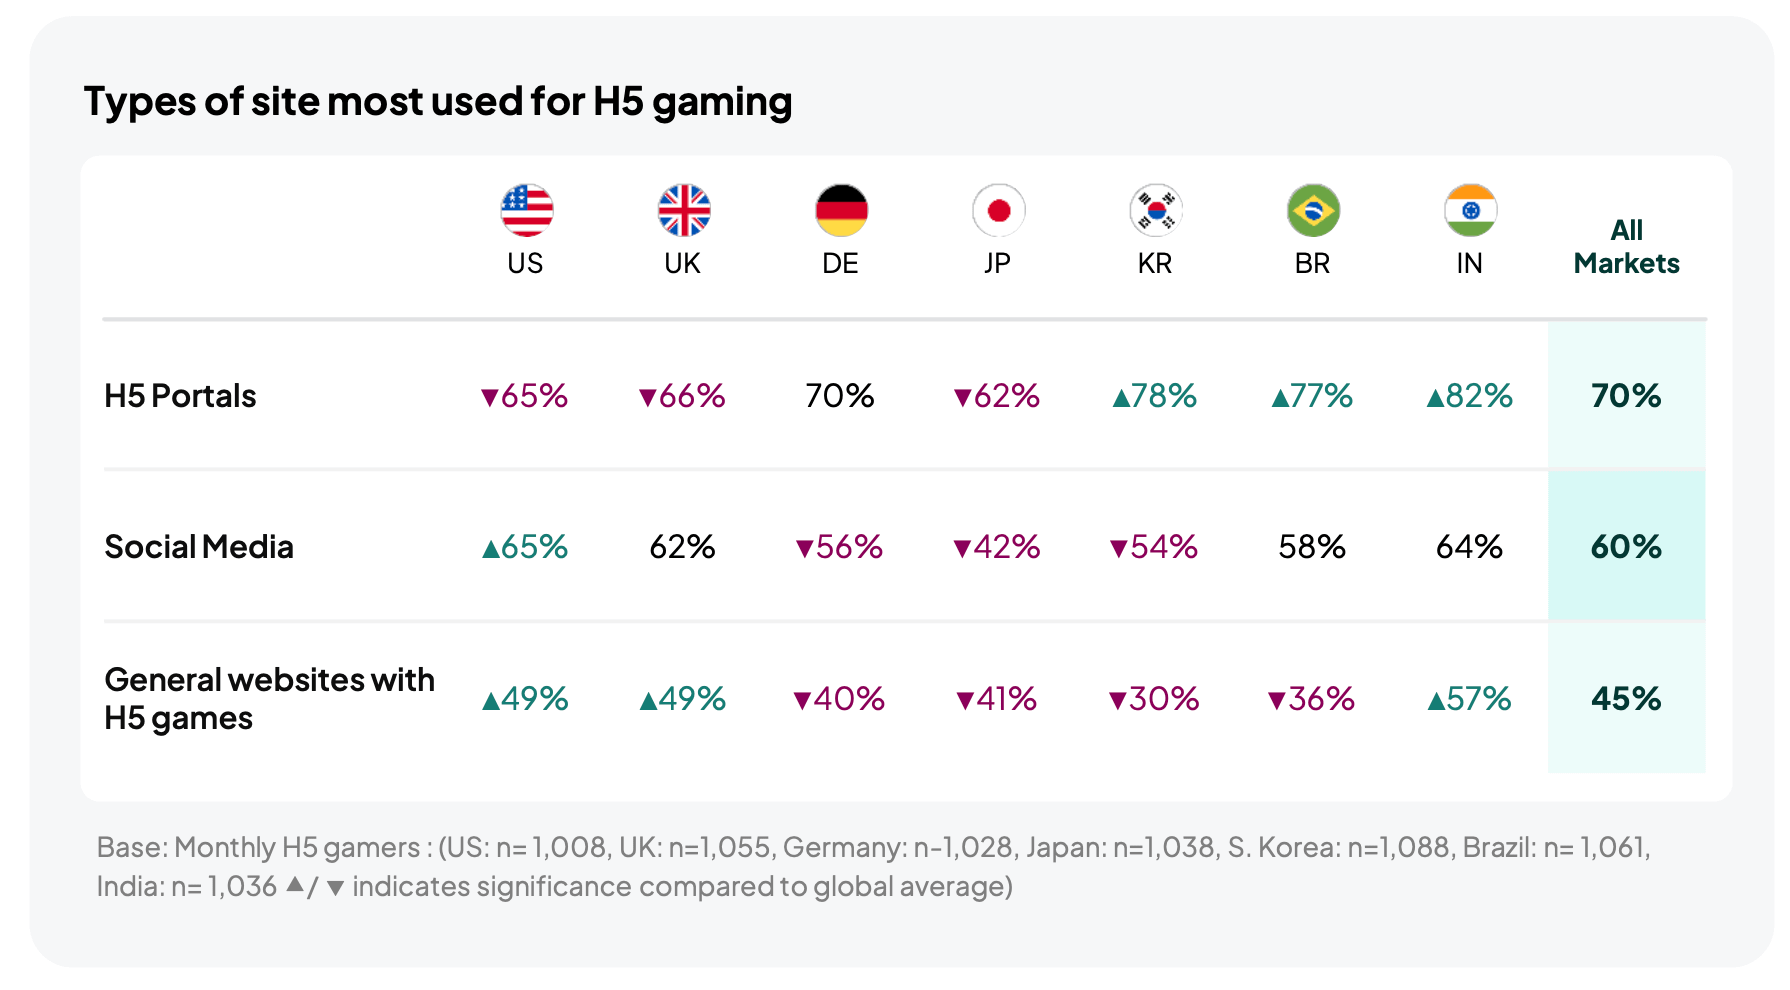
Most people play H5 games on dedicated platforms (70%). Social media is second (60%), and regular websites (news, education, etc.) that host games are third (45%).
In the US, social media and H5 portals are equally popular (65% each). Dedicated web gaming platforms are most popular in India (82%), South Korea (78%), and Brazil (77%).
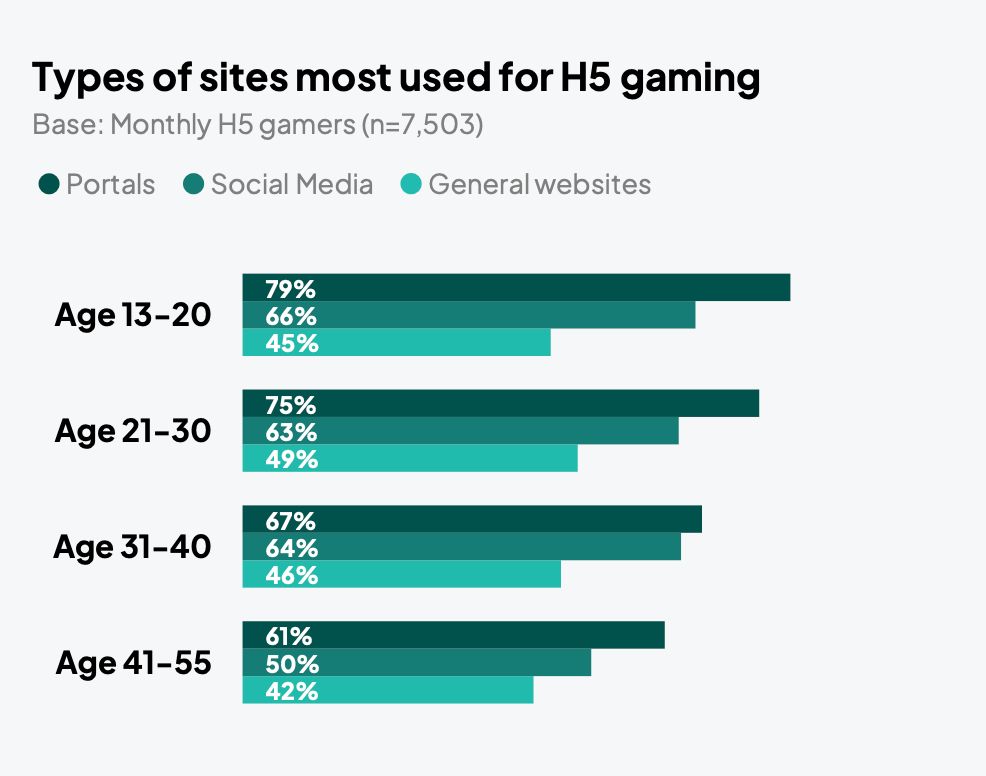
Web game sites are especially popular with younger players: 79% of players aged 13-20 use them, compared with 61% of those aged 41-55.
Social media, however, is visited more often. 36% of players play there daily, 25% on platforms, and 22% on regular websites.
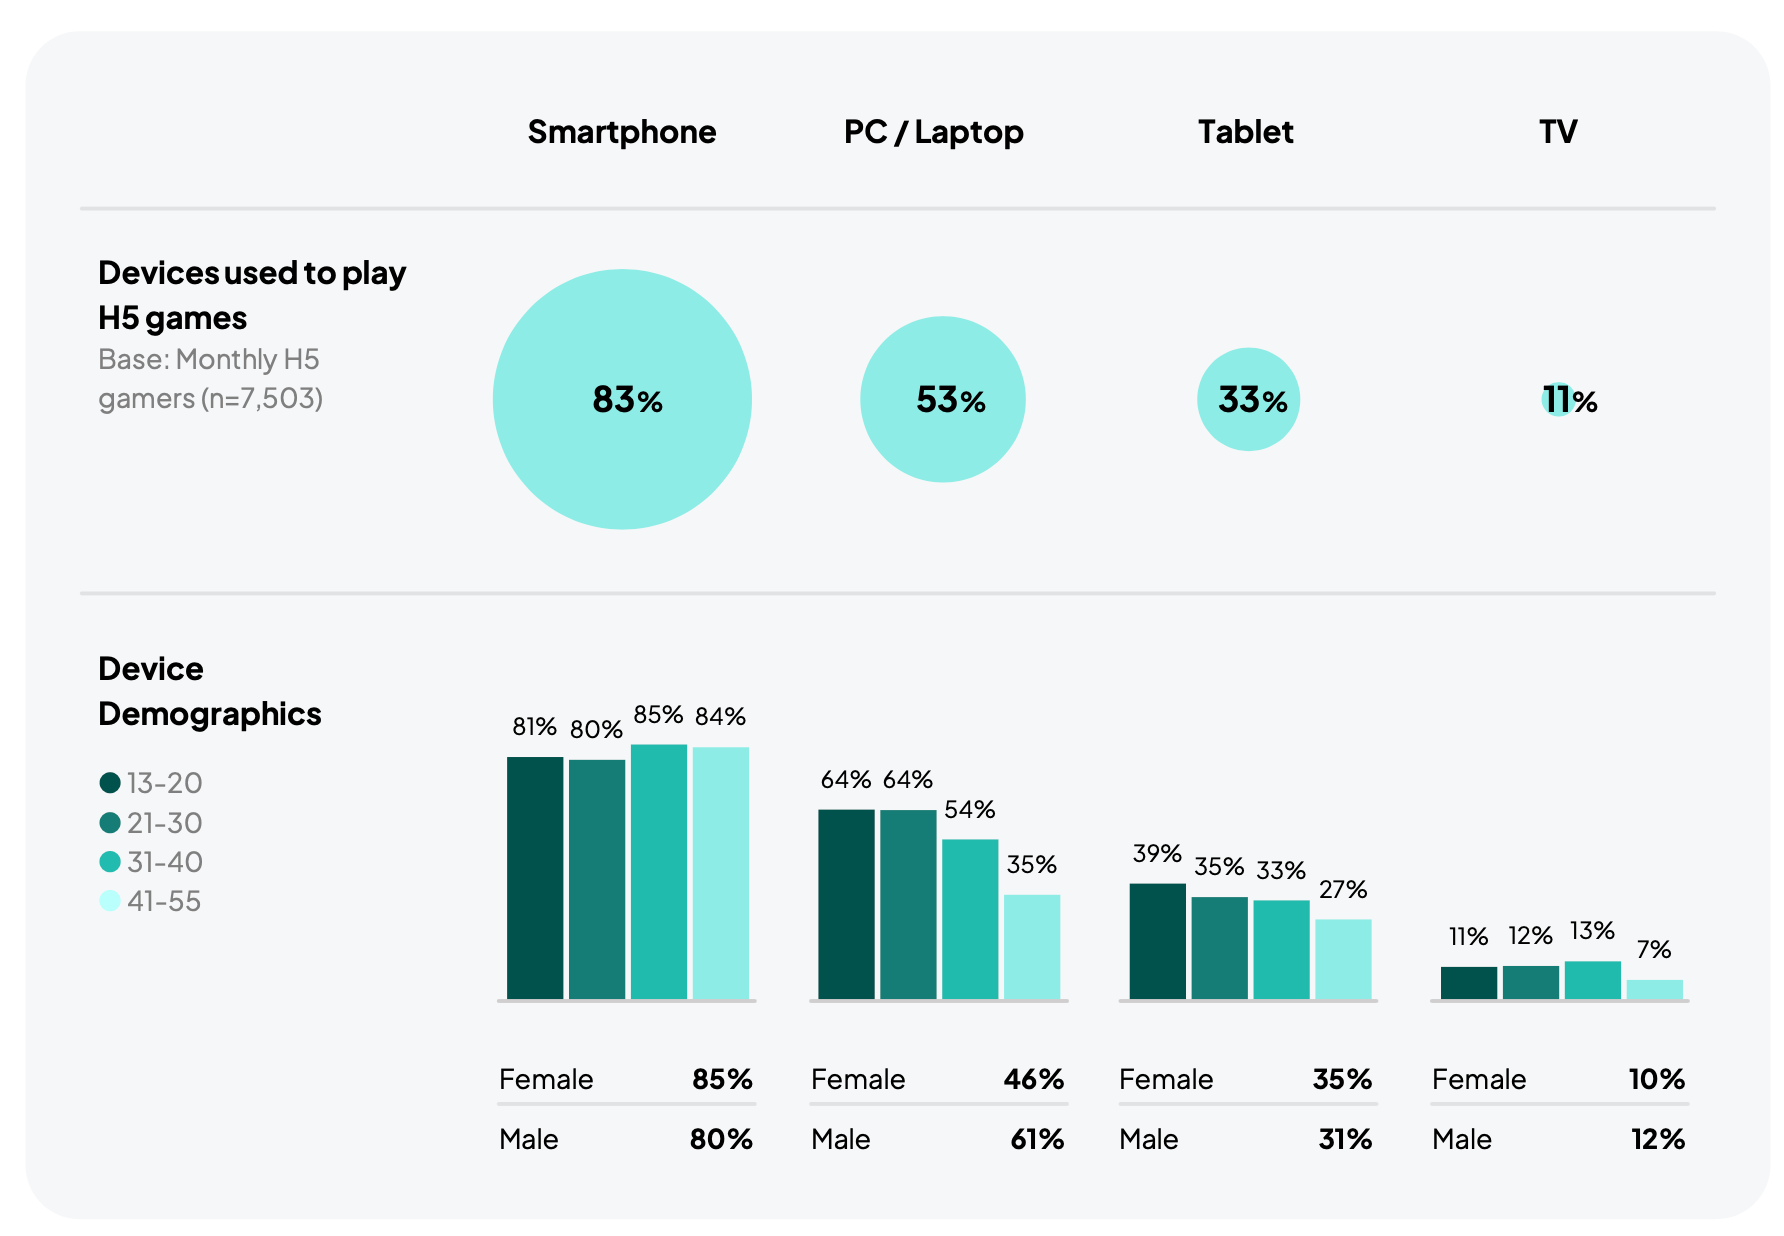
83% play H5 games on a smartphone, 53% on a PC or laptop, 33% on a tablet, and 11% on a TV.
Younger players are more likely to use multiple devices. Only 35% of players aged 13-30 stick to a single device, compared with 60% of those aged 41-55.
In Japan, 88% play on a smartphone, and other devices are used less than anywhere else. In Brazil and India, by contrast, the share of PC players is higher (72% and 68%).
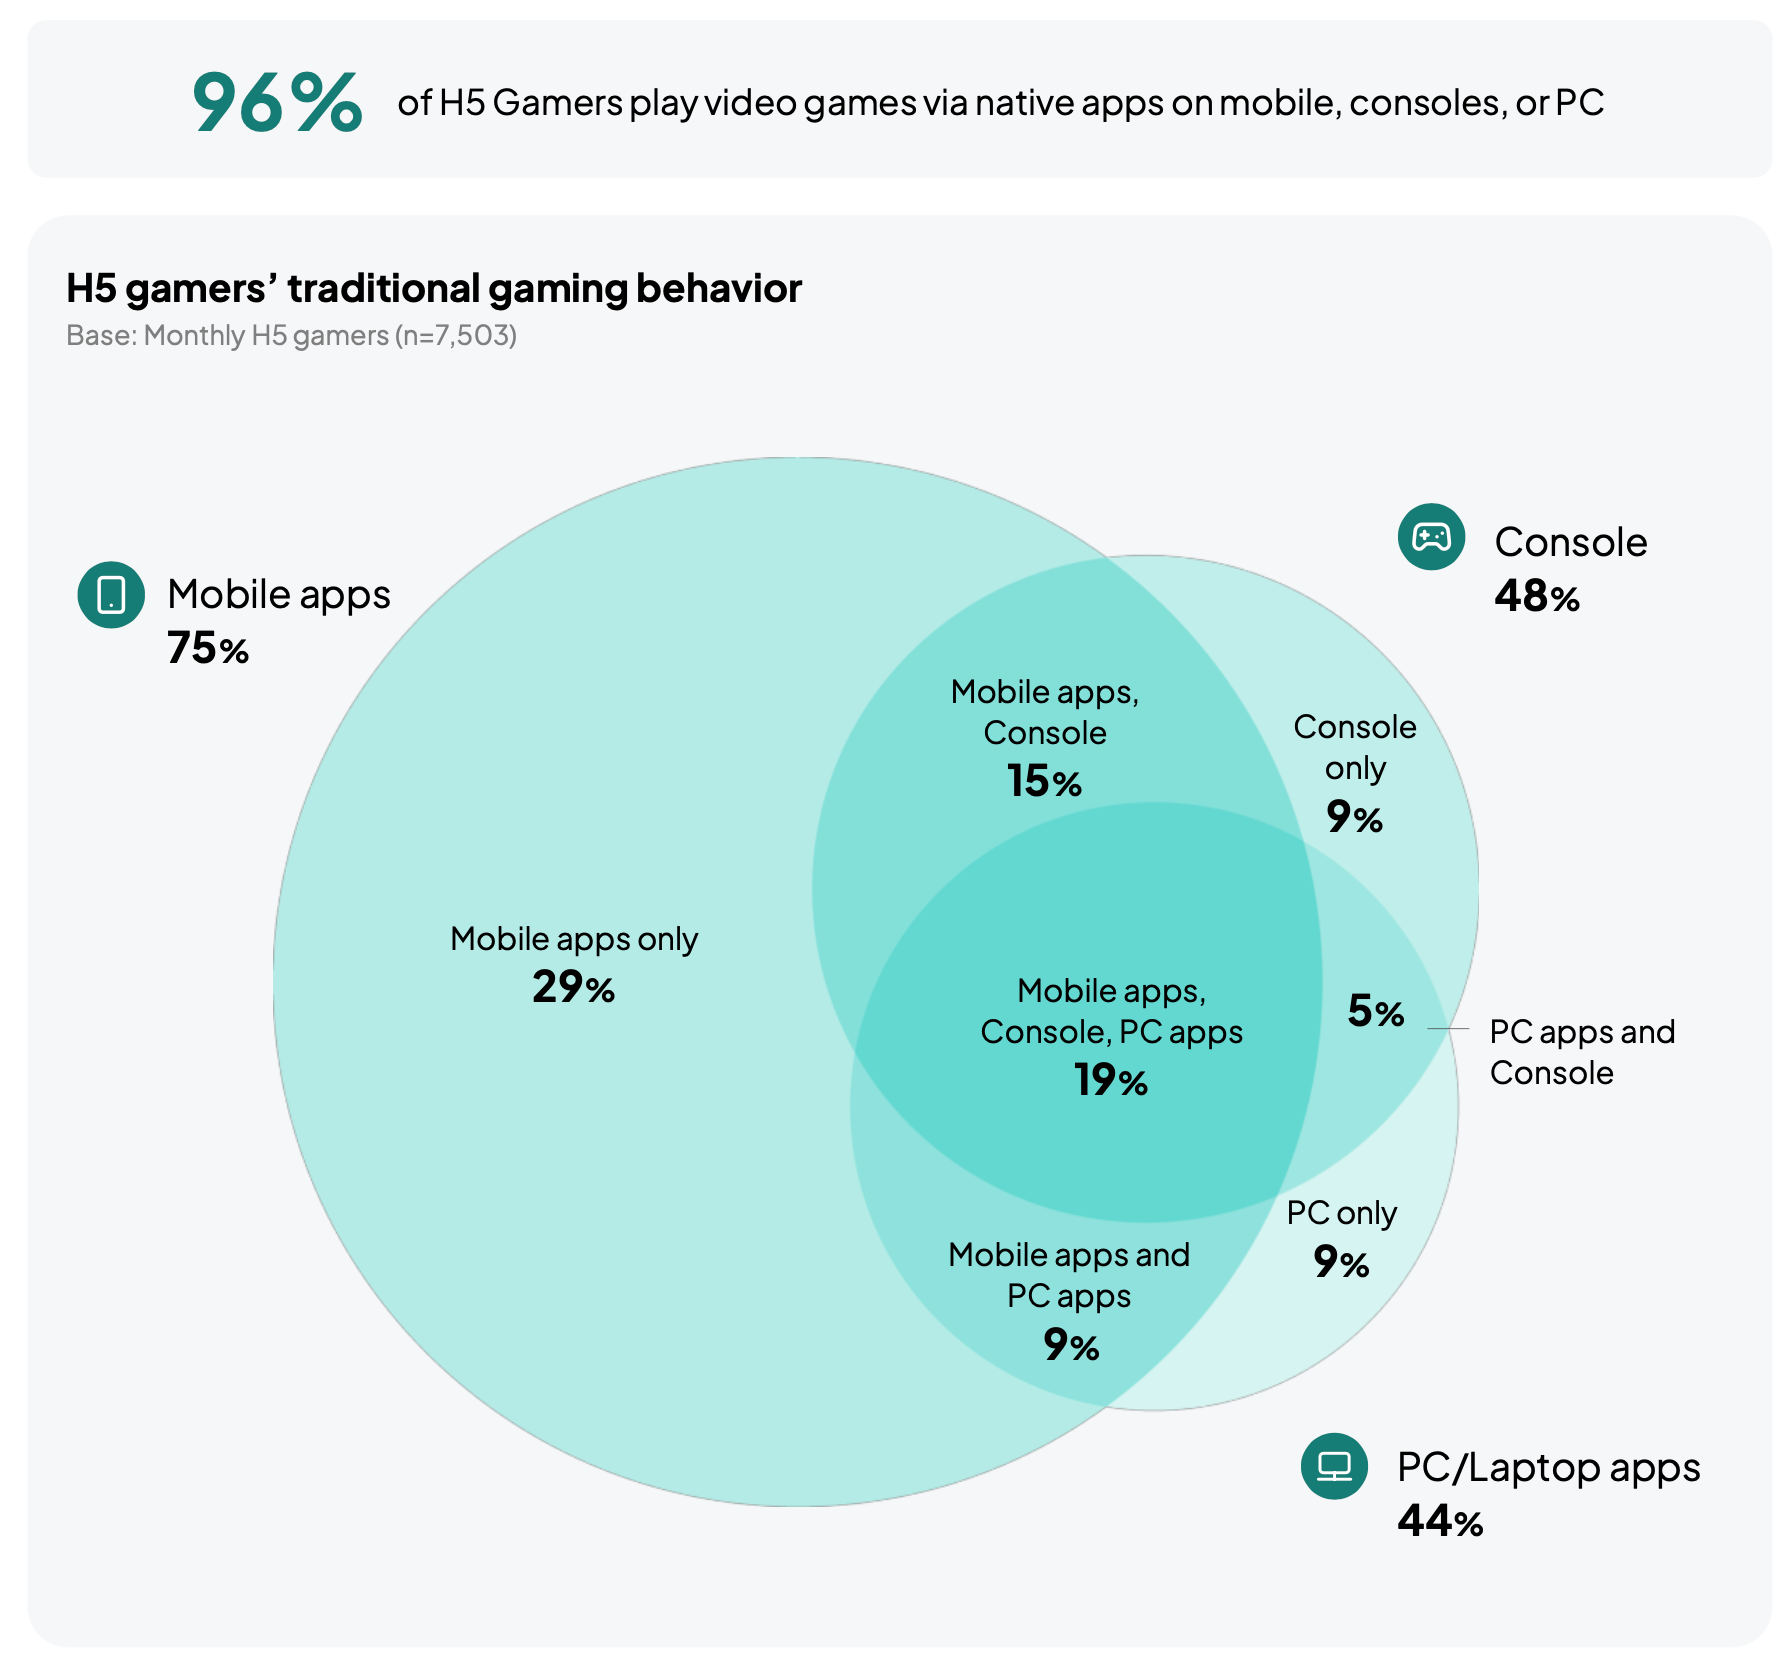
Almost all browser gamers also play traditional games. 96% play native games on mobile, console, or PC, and only 4% play browser games exclusively.
75% of browser gamers play mobile games, 48% play on consoles, and 44% play PC games.
❗️The console and PC numbers look very high. Their audience base is much smaller than mobile's, so such numbers might be an error.
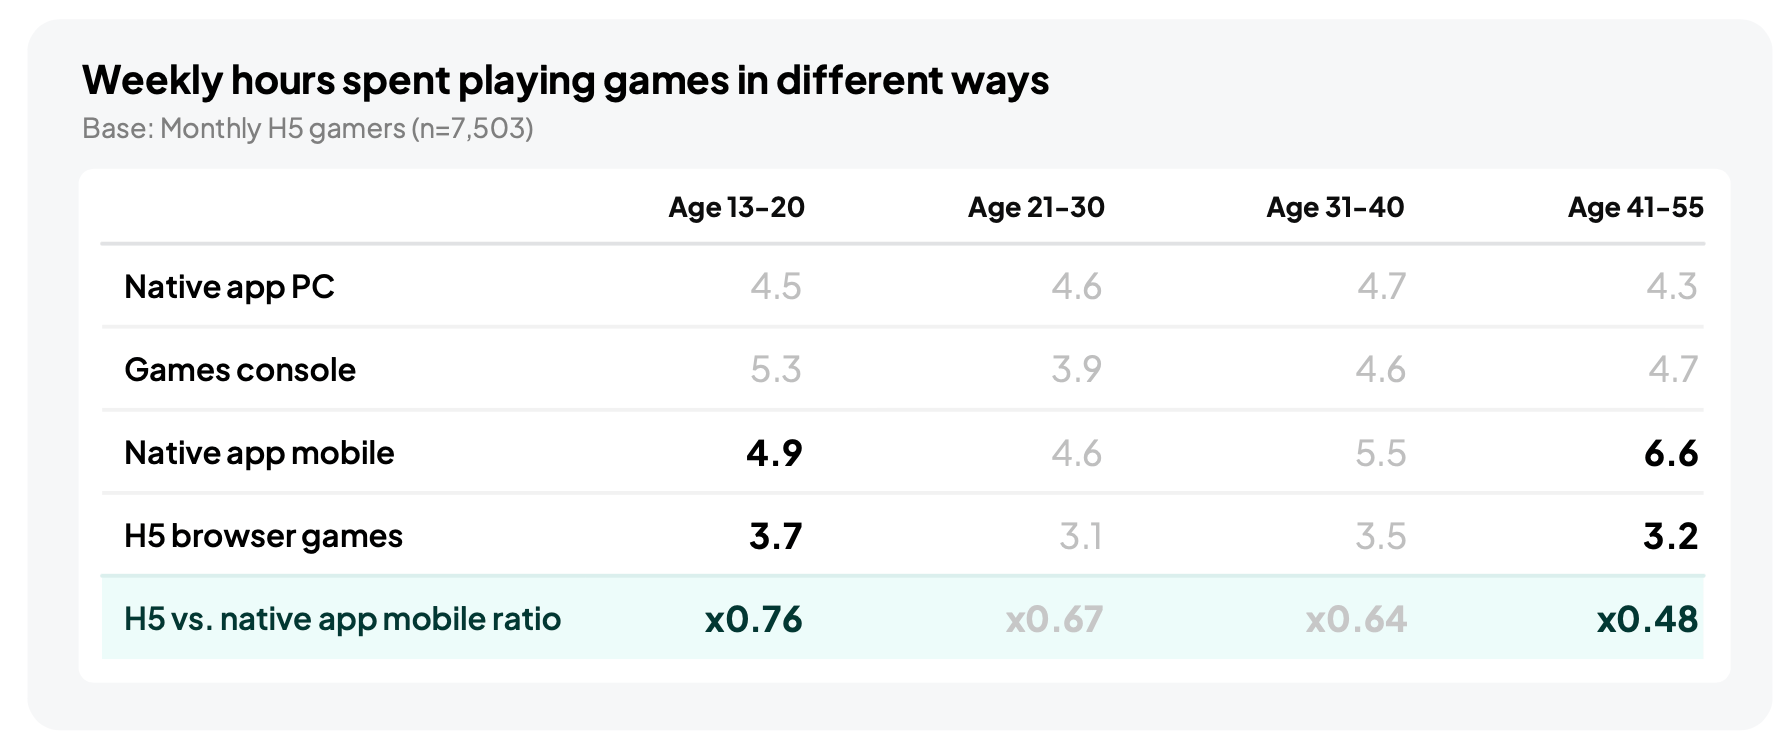
In terms of time spent, browser games lose to every other platform. Users aged 13-20 spend 3.7 hours a week on them vs. 4.9 hours on mobile apps. For the 41-55 segment, the gap is even wider: 3.2 hours vs. 6.6 hours.
Newzoo concludes that browser games will grow organically: younger players split their time between H5 and mobile almost evenly, and the habit may stick as they get older.
What Players Want from H5 Games
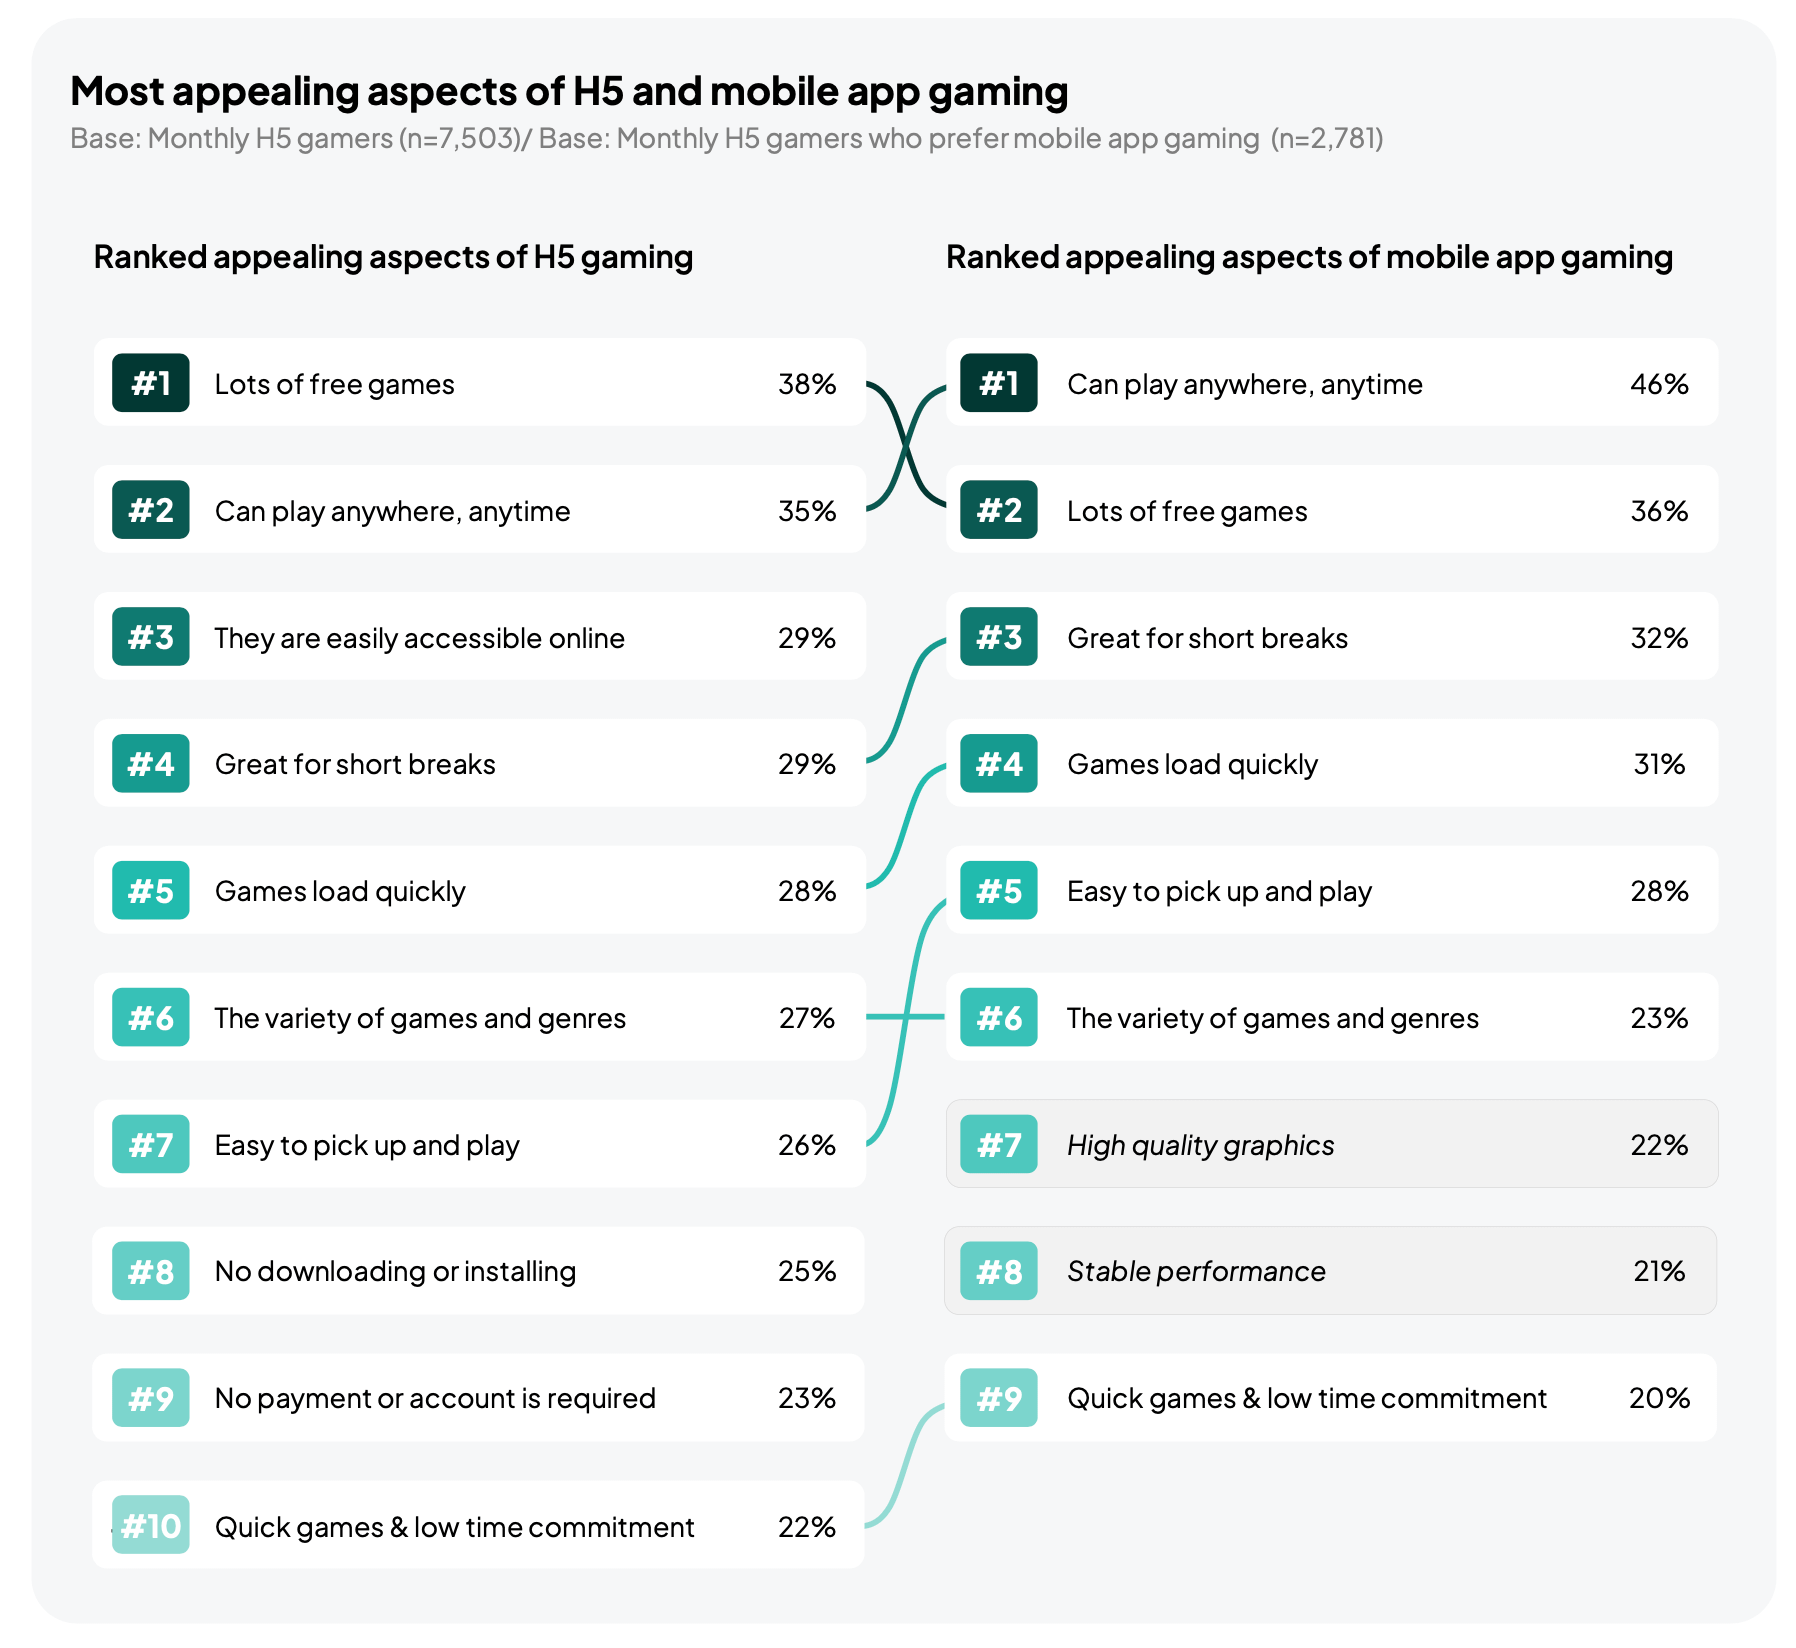
H5 players like the large number of free games most (38%), being able to play anywhere, anytime (35%), and how easy the games are to find online (29%). In mobile games, the top two swap places (46% and 36%), and third place goes to “great for short breaks” (32%).
In terms of motivation, seven of the top ten reasons are the same for both platforms. In web games, players also value not having to download anything (25%) and not having to pay or register (23%). In mobile games, people like high-quality graphics (22%) and stable performance (21%).
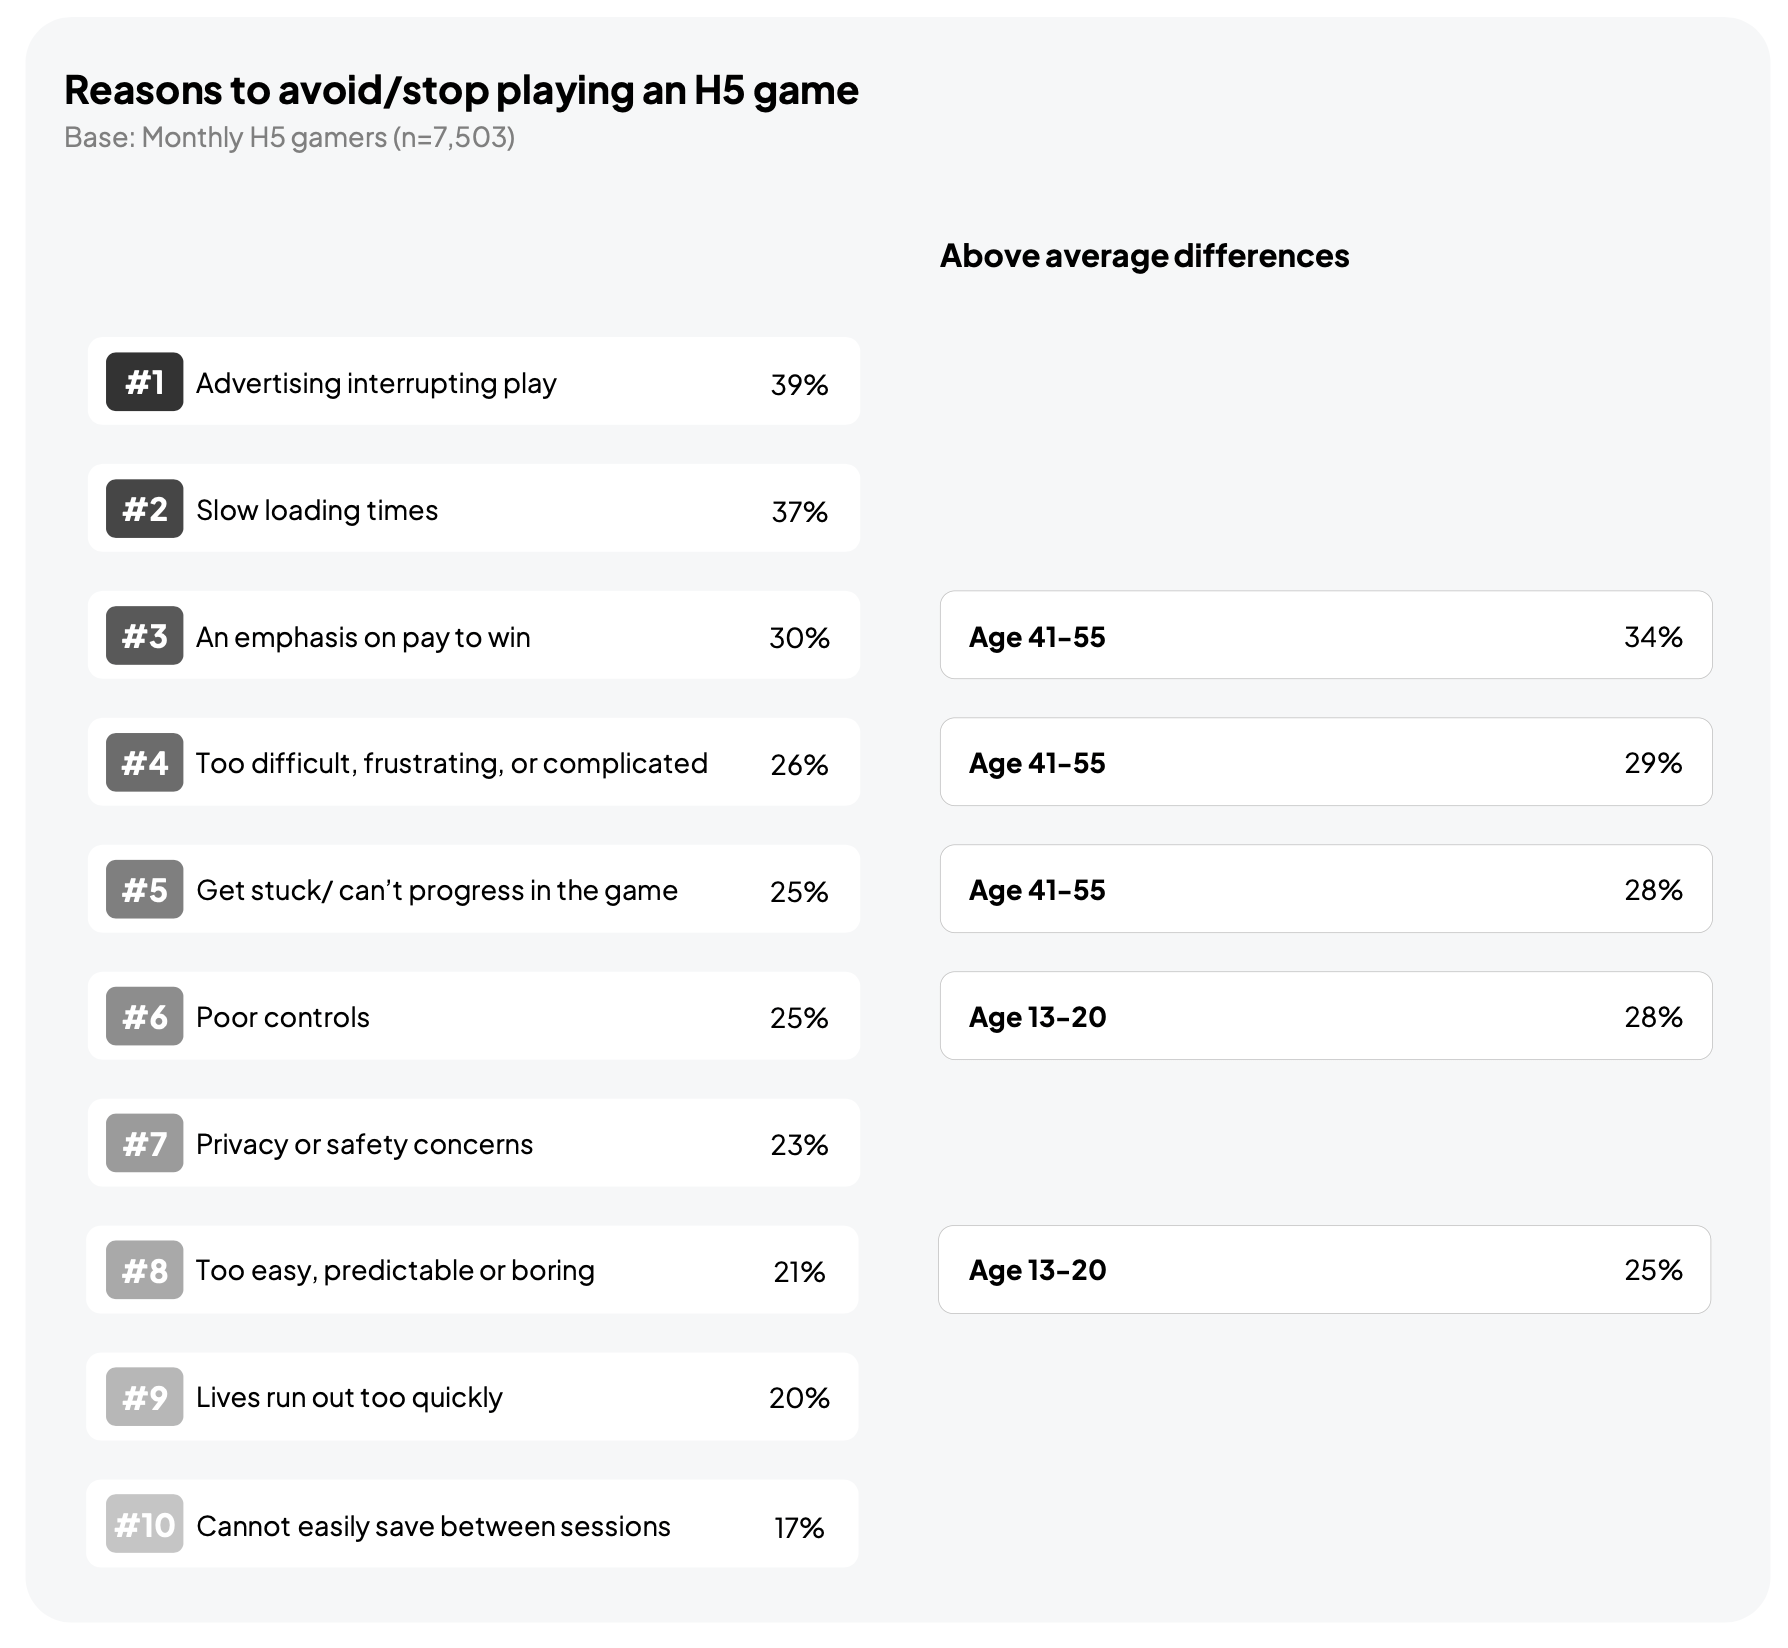
The most common reasons for quitting a browser game are ads that interrupt play (39%), slow loading (37%), and a focus on pay-to-win (30%).
Players aged 41-55 are more likely than others to quit over pay-to-win (34%), difficulty (29%), or getting stuck (28%). Players aged 13-20 quit over poor controls (28%) or when a game is too easy (25%).
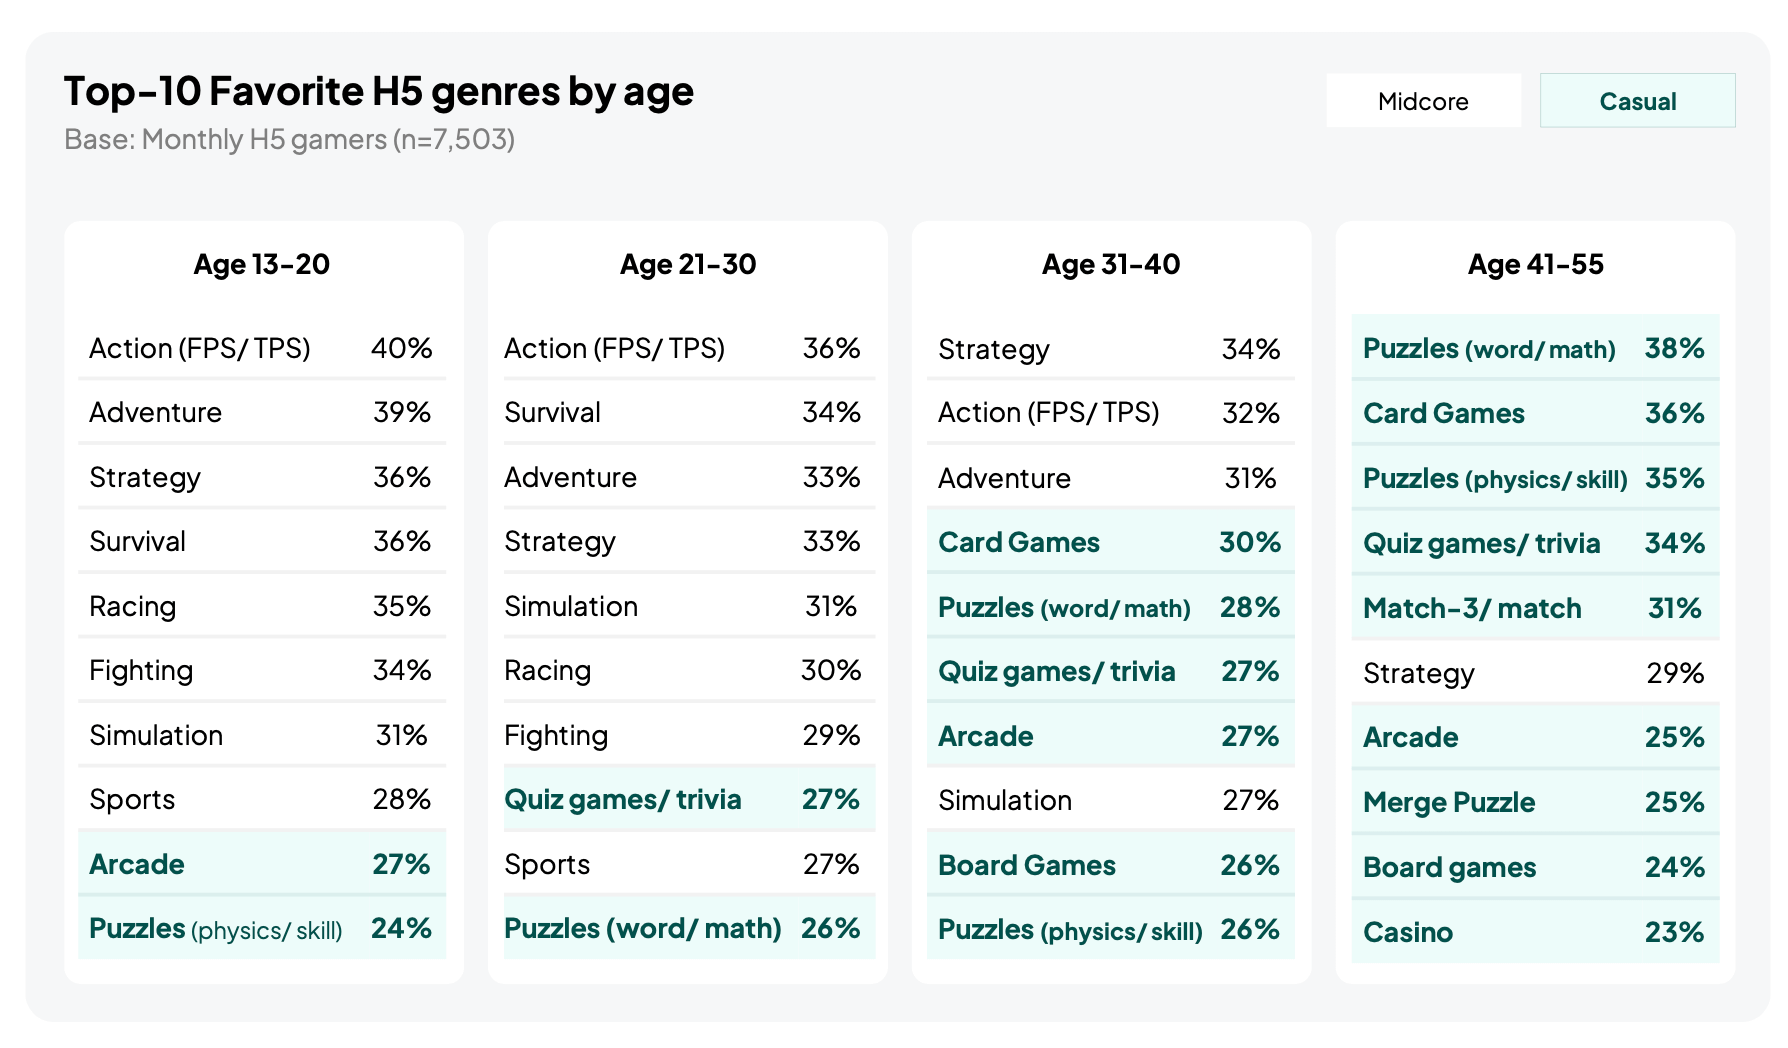
Younger players more often choose mid-core genres. In the 13-20 segment, action (FPS/TPS, 40%), adventure (39%), and strategy (36%) lead. In the 41-55 group, word and math puzzles (38%), card games (36%), and physics and skill puzzles (35%) lead.
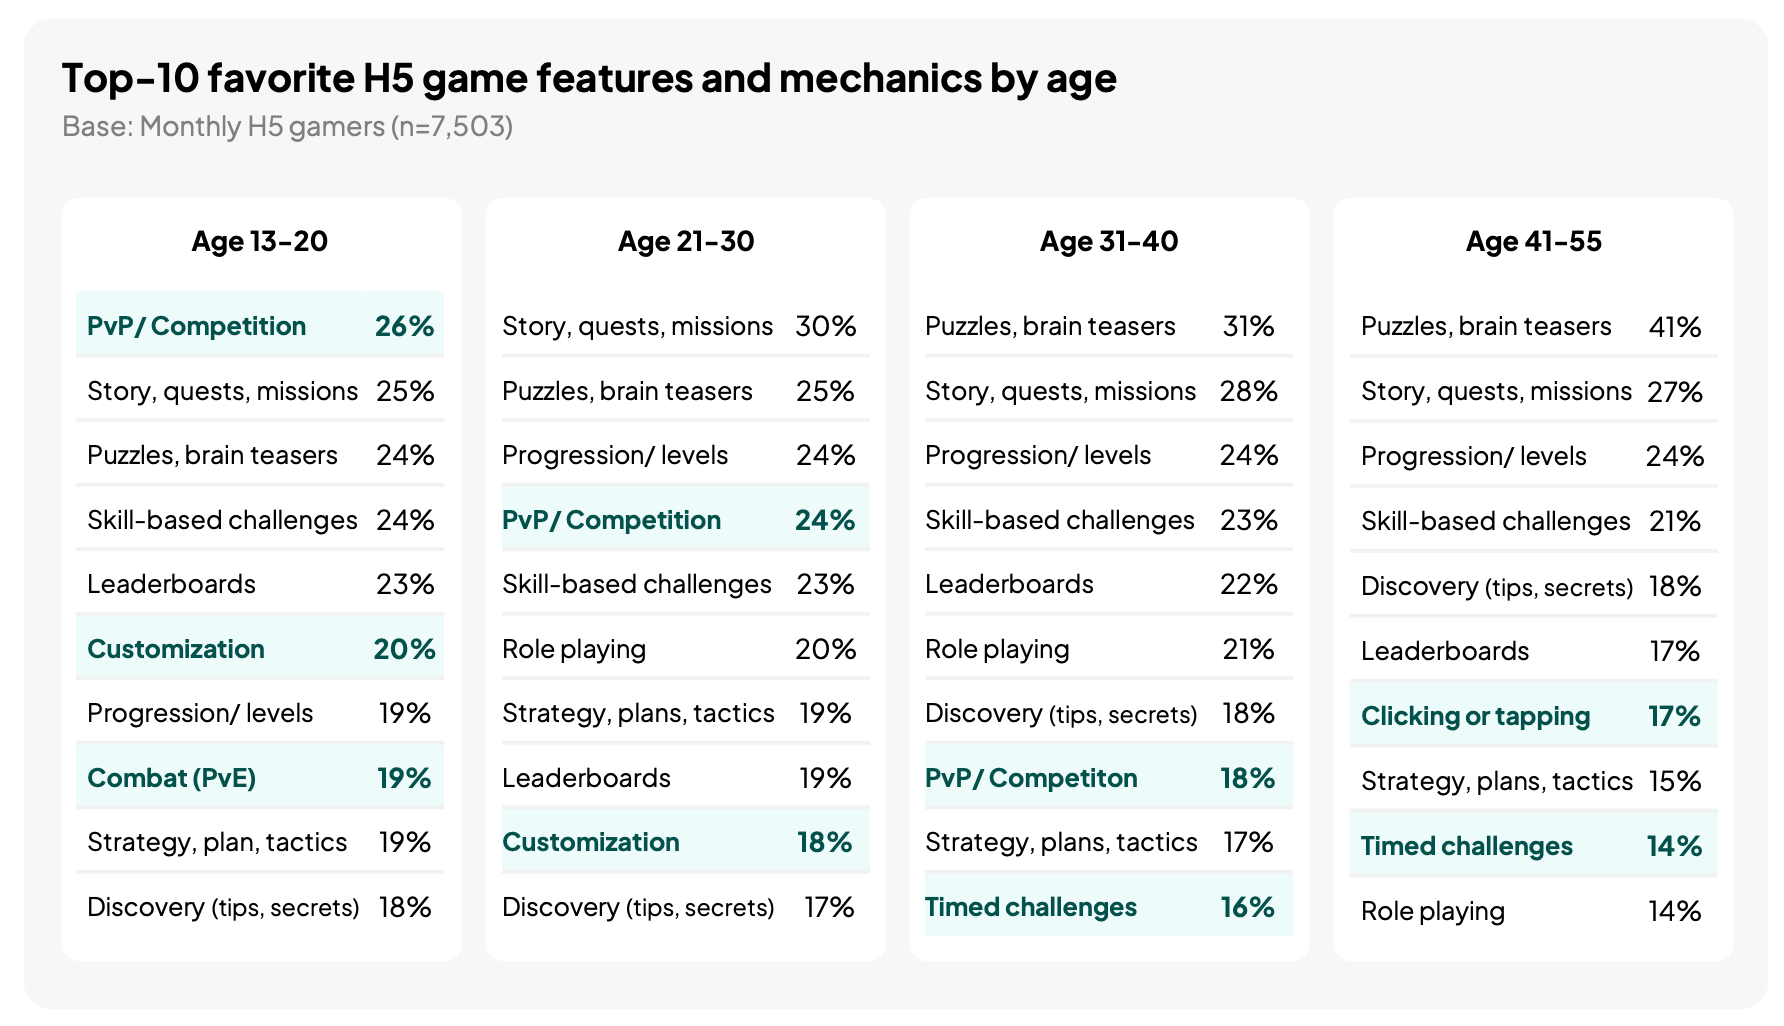
Across all ages, story and quests, brain teasers, and progression are among the top mechanics. Players aged 13-30 are more likely to pick PvP (26% in the 13-20 segment) and customization (20%). Players aged 41-55 pick clicking and tapping mechanics (17%) and timed challenges (14%).
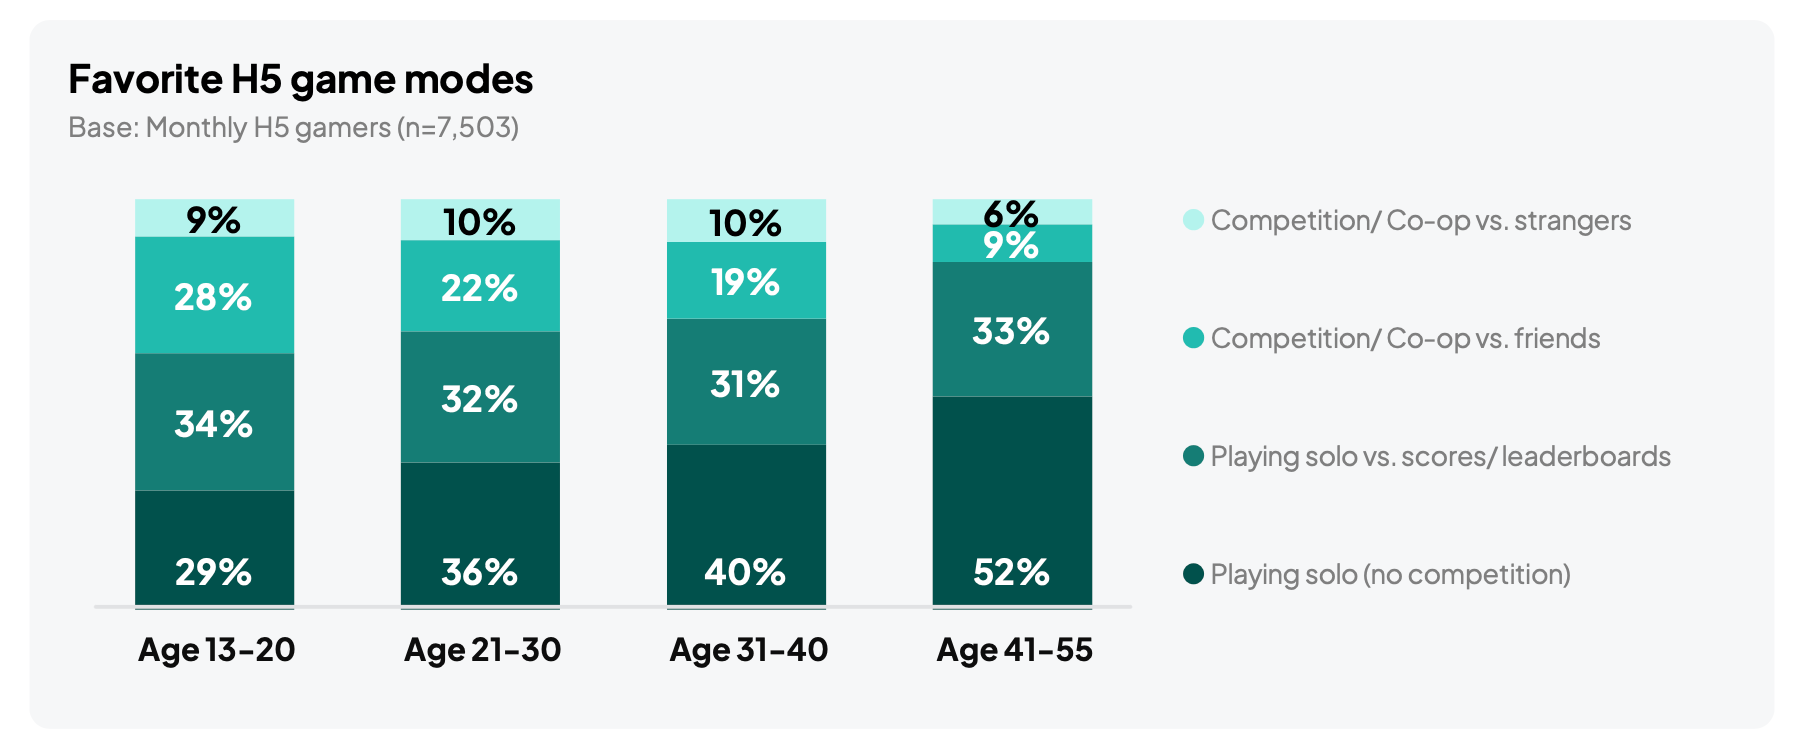
The older the player, the more likely they are to play solo. 52% of players aged 41-55 play without any competitive elements, compared with 29% of those aged 13-20.
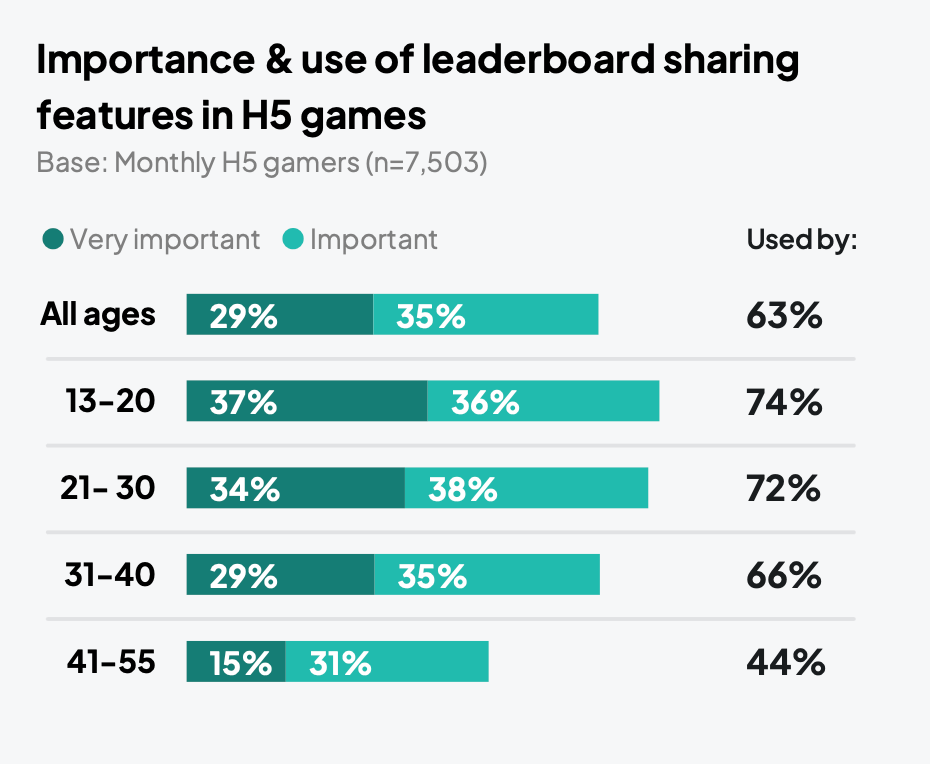
64% of players consider leaderboards and score sharing important, and 63% have used them. In the 13-20 segment, 74% have used them; in the 41-55 group, 44%.
Portals and Gaming Sites
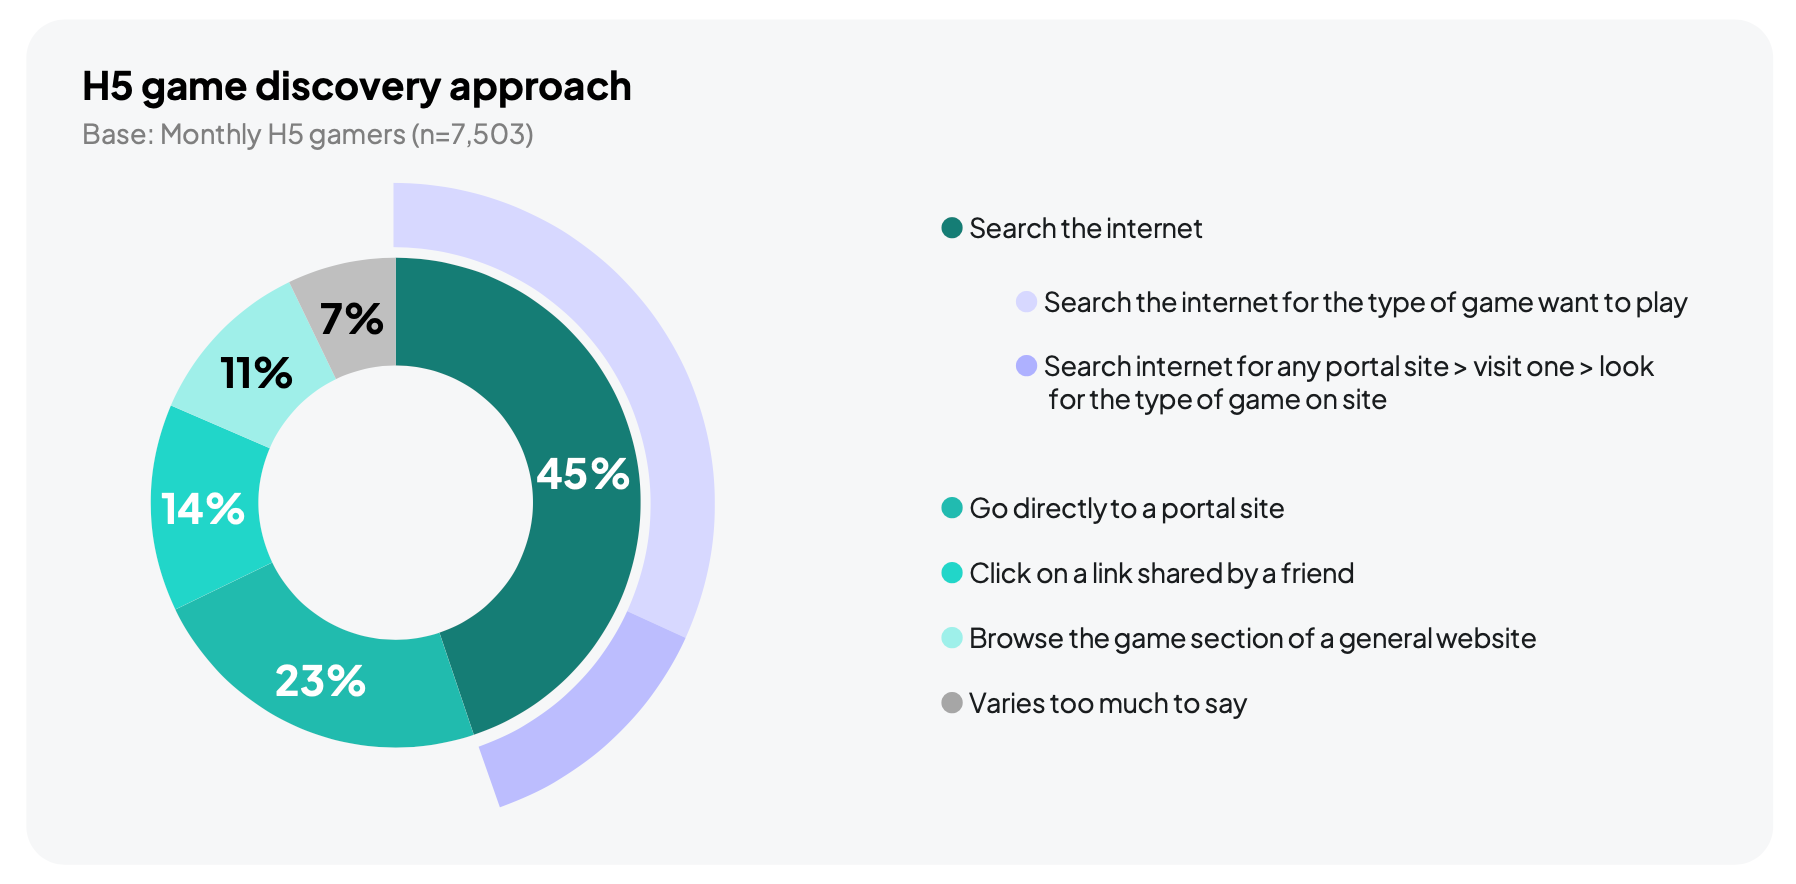
Only 23% of players go directly to a site they already know. 45% start with a search engine, and most of them (about 70%) search for a specific type of game. For comparison, Sensor Tower reports that direct and organic traffic accounts for 94.1% of visits to poki.com and 93.3% to crazygames.com.
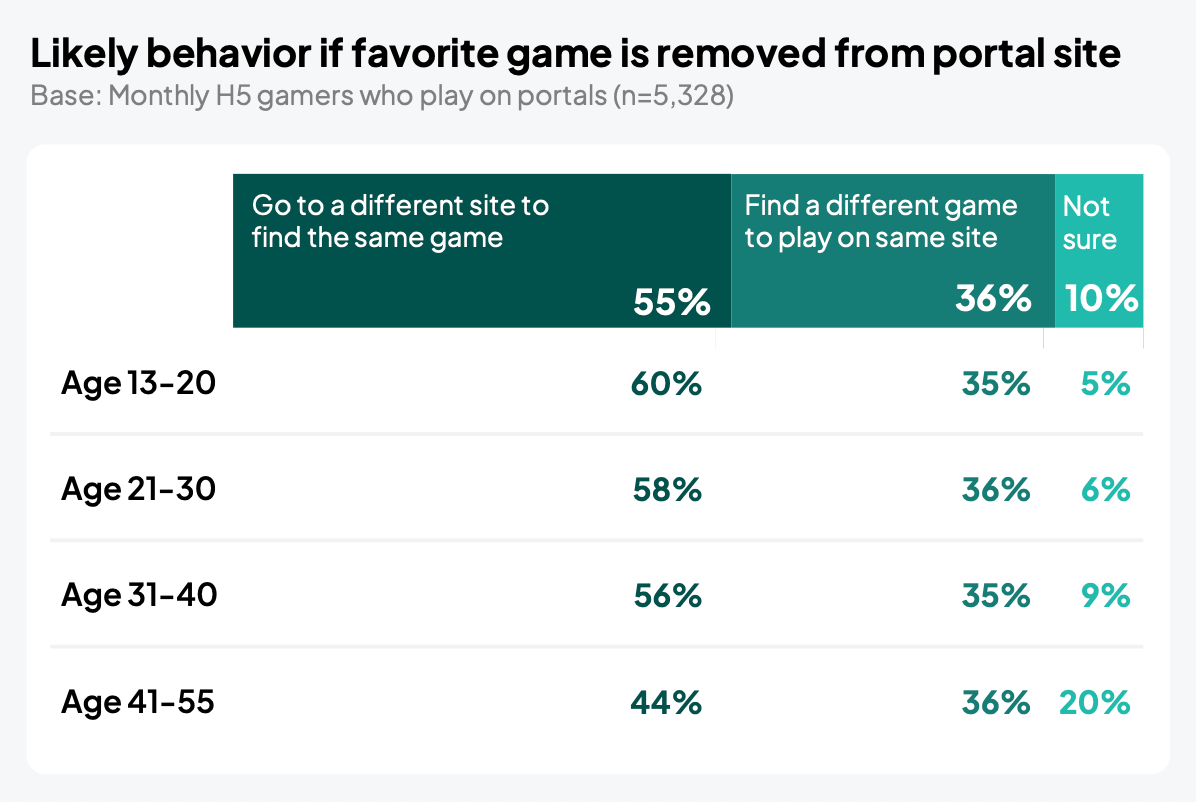
If their favorite game were removed from a site, 55% of players would look for it elsewhere. Another 36% would find a different game on the same portal. Younger players are even less loyal: in the 13-20 segment, 60% would leave.
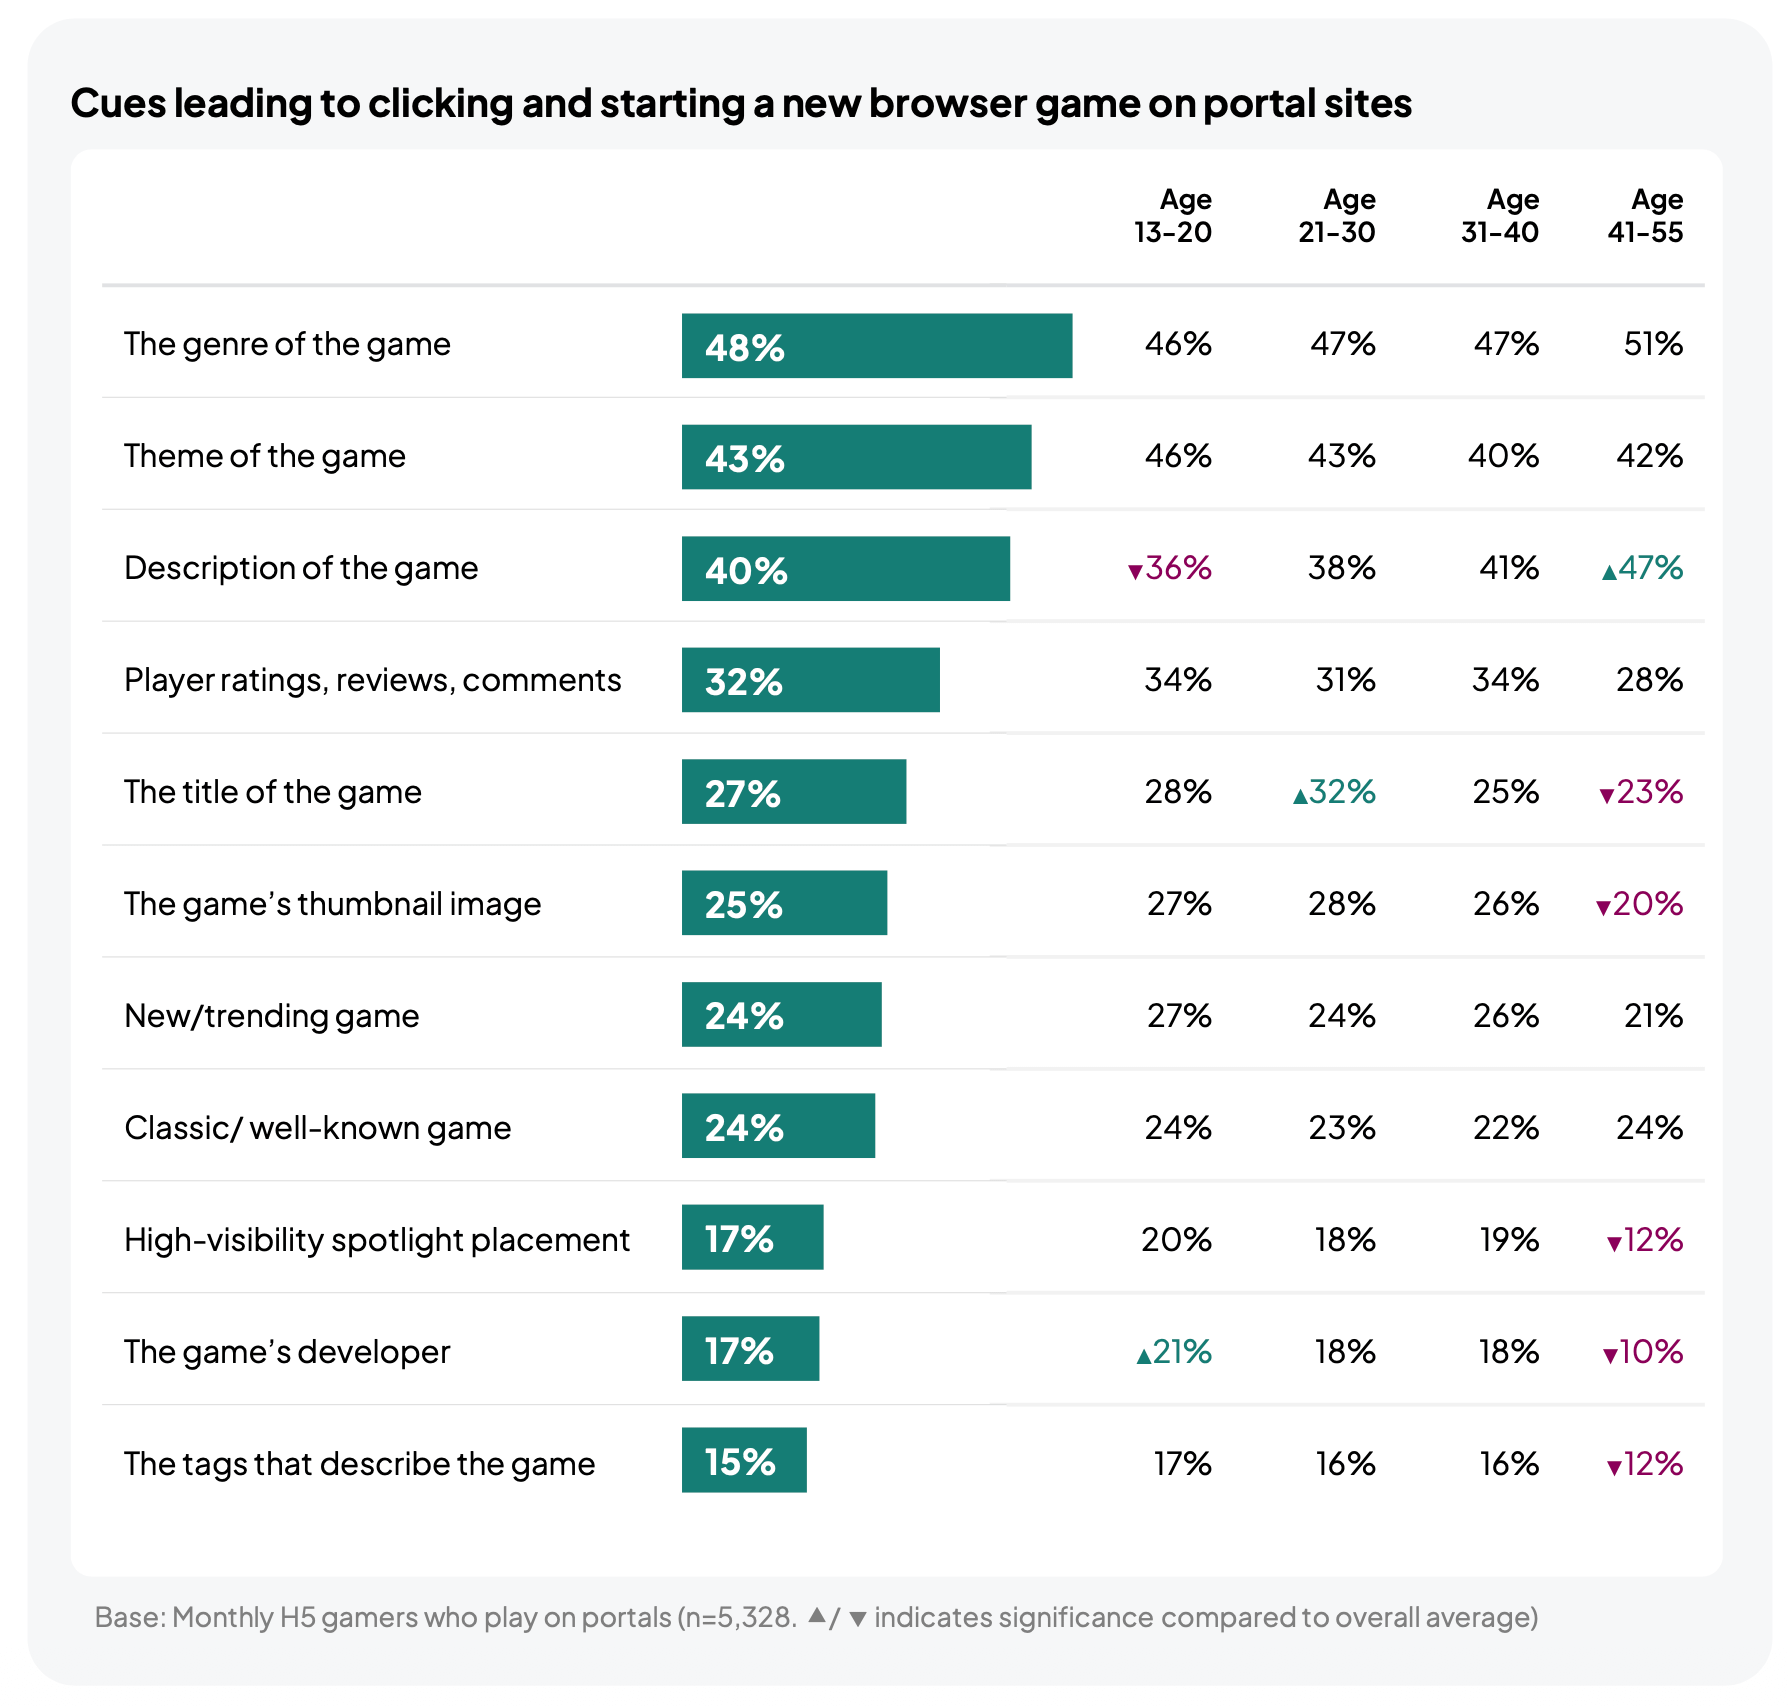
When choosing a game on a portal, players look first at the genre (48%), theme (43%), and description (40%). The title (27%) and thumbnail (25%) matter less. Promo placements and the developer’s name matter to only 17% of players.
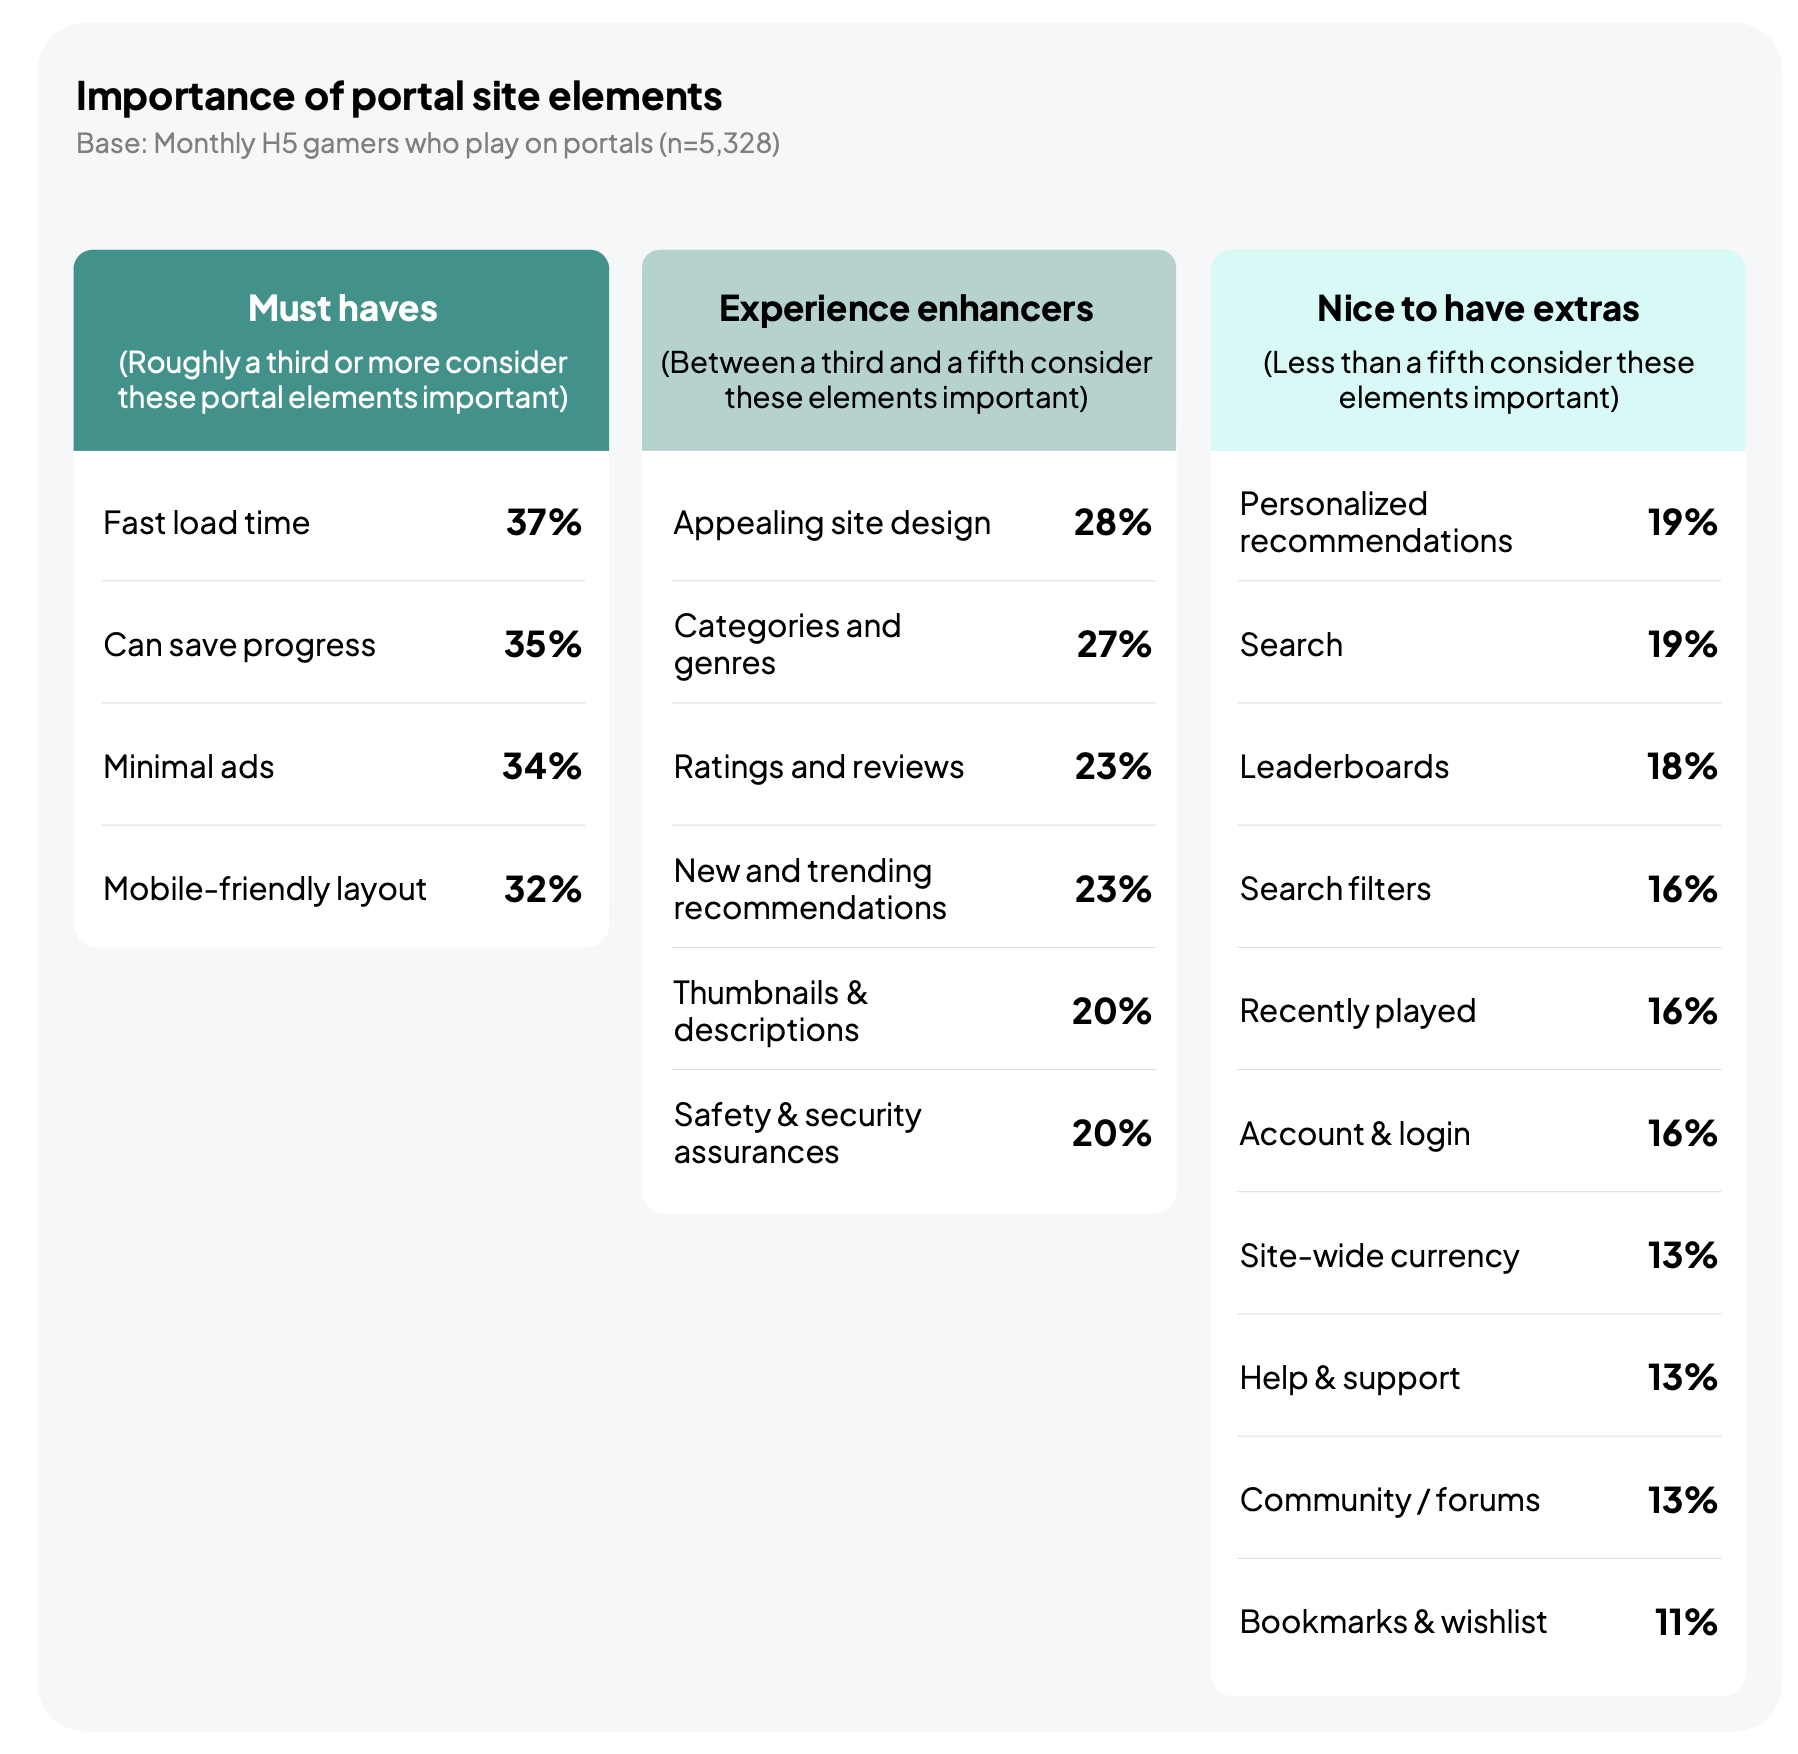
Players value fast loading (37%), the ability to save progress (35%), minimal ads (34%), and a mobile-friendly layout (32%) most on gaming sites. Search (19%), leaderboards (18%), and wishlists (11%) matter to far fewer players.
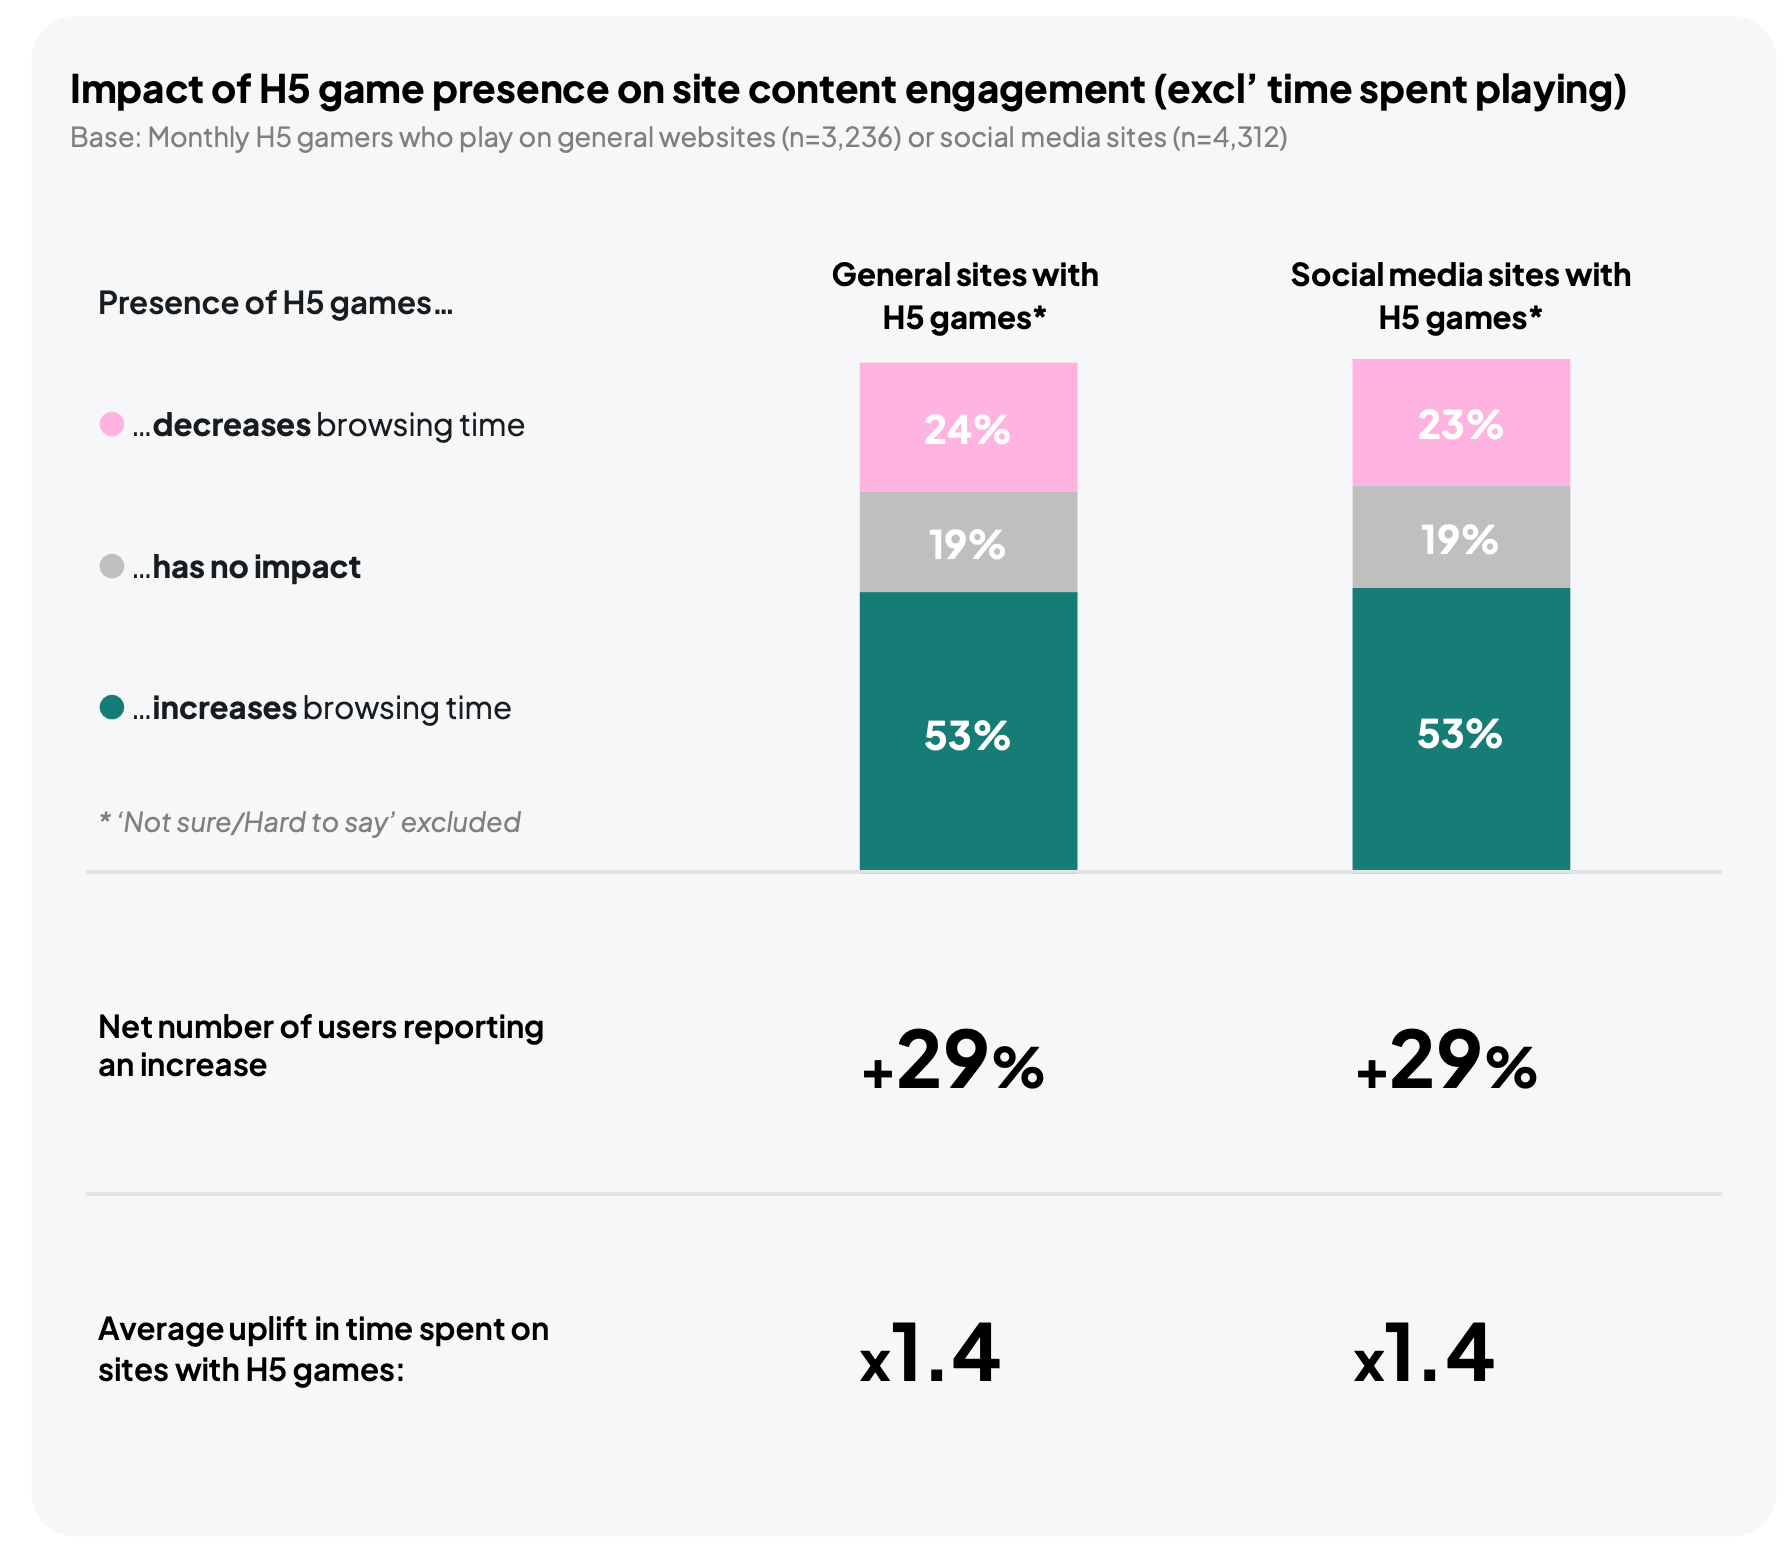
53% of players say browser games on regular websites and social media increase the time they spend on the site itself (excluding the game). 23-24% say they decrease it.
For those whose time increases, it goes up 1.4x on average. By the players’ own estimate, a 10-minute visit turns into 14 minutes.
❗️People are usually very bad at judging how much time they spend on a task. Metrics like this are better measured objectively than through a survey.
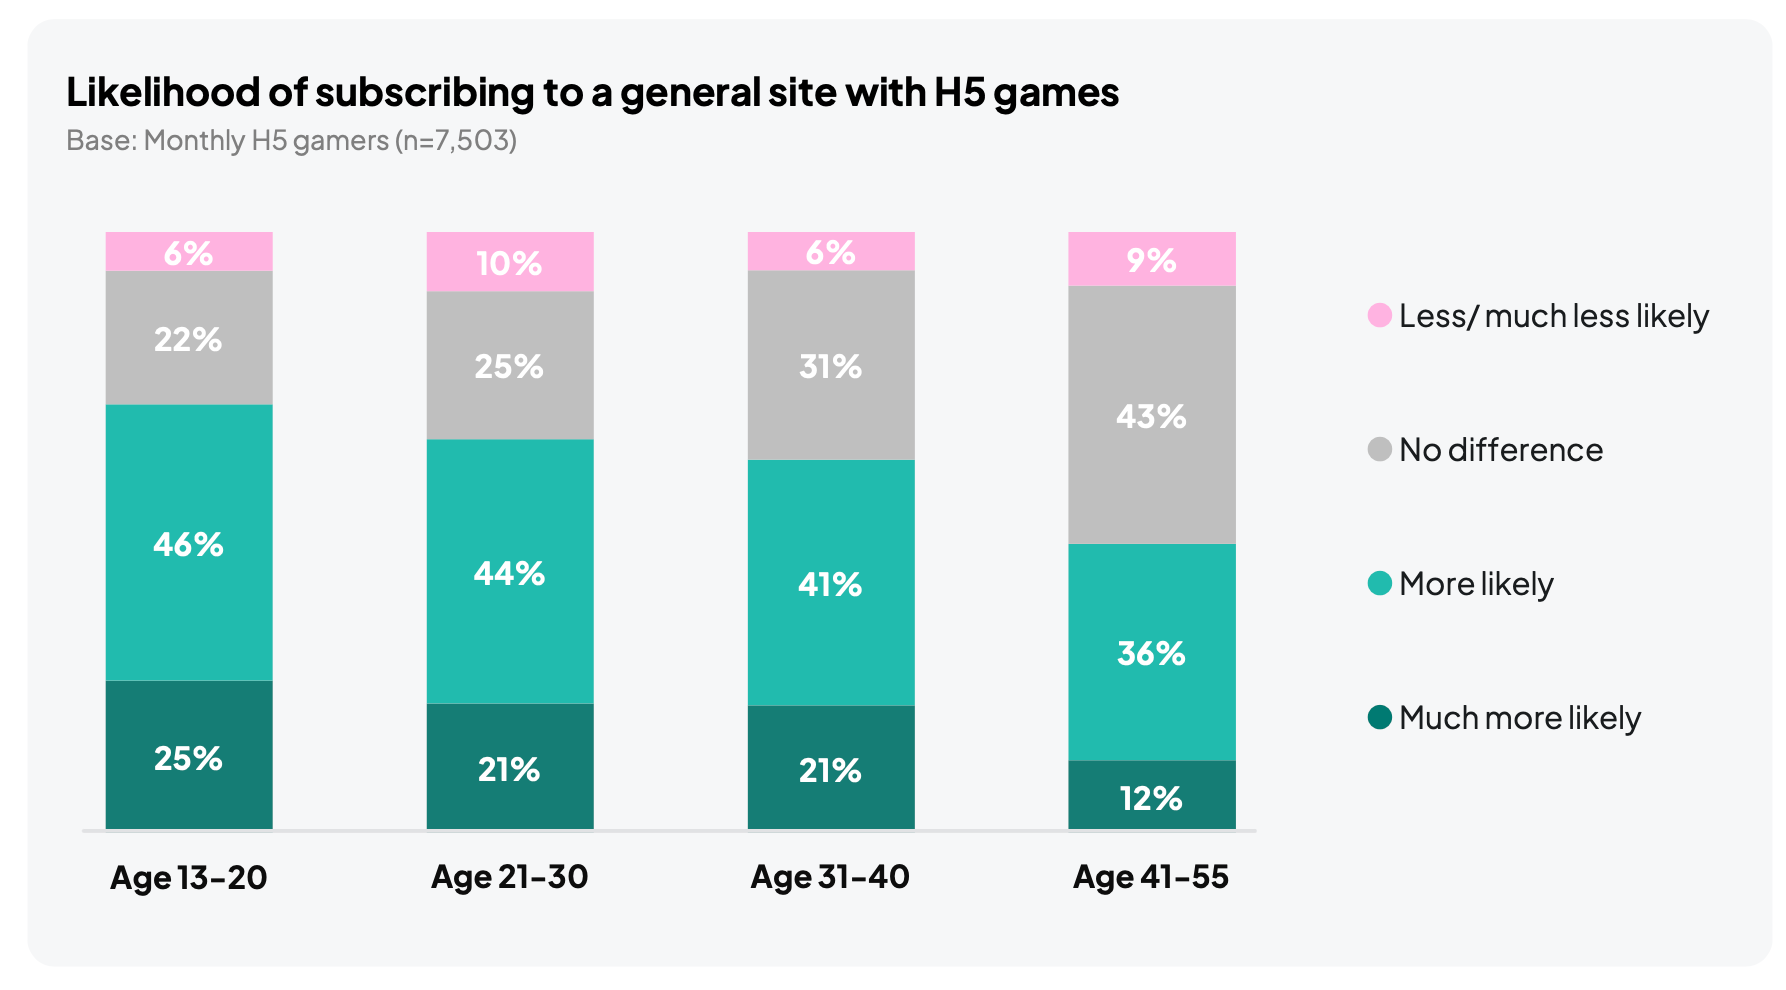
Players are more willing to subscribe to sites that have browser games. In the 13-20 segment, 71% of players said so; in the 41-55 segment, 48%.
A word from our sponsor
Need a freelance 3D artist, composer, or QA tester fast? Mellow’s AI Scout finds qualified talent in under 48 hours — free to try, no commitment. Describe the role, get a shortlist, hire when you’re ready.
Monetization and Advertising
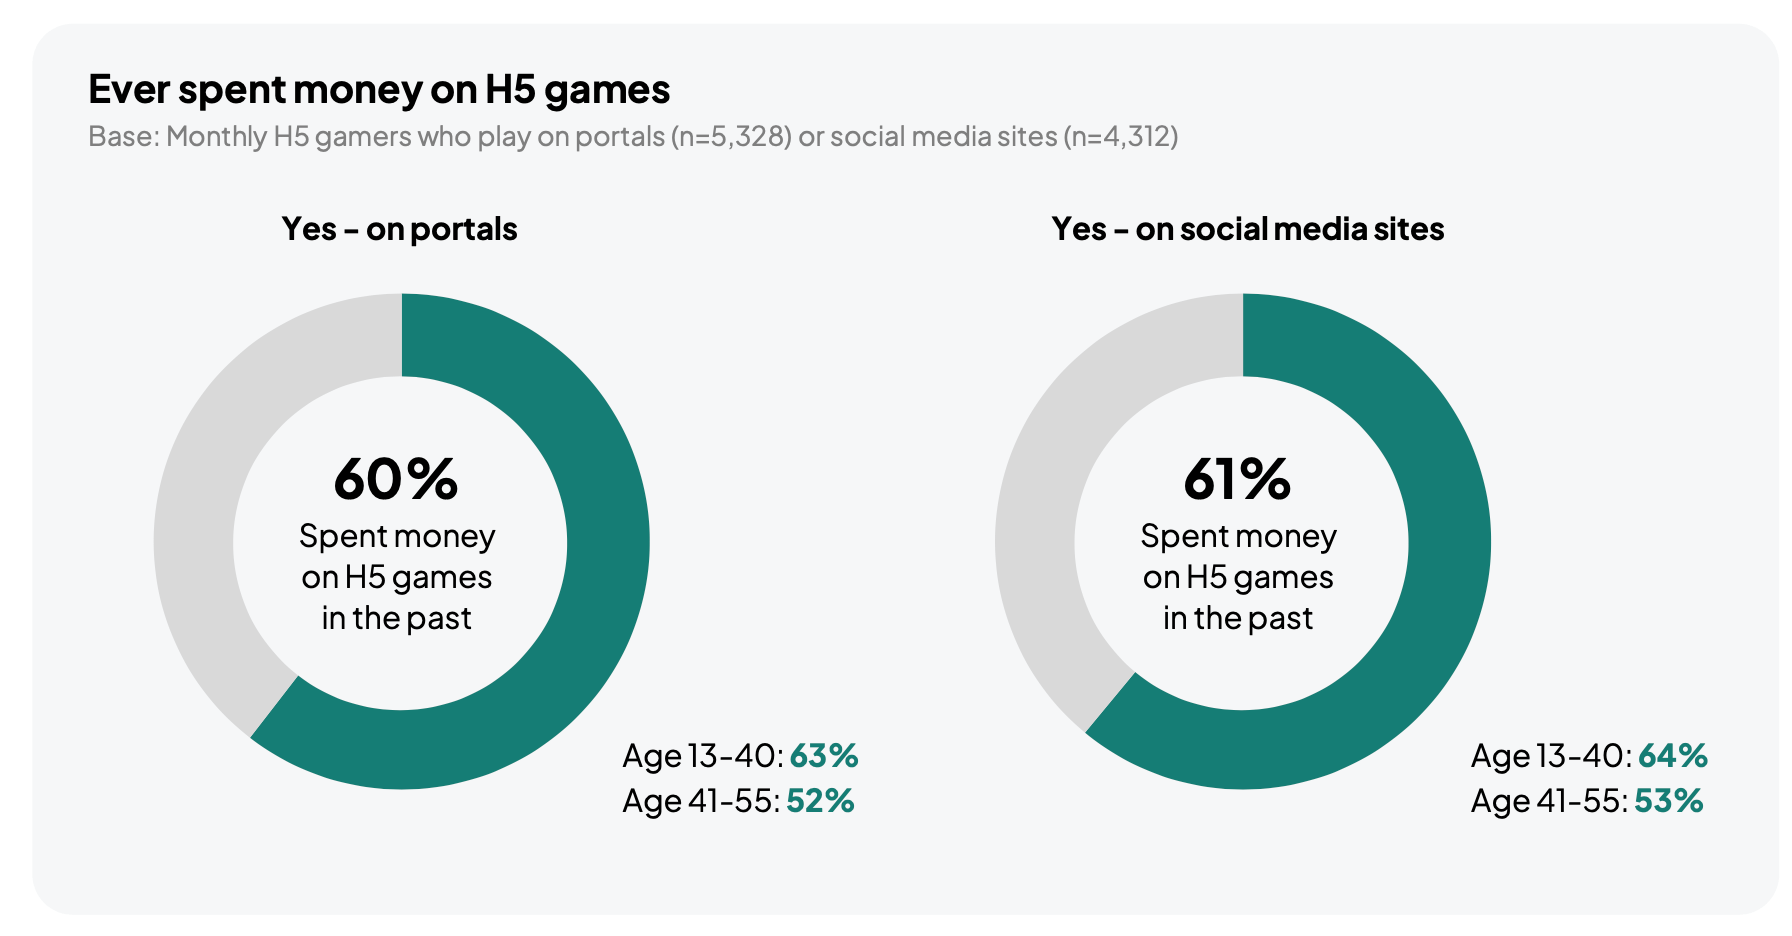
60% of surveyed players on gaming portals and 61% of players on social media have spent money on browser games at least once. In the 41-55 segment, the shares are lower (52% and 53%).
❗️This is the share of those who have ever paid in H5 games, not the monthly share of paying users.
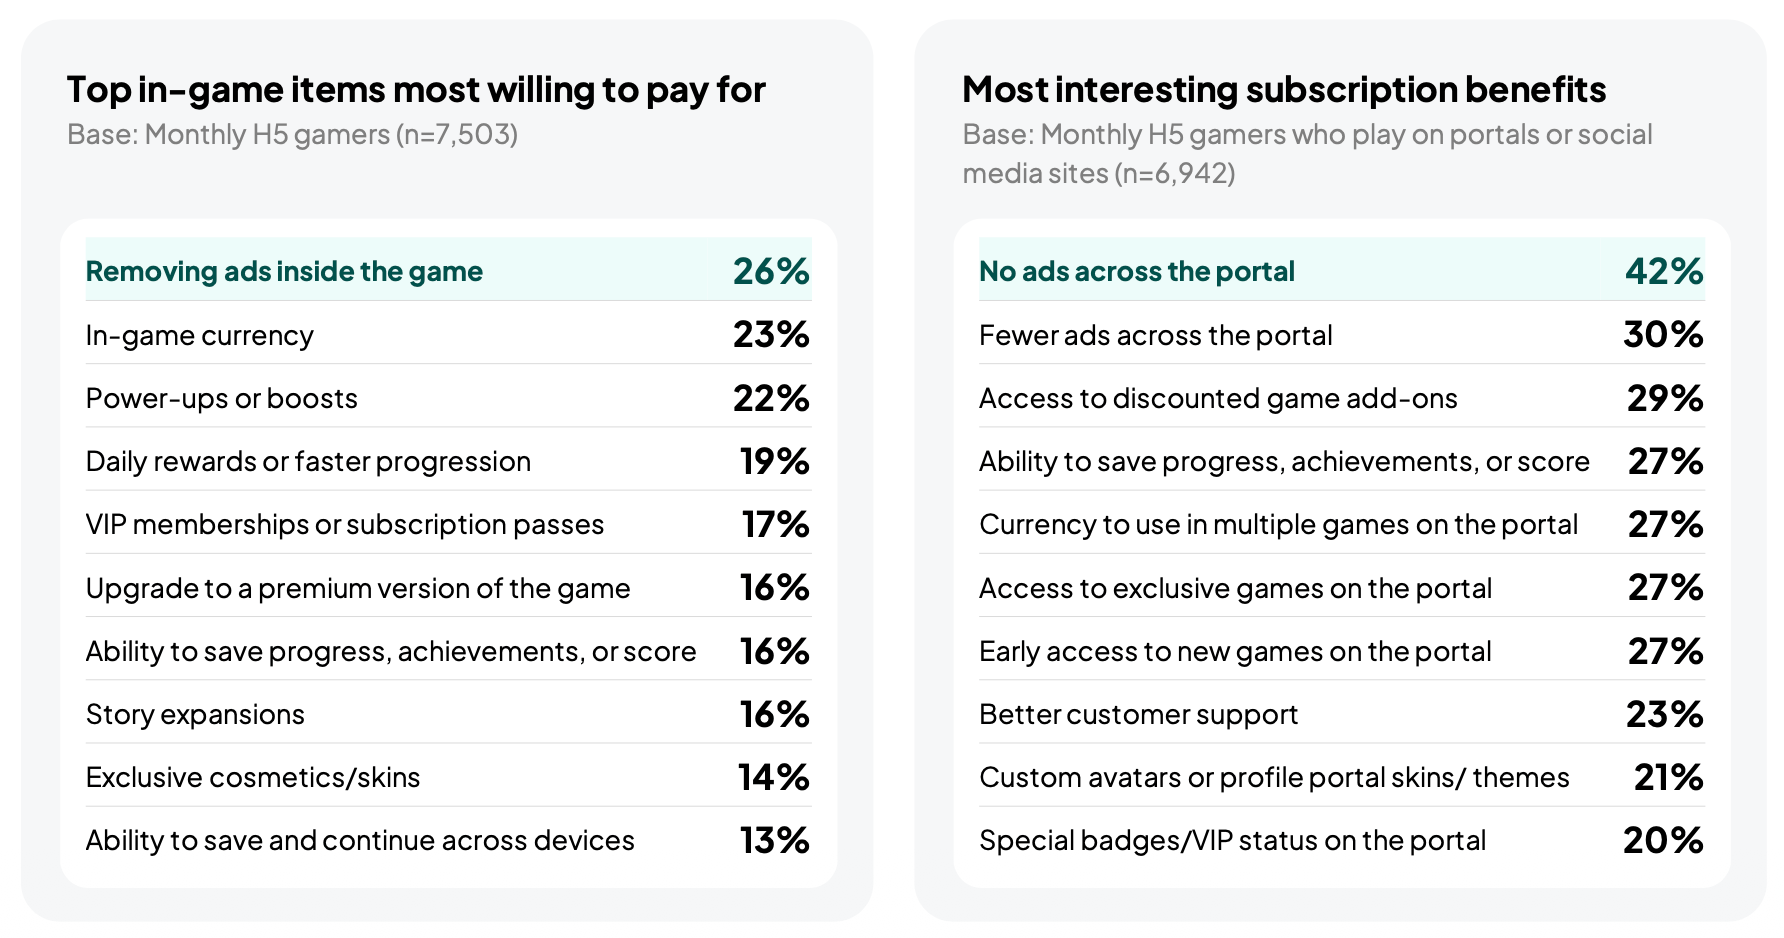
In-game, players are most willing to pay to remove ads (26%), for in-game currency (23%), and for boosts (22%). Story expansions (16%) and skins (14%) are of less interest.
In a gaming portal subscription, players value no ads across the whole portal most (42%), followed by fewer ads (30%) and discounts on game add-ons (29%).
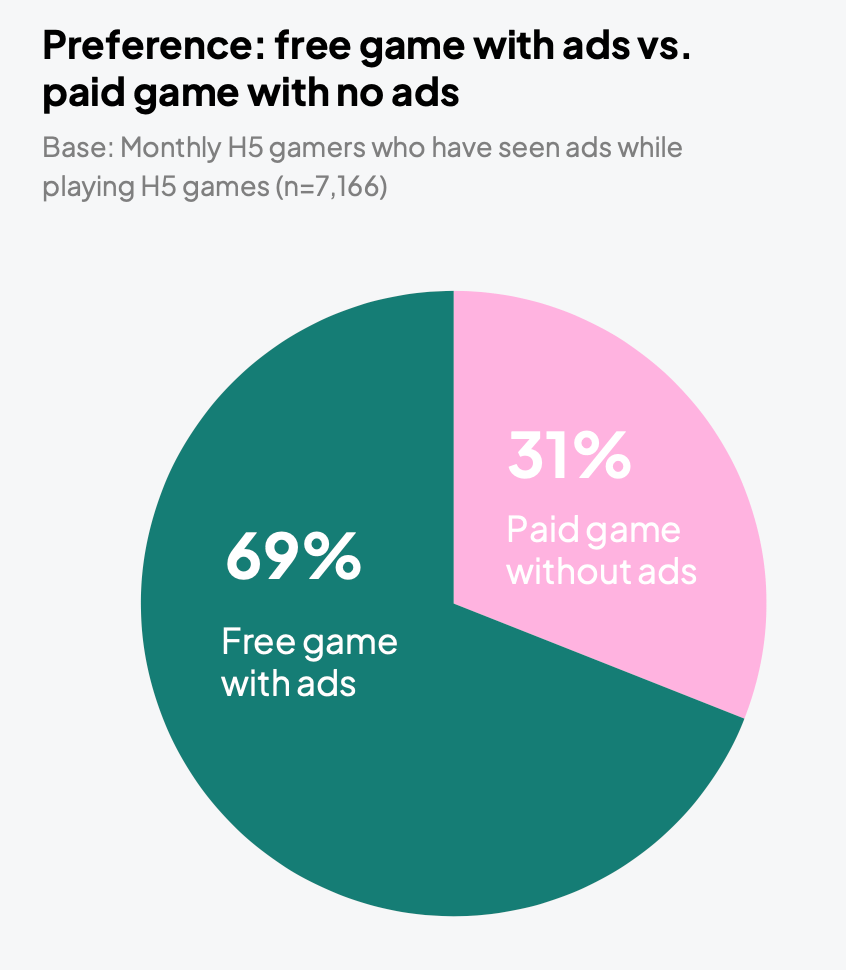
94% of players have seen ads in browser games. 69% of them would choose a free game with ads over a paid game without them. In the 41-55 segment, it is 80%. The share is lowest in India (59%) and Brazil (61%).
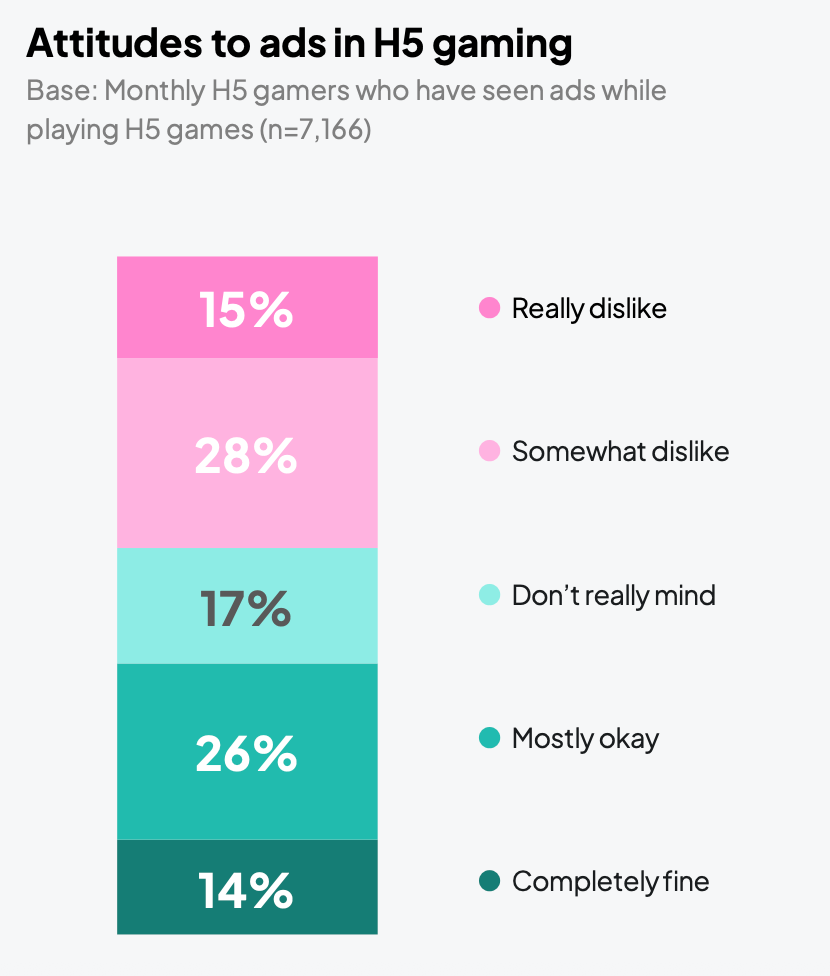
40% of players are generally fine with ads in H5 games, and another 17% don’t really mind. 43% dislike ads, and 15% dislike them strongly.
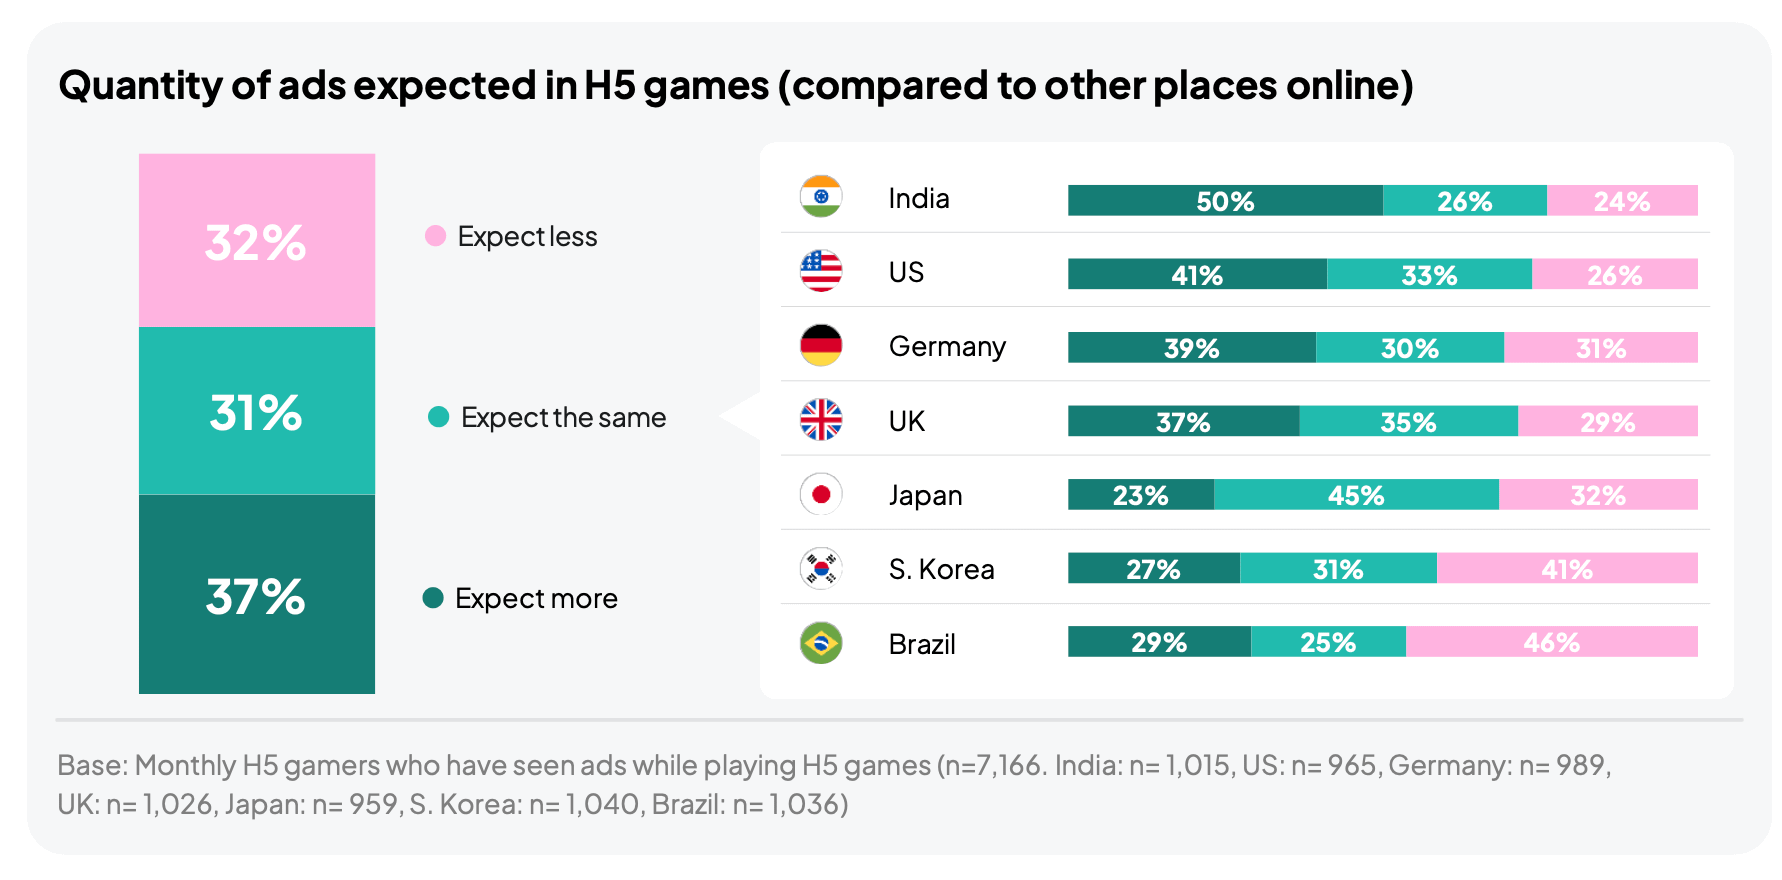
37% of players expect more ads in browser games than elsewhere online, 31% expect the same amount, and 32% expect fewer. Players in India (50%), the US (41%), and Germany (39%) expect the most ads. In Brazil, by contrast, players more often expect fewer ads (46%).
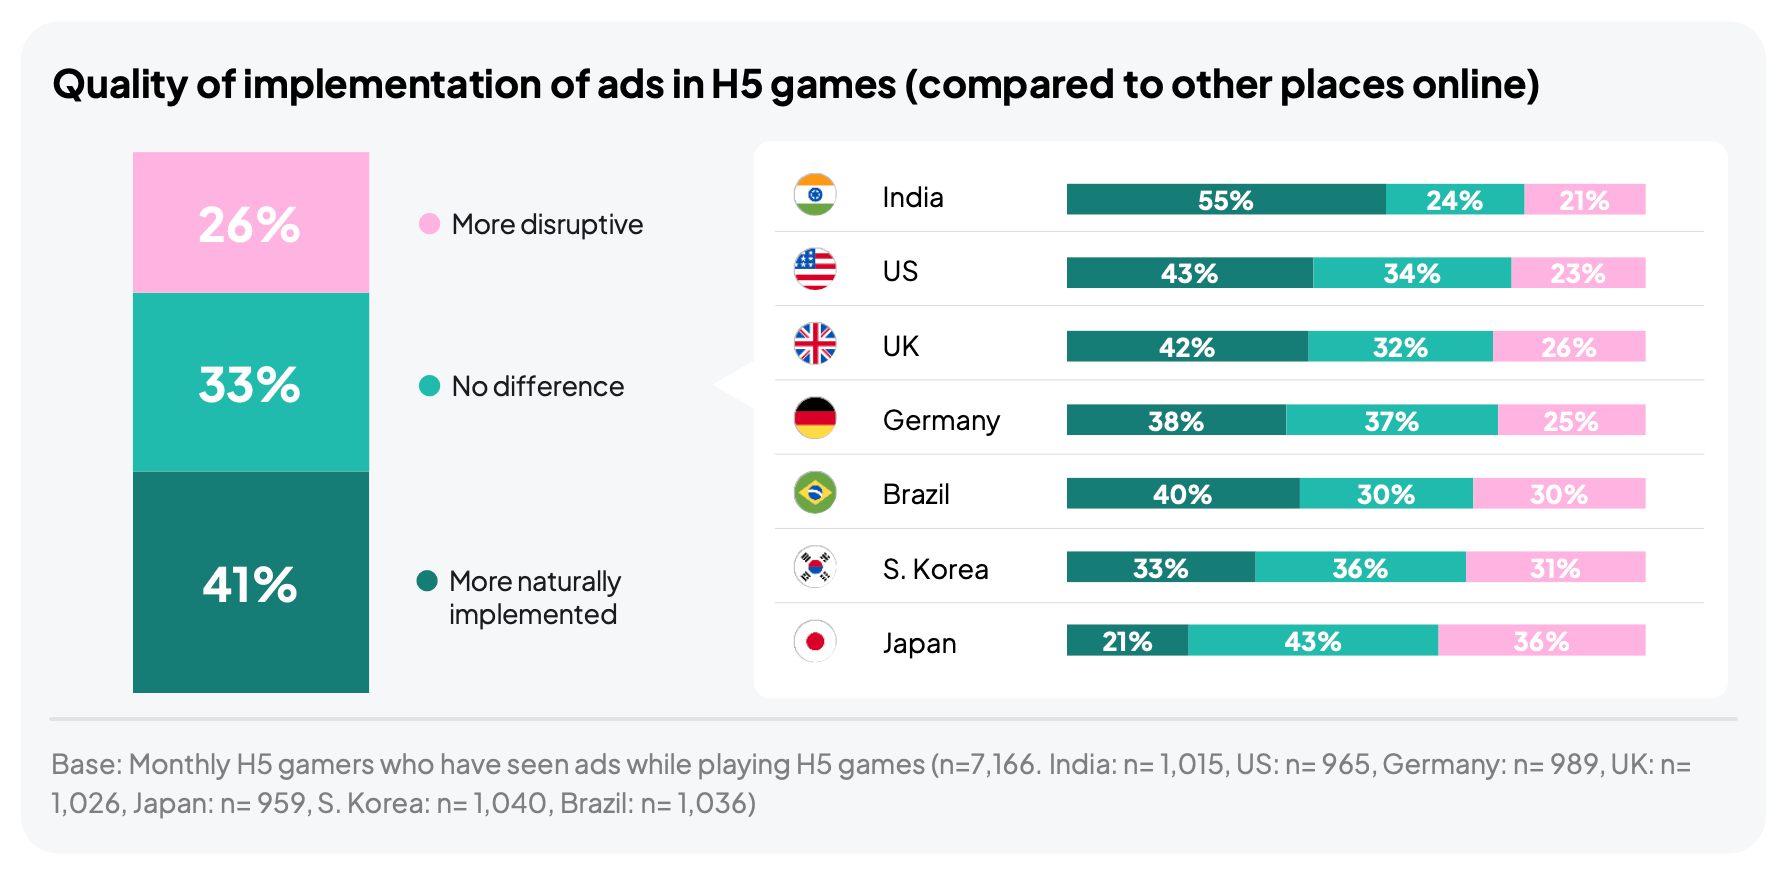
41% of players think ads in H5 games are more naturally implemented than elsewhere online. 26% think they are more disruptive. Attitudes are worst in Japan (21% vs. 36%).
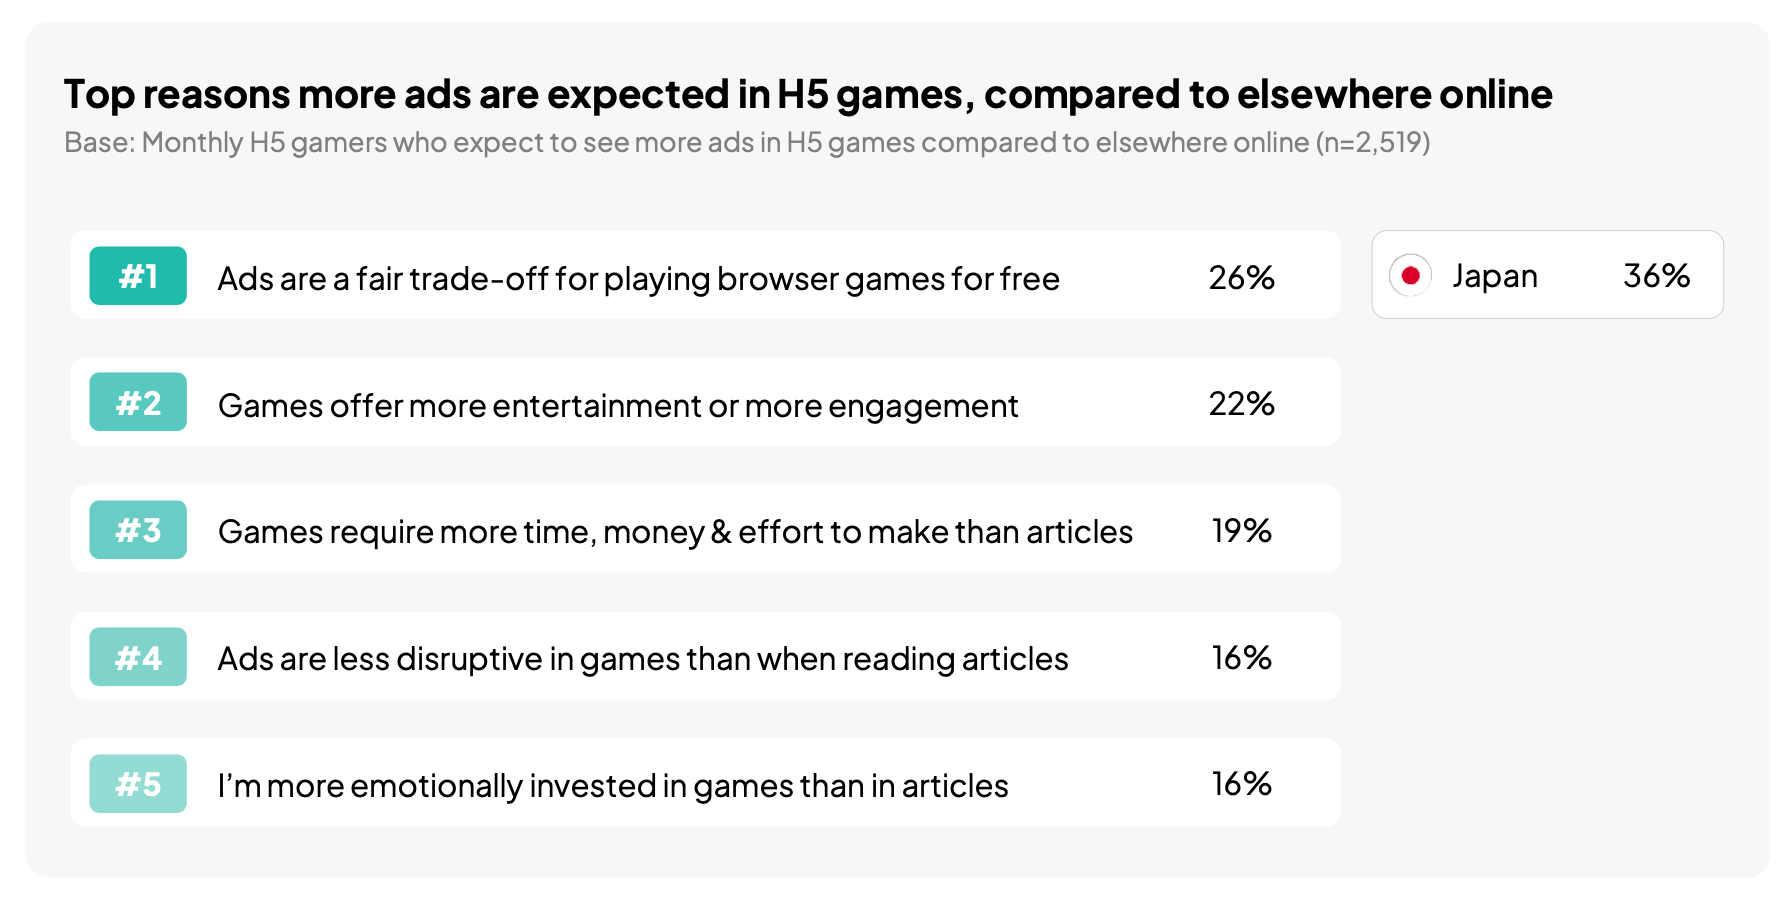
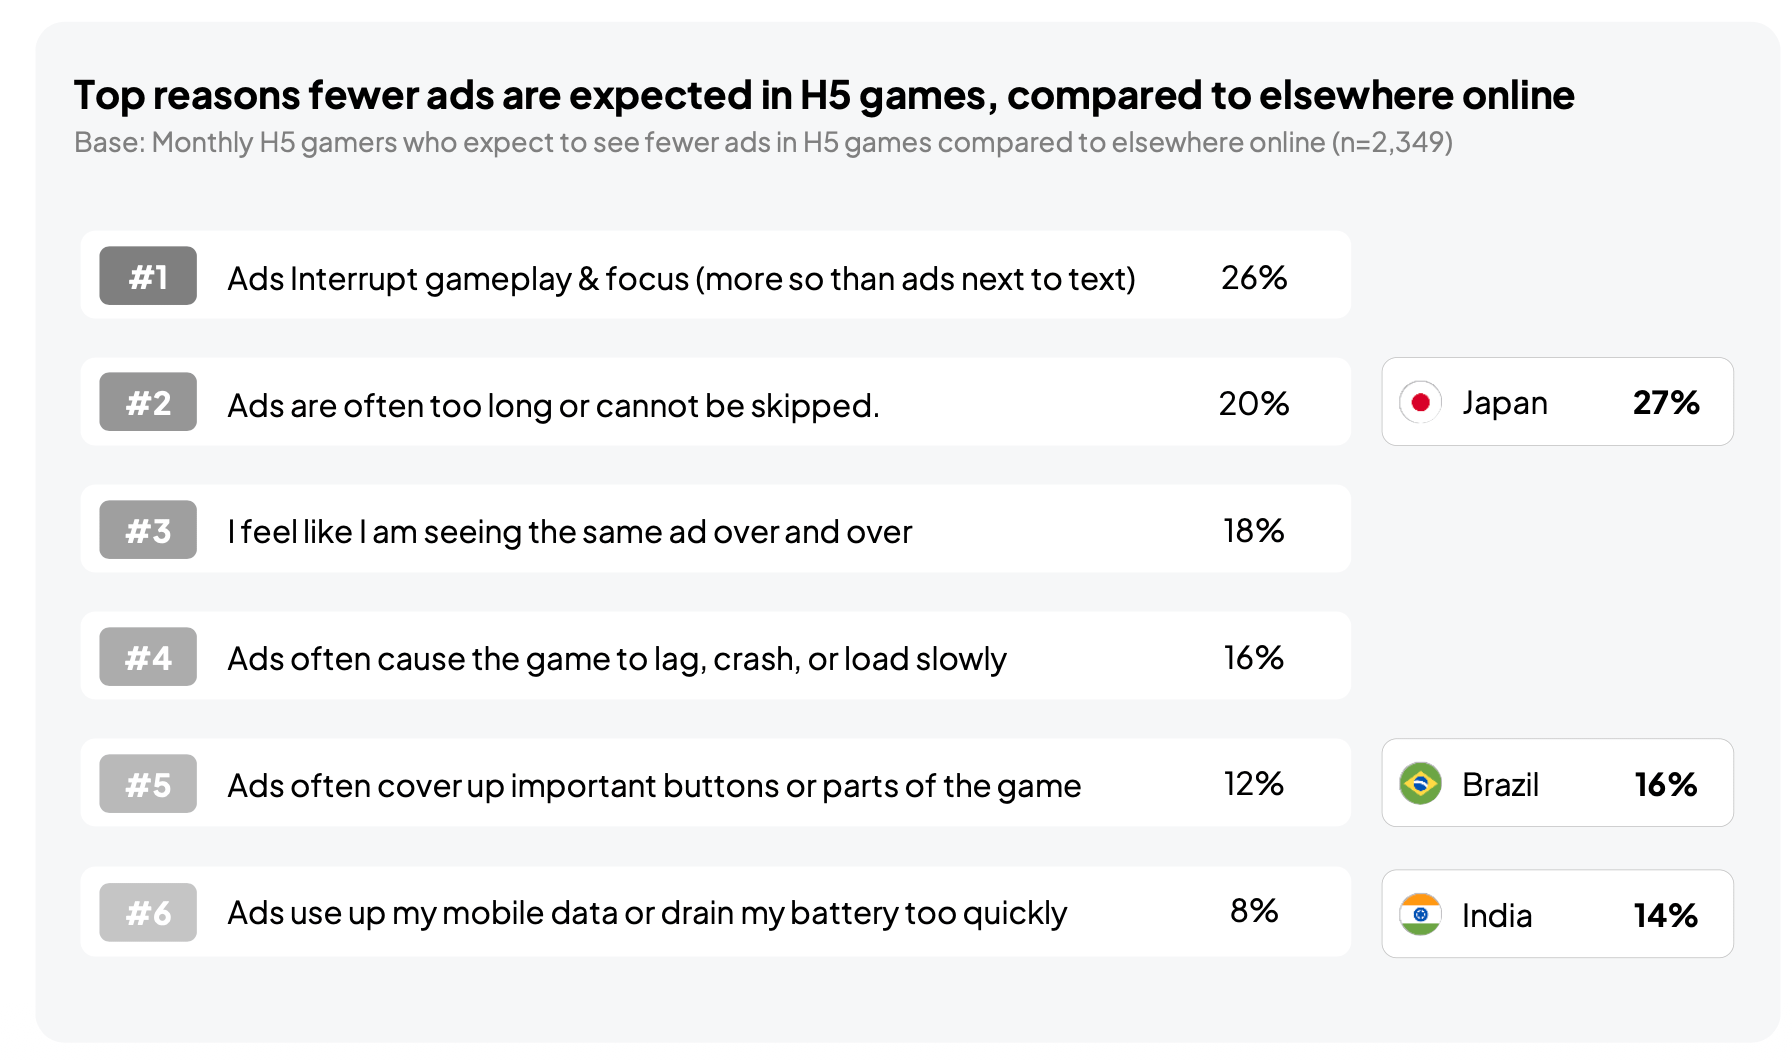
The main reason players accept more ads in games is that they see it as a fair price for a free game (26%, and 36% in Japan). The main reason for the opposite view is that ads in games are more disruptive than while reading an article (26%).
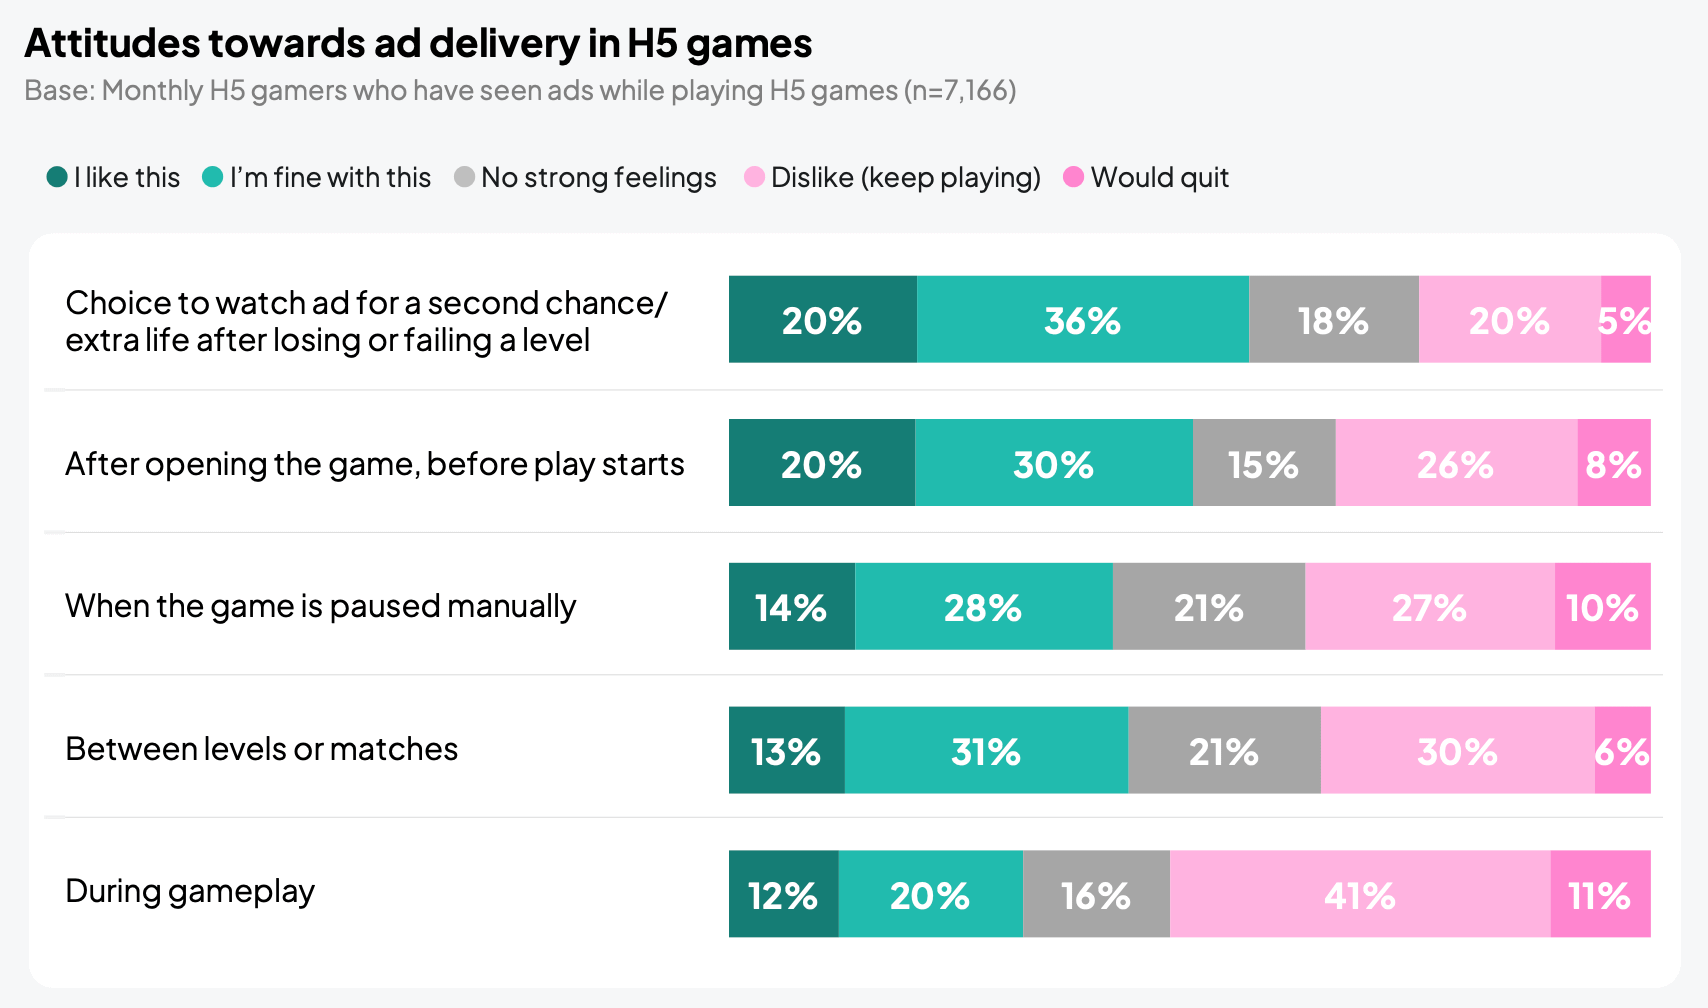
Ads offering a second life after losing are received best: 56% of players like them or are fine with them. Ads during gameplay are received worst: 41% of players dislike them, and another 11% would quit the game because of them.
Among the formats shown in the survey as videos, 49% of players liked rewarded ads and 34% liked banners.
Omdia & FastSpring: D2C Game Monetization in 2026
Omdia and FastSpring surveyed 110 senior executives at game companies in the US and Europe in April-June 2026. Hybrid casual (38%) and midcore (34%) projects make up the largest share of the sample.
❗️All companies in the sample make games for iOS and Android; 91% of them have annual revenue above $10 million, and 92% have more than 100 employees. Keep this in mind when interpreting the answers.
D2C Adoption
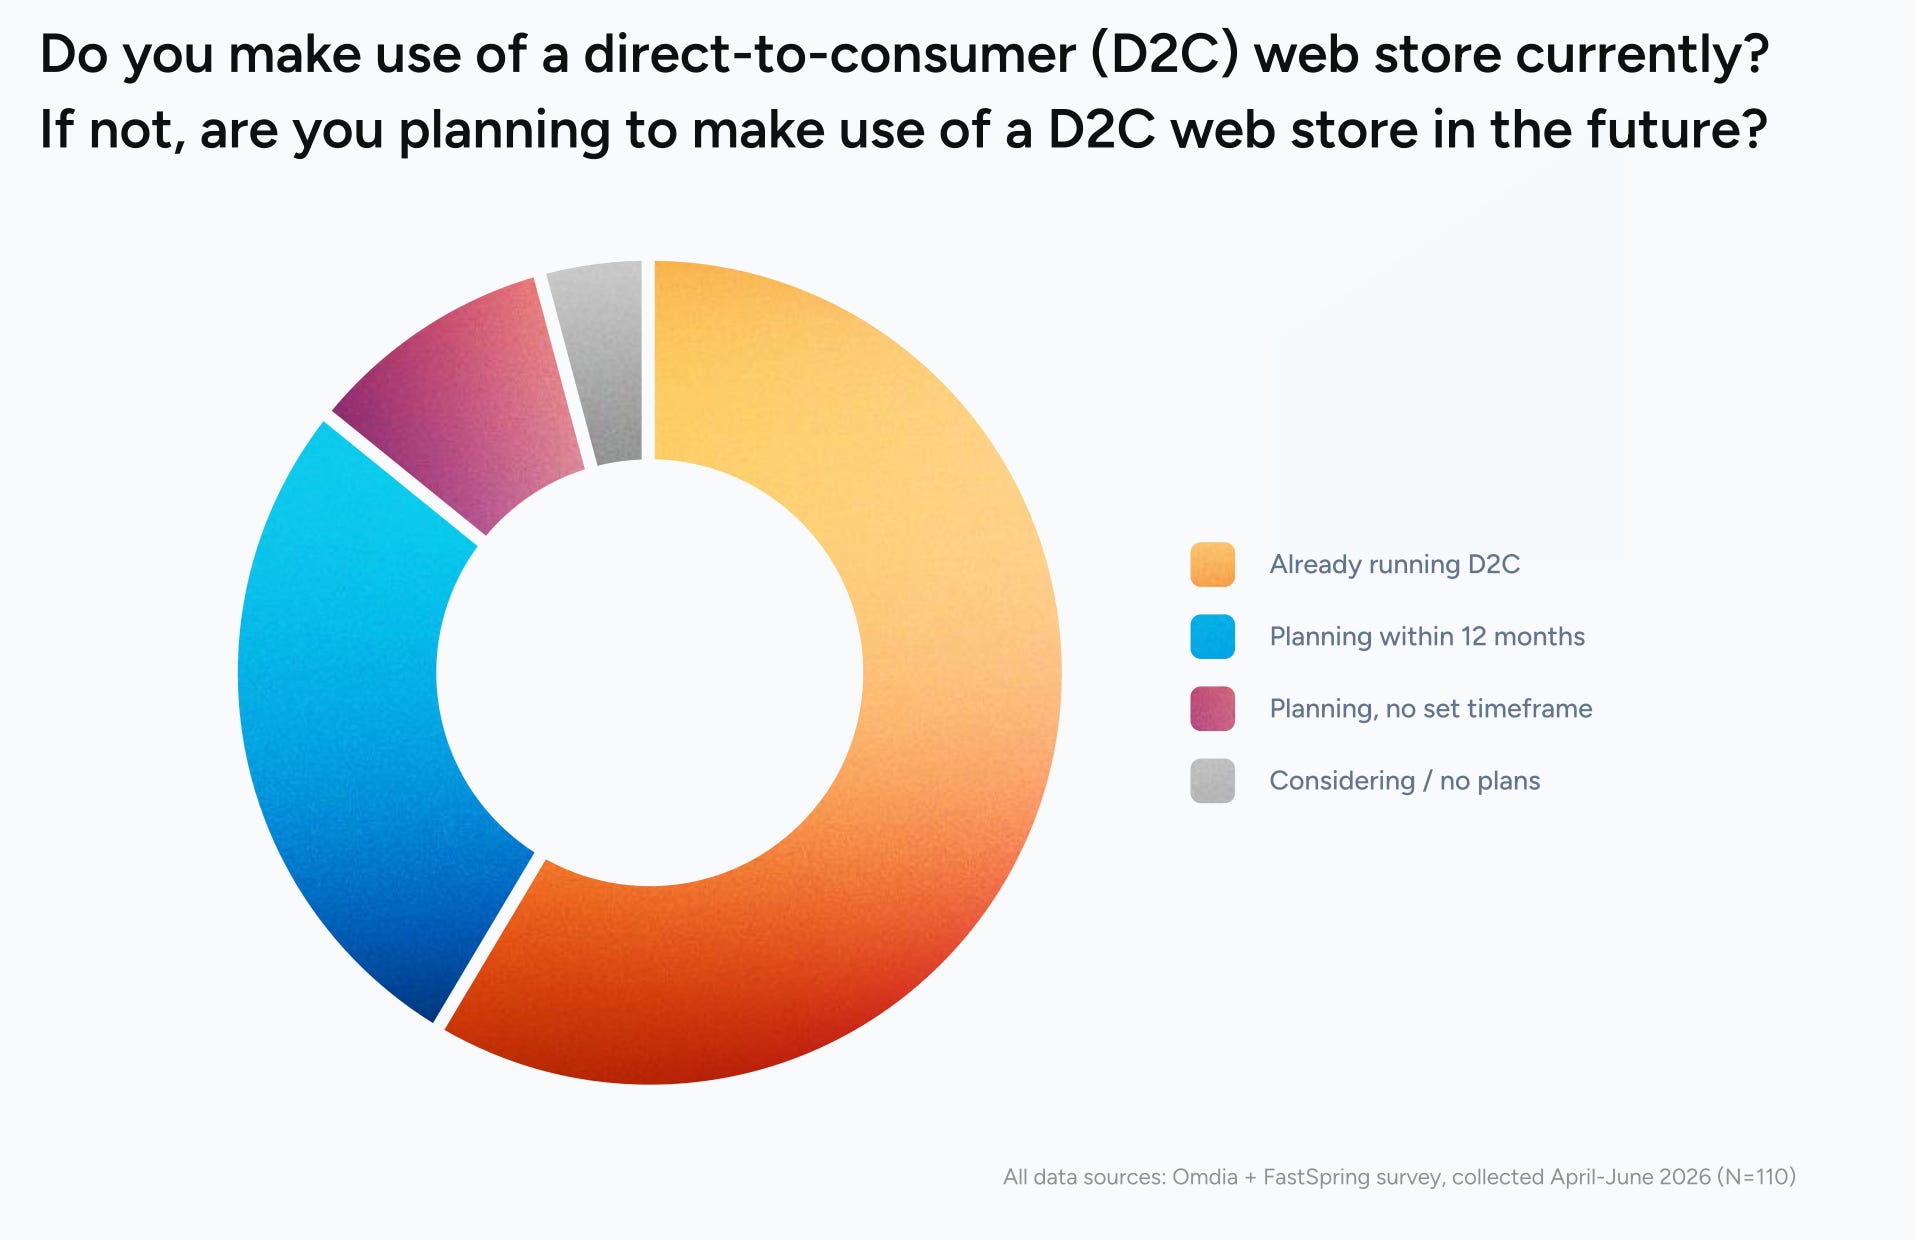
59% of surveyed companies already use a web shop. Last year, it was 57%.

Managing a distributed dev team shouldn’t mean managing a compliance headache. Mellow’s Contractor Management gives you ready-made contracts, IP compliance, and automated payouts for contractors in 150+ countries — for $35/month per contractor.
Of the 41% of companies without a web shop, 91% plan to launch one, and 67% plan to do so within the next 12 months. Fewer than 1% of respondents have ruled it out.
❗️That said, a year ago, 60% of companies without a D2C shop planned to launch one within 12 months. Yet the share of companies with a web shop grew by just 2 percentage points over the year. Respondents in the two surveys likely differ, but plans do not match actions.
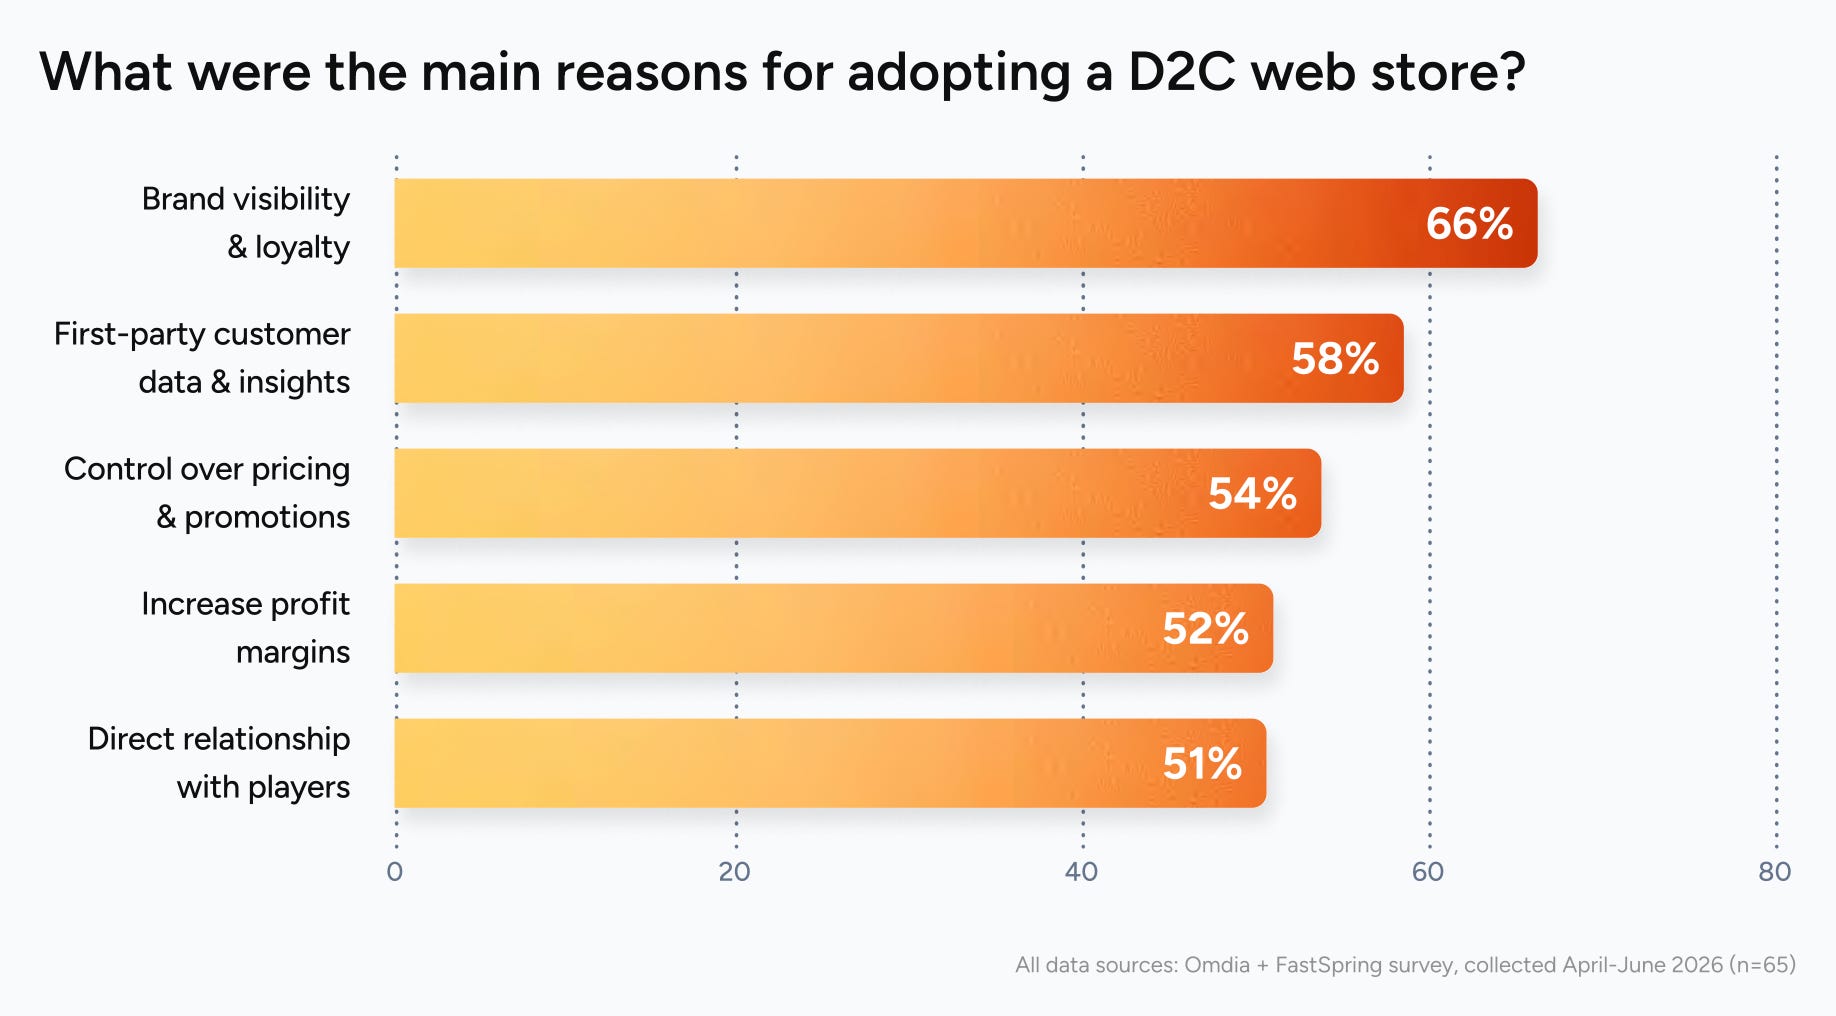
The main reasons for launching a web shop are: brand visibility and player loyalty (66%), access to first-party player data (58%), and control over pricing and promotions (54%). Higher margins are only fourth (52%).
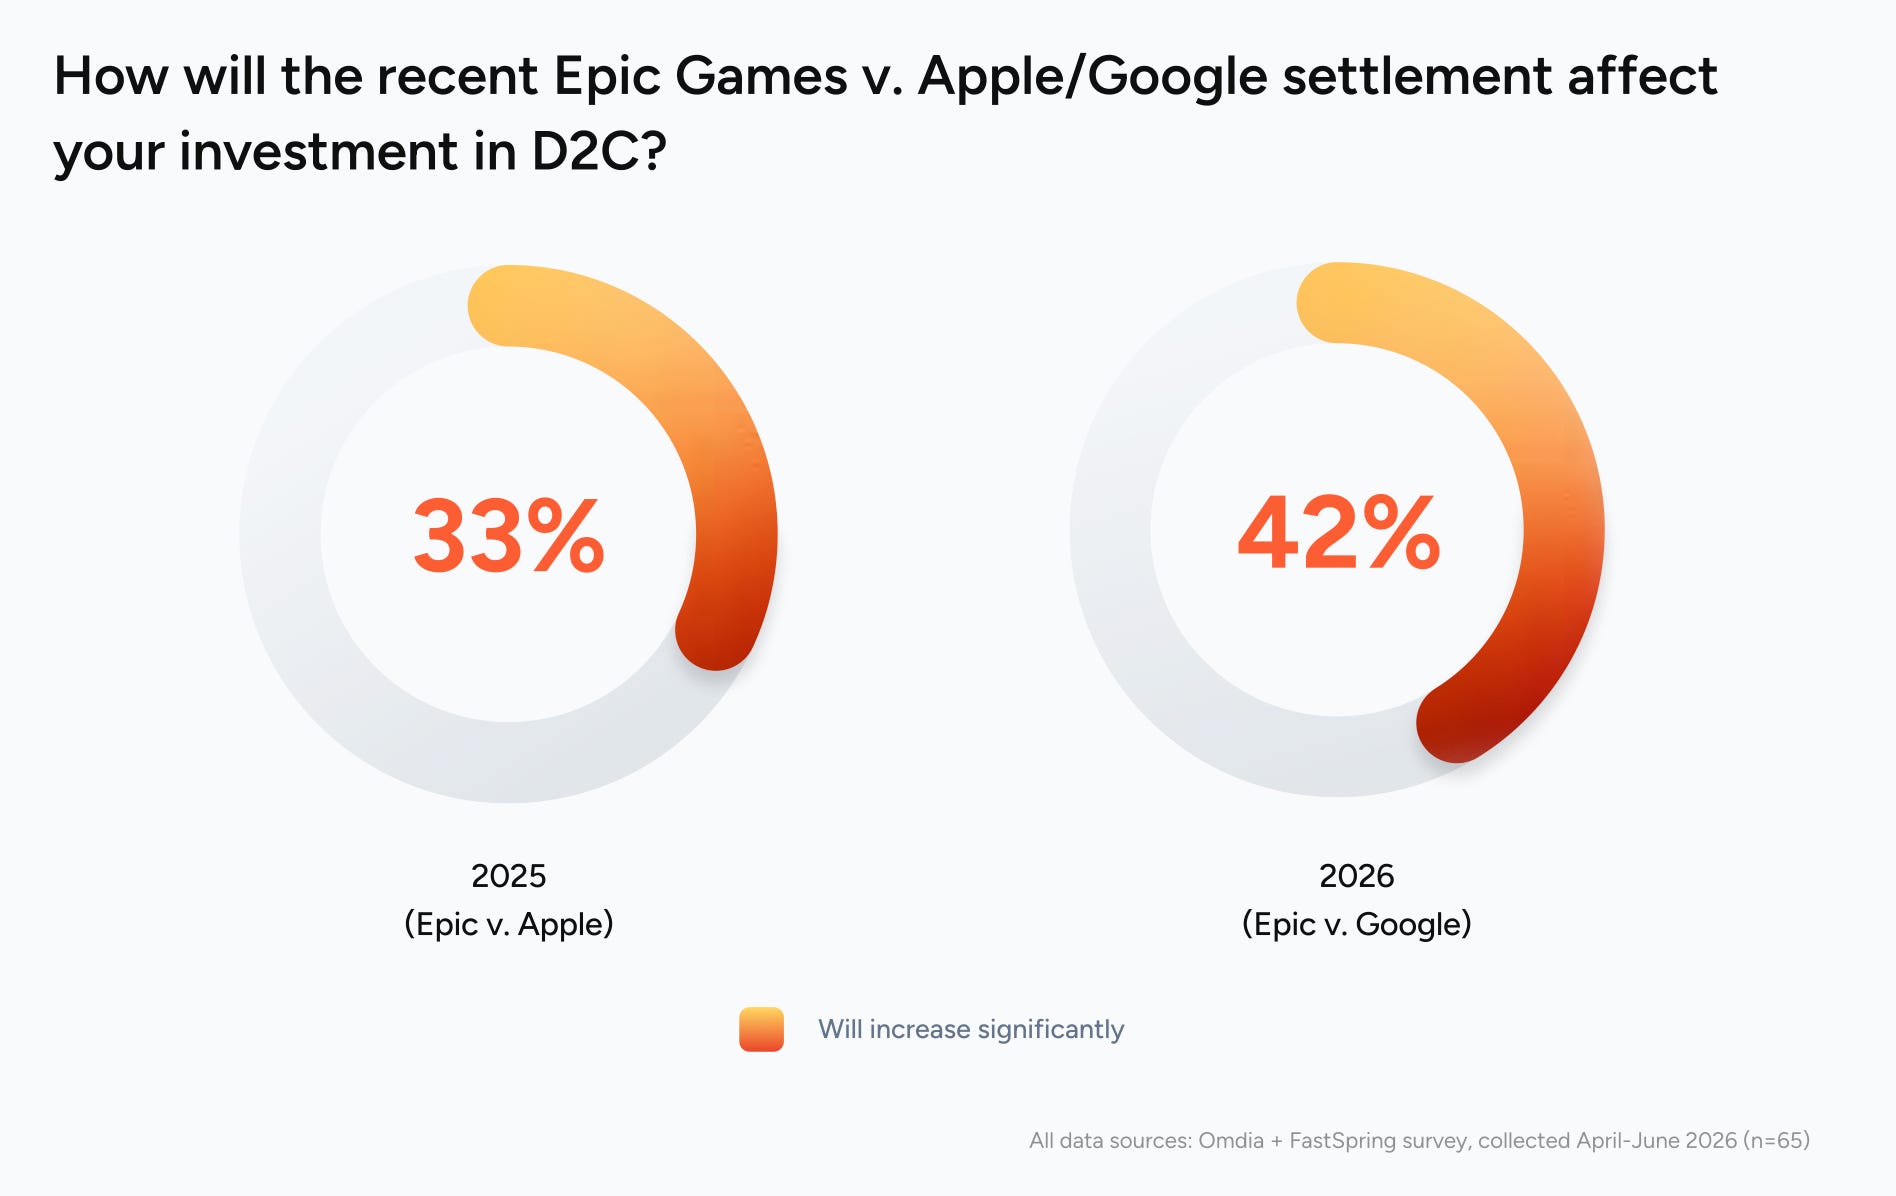
88% of respondents plan to increase their D2C investment in 2026. 42% plan to increase it significantly. Last year, after the Epic v. Apple ruling, it was 33%.
82% of respondents say the recent court decisions have made them more confident in the future of D2C. Among companies without a web shop, 93% said they will most likely launch one in light of the recent court cases.
The main barriers for those without a web shop are: technical complexity (56%), the risk of damaging relationships with Apple and Google (51%), and legal uncertainty (47%). A year ago, 67% of companies cited technical complexity.
Revenue
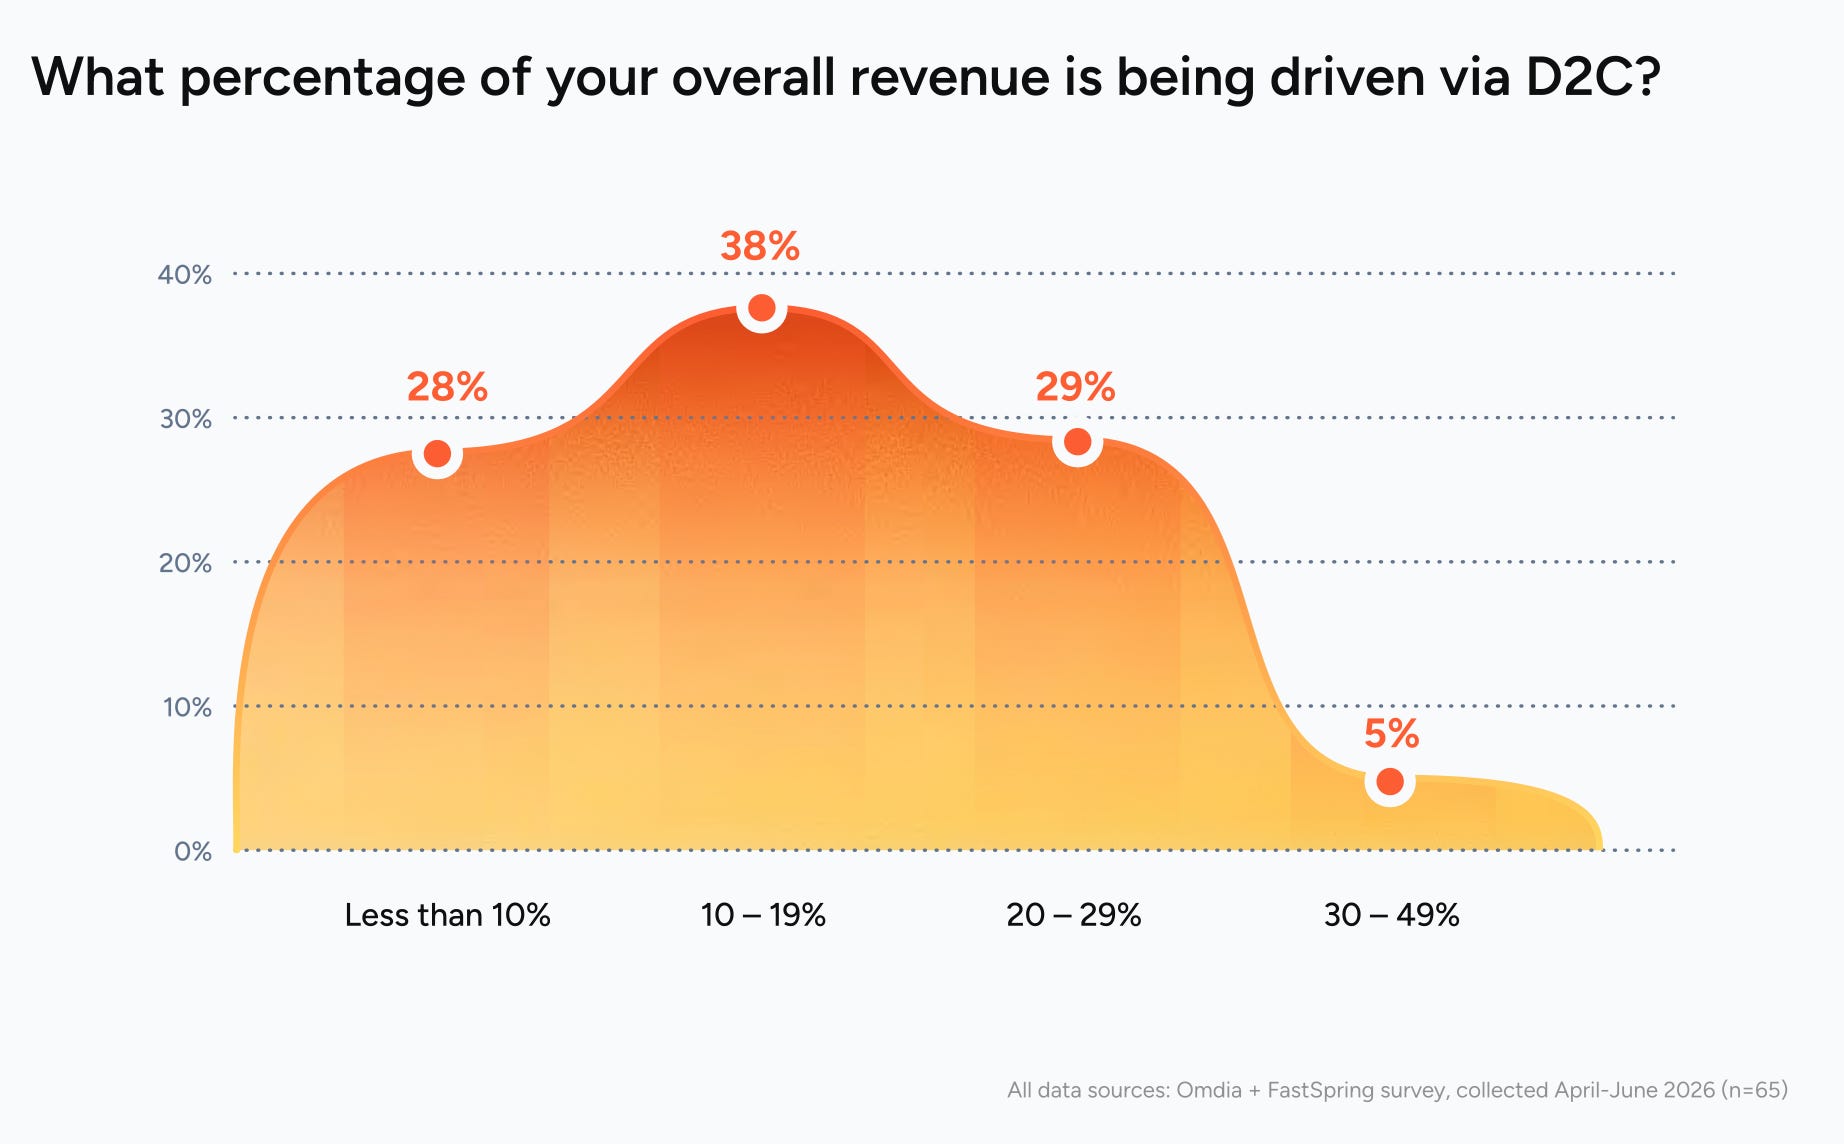
Most companies (38%) get 10-19% of their revenue through D2C. For 28%, it’s less than 10%; for 29%, it’s 20-29%; and only for 5%, it’s 30-49%. No companies in the sample have half or more of their revenue coming through a web shop.
❗️These numbers differ significantly from the Appcharge survey I covered in July. There, 45% of respondents got less than 10% of their revenue from D2C, and 28% got more than half.
75% of companies with a web shop say D2C’s share of their revenue mix grew over the last 12 months.
84% of companies met or exceeded their 2025 D2C revenue target. For 2026, 65% of companies set a higher target.
Omdia and FastSpring cite Two and a Half Gamers’ calculations for public mobile companies. Their D2C revenue barely grew throughout 2024, but surged in the two quarters after the 2025 court rulings. For example, Playtika’s D2C share rose from ~25% to ~39% over four quarters.
There are fewer skeptics, too. A year ago, 49% of companies without a web shop didn’t believe D2C would bring them significant revenue. Now, it’s 38%.
How Companies Run Their Web Shops
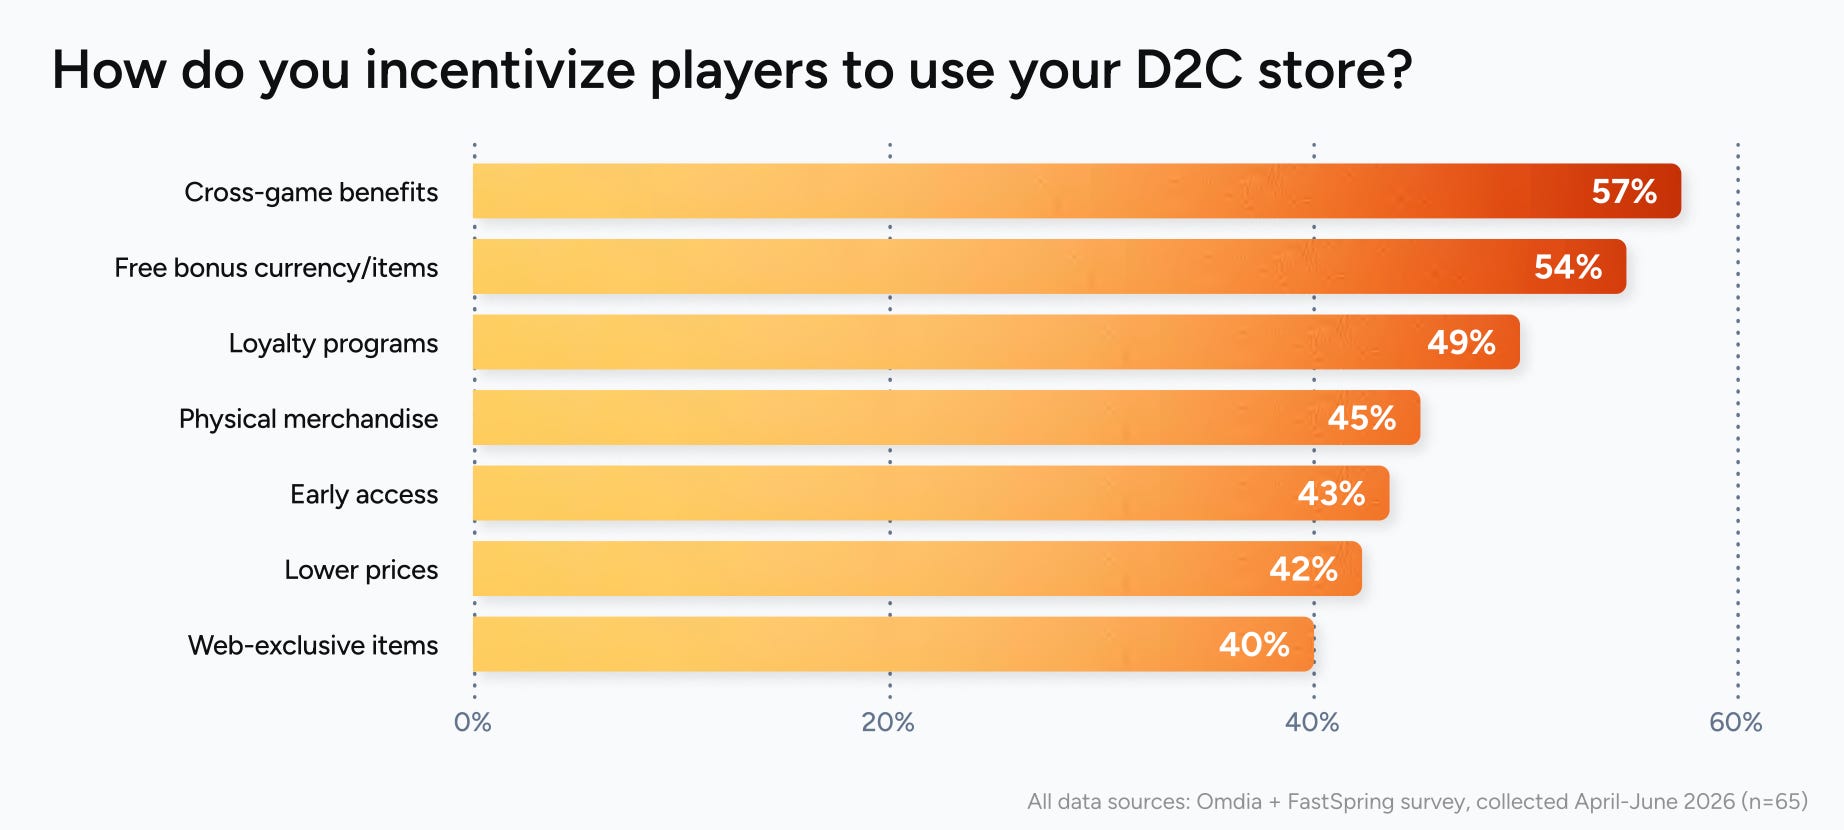
Companies most often encourage players to buy in the web shop with bonuses that work in the company’s other games (57%), free currency or items (54%), and loyalty programs (49%). 42% of companies offer lower prices.
51% of companies with a web shop accept payments both in the web shop itself and through external payment links right from the game.
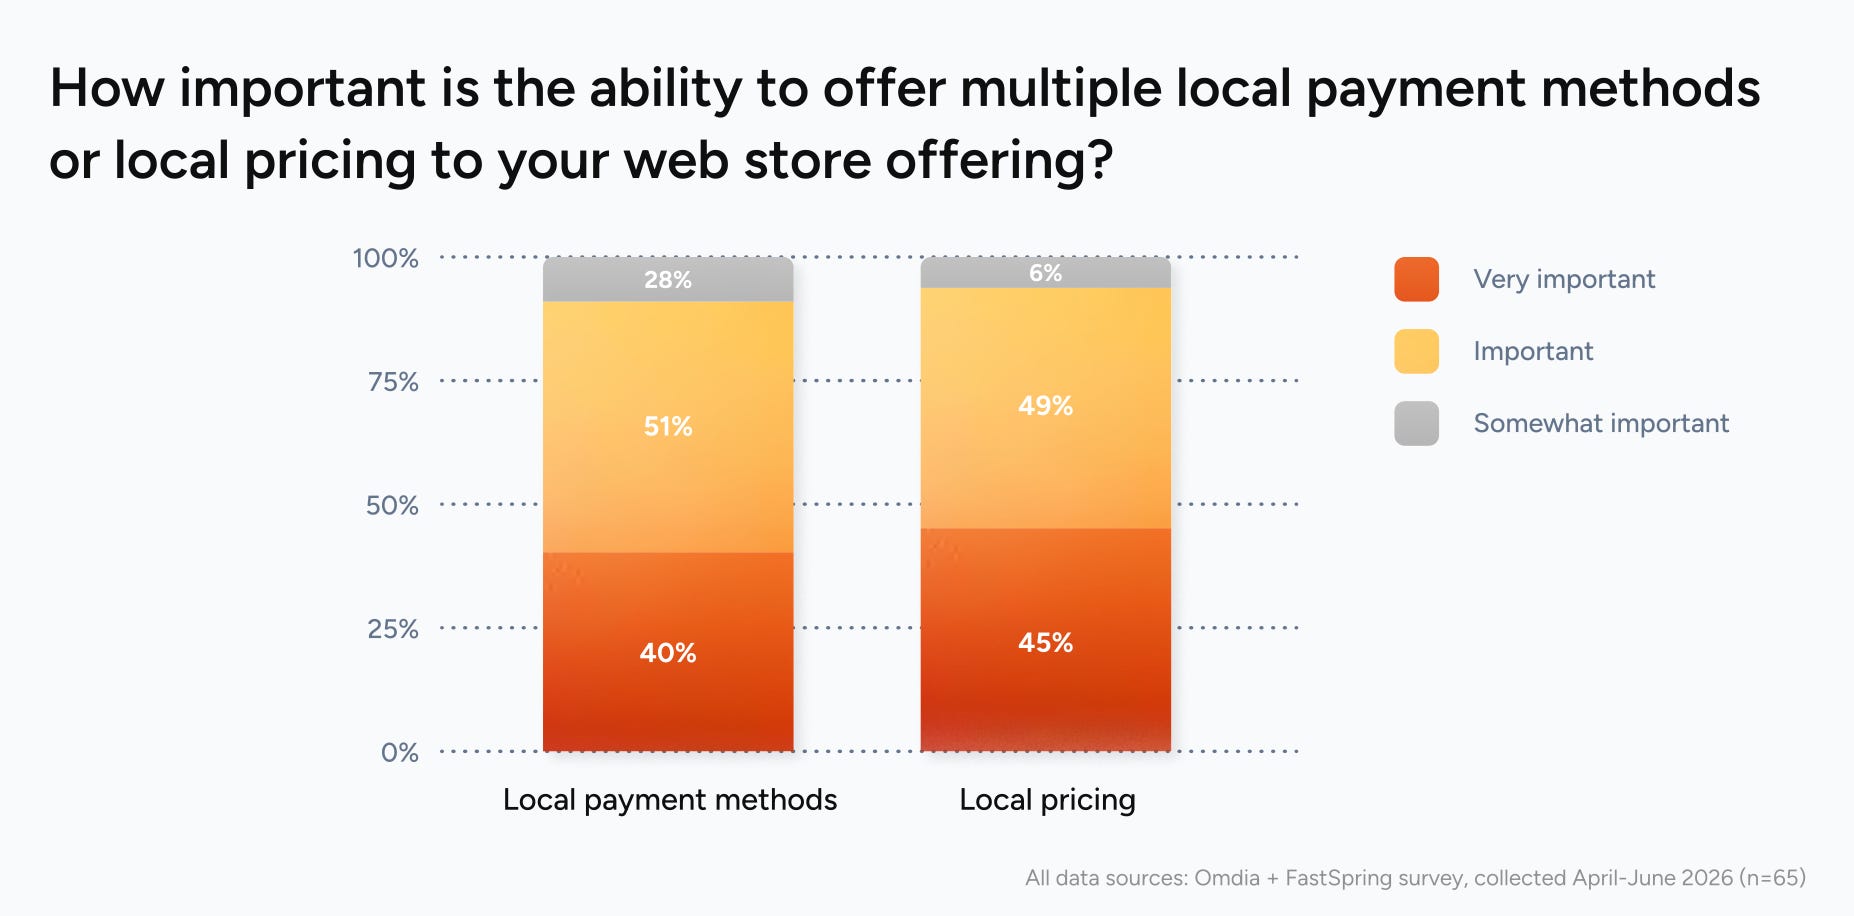
91% of companies consider the ability to offer local payment methods important; 94% say the same about local pricing.
Local payment methods increase player trust (66%) and conversion (55%), and help enter regions where bank cards are rarely used (55%).
72% of companies with a web shop say fraud and chargeback rates are higher on their web shop than for purchases through the app stores.
Over 95% of companies with a web shop have a D2C team of more than one person. Most often, the web shop team sits within IT (37%) or monetization (28%). 85% of companies handle web development in-house.
❗️For comparison, in the Appcharge survey, 54% of companies said they had no dedicated D2C staff at all.
83% of companies with a web shop work with a payment partner that specializes in games.
Sensor Tower: The Premium PC/Console Gaming Market in 2026
The Market
Video Game Insights (Sensor Tower) data: 140,000+ games in 50+ countries. Only Steam, PlayStation, and Xbox are included. Revenue is gross. Units sold include all copies of premium games, including subscription giveaways (PS Plus, Game Pass).
Over 12 months (H2'25-H1'26), premium games on PC and consoles earned $30 billion. PlayStation accounted for 45.1% of revenue, Steam for 38.6%, and Xbox for 16.3%.
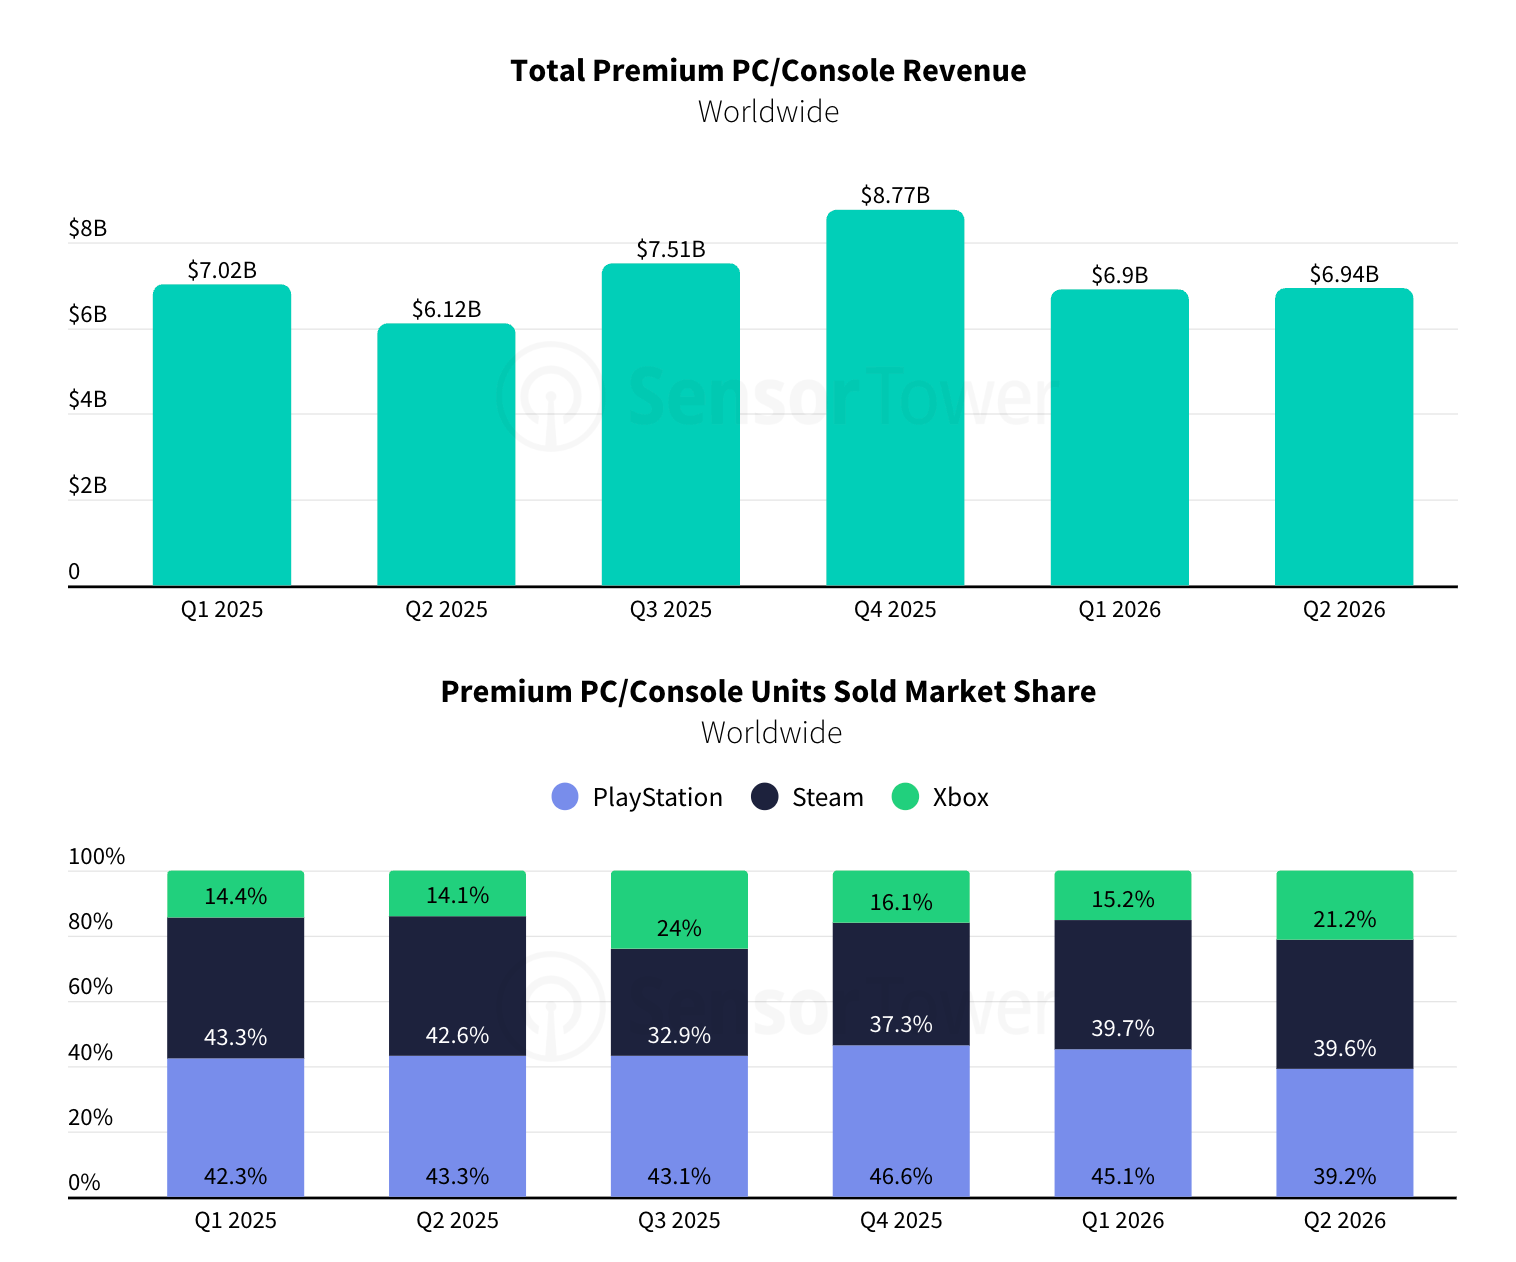
In H1'26, revenue grew 5.3% YoY to $13.8 billion (up from $13.1 billion a year earlier). All of the growth came in the second quarter: the market earned $6.9 billion in Q1'26 (-2% YoY) and $6.94 billion in Q2'26 (+13% YoY). Sensor Tower attributes this to strong releases, including Forza Horizon 6 and 007 First Light.
❗️In its August report, Sensor Tower estimated Steam revenue in H1'26 at $5.36 billion (-5% YoY). So, consoles seem to be driving growth in the premium games market.
PlayStation led by share of units sold in four of the last six quarters, peaking at 46.6% in Q4'25. In Q2'26, its share fell to 39.2%, the lowest since the beginning of 2025. Steam has held at 39-40% for three quarters in a row and slightly overtook PlayStation in Q2'26 (39.6%).

From concept art to launch-day marketing, most game studios rely on contractors in multiple countries. Mellow makes it simple to hire, pay, and stay compliant with talent in 150+ countries — no legal entity required.
Xbox had 21.2% of units sold in Q2'26, up six percentage points from a quarter earlier. Sensor Tower notes that unit counts include Xbox Game Pass giveaways, so Xbox's share of units is less consistent than its share of revenue.
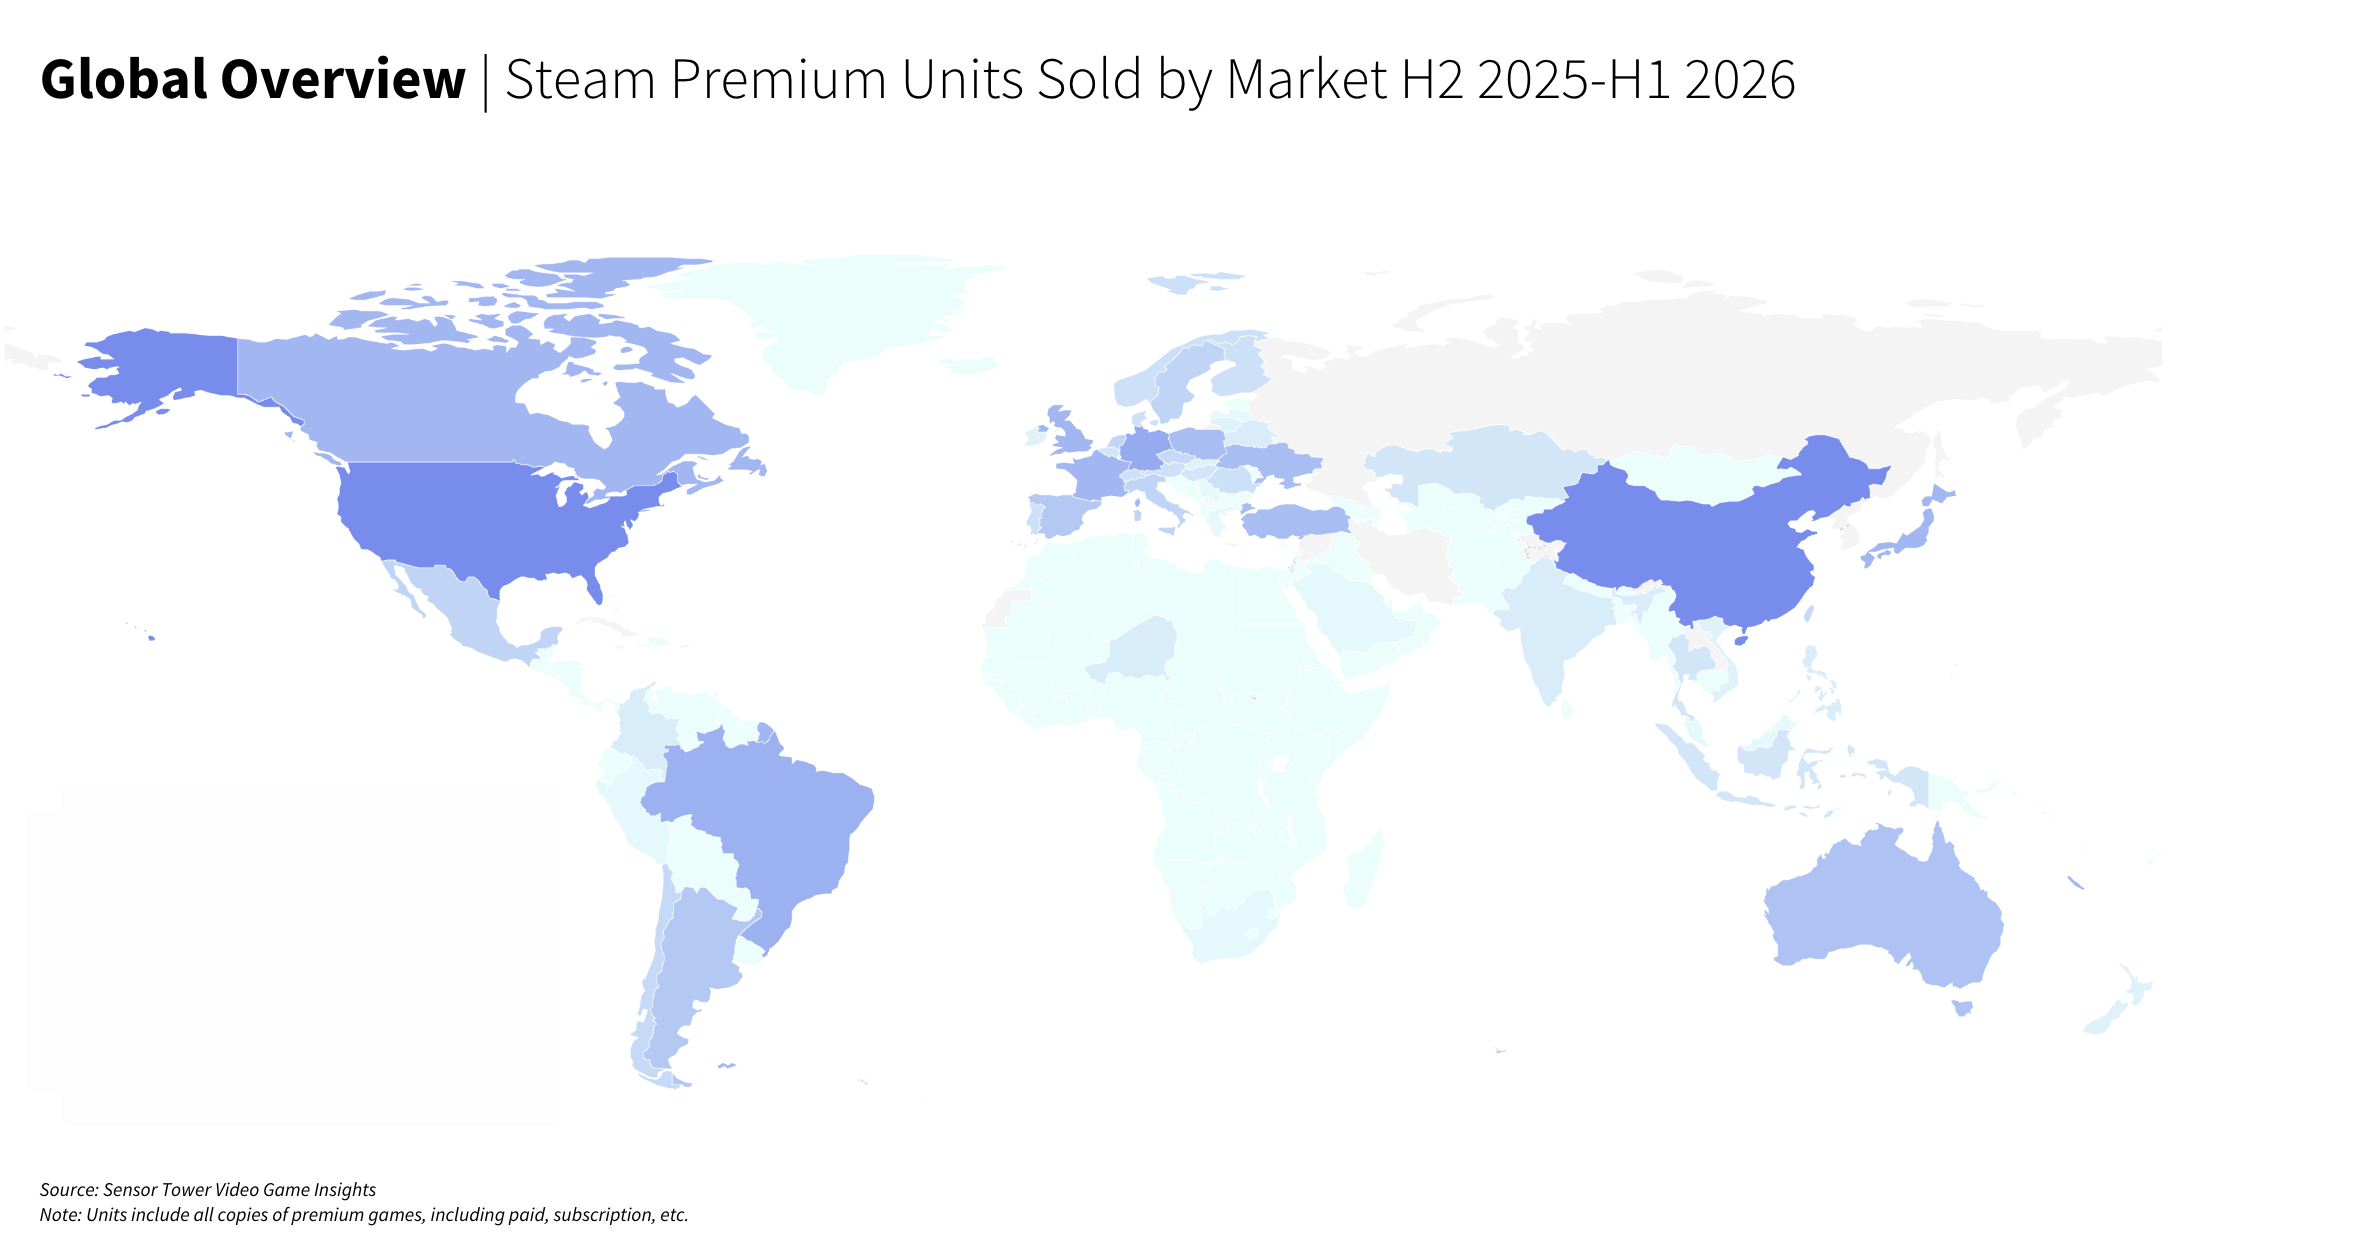
By units sold on Steam, the US (139 million) and China (126 million) lead. Russia is third (50.9 million).


Action is the top genre by revenue on every platform. Over 12 months, it earned $4.81 billion on PlayStation, $4.05 billion on Steam, and $1.34 billion on Xbox.
Second place on PlayStation goes to Sports ($2.82 billion), on Xbox to Shooter ($1.06 billion), and on Steam to RPG ($1.81 billion), just slightly above Shooters ($1.8 billion).
The leaders differ too. On PlayStation, EA SPORTS FC 26 leads in both units and revenue. On Xbox, Forza Horizon 6 leads in units (including subscription), and Battlefield 6 in revenue. On Steam, the sales leaders include AAA hits like Battlefield 6 and ARC Raiders, as well as smaller titles like PEAK and MECCHA CHAMELEON.
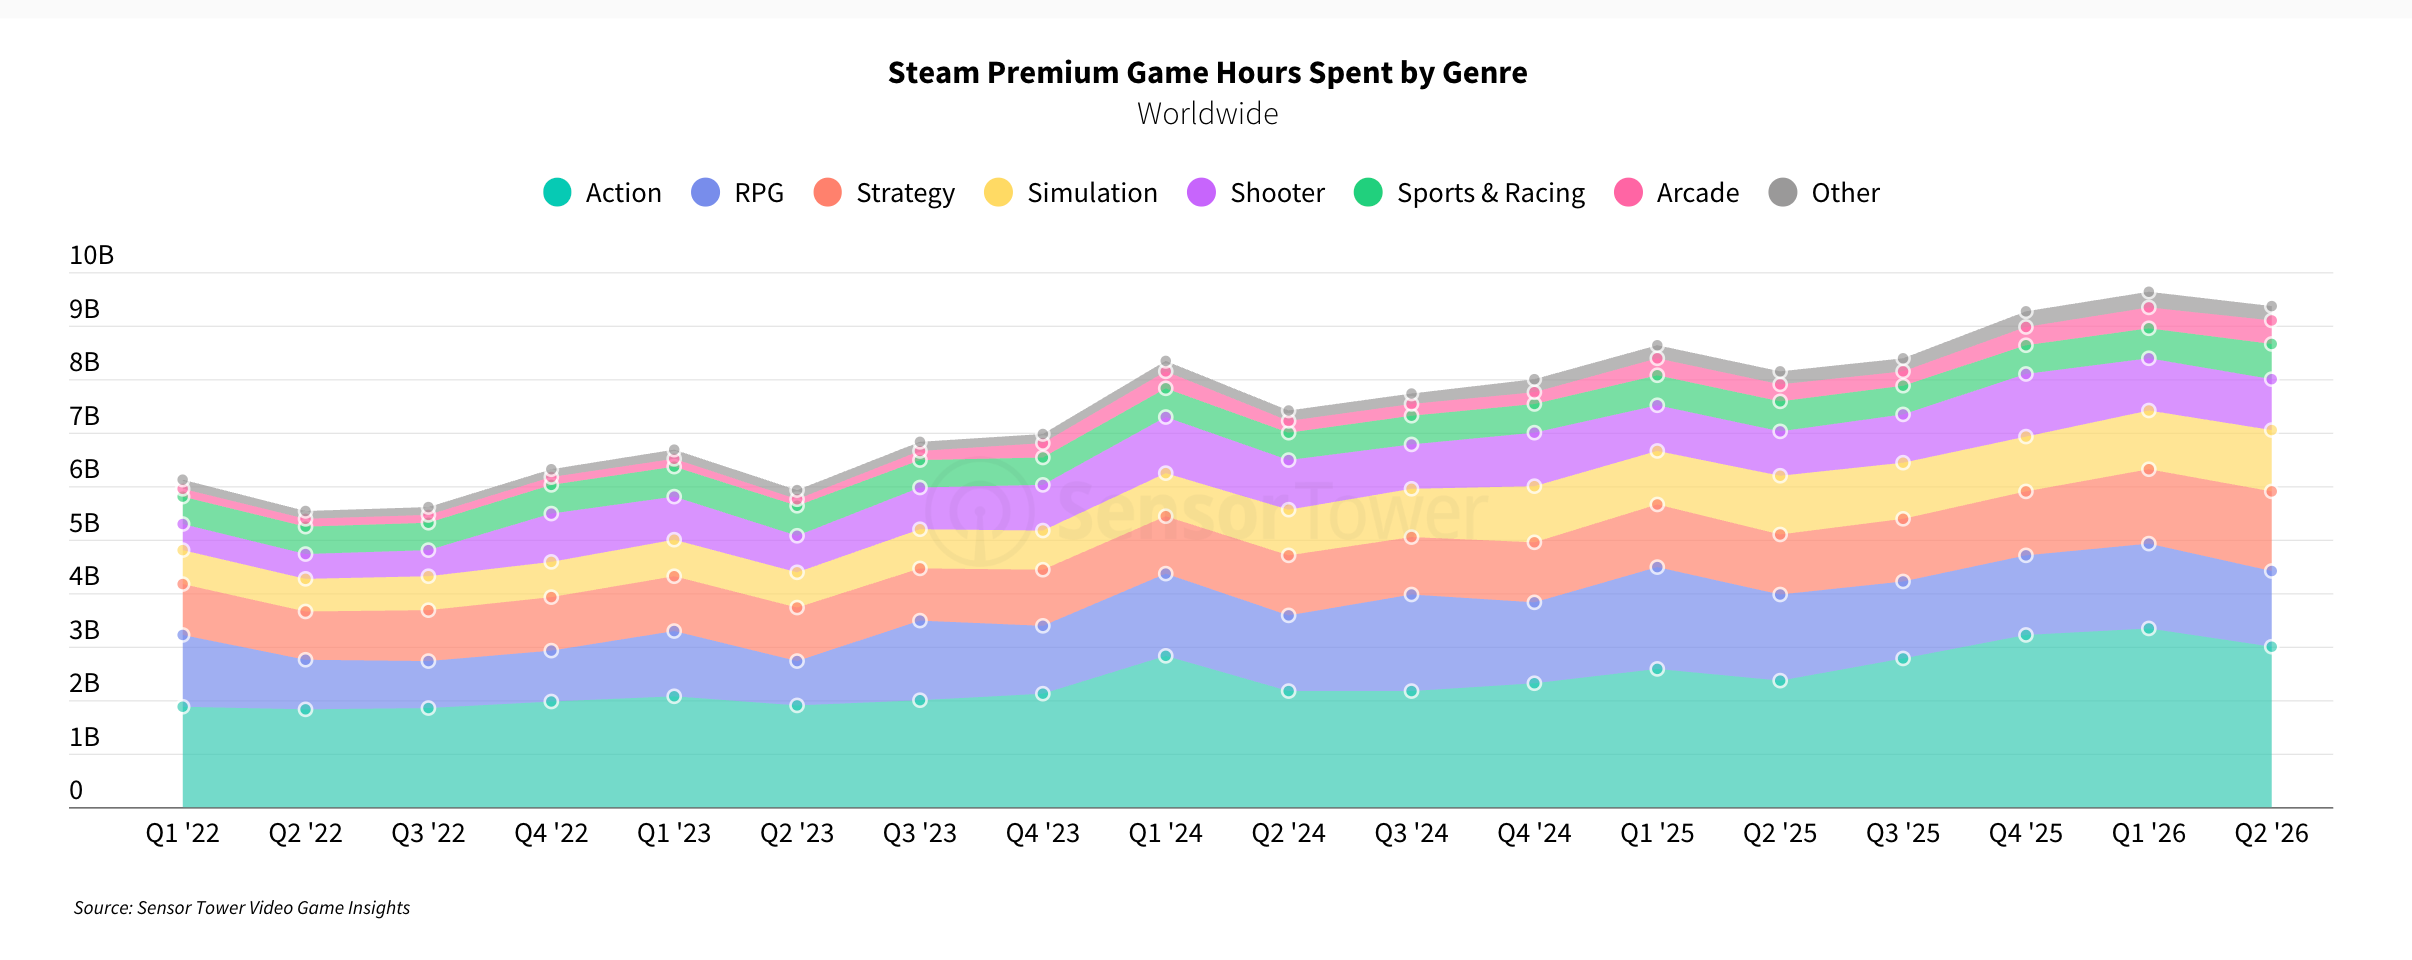
Time spent in premium games on Steam grew ~13% YoY in H1'26. Action (+28%) and Strategy (+24%) grew fastest, and Shooters grew by 14%. RPG playtime, on the other hand, fell (-14%).
If F2P games are included, Shooters lead Steam in time spent.


Most of Steam's revenue comes from games released in previous years; their share is usually 60-80%, depending on the quarter. In the first half of 2026, new releases accounted for 26% of revenue in the first quarter and 31.3% in the second. Back-catalog revenue is gradually growing and approaching $2 billion per quarter, while new-release revenue depends on how strong the releases are.
The number of premium releases on Steam (only games with 20+ reviews are counted) has grown since 2023, but the new-release share of revenue has not kept pace. In H1'26, 3,800 new games with 20+ reviews came out (-4% YoY). For comparison, Sensor Tower estimates that 11,800 games in total came out on Steam in H1'26, more than in any other half. More and more games are on the market, but they are fighting for the same, fairly limited, segment of the market.
Publishers and Games
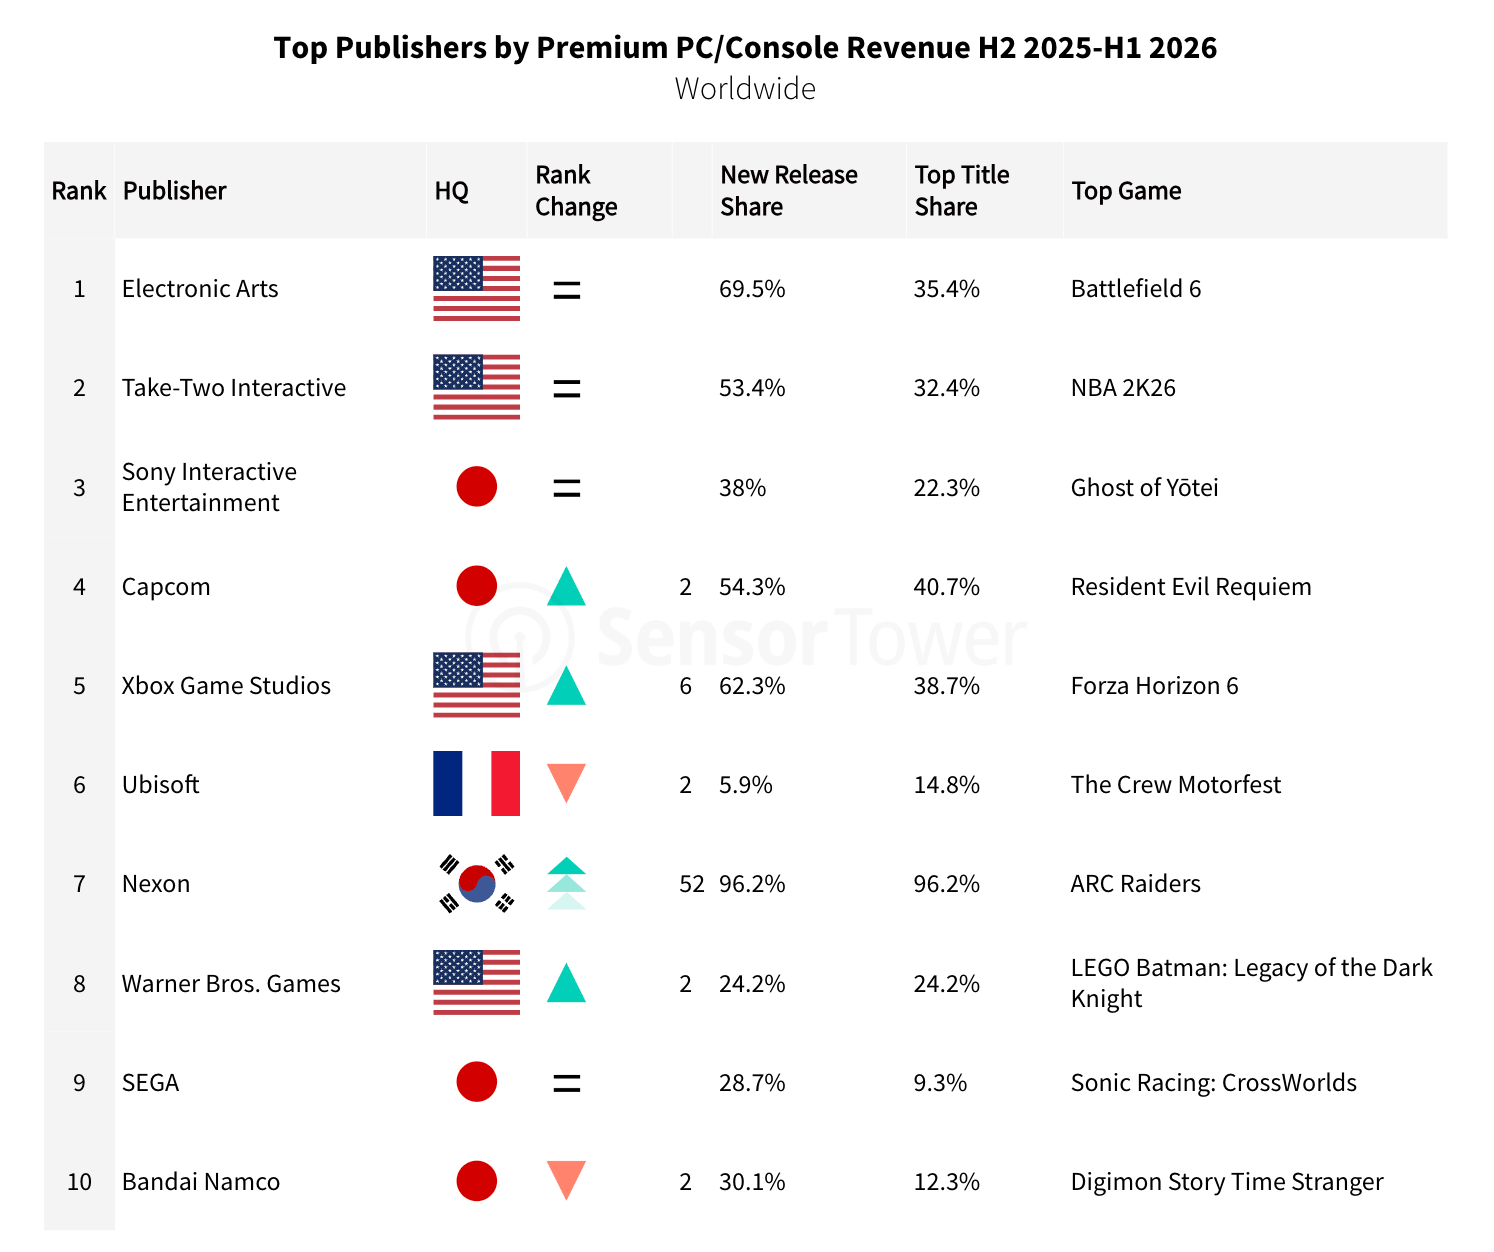
The top three publishers by premium revenue over 12 months have not changed: Electronic Arts, Take-Two, and Sony.
Five of the top 10 publishers earned more than half of their premium revenue from games released in the past 12 months. For EA, that is 69.5% (Battlefield 6, FC 26, Madden 26); for Xbox, 62.3% (Forza Horizon 6); for Capcom, 54.3% (Resident Evil Requiem); and for Take-Two, 53.4% (NBA 2K26). At Nexon, ARC Raiders alone brought in 96.2% of revenue.
Xbox Game Studios climbed six places (to 5th) on Forza Horizon 6, and Capcom two places (to 4th) with Resident Evil Requiem. Nexon rose from 59th to 7th on ARC Raiders alone.
Ubisoft, on the other hand, earned just 5.9% of its revenue from new releases and slipped two places (to 6th). Bandai Namco also lost two places.
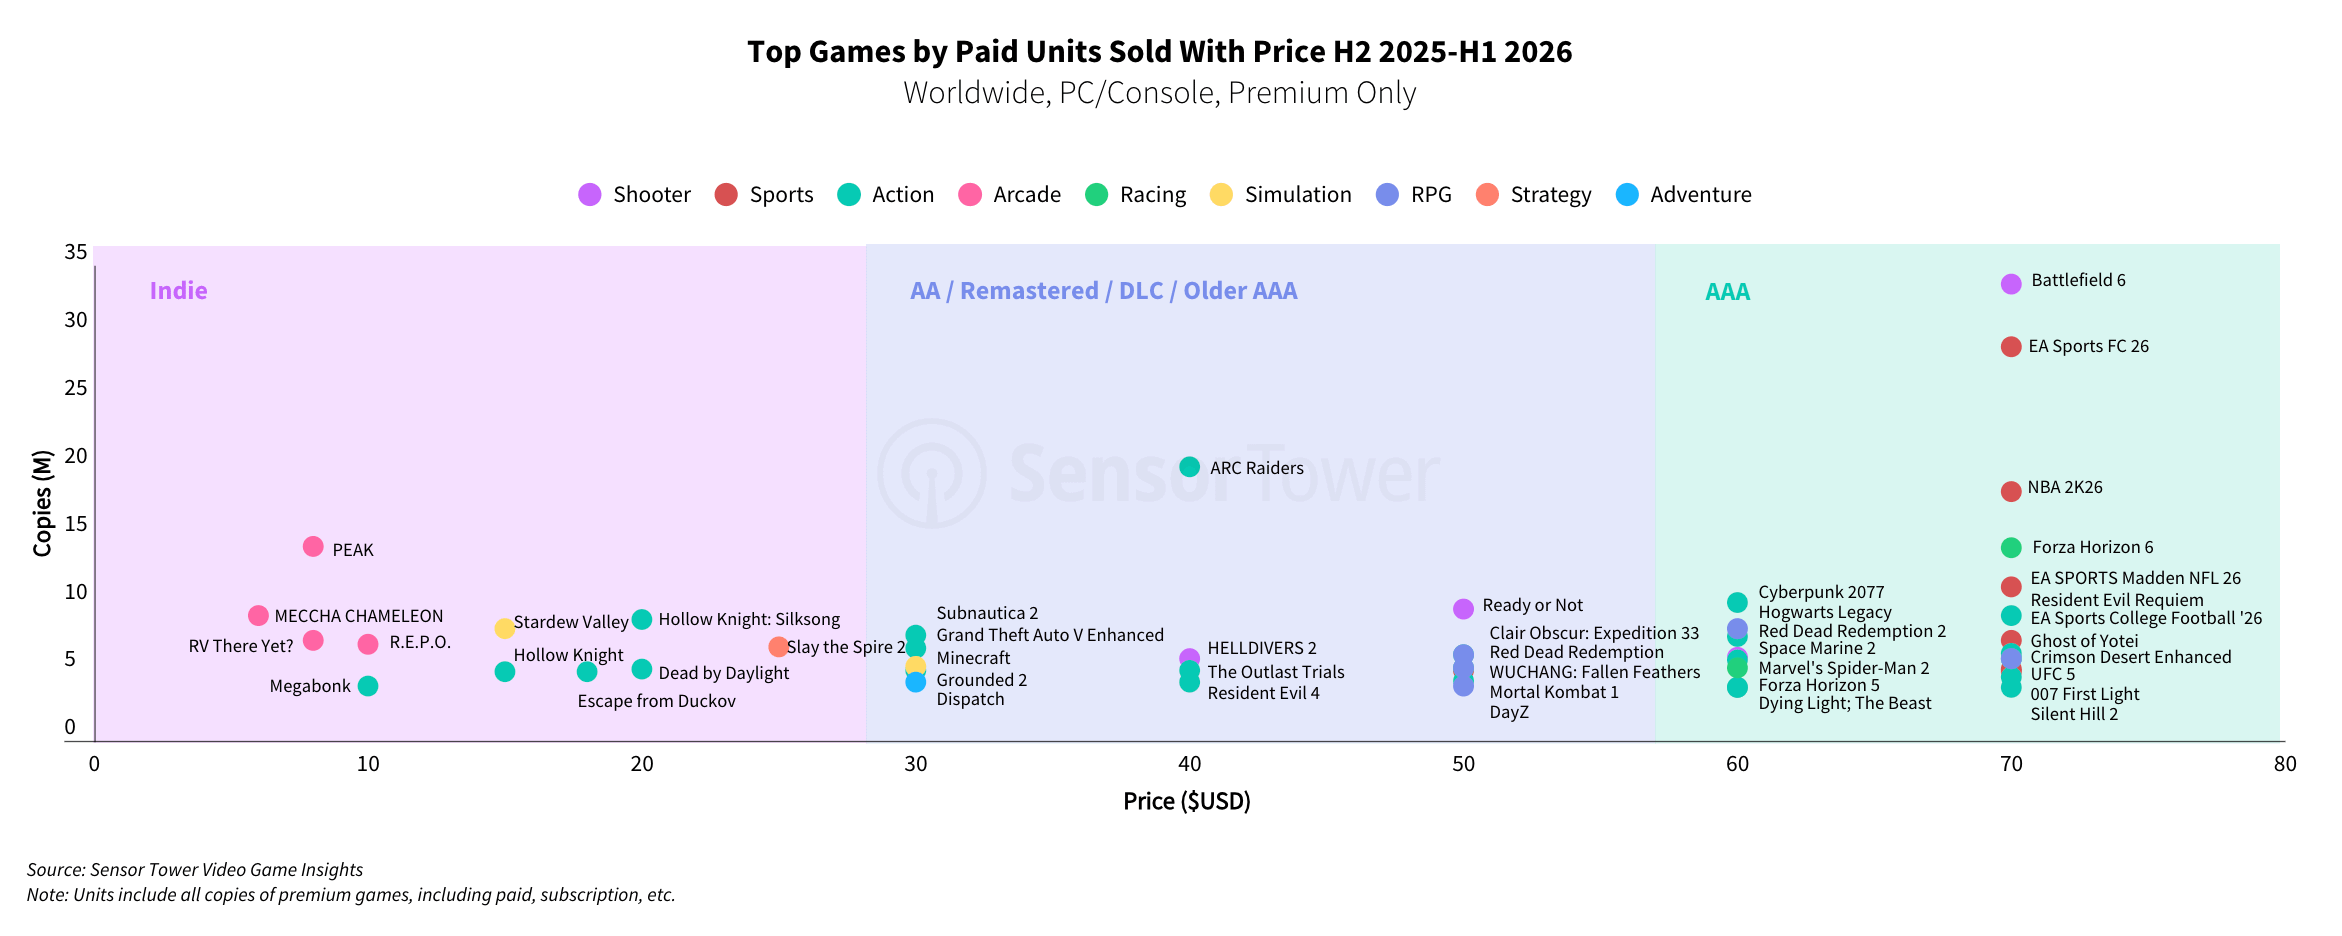
Leaders by paid units sold (H2'25-H1'26): Battlefield 6 (33.7 million), EA SPORTS FC 26 (29 million), and ARC Raiders (20.2 million). The first two cost $70, and ARC Raiders $40.
Cheap games sell well. PEAK ($8) sold 14.3 million copies, MECCHA CHAMELEON ($6) 9.27 million, RV There Yet? ($8) 7.38 million, and R.E.P.O. ($10) 7.12 million.
❗️In its August report, Sensor Tower counted 13.1 million copies of MECCHA CHAMELEON for H1'26 alone. I'm not sure why the number of copies went down, given that the developers officially reported the game has sold more than 20 million copies.
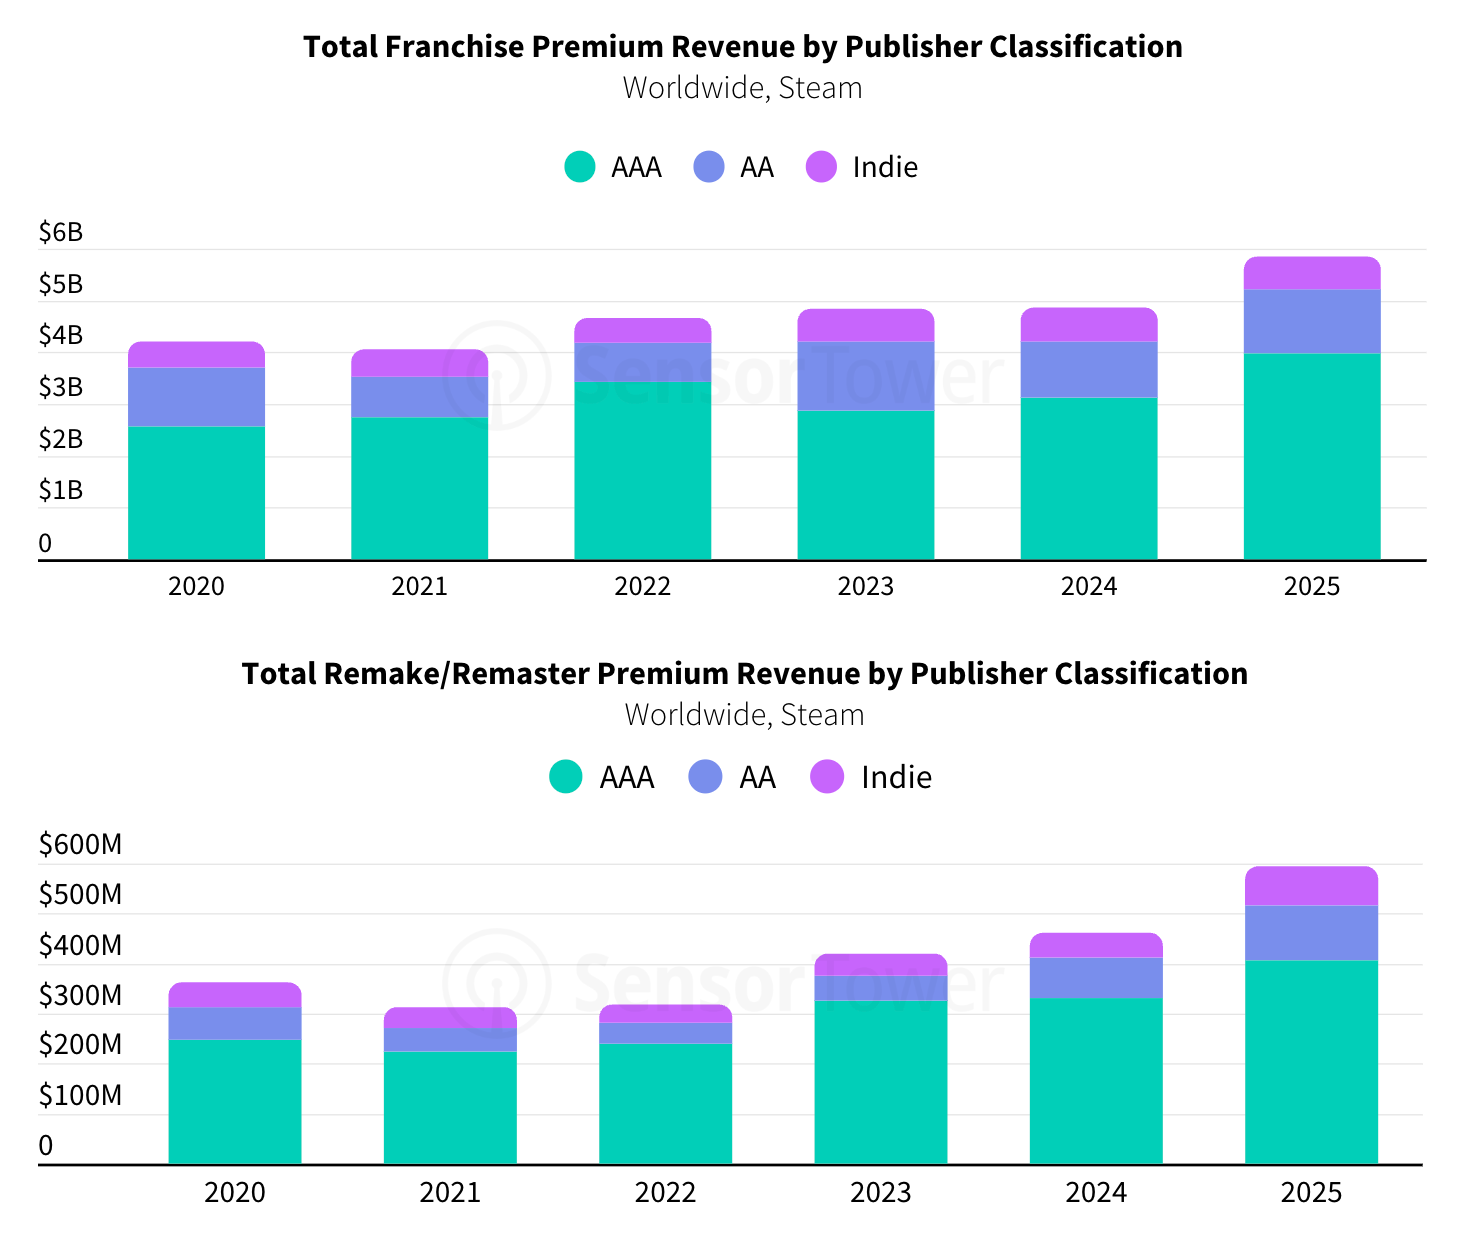
In 2025, franchises on Steam earned more than a year earlier. AAA franchise revenue grew to $3.98 billion (from $3.13 billion in 2024), AA franchises also grew (to $1.23 billion), and indie stayed flat ($0.64 billion).
Remake and remaster revenue is growing too: AAA at $408 million (+23% YoY), AA at $108 million, and indie at $78.9 million.
At the same time, the number of franchise and remake releases did not grow, and it even declined among indie projects. Sensor Tower believes publishers are betting on existing audiences. And the lack of big new IPs may have contributed to the rise of the indie scene.
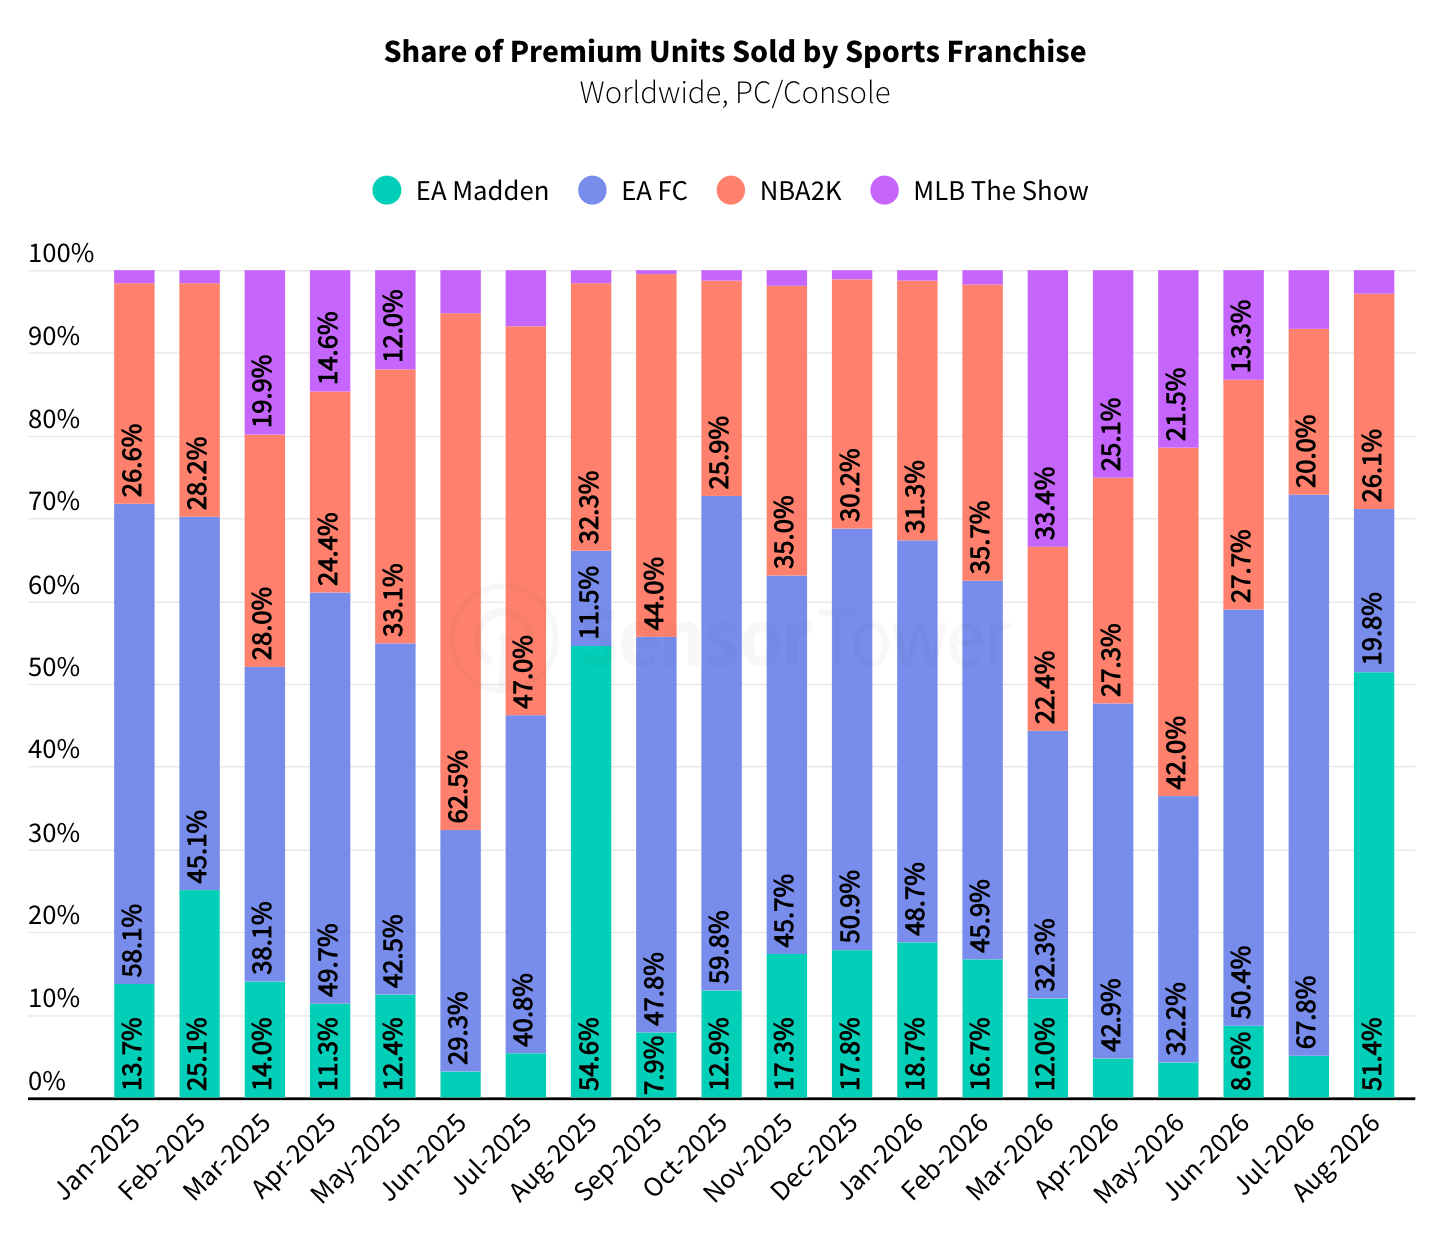
By share of units sold among sports games, EA SPORTS FC usually leads. It gives way only in the months when competitors launch: Madden in August (51.4% in August 2026), MLB The Show in spring, and NBA 2K in June.
In July 2026, EA FC's share of sales rose to 67.8% on the back of the FIFA World Cup.


By the end of its first month on Steam, Madden NFL 27 is selling slightly worse than Madden NFL 26. The start was much weaker, but the gap almost closed within 30 days. Sensor Tower suggests early sales may have been affected by the EA Sports MVP+ subscription, which bundles Madden and College Football.
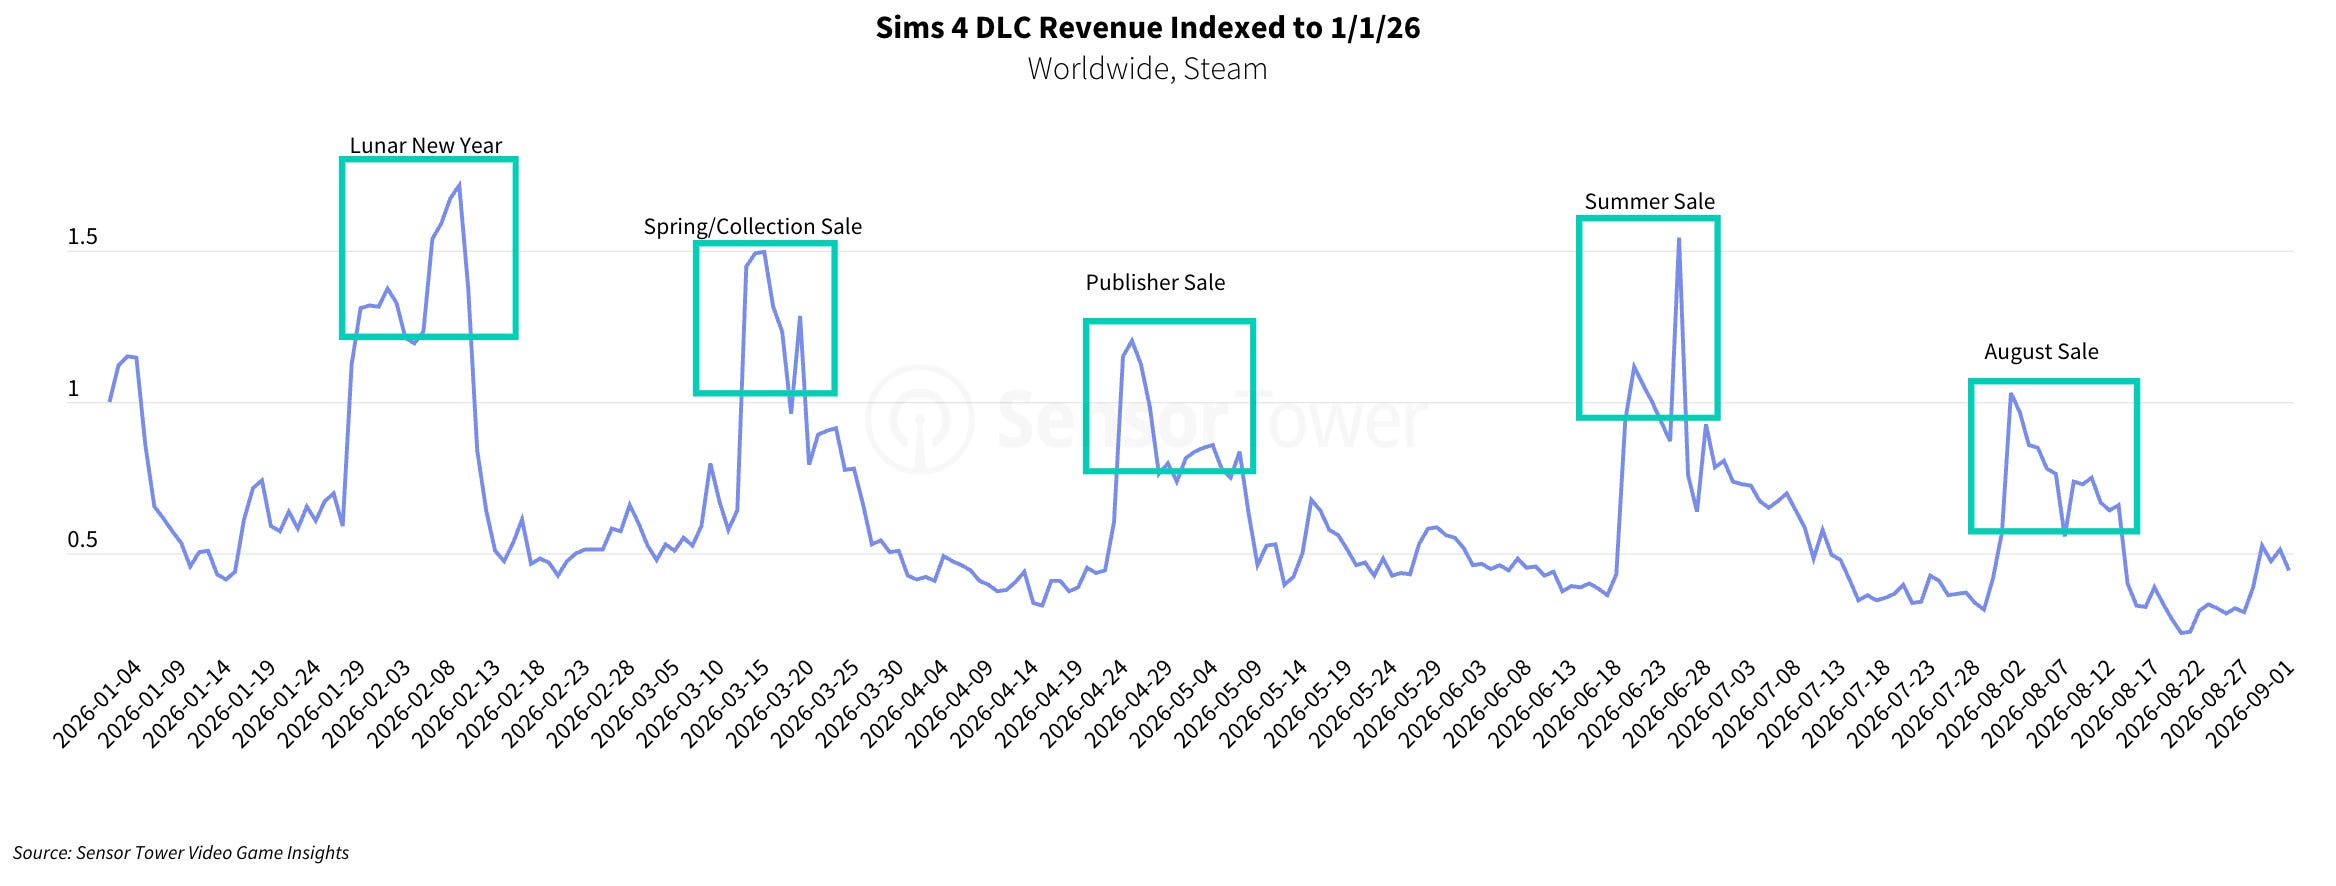
The Sims 4 went free-to-play in October 2022. Still, according to Sensor Tower, in 2026 alone the game earned more from DLC on Steam than the base game did over all its years of sales.
❗️It's important here that VGI (Sensor Tower) only counts Steam figures. The Sims 4 came to Steam only six years after its global release. Before that, the game was distributed through Origin.
DLC revenue grows during Steam's seasonal sales. The game's best sale of 2026 was Lunar New Year. Sensor Tower explains this by the fact that China is The Sims 4's top market by players.


Sensor Tower compared how the split between copy sales and in-game purchases changes after launch on Steam. For Battlefield 6, 93.3% of revenue is copy sales; after the October 2025 peak, revenue drops sharply. For ARC Raiders, in-game purchases account for 26.3%, and in December they nearly matched copy sales. For NBA 2K26, the figure is already 41.8%, so revenue holds up as long as the game stays relevant.
Wishlists
❗️Conversion is calculated from all pre-launch wishlists plus those added in the first 30 days after launch.
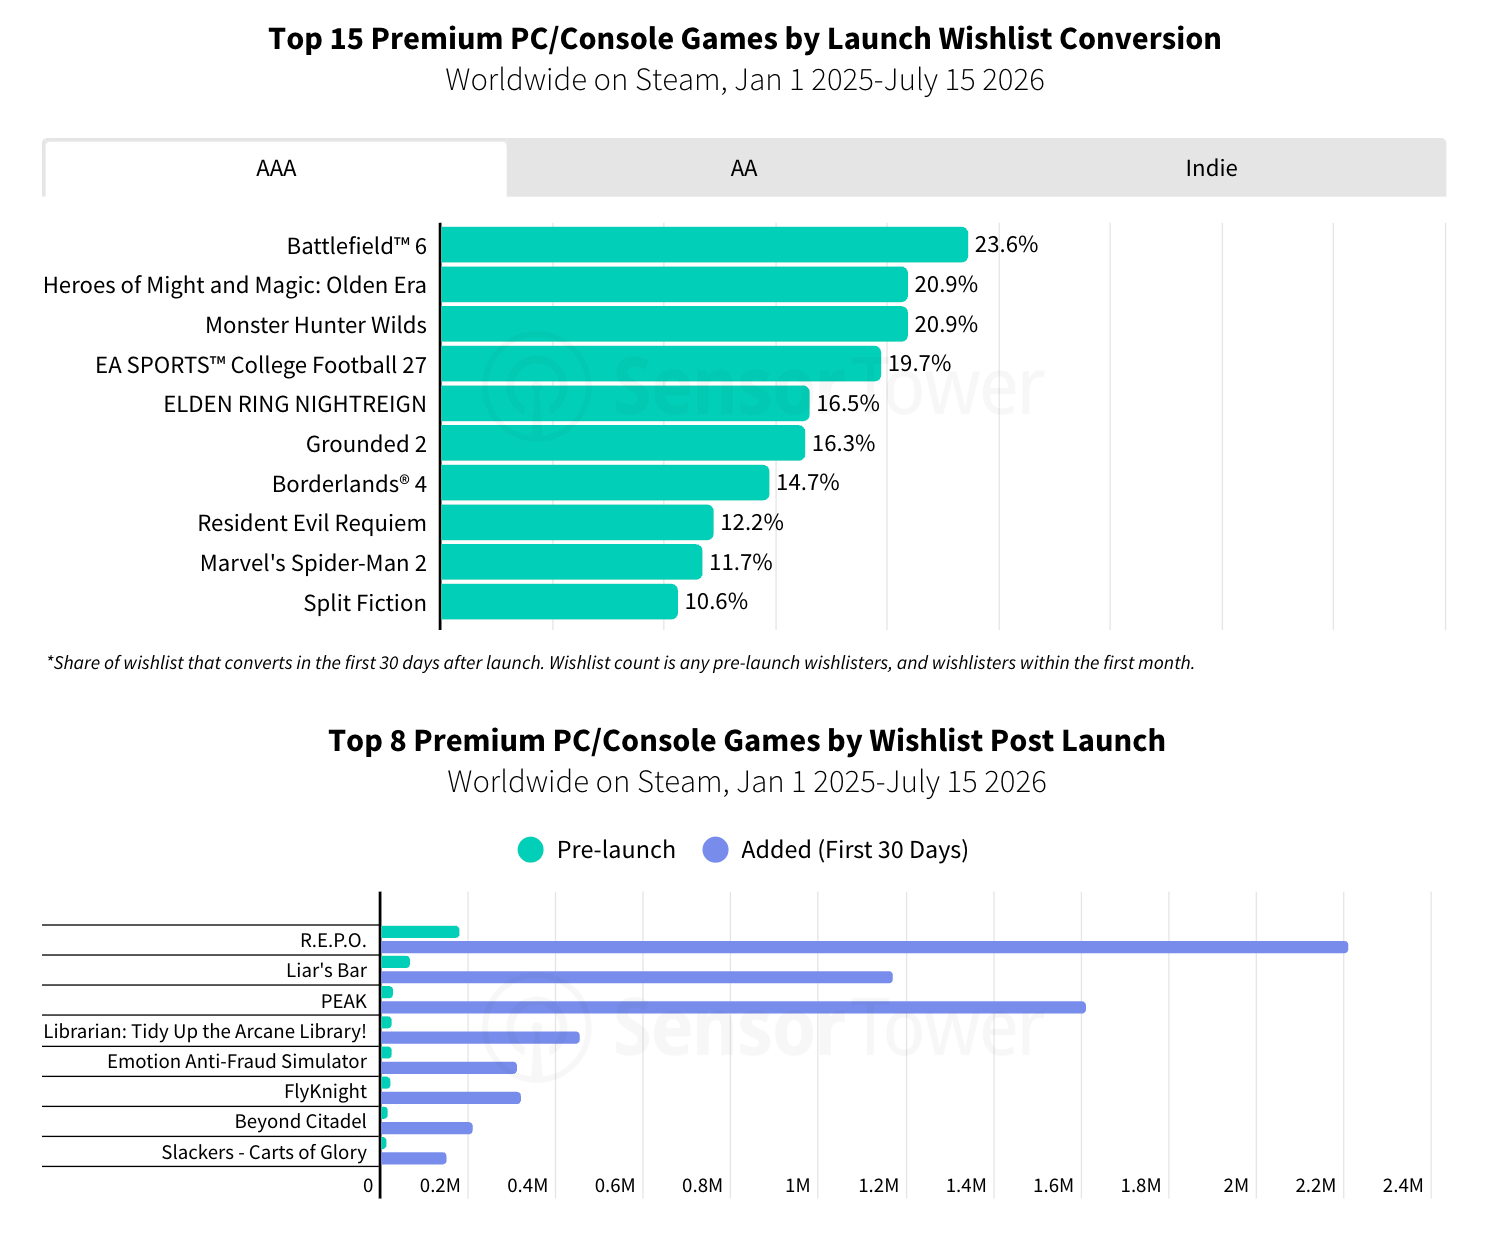
Sensor Tower calculated what share of wishlists converts into purchases in the first 30 days after launch (January 2025 - July 2026). Among AAA games, Battlefield 6 leads (23.6%); among AA, Hollow Knight: Silksong (34.1%); and among indie, Slay the Spire 2 (38.7%).


Indie and AA games generally convert more consistently than AAA. Sensor Tower analysts suggest that wishlisting a little-known game is a more deliberate decision than wishlisting a AAA release that everyone already sees.
Some games pick up wishlists after launch. R.E.P.O. had 178,000 wishlists before launch and added 2.21 million in the first 30 days. PEAK had 28,200 and 1.61 million, and Liar's Bar 65,500 and 1.17 million.


Games get the most wishlists during Summer Game Fest and The Game Awards. The leaders: Resident Evil Veronica (+799,000 during Summer Game Fest) and Total War: WARHAMMER 40,000 (+725,000 during The Game Awards 2025).


Steam Next Fest gives a smaller boost, and more indie projects rank at the top. At the February 2026 festival, Windrose led (+268,000).
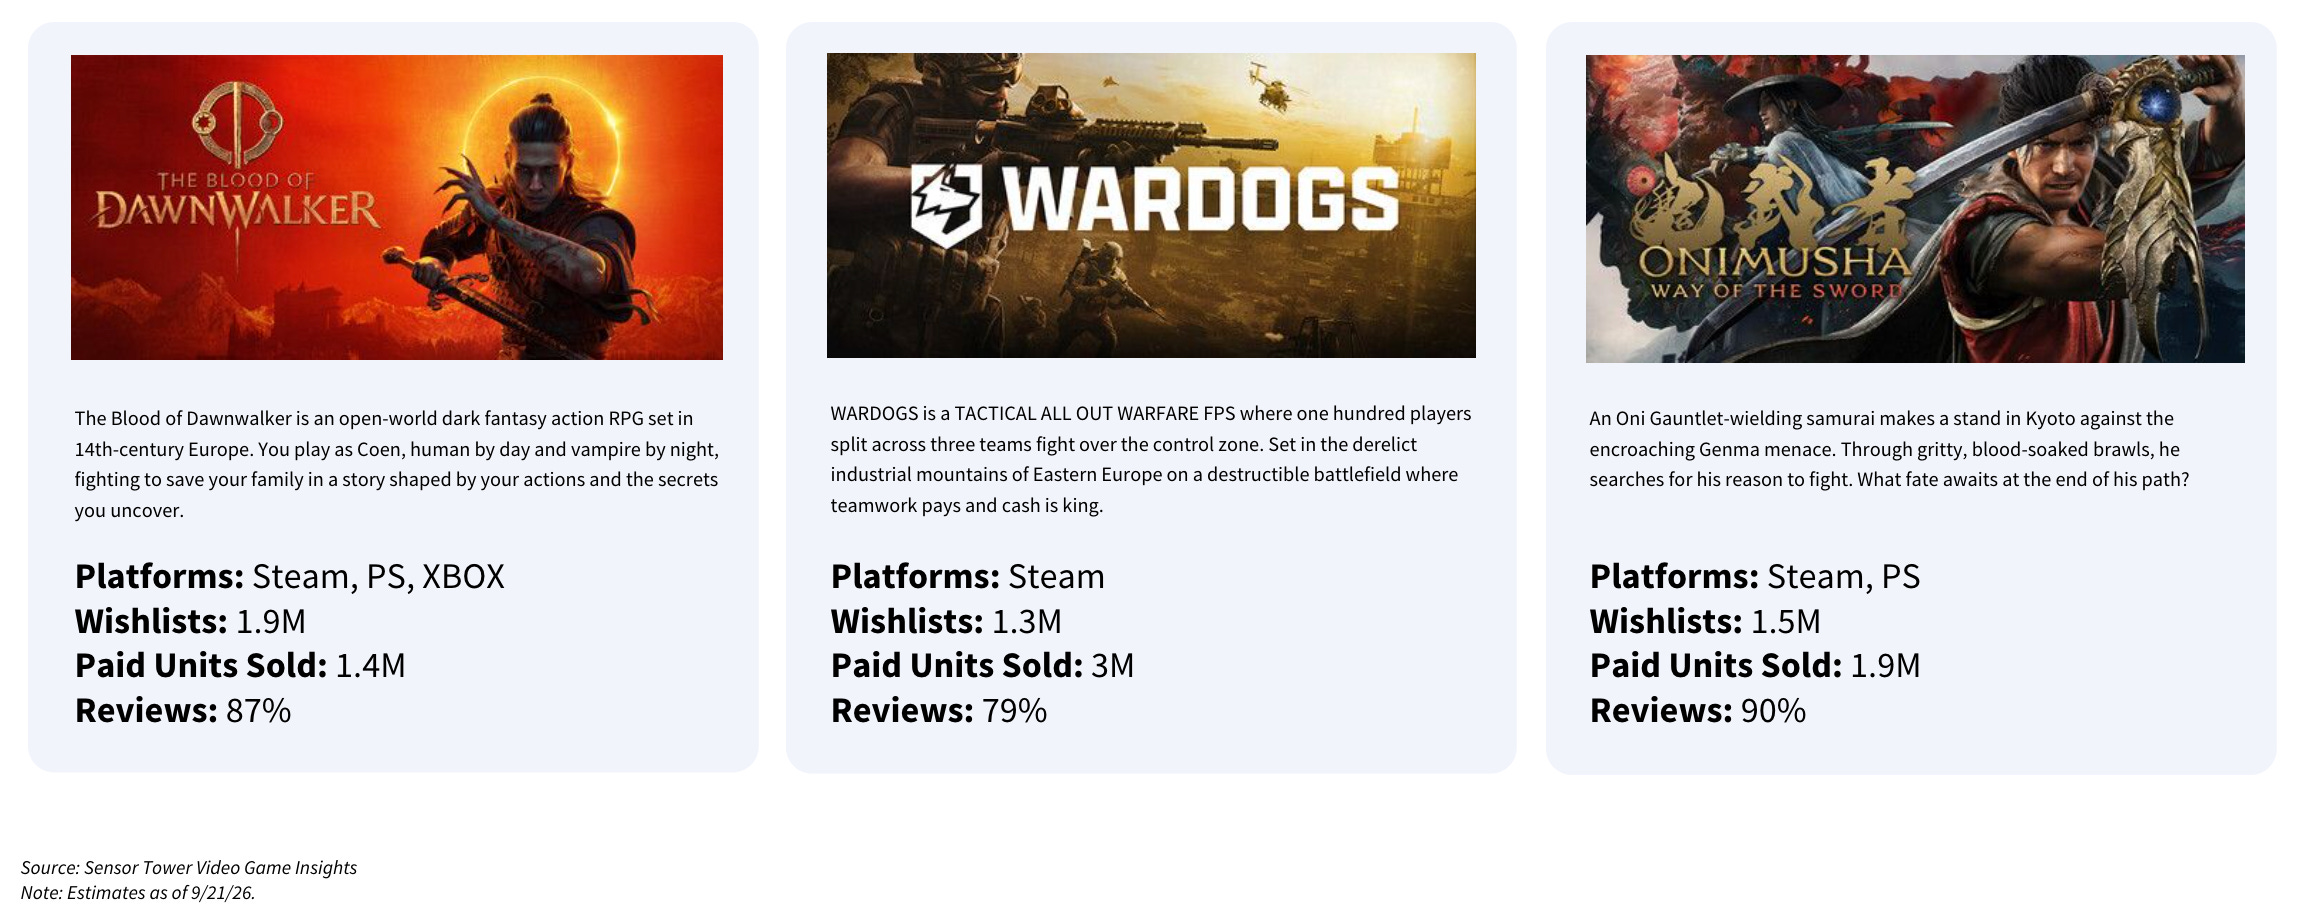
In September 2026, three new releases sold more than a million copies each, with 1M+ wishlists and 75%+ positive reviews. WARDOGS: 3 million copies, 1.3 million wishlists, 79% positive reviews. Onimusha: 1.9 million copies, 1.5 million wishlists, 90%. The Blood of Dawnwalker: 1.4 million copies, 1.9 million wishlists, 87%.
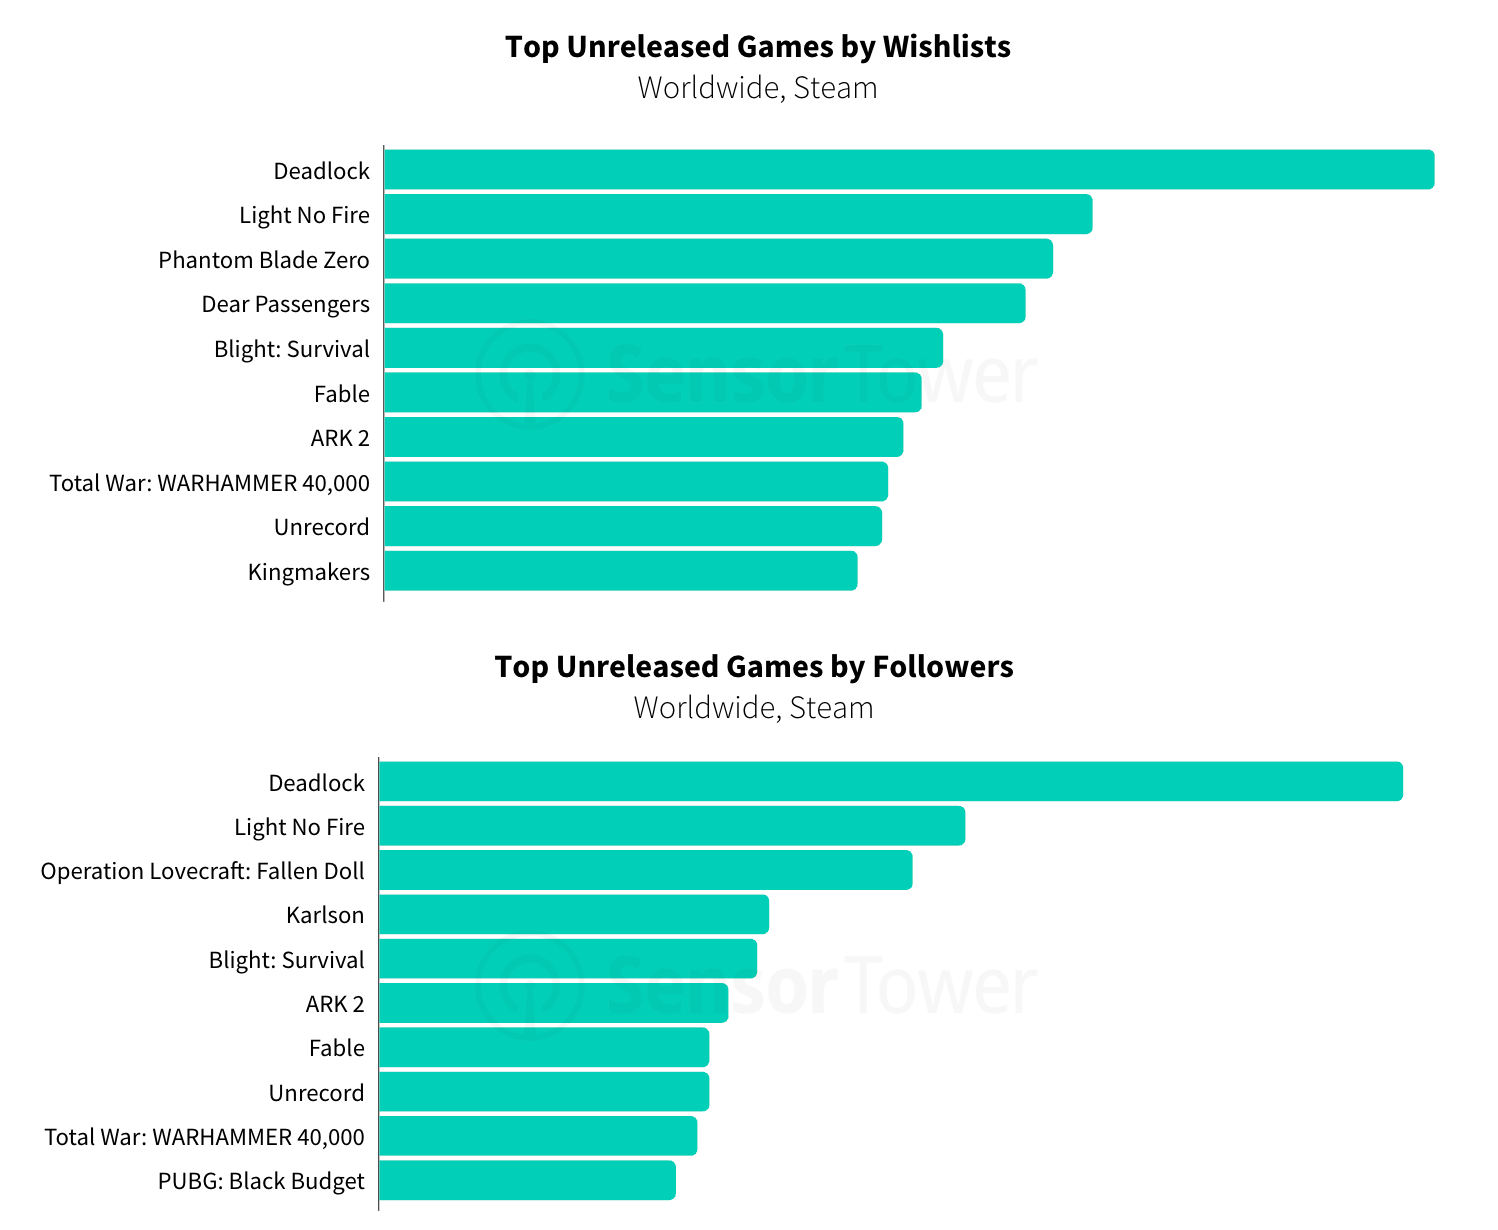
Among unreleased games, Deadlock leads Steam wishlists (3.44 million). A year ago, the game had 2.97 million wishlists. Light No Fire (2.32 million) and Phantom Blade Zero (2.19 million) follow.
Deadlock also leads in followers (428,000). Phantom Blade Zero, however, is only 15th by followers. Sensor Tower believes such games have high commercial intent but a weaker community. The opposite example is Operation Lovecraft: Fallen Doll: third by followers (223,000) and 30th by wishlists.
From concept art to launch-day marketing, most game studios rely on contractors in multiple countries. Mellow makes it simple to hire, pay, and stay compliant with talent in 150+ countries — no legal entity required.
Advertising
Pathmatics data. Each country includes only select ad channels, not the entire digital market. YoY changes are calculated only for channels with data available since August 2024.
Over 12 months (H2'25-H1'26), PC/console publishers spent $1.2 billion on digital advertising across 44 countries. In H1'26, they spent $535 million (-0.4% YoY).
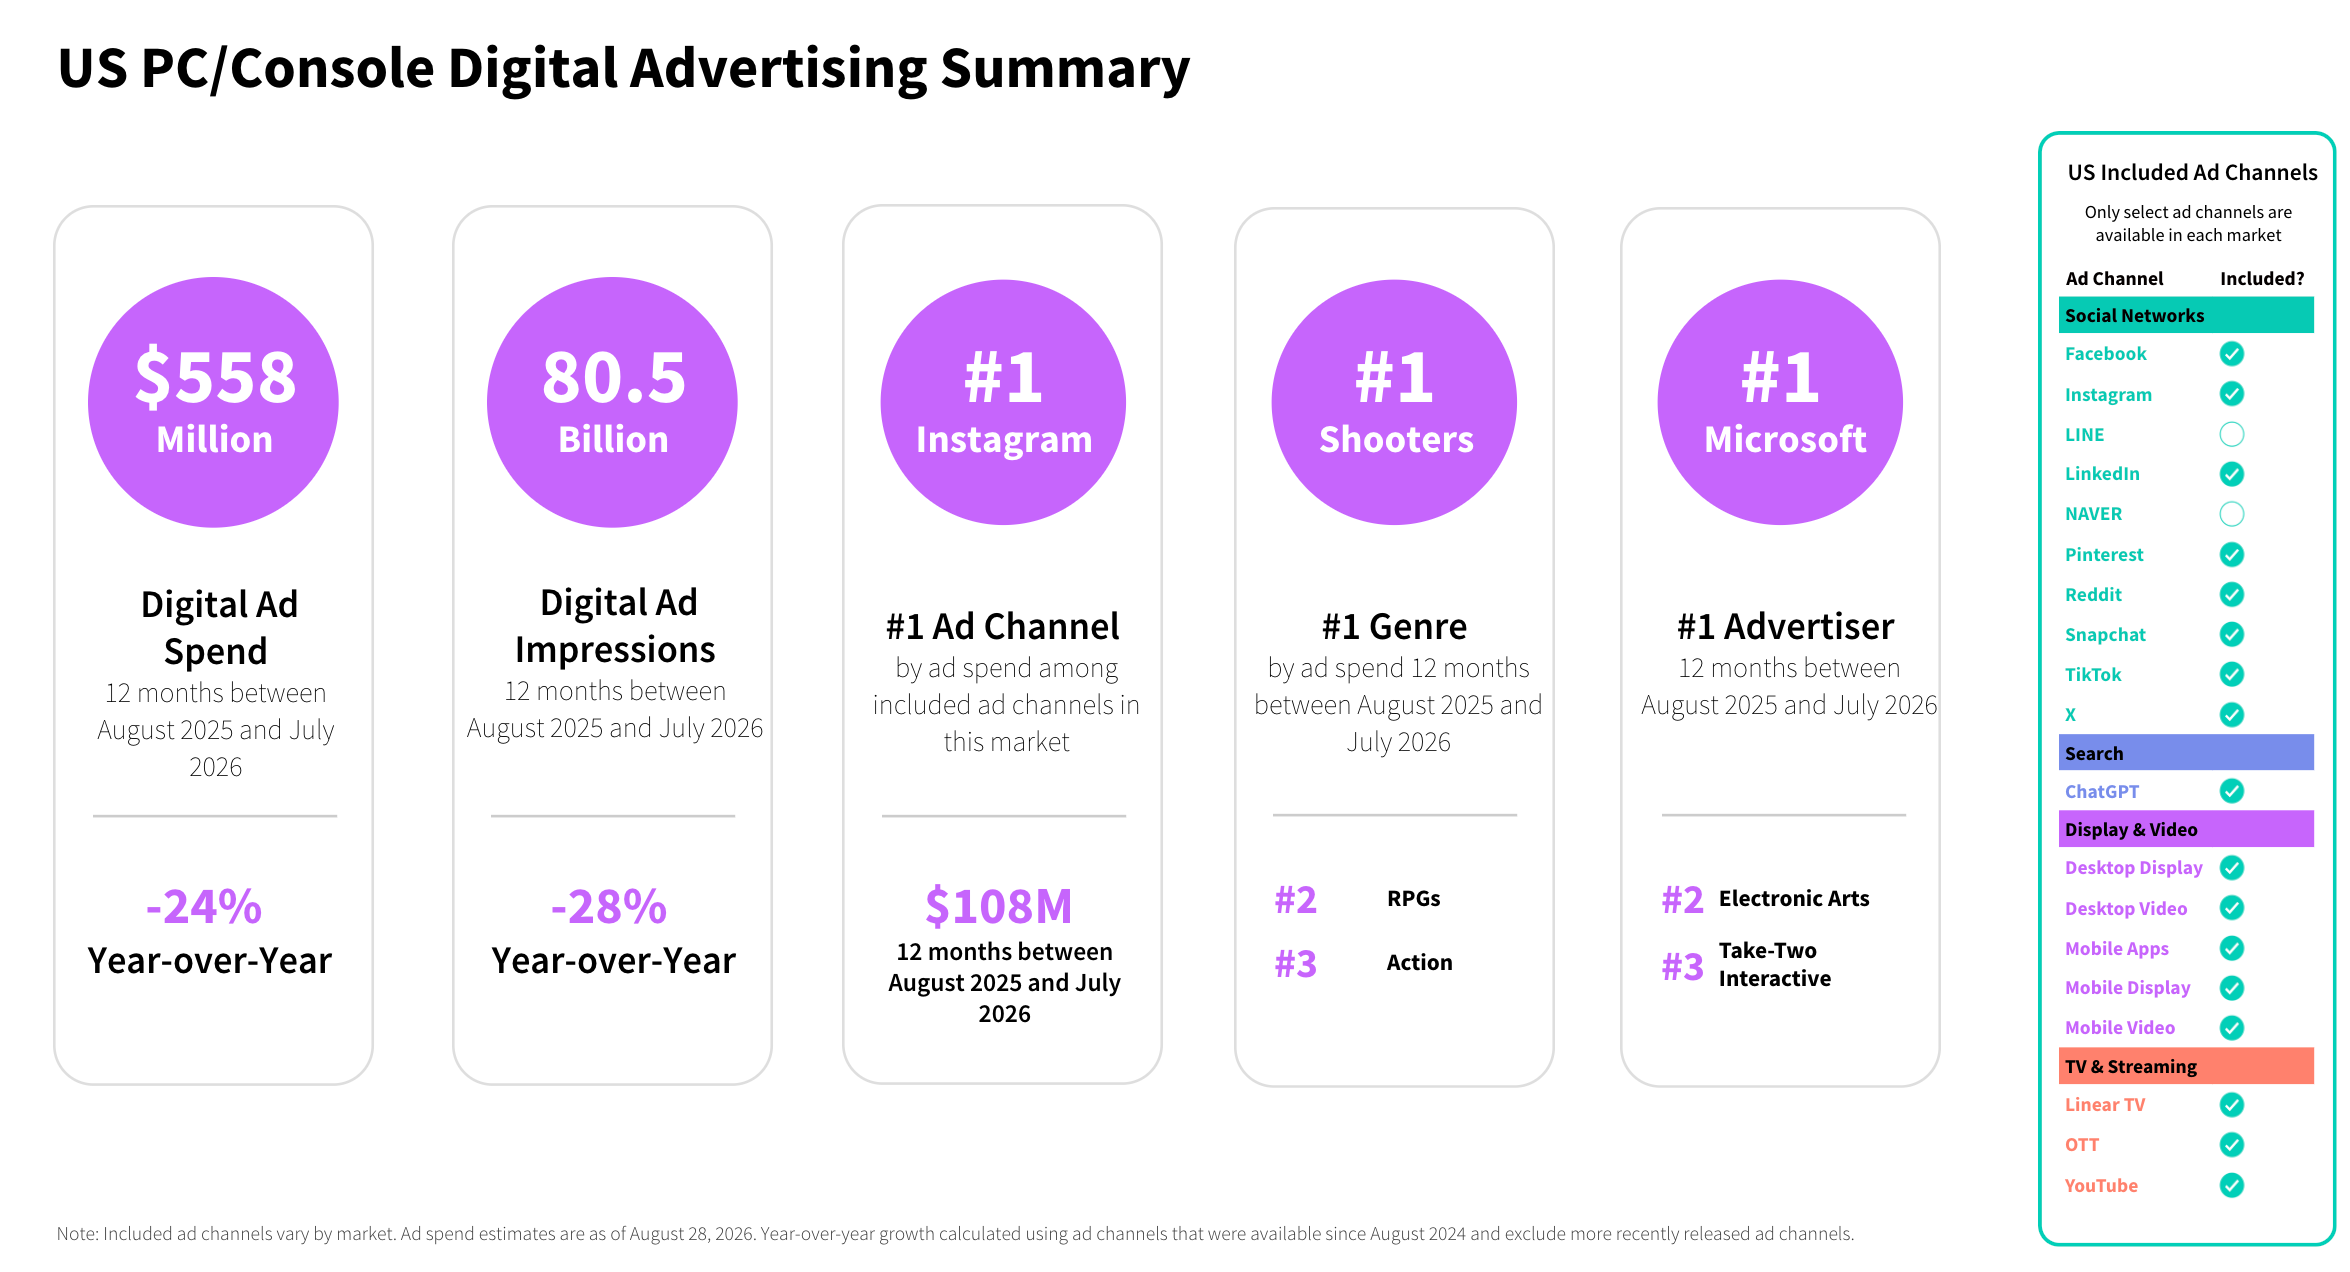
In the US, publishers spent $558 million on PC/console game advertising over 12 months (August 2025 - July 2026) (-24% YoY), with 80.5 billion impressions (-28% YoY). Microsoft is the largest advertiser, as it was a year ago, followed by EA and Take-Two. By genre, Shooter leads, followed by RPG and Action. Instagram is the largest channel ($108 million).


More than half of US social ad spend by PC/console publishers goes to Meta: Instagram has 28.4%, and Facebook 24.4%. YouTube has 23.5%, and TikTok 14.6%.
Reddit also stands out (4.8%). Sensor Tower notes that the platform's share in the PC/console segment is several times higher than Reddit's share among mobile games. On Meta and YouTube, short-form formats (Reels and Shorts) are growing.


The four biggest US advertisers among premium releases of the past 12 months are all shooters: Battlefield 6, Call of Duty: Black Ops 7, Borderlands 4, and Marathon. Sports, action, and other genres spend noticeably less.
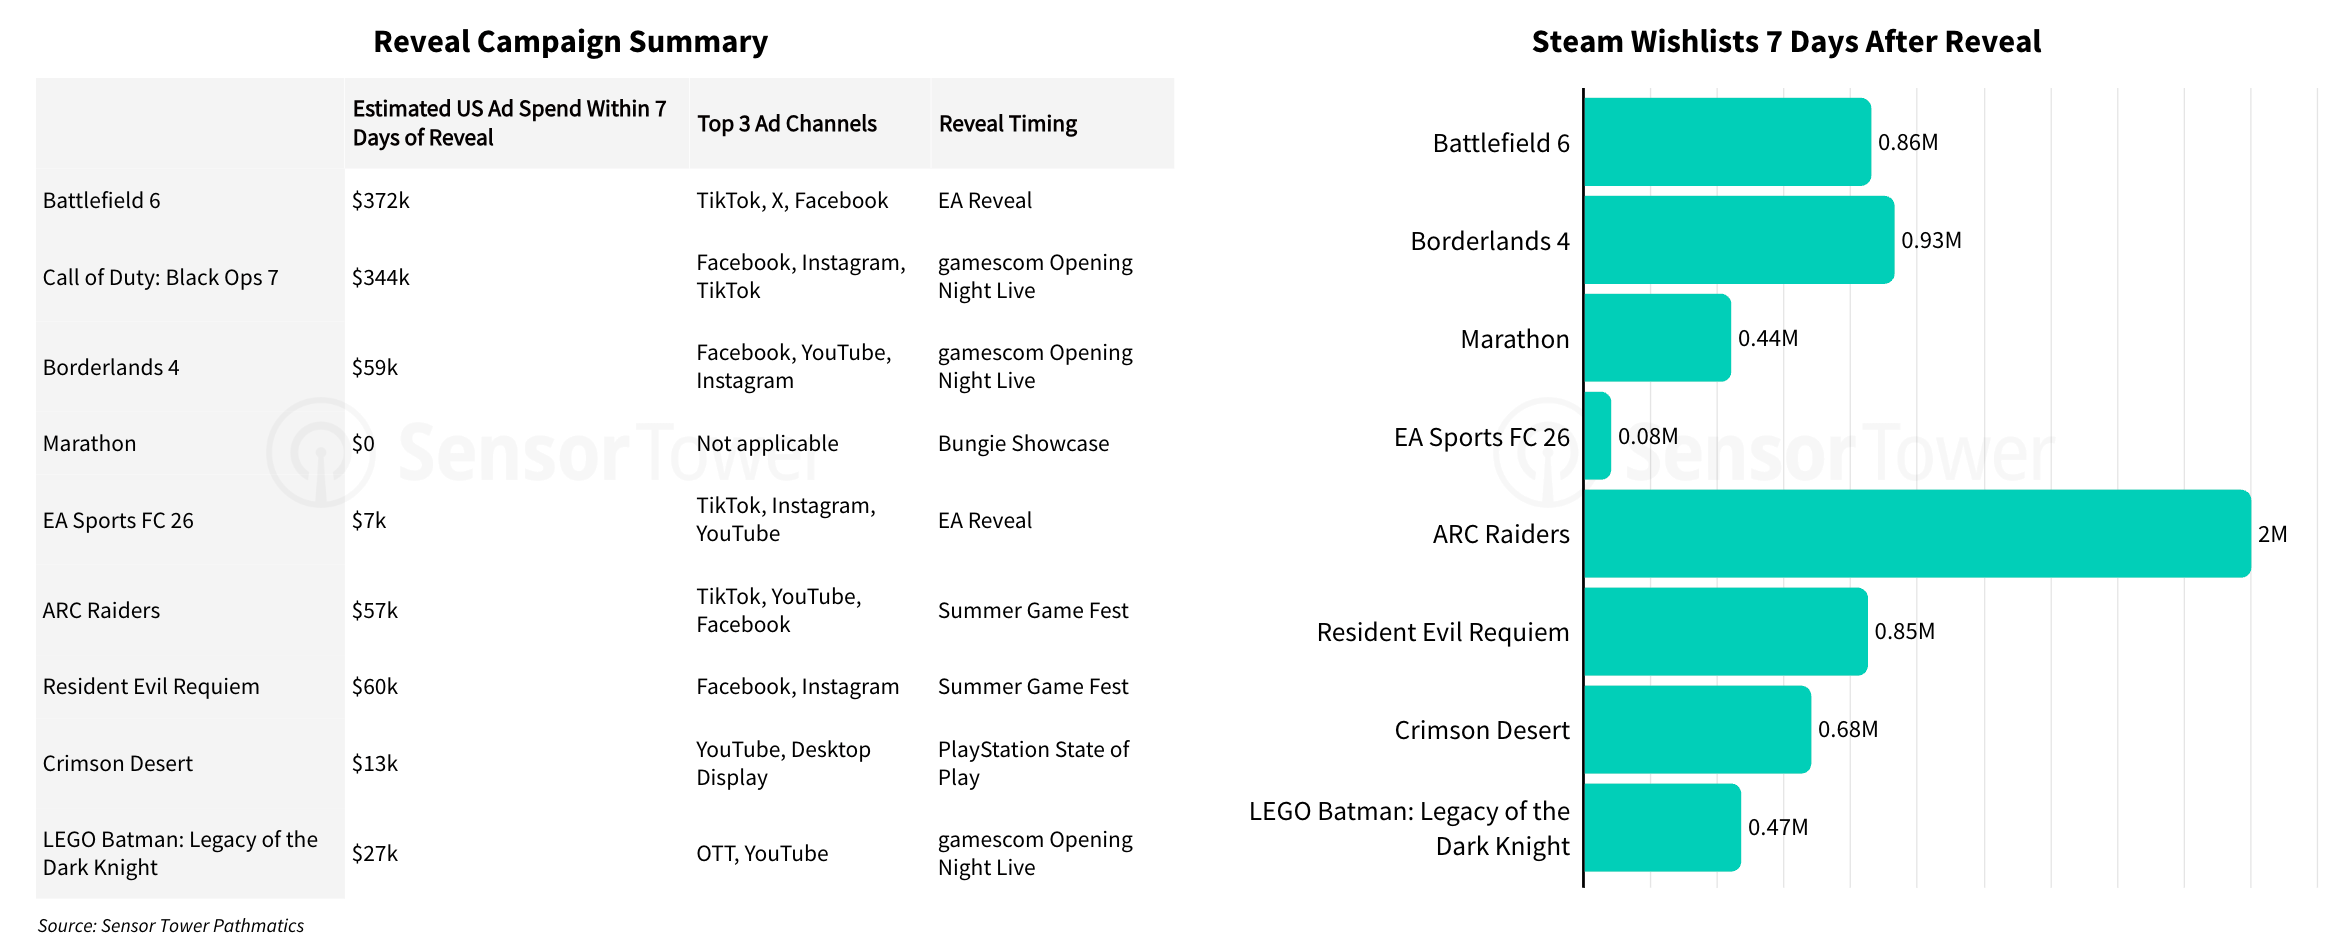
All nine games in the sample were revealed at events, and seven of them launched paid media the same week, almost entirely on social. Budgets are small: Battlefield 6 spent $372,000 in the week after its reveal, Black Ops 7 $344,000, and everyone else under $60,000.
Wishlist volume doesn't directly correlate with money spent. ARC Raiders got the most in the week after Summer Game Fest: 2 million wishlists on $57,000 of advertising. Borderlands 4 had 0.93 million, and Battlefield 6 0.86 million.


Most games start advertising 10-14 days before launch, and spend grows after release. Eight of the nine games spent more in the first two weeks after launch than in the two weeks before it.


The channel mix differs for everyone. Battlefield 6 and Black Ops 7 bet on TV, Marathon on TikTok the day after launch, and Borderlands 4 spent steadily on TikTok and Twitch. Resident Evil Requiem started buying heavily on Facebook only after launch.
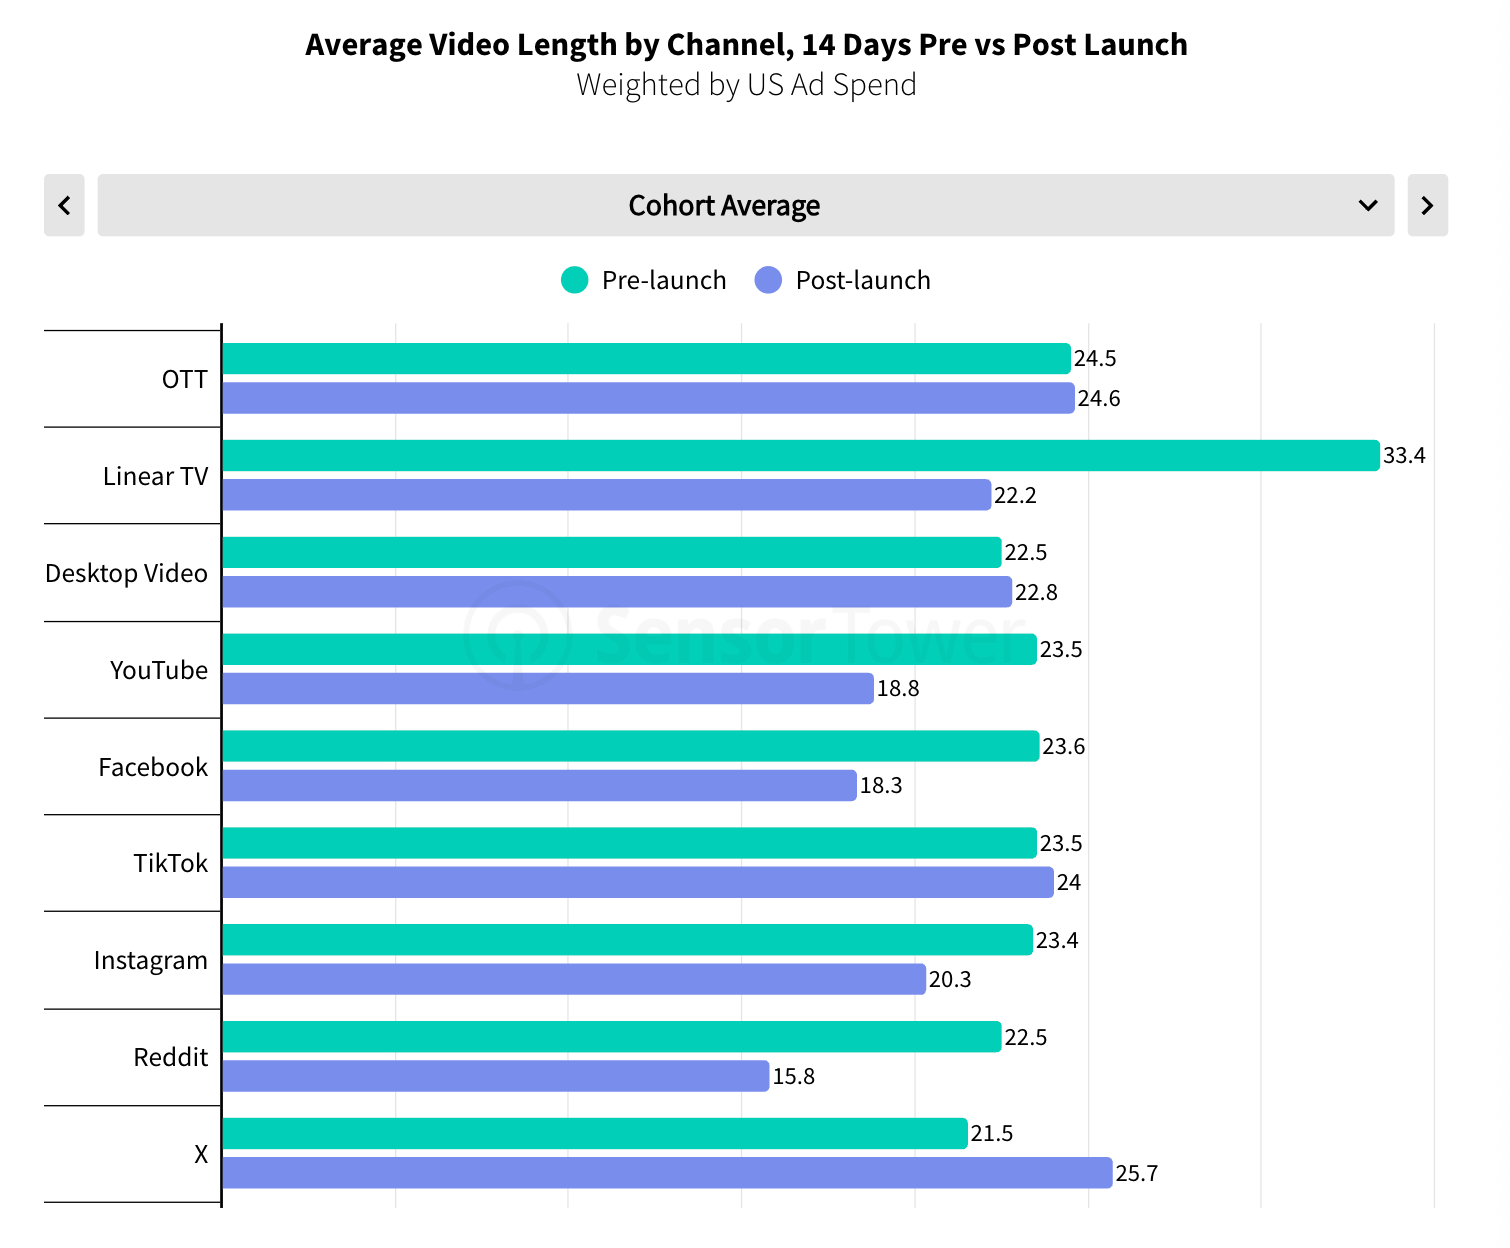
Video ads get shorter after launch: from ~25 to ~22 seconds on average. TV spots shrink the most, from 33 to 22 seconds. Battlefield 6 strongly influences this data, though: nearly $920,000 of its pre-launch TV budget went to 60-second spots.
Resident Evil Requiem's creatives changed over the campaign. At the reveal, Capcom used creator reactions to the trailer with a call to wishlist the game. Before launch, the top creative was a live-action spot that conveyed the game's atmosphere without showing the main characters. After launch, it was a PlayStation co-branded cutscene; two weeks later, it was a review-based cut.
Upcoming Releases
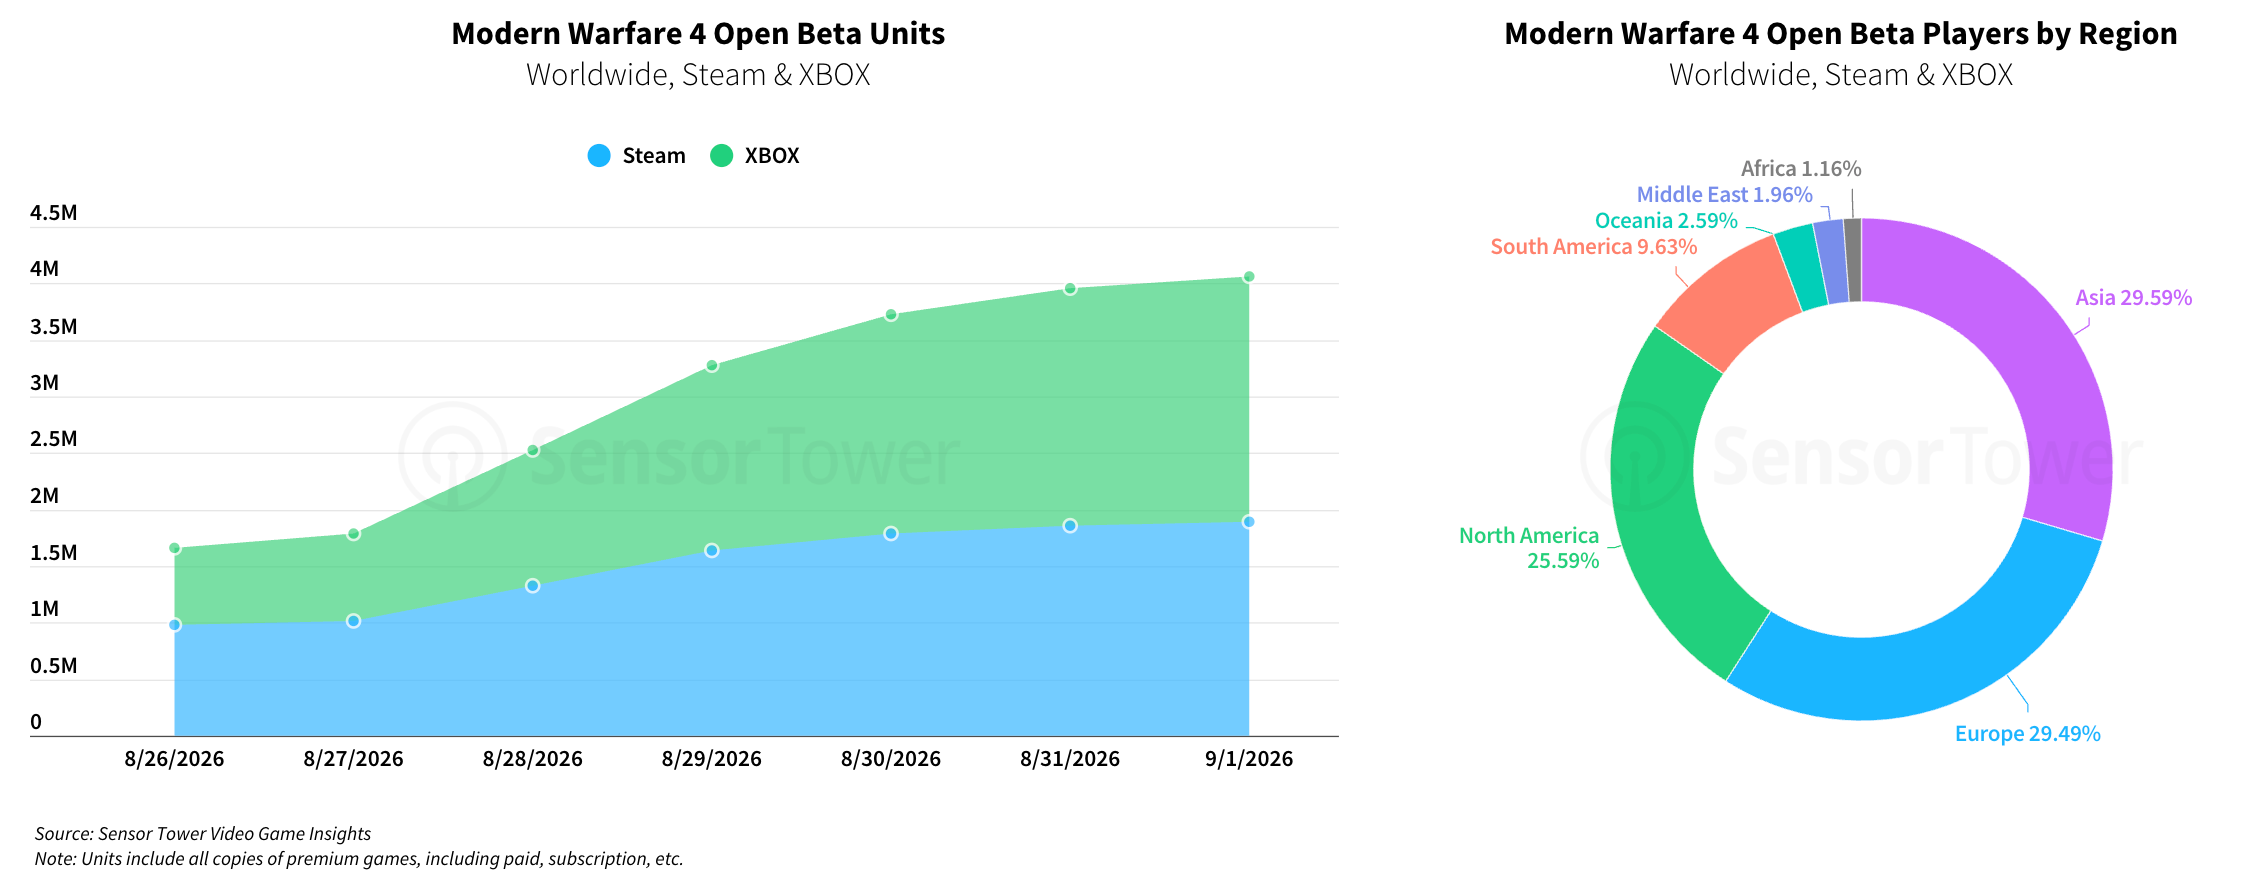
By early September, the Call of Duty: Modern Warfare 4 open beta had been downloaded ~4 million times on Steam and Xbox alone: 2.17 million on Xbox, and 1.89 million on Steam. Players were split between Asia (29.6%), Europe (29.5%), and North America (25.6%).


By early September, GTA VI pre-orders on PlayStation and Xbox had brought in ~$523 million (5.3 million copies): ~$402 million on PlayStation (4.1 million copies), and $121 million on Xbox (1.2 million copies).
89% of pre-orders are the $100 Ultimate Edition; the base version accounts for 10%.
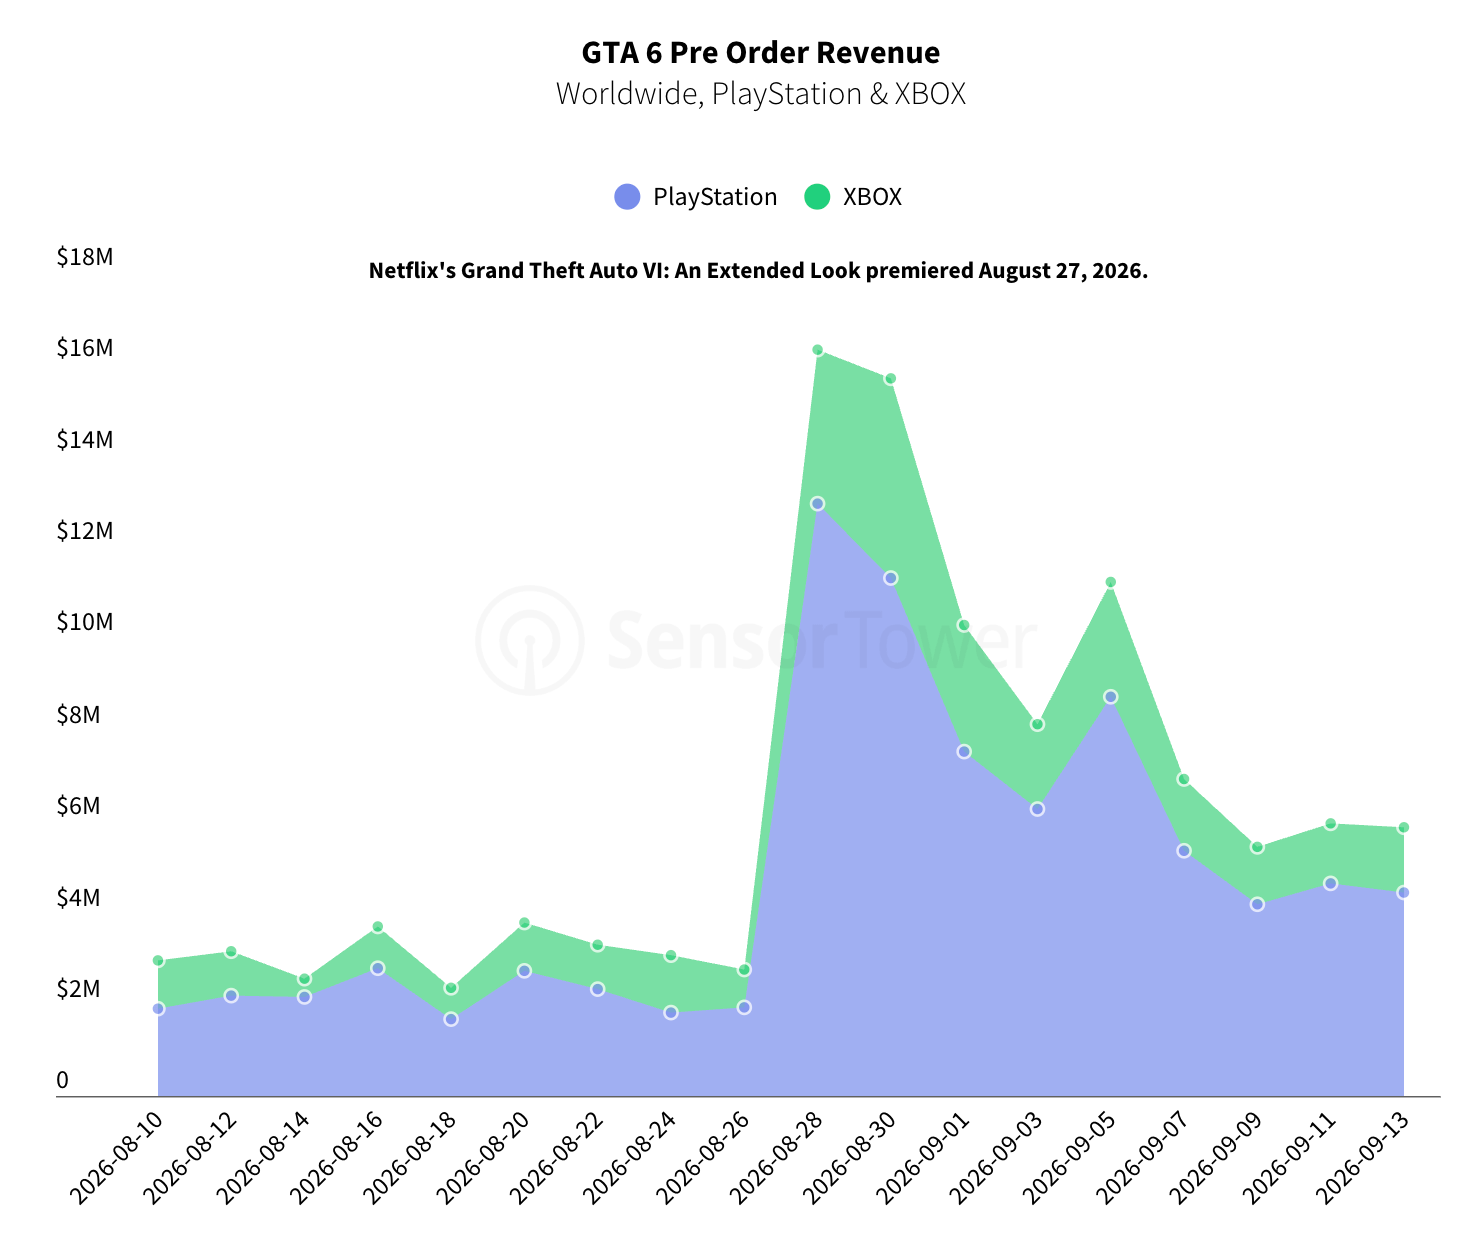
After the Grand Theft Auto VI gameplay showcase premiered on Netflix on August 27, daily pre-order revenue jumped ~6x: from $2.4-3.8 million on average in August to $16.3 million the next day. By mid-September, sales had dropped to ~$5.9 million, but that is still almost double the August level.
PlayStation's share of pre-order revenue grew from ~71% to ~76% over that period. Sensor Tower specifically notes that the trailer was captured on PlayStation 5.
Adjust: The Mobile Market of Türkiye in 2026
Adjust has released its annual report on Türkiye’s app market. It covers three verticals: games, finance, and e-commerce, plus a separate chapter on AI apps.
As usual, I’ll focus on games, but I’ll also cover the other segments shortly.
Adjust’s data covers the top 5,000 apps from January 2024 to July 2026. MENAT stands for the Middle East, North Africa, and Türkiye. Adjust counts by genre separately: for example, a puzzle game can be either a hypercasual or a mid-core project.
Market
87.7 million people live in Türkiye. 81.9 million have a mobile connection (93.3%), and 77.5 million use the internet regularly (88.3%). The country's median age is 33.5.
Turkish developers earned $2.76 billion from mobile games worldwide in 2025. In 2020, the figure was $504 million. Over that period, Turkish companies’ share of the global mobile games market grew from 1% to 5%.
A word from our sponsor

Game studios run on contractors — artists, composers, QA testers, translators — often spread across a dozen countries. That’s a lot of contracts, tax rules, and IP clauses to track. Mellow handles all of it: compliant contracts, automated payments, and IP protection built in, for contractors in 150+ countries.
Domestically, however, players spent only $347 million on mobile games. Türkiye’s local market is relatively small.
Dream Games earned $1.7 billion in 2025. Royal Match and Royal Kingdom have generated more than $5.2 billion combined since launch.
❗️Adjust cites the revenue figures from AppMagic. I covered Turkish developers extensively in my recap of the AppMagic & Gamigion report.
Games
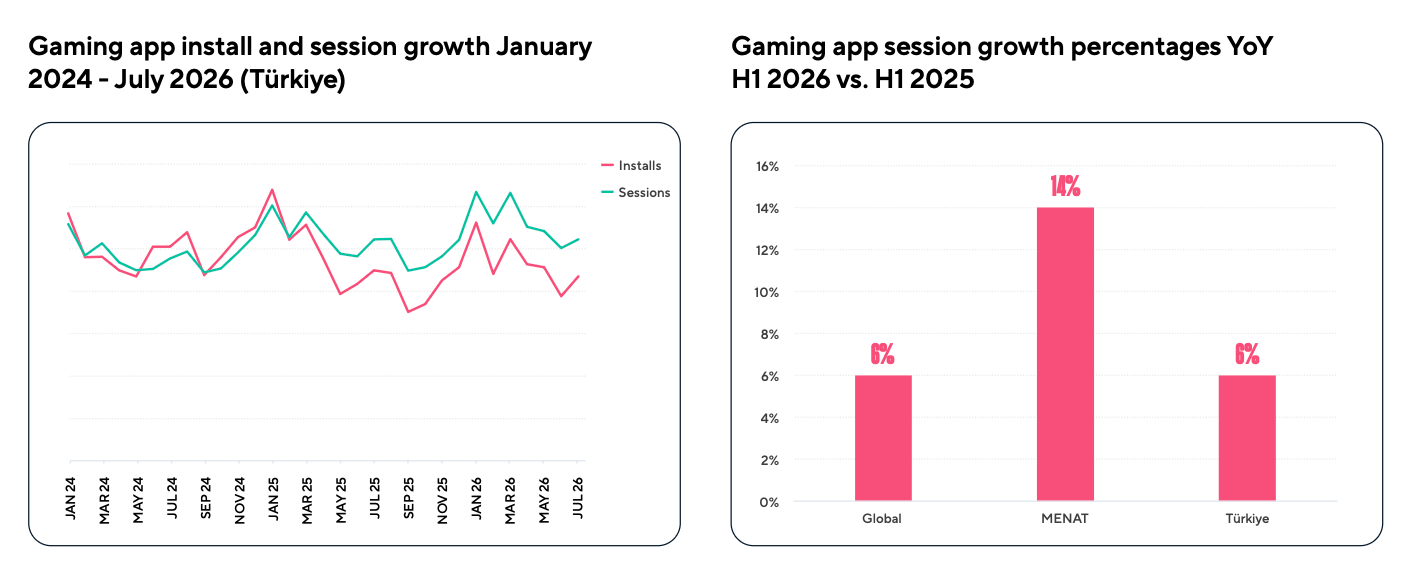
The number of mobile gaming sessions in Türkiye grew 6% YoY in H1’26. That matches the global rate, while MENAT grew 14%.
❗️In last year’s report, Adjust reported +12% in sessions and +4% in installs for Türkiye in H1’25. Globally, sessions grew 2%, and MENAT grew 9%.
January and March are the peak months in Türkiye. In January 2026, installs were 19% above the H1’26 average, and sessions 11% above. March was +11% on both metrics. A year earlier, January installs were 40% above the annual average, and sessions 17% above.
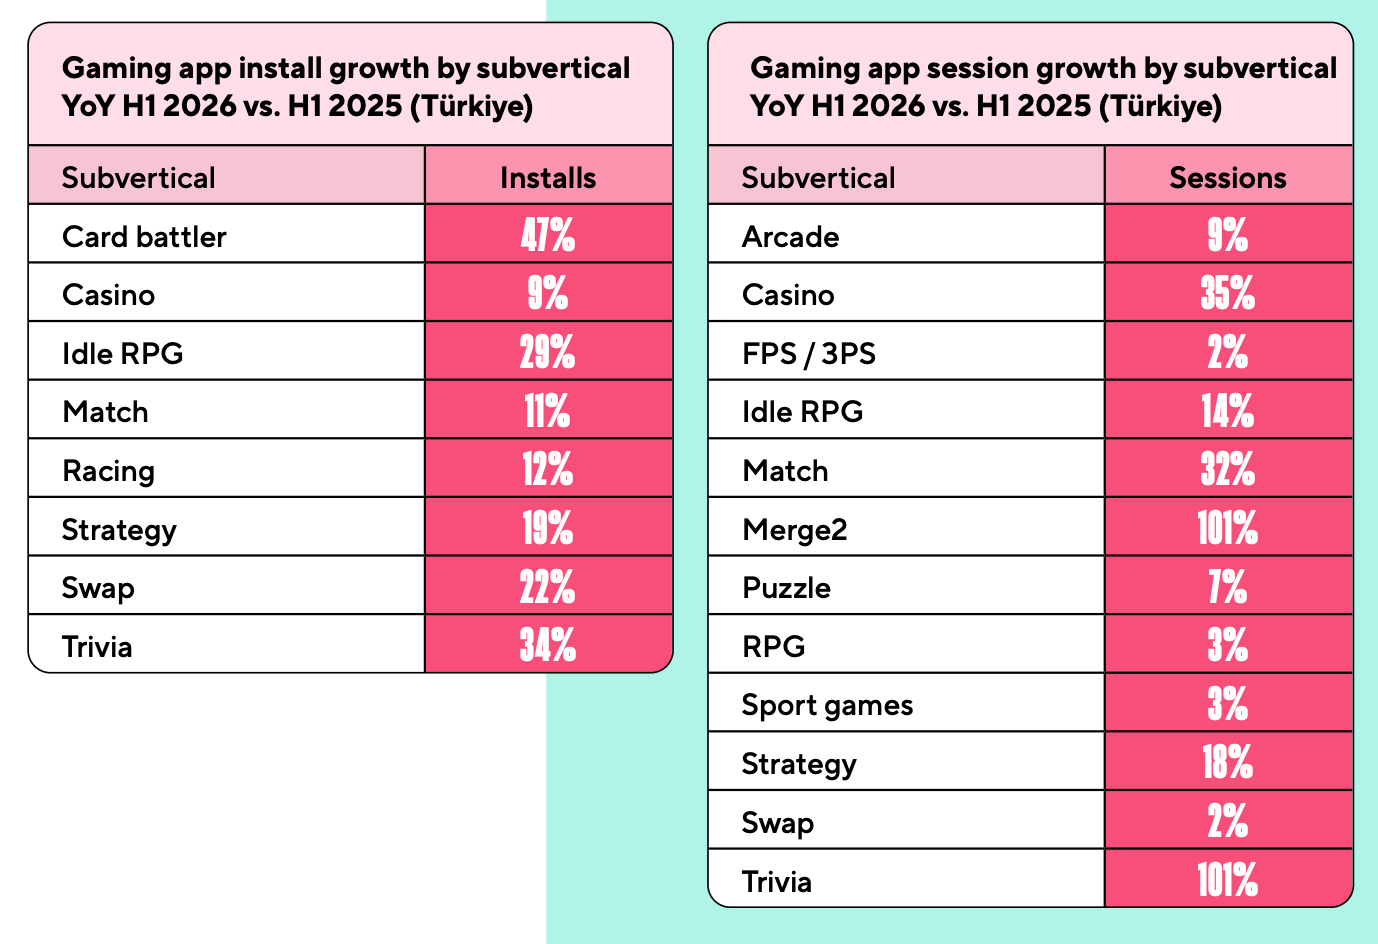
Among genres, card battlers (+47% YoY), Trivia (+34%), and Idle RPG (+29%) grew fastest in installs in H1’26.
❗️It looks like Adjust only shows growing segments in its tables. For example, hybrid casual and hypercasual games are missing from the installs-by-genre table.
In sessions, Merge 2 and Trivia lead (+101% YoY each), followed by casino (+35%).
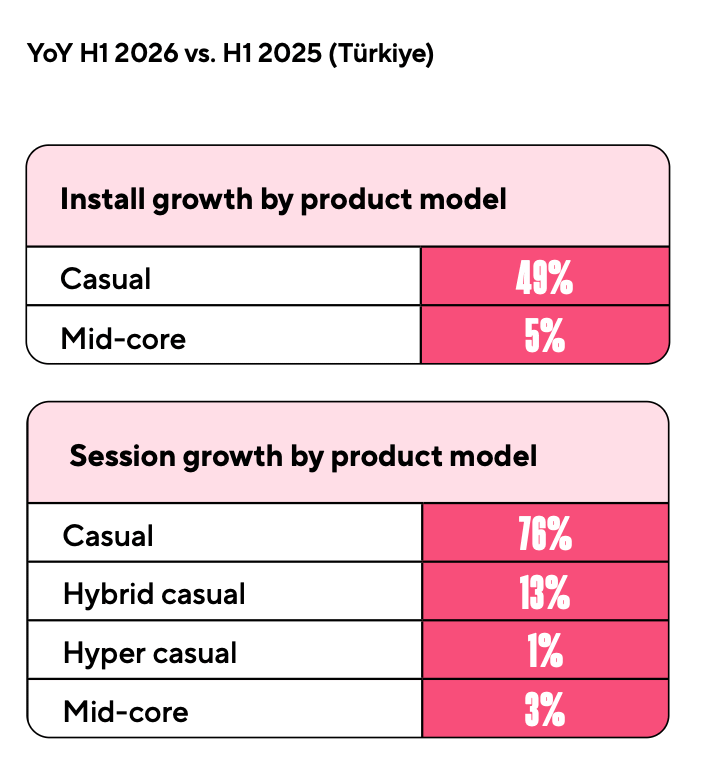
Casual game installs grew 49% YoY, and sessions 76%. Mid-core growth was more modest: +5% in installs and +3% in sessions. Session growth was 13% for hybrid casual games and 1% for hypercasual.
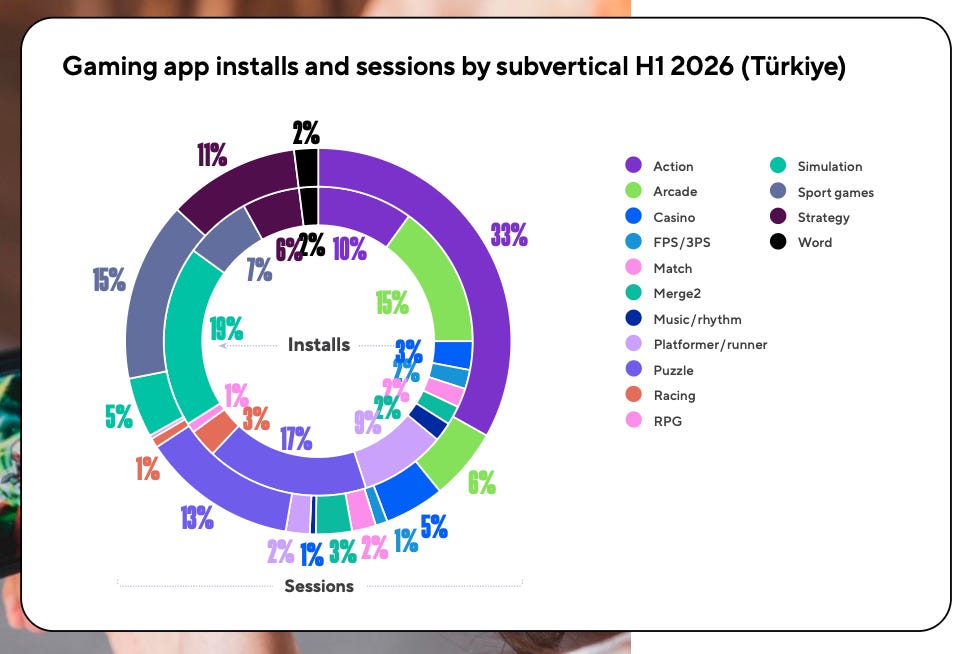
By share of installs in the country, simulation (19%), puzzle (17%), and arcade (15%) lead.
Action accounts for 33% of all gaming sessions in Türkiye, with just 10% of installs. Sports games have 7% of installs and 15% of sessions.
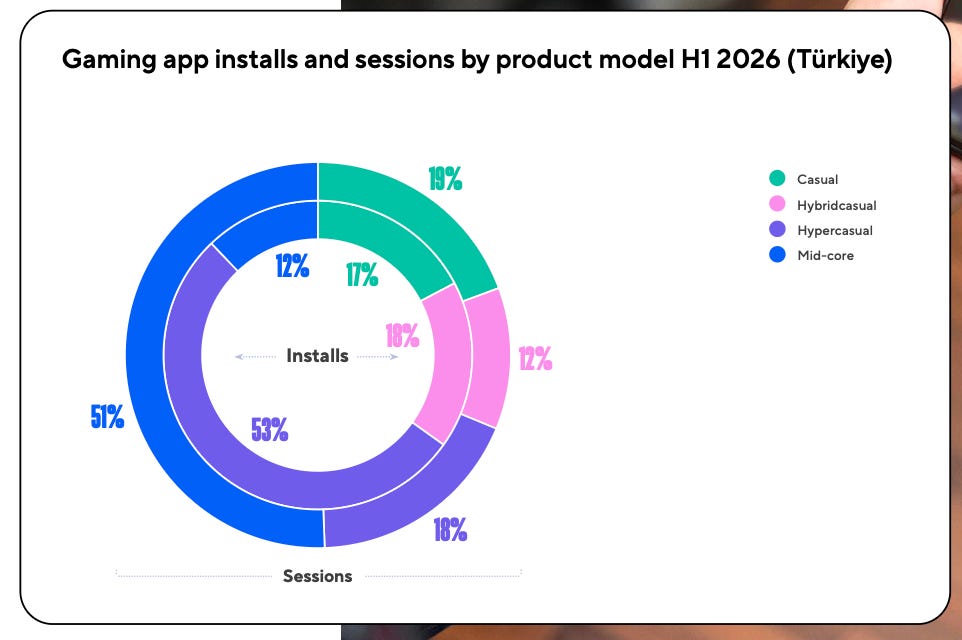
By segment, the gap is even wider. Mid-core games have 12% of installs and 51% of sessions. Hypercasual projects are the opposite: 53% of installs and 18% of sessions.
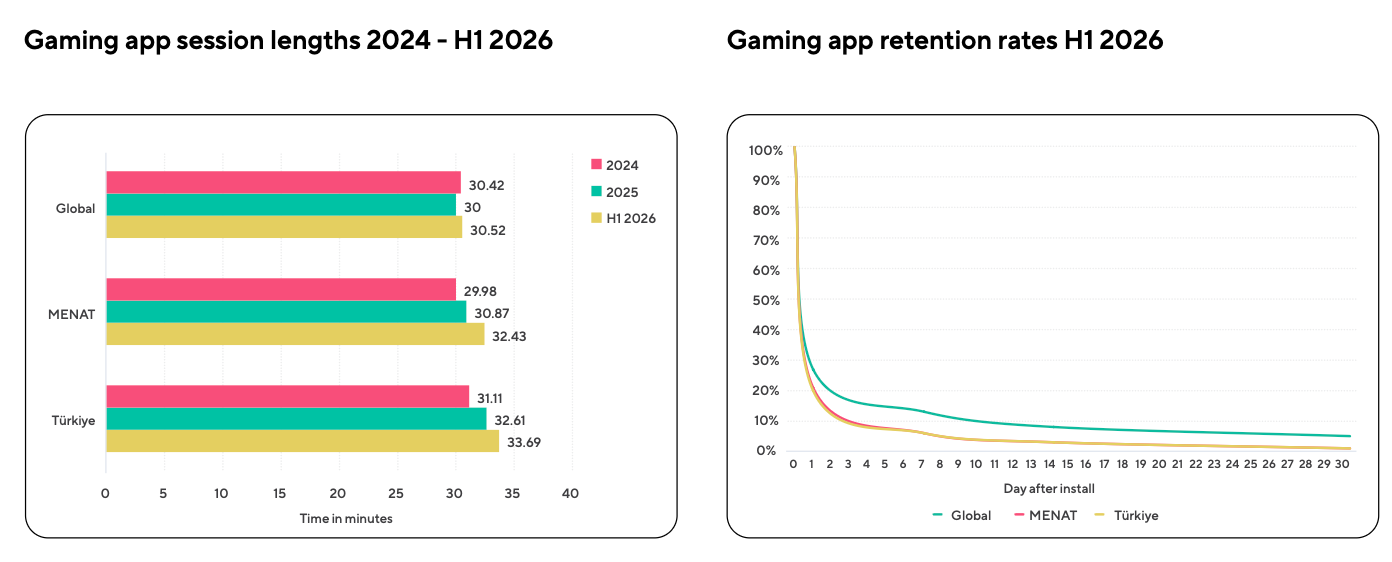
The average gaming session length in Türkiye has grown for the third period in a row. In H1’26, it was 33.69 minutes, up from 32.61 in 2025 and 31.11 in 2024. MENAT averaged 32.43 minutes in H1’26, while the global average was 30.52.
D1 Retention for games in Türkiye in H1’26 was 20%, D7 6%, D14 3%, and D30 1%. Global figures are higher: 27% on D1, 13% on D7, and 5% on D30. MENAT D1 Retention was 21%.
❗️A year earlier, in H1’25, Türkiye had 19% D1 and 5% D7 Retention, versus 26% and 12% globally. These are market averages. Top games get D1 Retention above 50%, so you shouldn’t benchmark against averages.
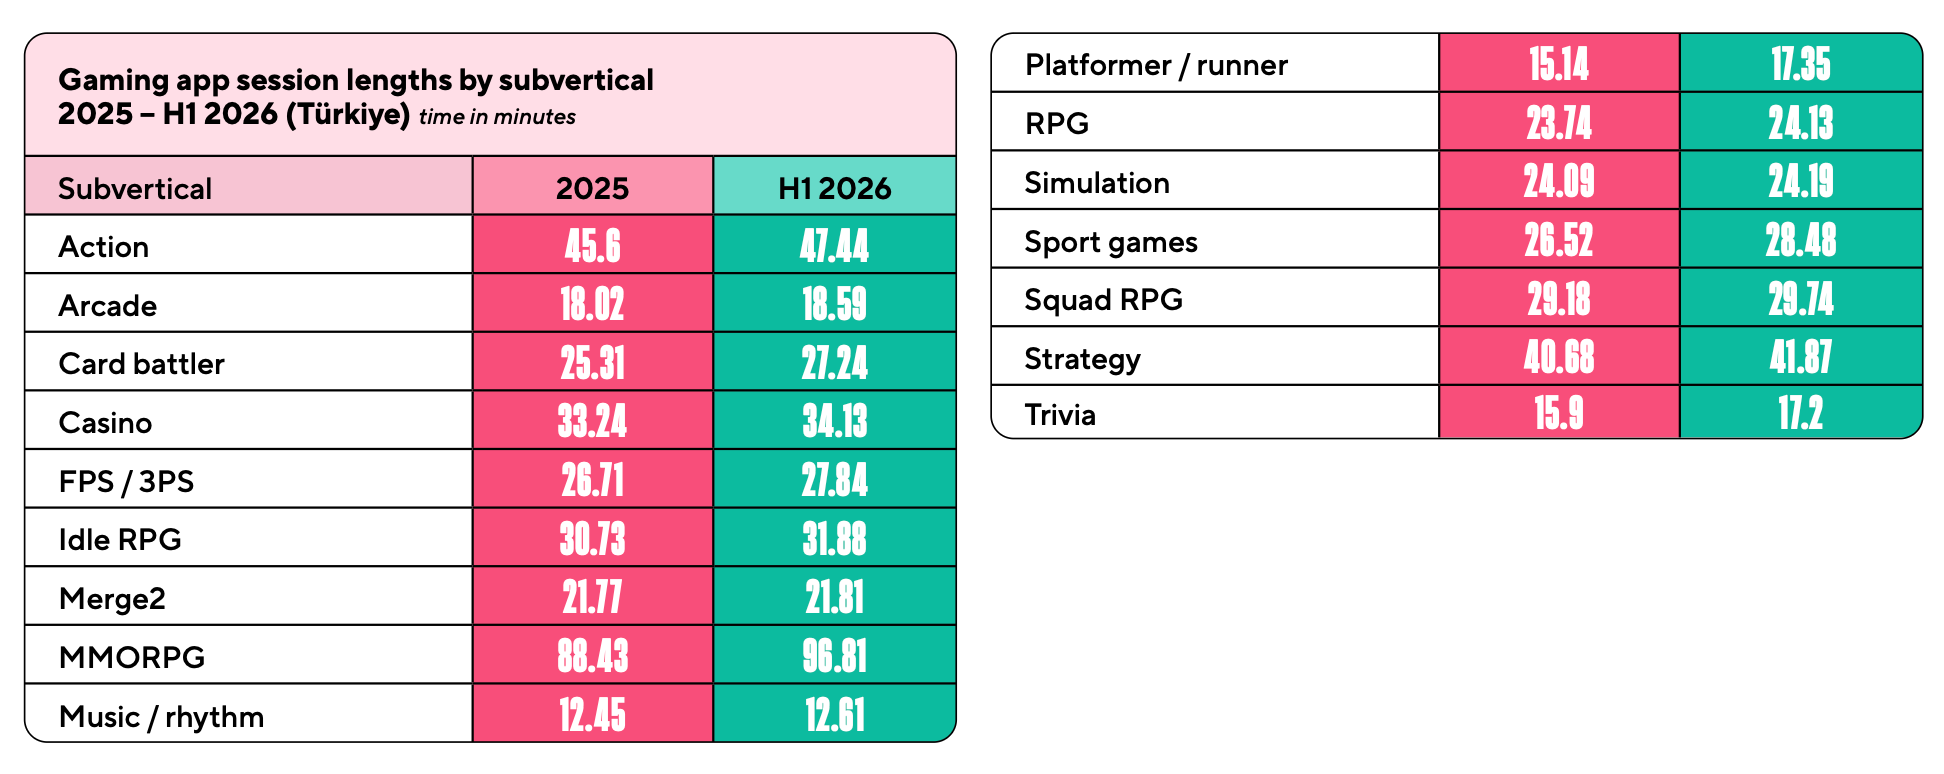
MMORPGs have the longest sessions in Türkiye: 96.81 minutes in H1’26 (88.43 minutes in 2025). Action (47.44 minutes) and strategy (41.87 minutes) follow.
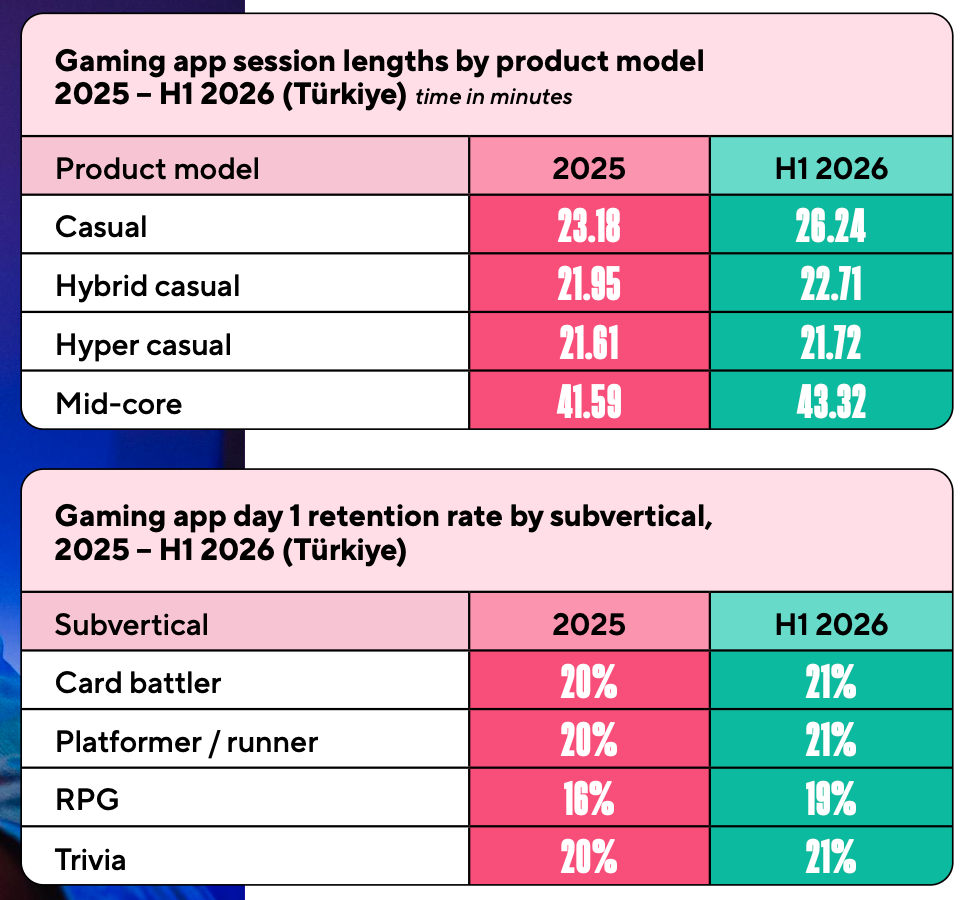
By segment, mid-core games have the longest sessions at 43.32 minutes (41.59 in 2025). Casual projects saw the biggest increase: from 23.18 to 26.24 minutes.
RPG D1 Retention rose from 16% in 2025 to 19% in H1’26. Card battlers, platformers, and Trivia are at 21% (20% a year earlier).
Other Verticals
According to Sensor Tower data cited by Adjust, generative AI app downloads in Türkiye grew 149% YoY in 2025, to 82.9 million. Time spent grew 375% (to 926 million hours), and revenue rose from $15 million to $50.2 million. ChatGPT leads in downloads.
A word from our sponsor
Game studios run on contractors — artists, composers, QA testers, translators — often spread across a dozen countries. That’s a lot of contracts, tax rules, and IP clauses to track. Mellow handles all of it: compliant contracts, automated payments, and IP protection built in, for contractors in 150+ countries.
Codeway and HubX stand out among Turkish AI app developers. Codeway has more than 60 AI apps and 600+ million downloads. In August 2026, HubX raised up to $75 million from Point72 Private Investments and became Türkiye’s eighth unicorn.
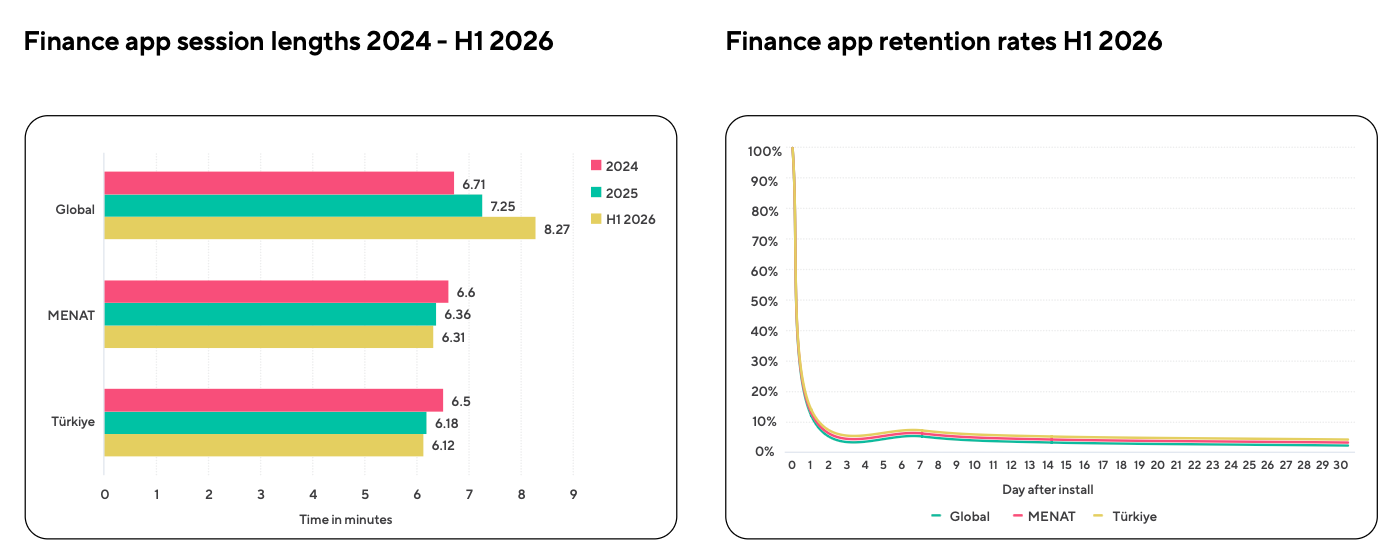
Finance apps in Türkiye are growing slower than the market: +2% in sessions in H1’26 vs. 12% in MENAT and 29% globally. Stock trading apps grew fastest: +41% in installs and +43% in sessions.
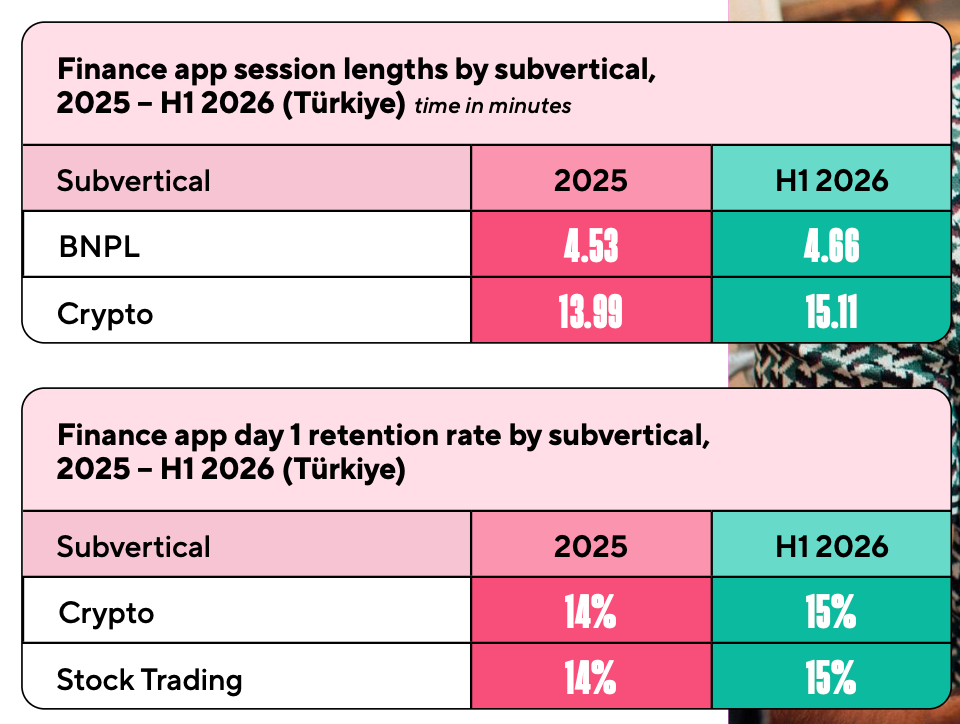
Finance, though, is the only vertical in the report that beats both MENAT and the global benchmark on daily retention. D1 Retention is 14% (13% in MENAT, 12% globally), and D30 is 4% (2% globally).
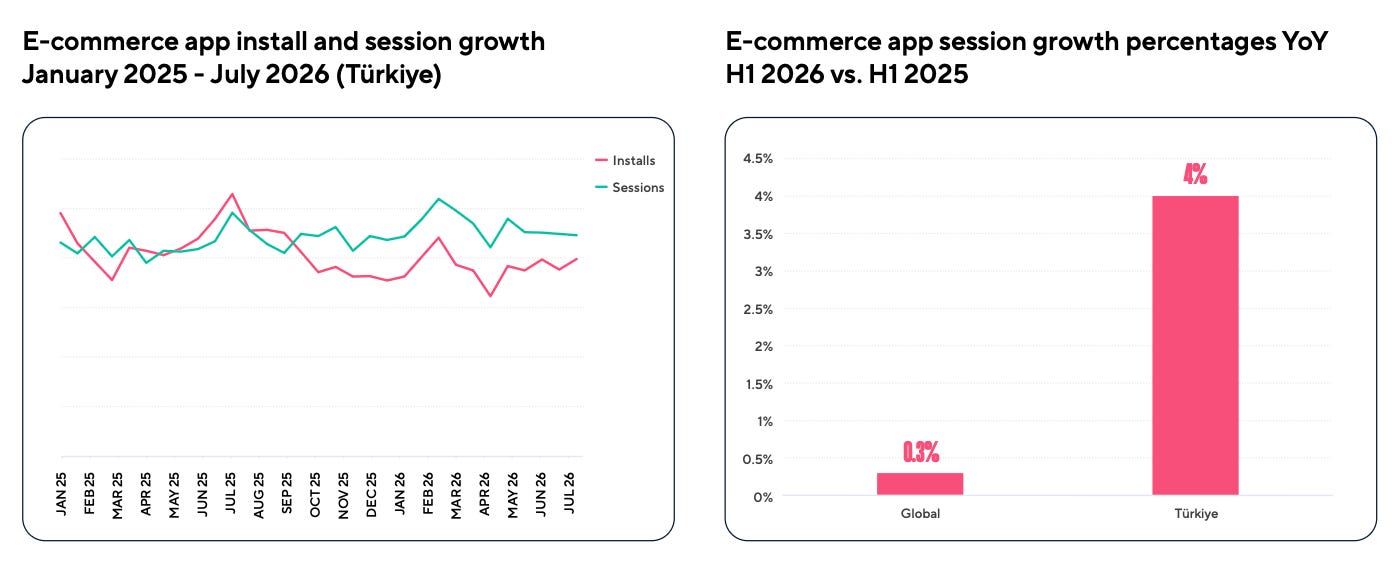
E-commerce app sessions in Türkiye grew 4% YoY in H1’26, versus 0.3% globally. The country’s e-commerce market itself grew 52.2% YoY in 2025, to $115.43 billion.
GameDiscoverCo: How Players of Different Ages Discover New Games
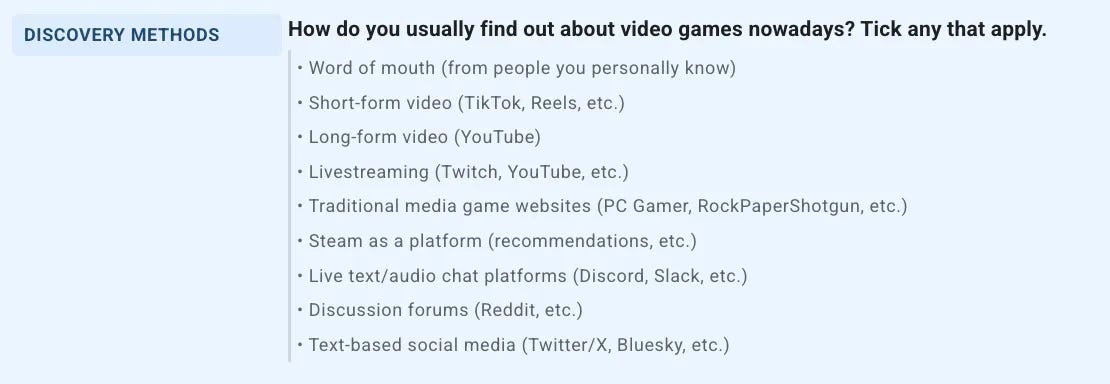
GameDiscoverCo surveyed 16,152 Steam players worldwide. Respondents could select multiple answers to the question of how they discover games. GameDiscoverCo notes that its sample likely has fewer casual players than the market as a whole.
All Players
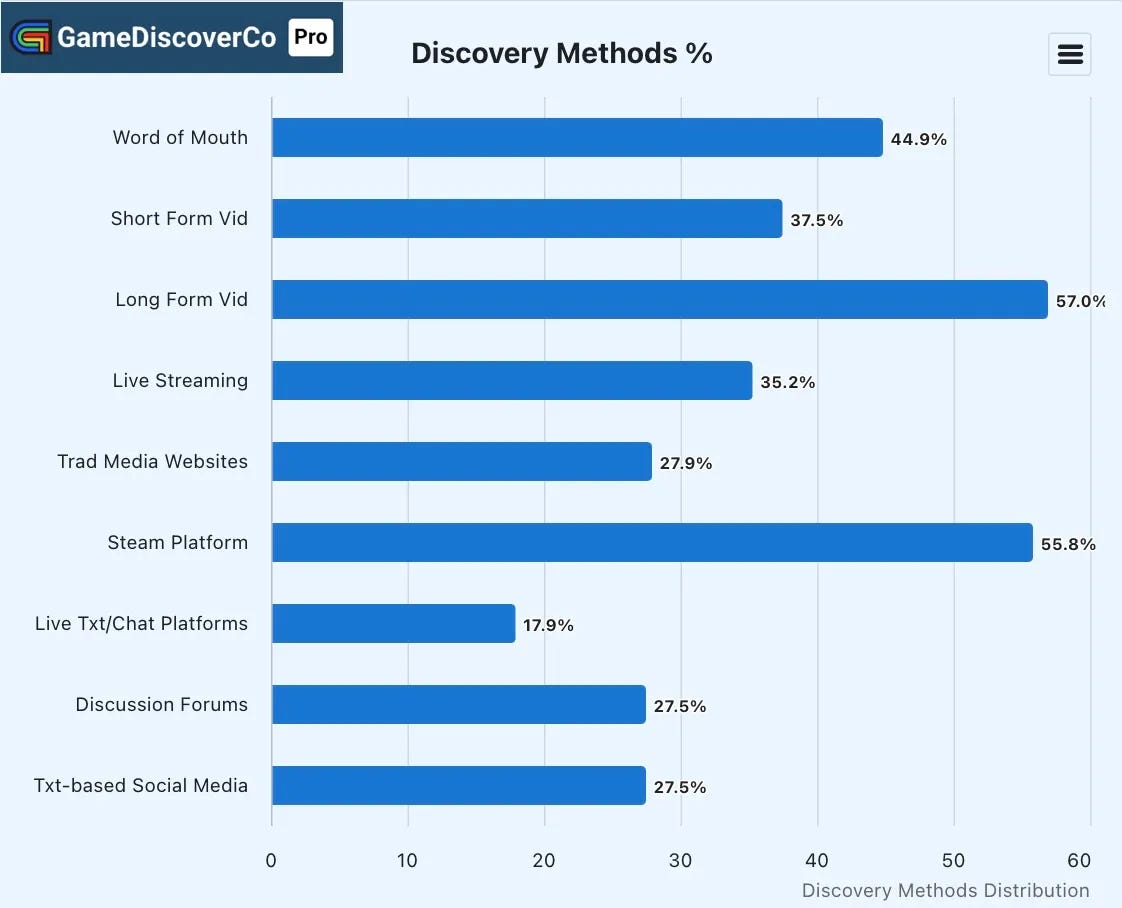
Steam players most often learn about new games from long-form YouTube videos (57%). Steam itself, with its recommendations, is second (55.8%).
Word of mouth is third: 44.9% of respondents learn about games from people they know.
37.5% of players use short-form video like TikTok and Reels, and 35.2% use streams on Twitch and YouTube.
A word from our sponsor
Need a freelance 3D artist, composer, or QA tester fast? Mellow’s AI Scout finds qualified talent in under 48 hours — free to try, no commitment. Describe the role, get a shortlist, hire when you’re ready.
Traditional games media websites (PC Gamer, Rock Paper Shotgun) are at 27.9%. Forums like Reddit and text-based social media (X, Bluesky) are slightly lower, at 27.5% each.
Discord and other chat platforms are the least common way to find games, at 17.9%.
Differences by Age
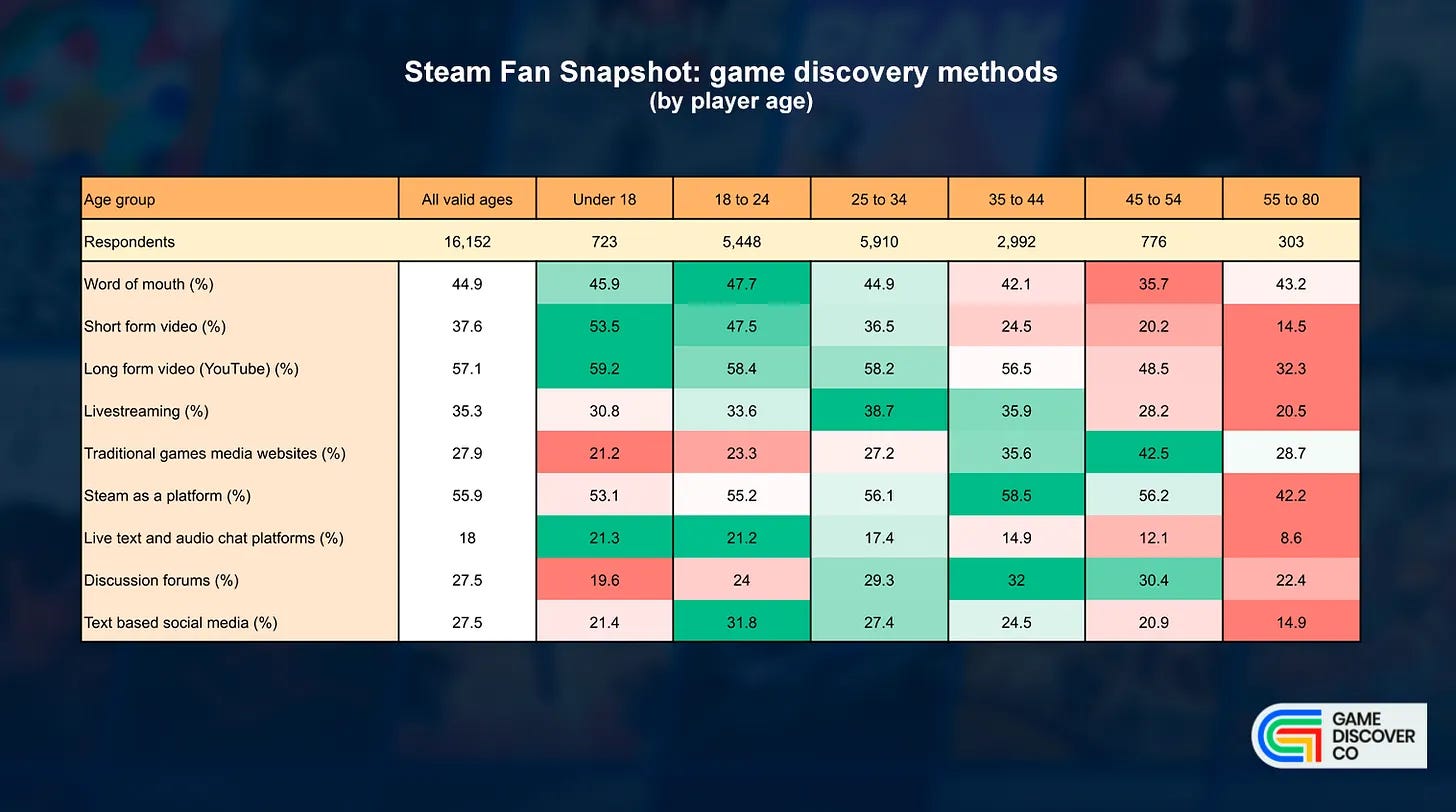
The role of short-form video changes the most with age. For players under 18, it is the second most important channel (53.5%), ahead of even Steam itself (53.1%). Among players aged 45-54, only 20.2% use short-form video, which puts it second to last.
Word of mouth and Steam barely depend on age: in most groups, they are at ~45% and ~55%, respectively. Word of mouth drops noticeably only among players aged 45-54 (35.7%).
Traditional games media, on the other hand, matter more to older players. Among players aged 45-54, 42.5% find games through gaming websites, compared with 21.2% of players under 18.
Streams are most popular among players aged 25-34 (38.7%). Among players under 18, it’s 30.8%, and among those aged 45-54, 28.2%.
Players aged 18-24 use text-based social media like X and Bluesky the most (31.8%). Among players under 18, it’s only 21.4%.
Younger players use chat platforms like Discord more often, and their role declines with age. Forums like Reddit show the opposite: players under 18 use them the least (19.6%), and players aged 35-44 the most (32%).
Players over 55 use almost all channels less often. GameDiscoverCo assumes they simply already know what they like. However, this group has only 303 respondents.
GameDiscoverCo concludes that how people discover games is different, and there is no single right way to reach an audience.
❗️It’s important to note that this is a snapshot of age groups at one point in time, not a trend over the years.
Example: Peak
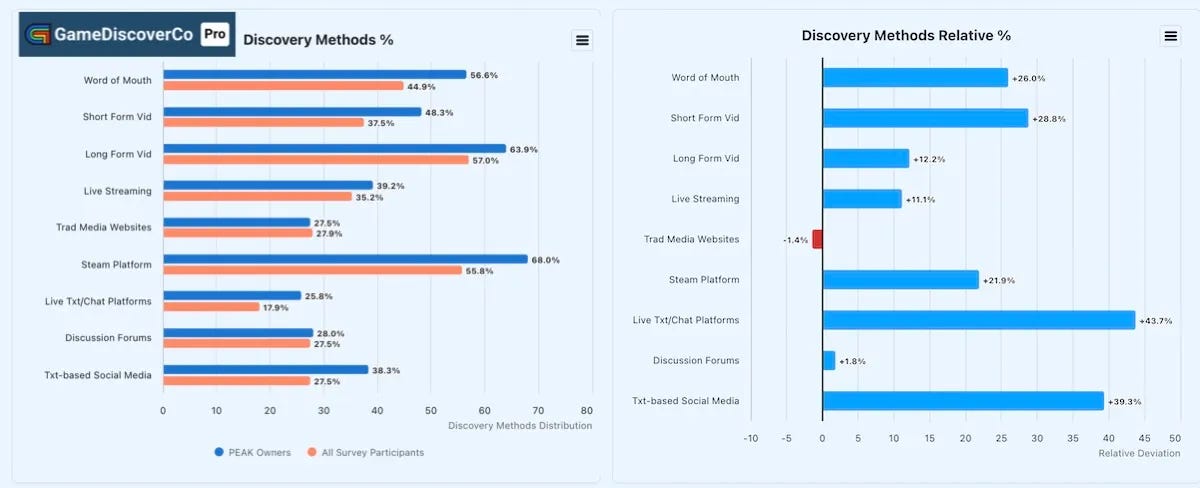
GameDiscoverCo also looked separately at Peak players: almost 3,000 people who played the game for more than 30 minutes. The game’s audience is younger: the average age is 27, versus a median of 29.
Peak players find games more often through word of mouth (56.6% vs. 44.9% on average) and short-form video (48.3% vs. 37.5%). Through Steam, it’s 68% vs. 55.8%.
Chat platforms like Discord (25.8% vs. 17.9%) and text-based social media (38.3% vs. 27.5%) stand out the most. Traditional media and forums are about as popular among Peak players as on average.
GameDiscoverCo notes that players of popular new releases generally follow games more closely. That is why almost every channel is more popular among Peak players than average.
Bryter: Women Gamers in 2026
Bryter has been publishing its women gamers study for nine years. This year, the company surveyed 1,004 women aged 16-65 in the US and the UK (split evenly between the two countries). Importantly, all respondents already play games. A gamer here is defined as someone who plays on PC or current/previous-generation consoles at least once a month.
❗️In 2024, Newzoo shared that 72% of women in the online population play games (81% for men), and women make up 45% of all players. At the same time, only 36% of women who play consider themselves gamers (recap).
PC and Console Trends Among Women Gamers
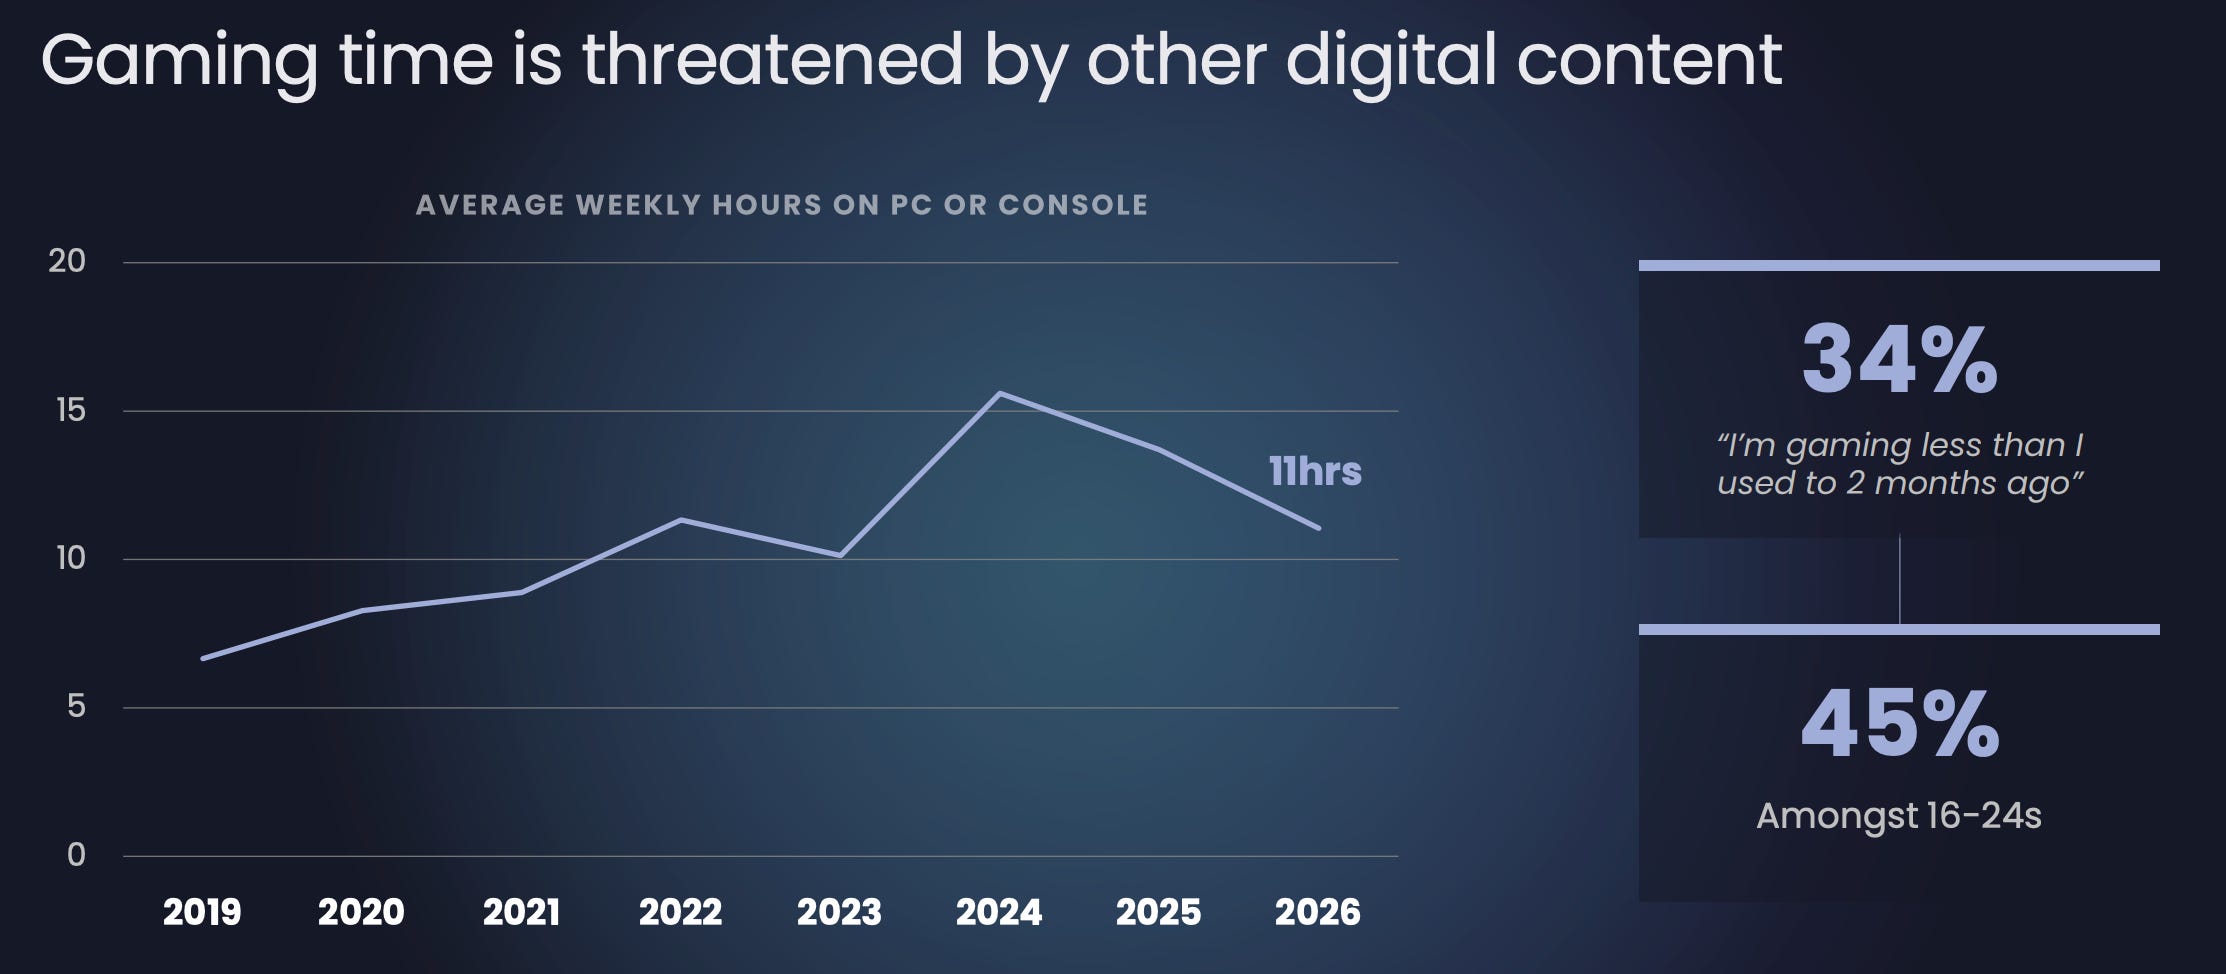
After peaking in 2024, the time women spend playing on PC and consoles has been going down. In 2026, it averages 11 hours a week.
Managing a distributed dev team shouldn’t mean managing a compliance headache. Mellow’s Contractor Management gives you ready-made contracts, IP compliance, and automated payouts for contractors in 150+ countries — for $35/month per contractor.
34% of respondents say they play less than they used to. Among women aged 16-24, it’s 45%. Bryter notes that for younger players, social media takes most of that time, while for women over 25, it’s streaming services.
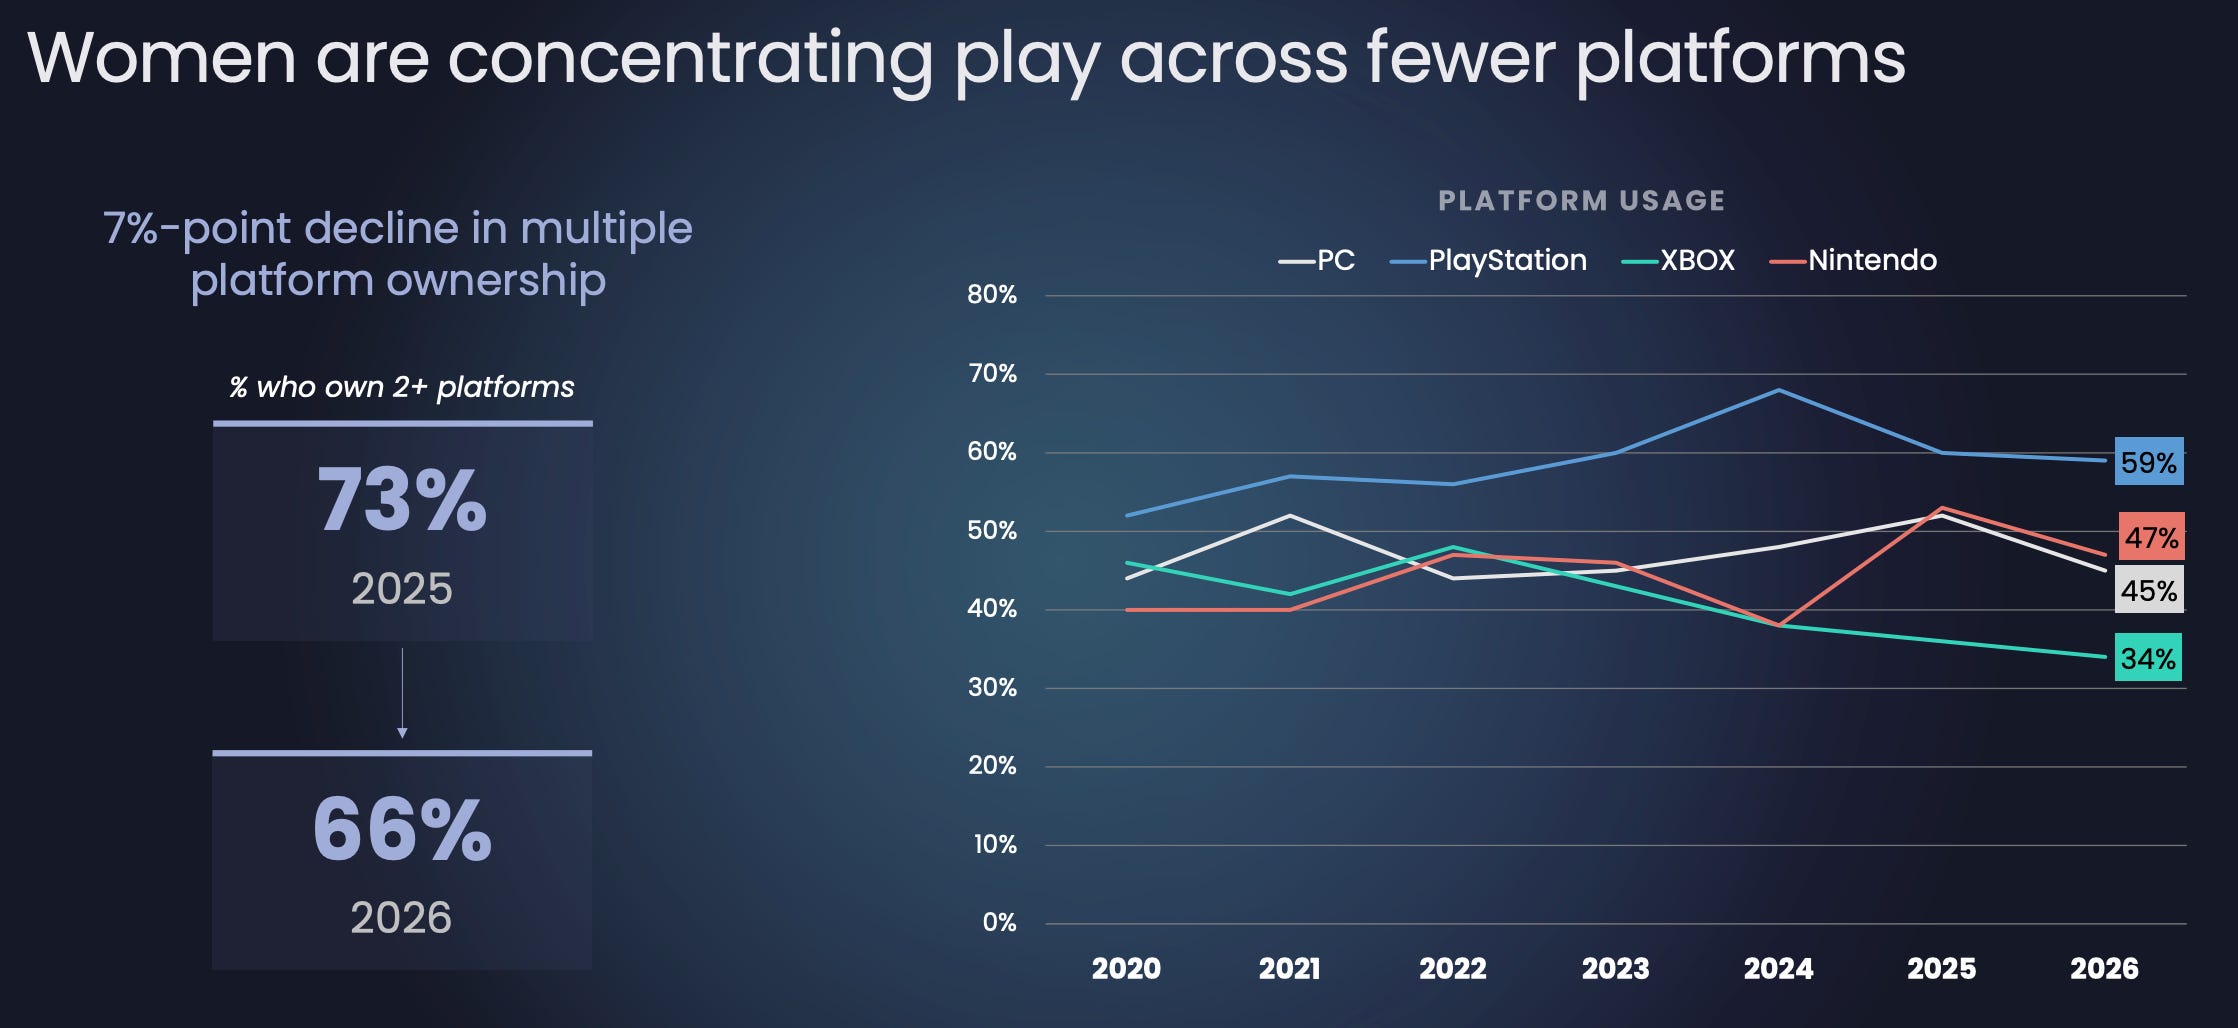
Women play on fewer platforms. The share of those with two or more platforms dropped from 73% in 2025 to 66% in 2026. Bryter links this to rising console prices.
PlayStation is the most popular platform among women (59%). Nintendo (47%), PC (45%), and Xbox (34%) follow. Over the year, the audience shrank on every platform, most of all on PC and Nintendo. Xbox’s share has been declining since 2022.
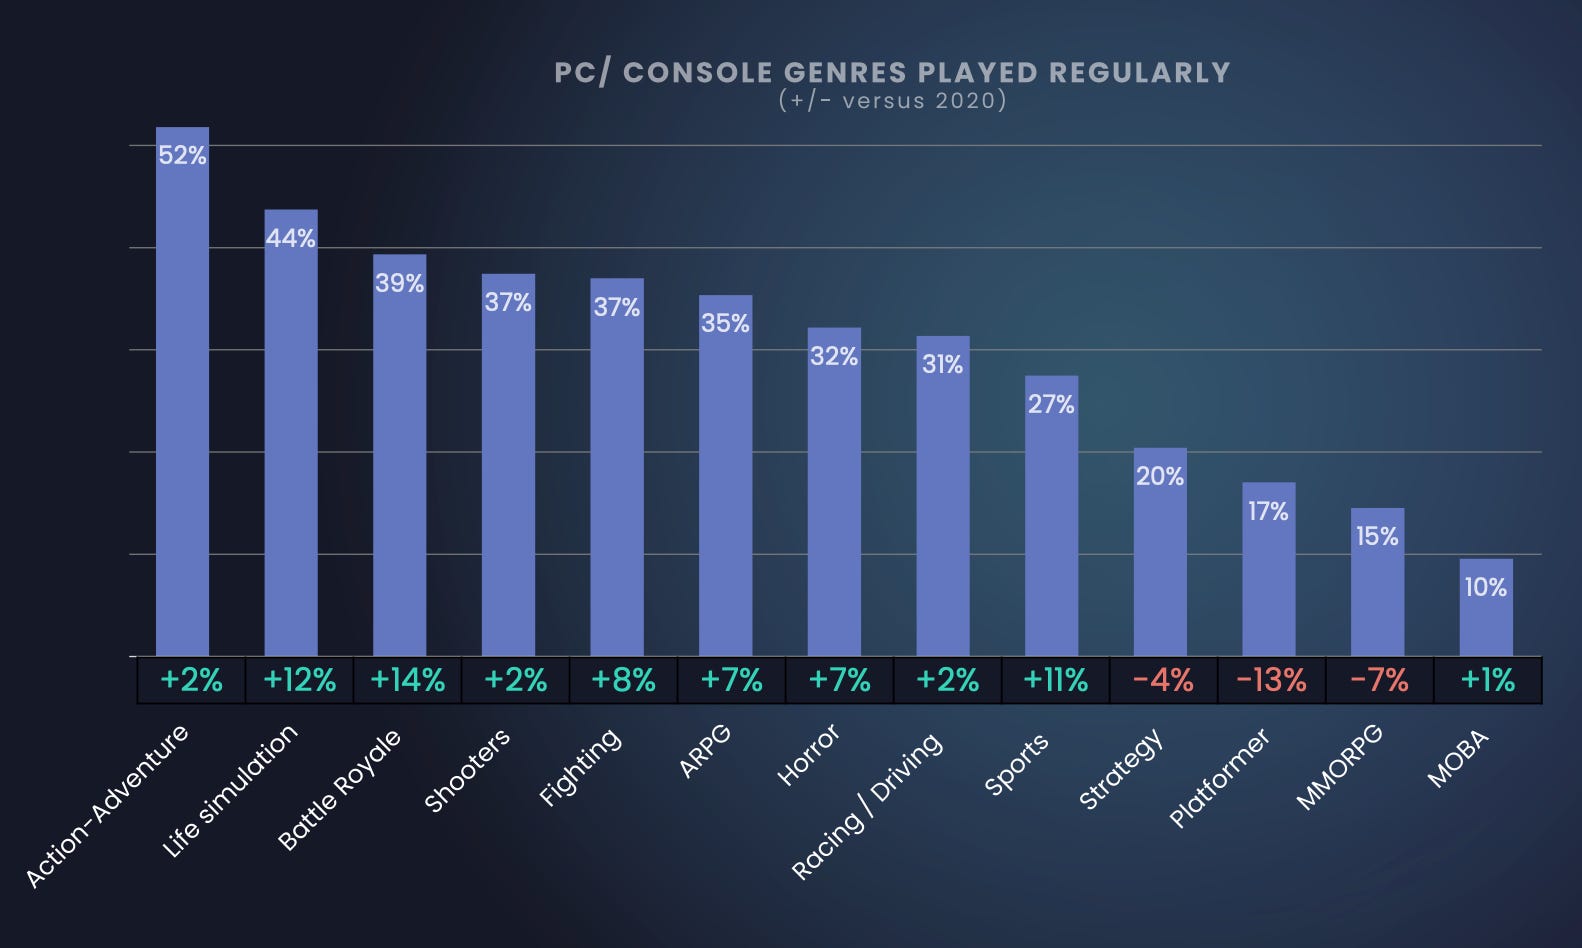
On average, women play 6 genres on PC and consoles. Action-Adventure (52%), Life Simulation (44%), and Battle Royale (39%) lead.
Since 2020, the share of women playing Battle Royale (+14 p.p.), Life Simulation (+12 p.p.), and Sports (+11 p.p.) grew the most. Meanwhile, fewer women play Platformers (-13 p.p.), MMORPGs (-7 p.p.), and Strategy (-4 p.p.).
Among women aged 16-24, Life Simulation (62%) and Horror (45%) are especially popular.
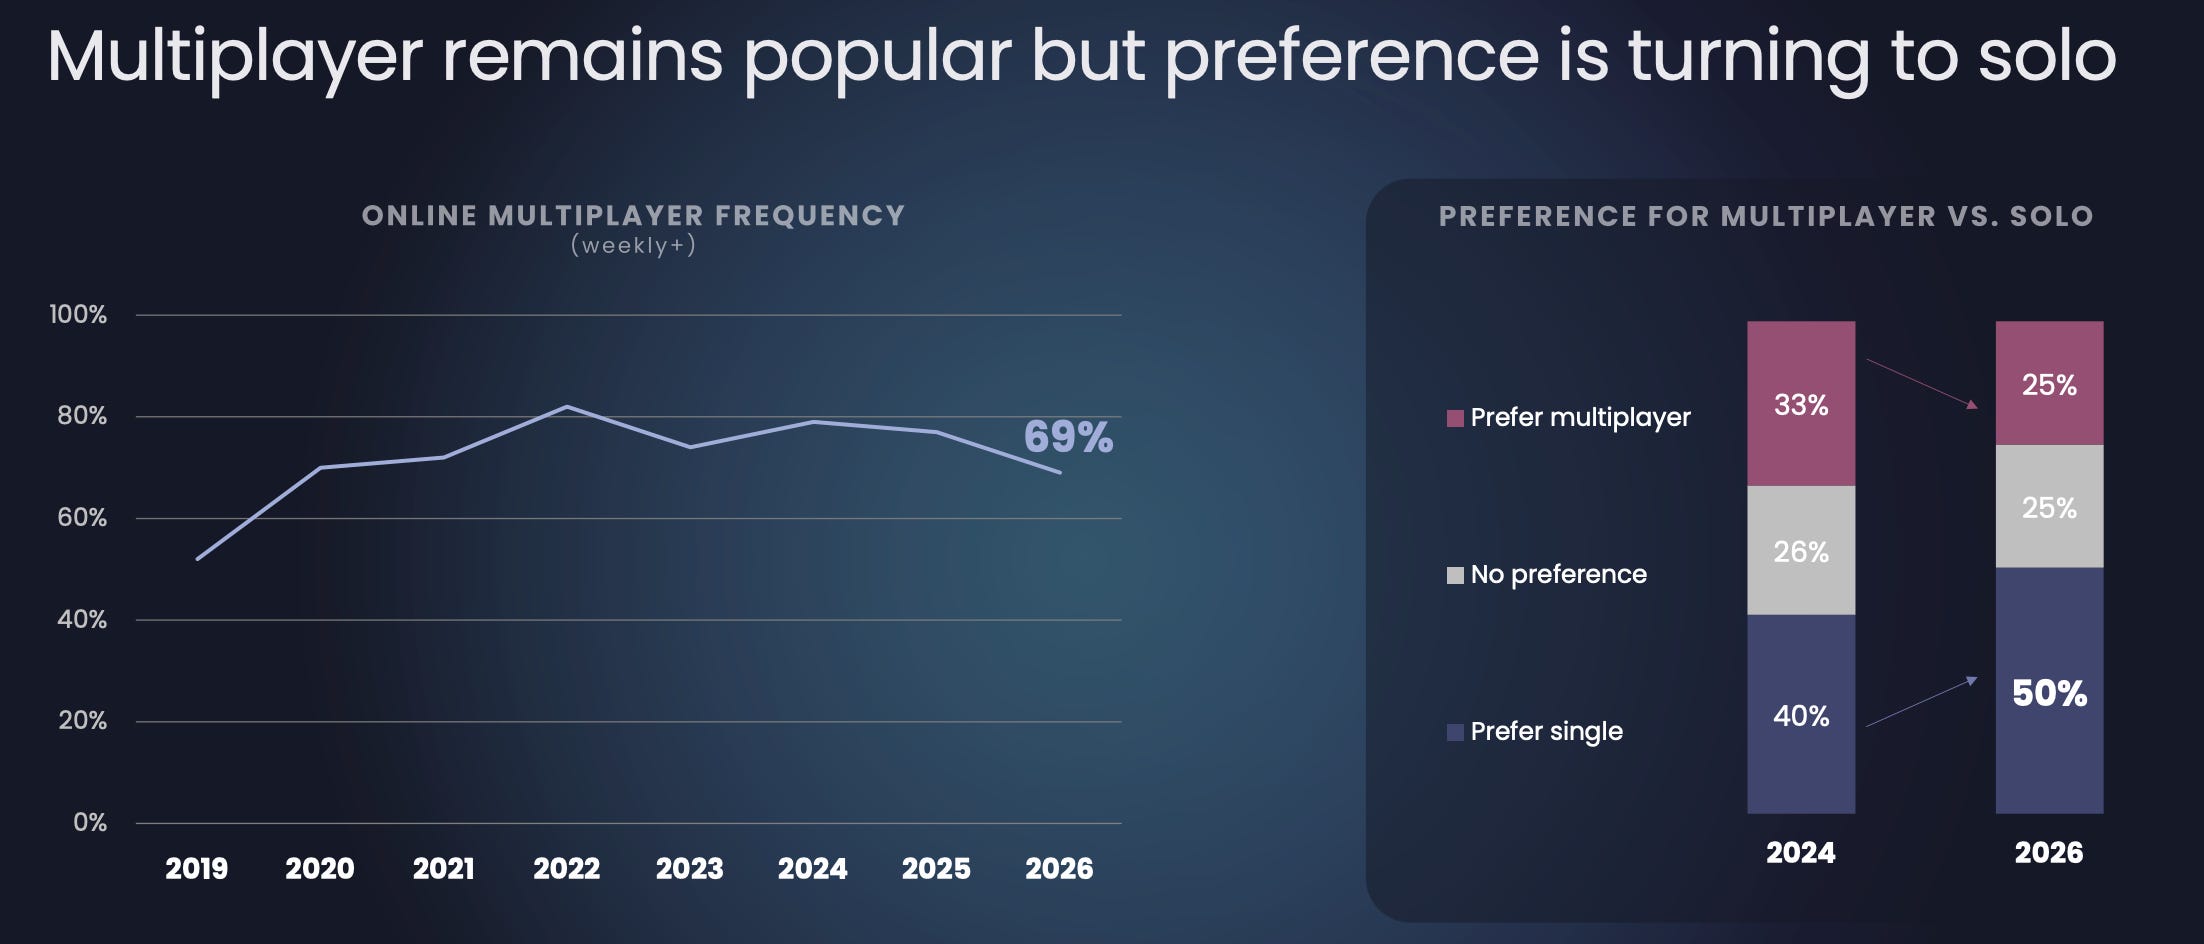
69% of women play online at least once a week. The share peaked in 2022 and has been declining since 2024.
At the same time, more women prefer playing solo. In 2024, it was 40%; in 2026, it’s already 50%. 25% prefer multiplayer (down from 33%).
Women aged 16-24 play multiplayer most: 78% do it weekly or more often. Still, 45% of them prefer playing solo.
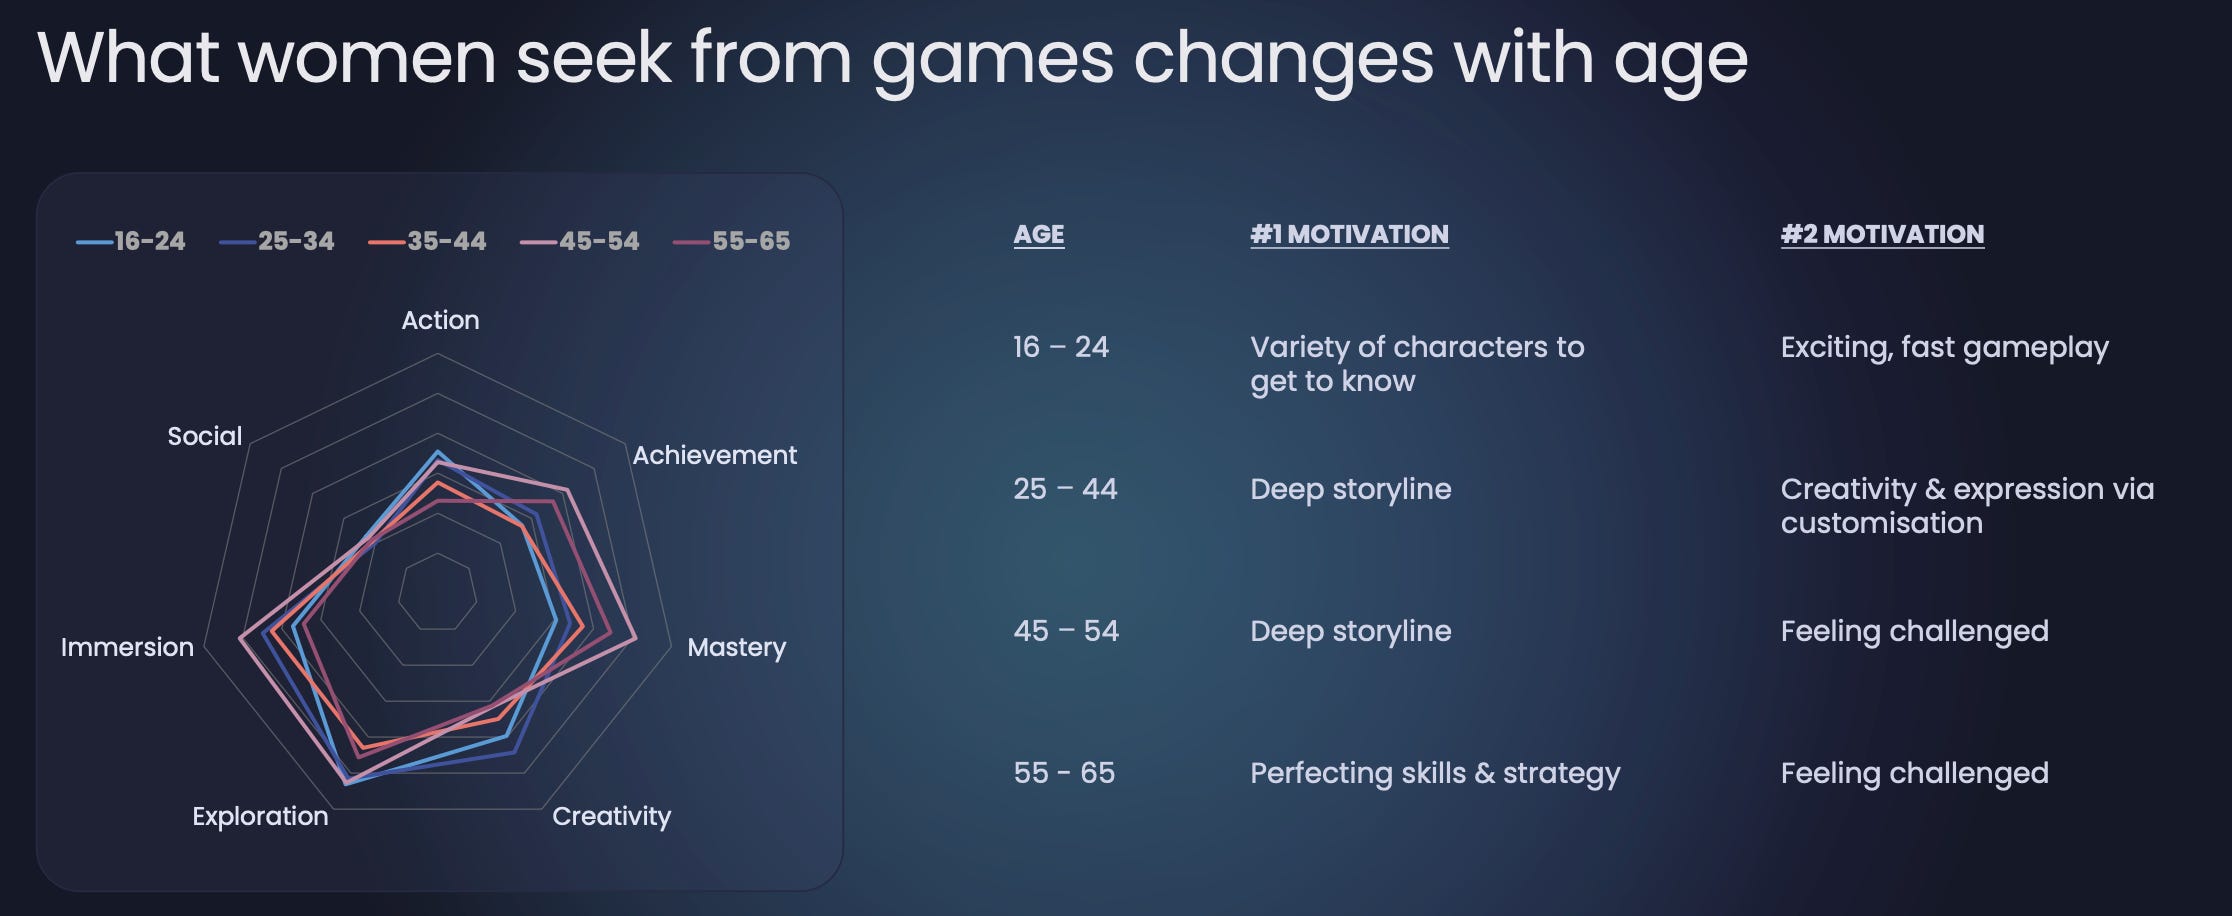
Motivation to play changes with age. Women aged 16-24 value a variety of characters and fast-paced gameplay. For those aged 25-44, a deep storyline and self-expression through customization come first. Women over 45 want games to challenge them, and in the 55-65 group, perfecting skills and strategy comes first.
Game Discovery and Spending
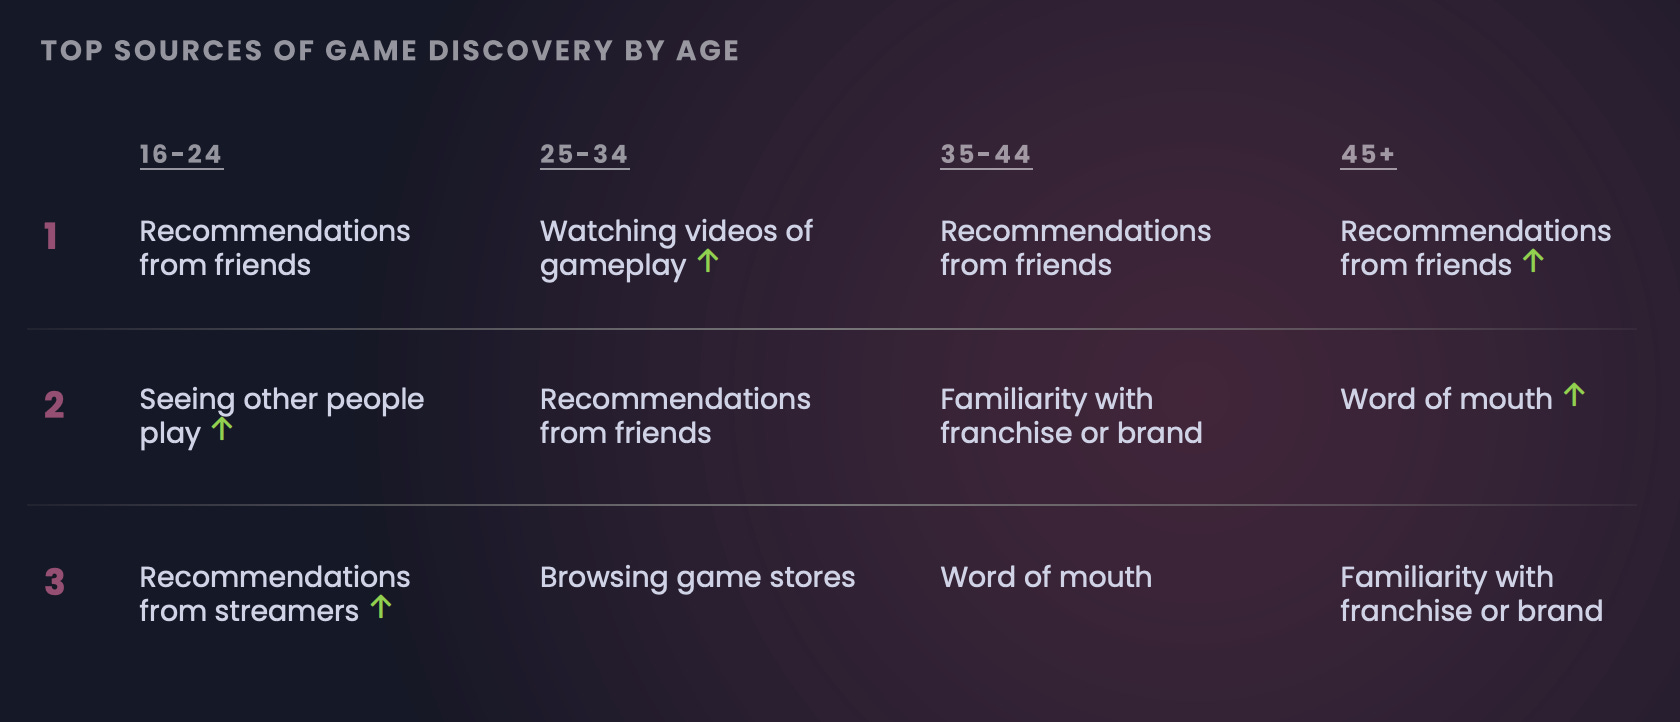
Recommendations from friends are the main way to discover a game. They rank first in every age group except 25-34, where gameplay videos lead.
Women aged 16-24 more often watch what others are playing and listen to streamers. Women over 35 rely more on word of mouth and familiar franchises.
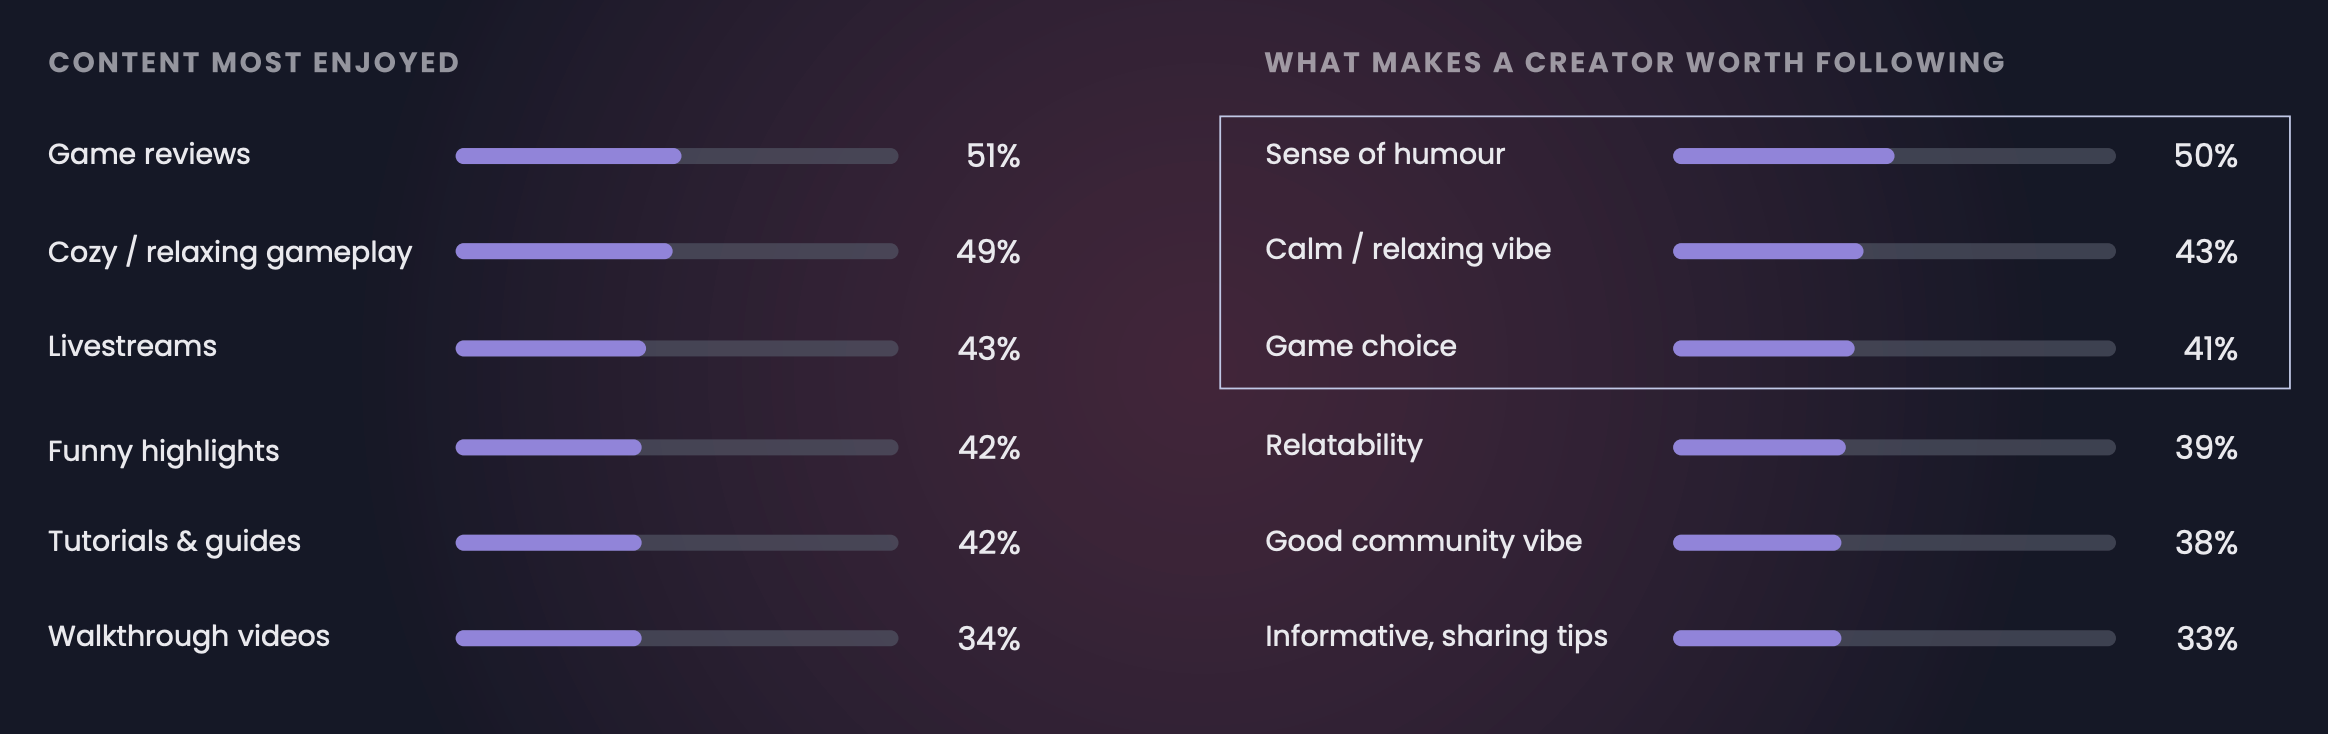
69% of women gamers follow gaming creators or streamers. They enjoy game reviews (51%), cozy, relaxing gameplay (49%), and livestreams (43%) the most.
They follow personalities more than games. The top reasons are a creator’s sense of humor (50%) and a calm atmosphere (43%). Game choice is only third (41%).
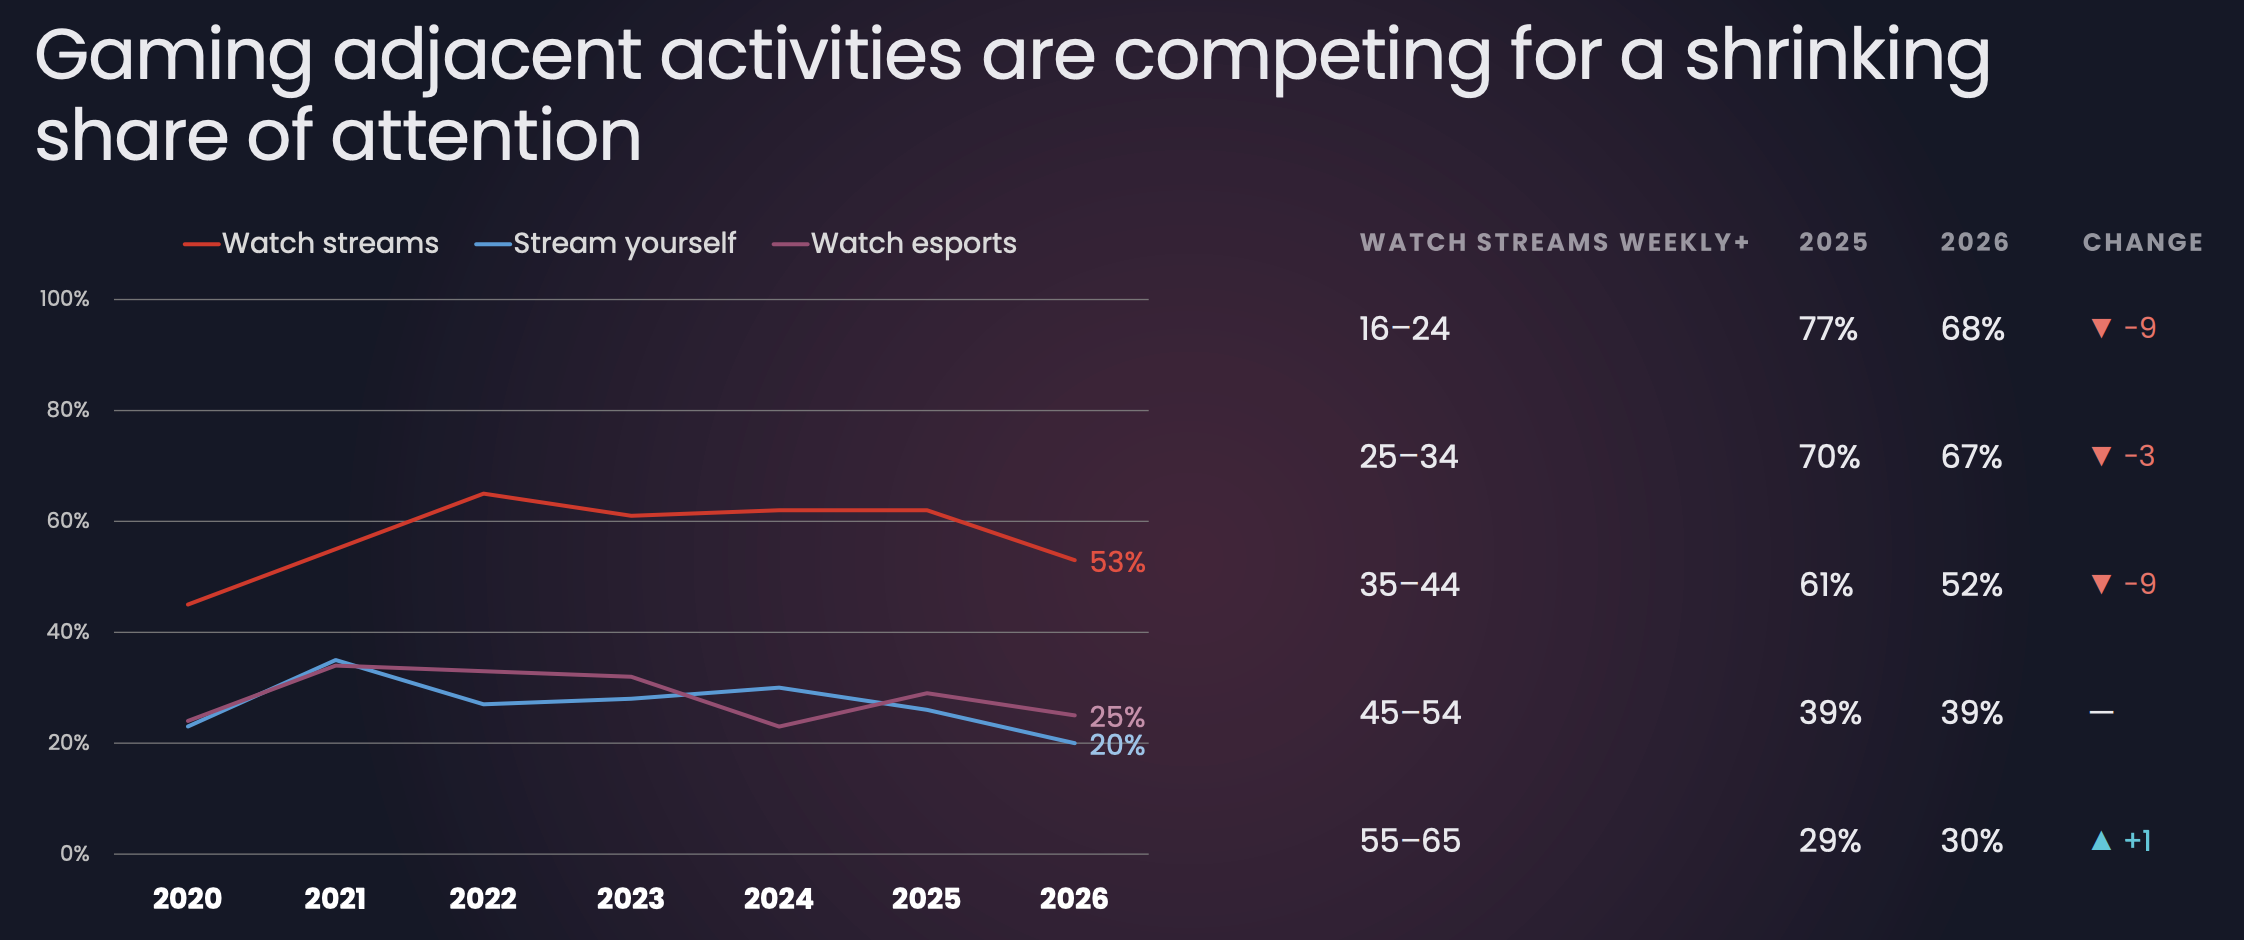
Women watch streams less. 53% watch them weekly or more often, down 9 p.p. from 2025. The biggest drops were in the 16-24 (77% to 68%) and 35-44 (61% to 52%) age segments.
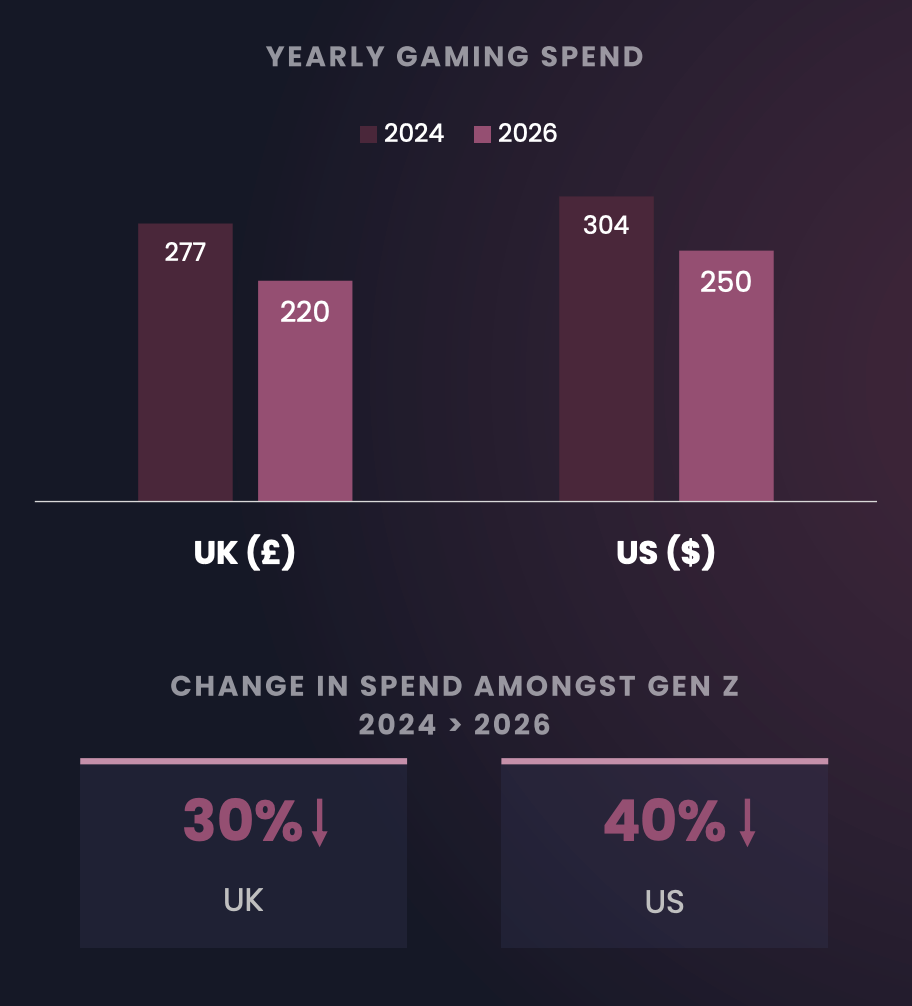
Spending on games is declining. In 2024, women in the UK spent £277 a year on games; in 2026, that number fell to £220. In the US, it’s $304 and $250, respectively.
Women aged 16-24 cut their spending especially sharply: since 2024, by 30% in the UK and by 40% in the US.
At the same time, the number of premium games bought hasn’t changed since 2025: 4 games a year on average. Bryter suggests that women are cutting back on other spending.
For example, on DLC. 58% buy DLC regularly (66% in 2024). 58% of respondents feel that DLC too often includes content that should have been in the base game.
Mobile Games
❗️Bryter’s sample only includes those who play on PC or consoles. So the figures in this section are about women who play both there and on mobile. Mobile-only players aren’t in the sample.
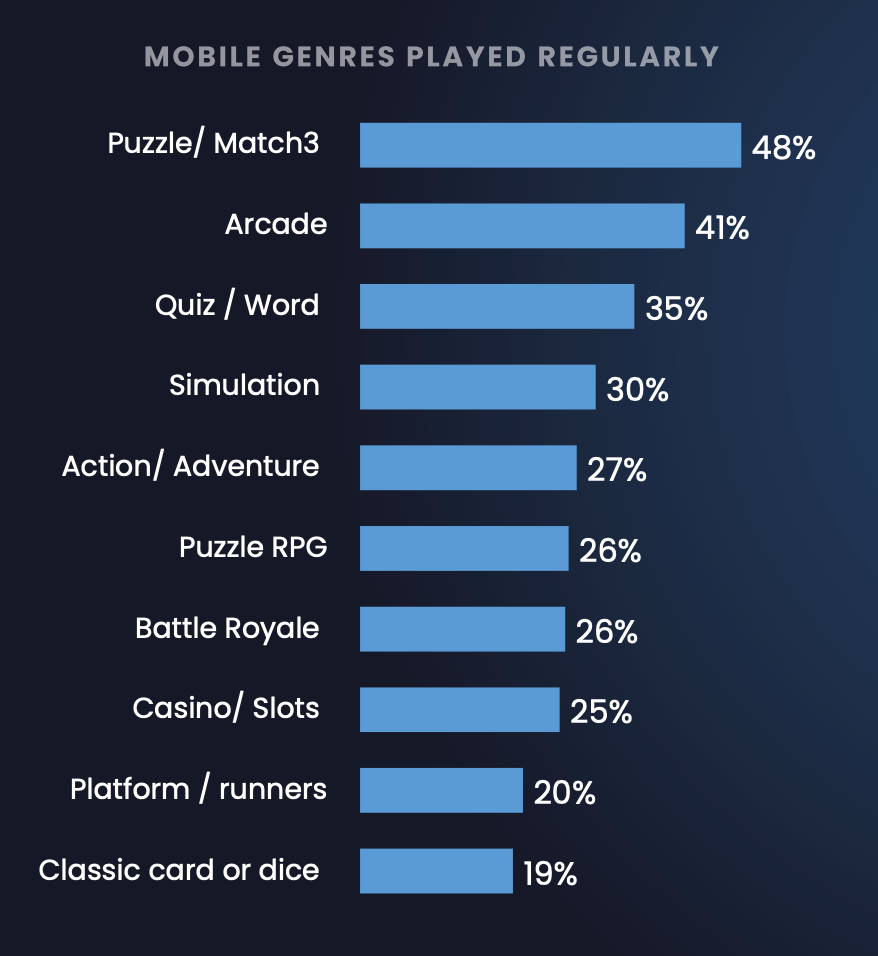
The most popular mobile genres are Puzzle and Match-3 (48%), Arcade (41%), and Quiz and Word games (35%).
On mobile, women under 30 more often play Arcade, Simulation, and Battle Royale. Women over 30 prefer Puzzle and Match-3, Quiz and Word games, and Casino and Slots.
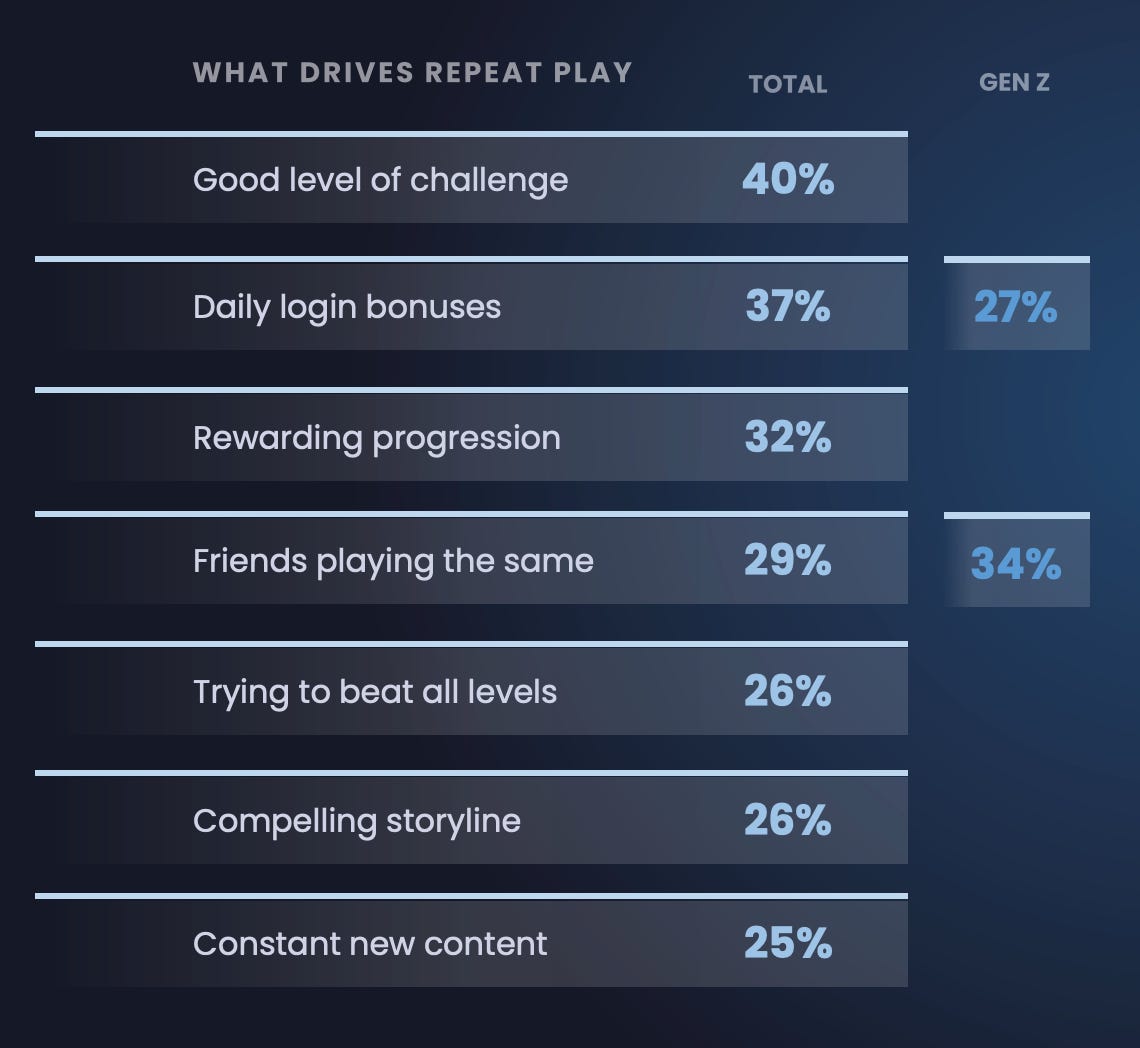
Women return to a game most often because of challenge (40%), daily login bonuses (37%), and progression (32%).
For women aged 16-24, it’s different. Friends playing the same game motivate 34%, while daily bonuses work for only 27%.
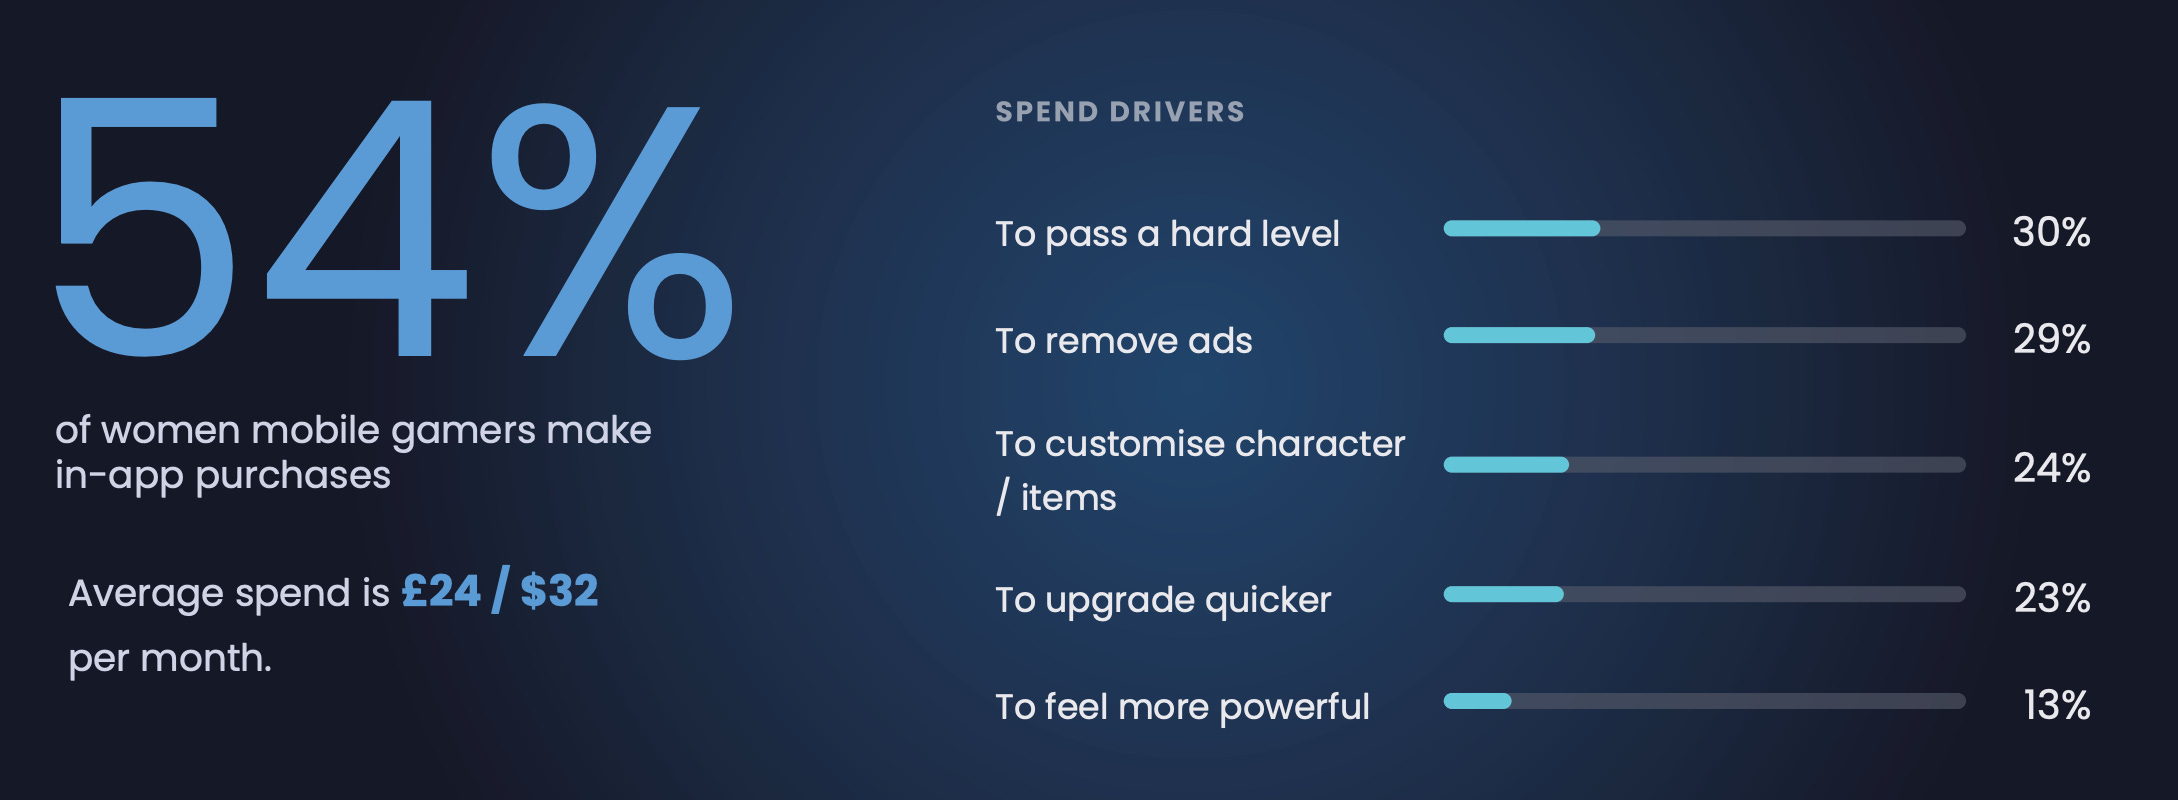
54% of respondents make in-app purchases in mobile games. Average spending is £24 in the UK and $32 in the US per month.
They pay most often to pass a hard level (30%), remove ads (29%), and customize characters or items (24%). Among those who don’t pay yet, 25% are willing to pay to remove ads.
In the US, the most valuable audience is women aged 35-44; in the UK, it’s women aged 25-34.
Toxicity
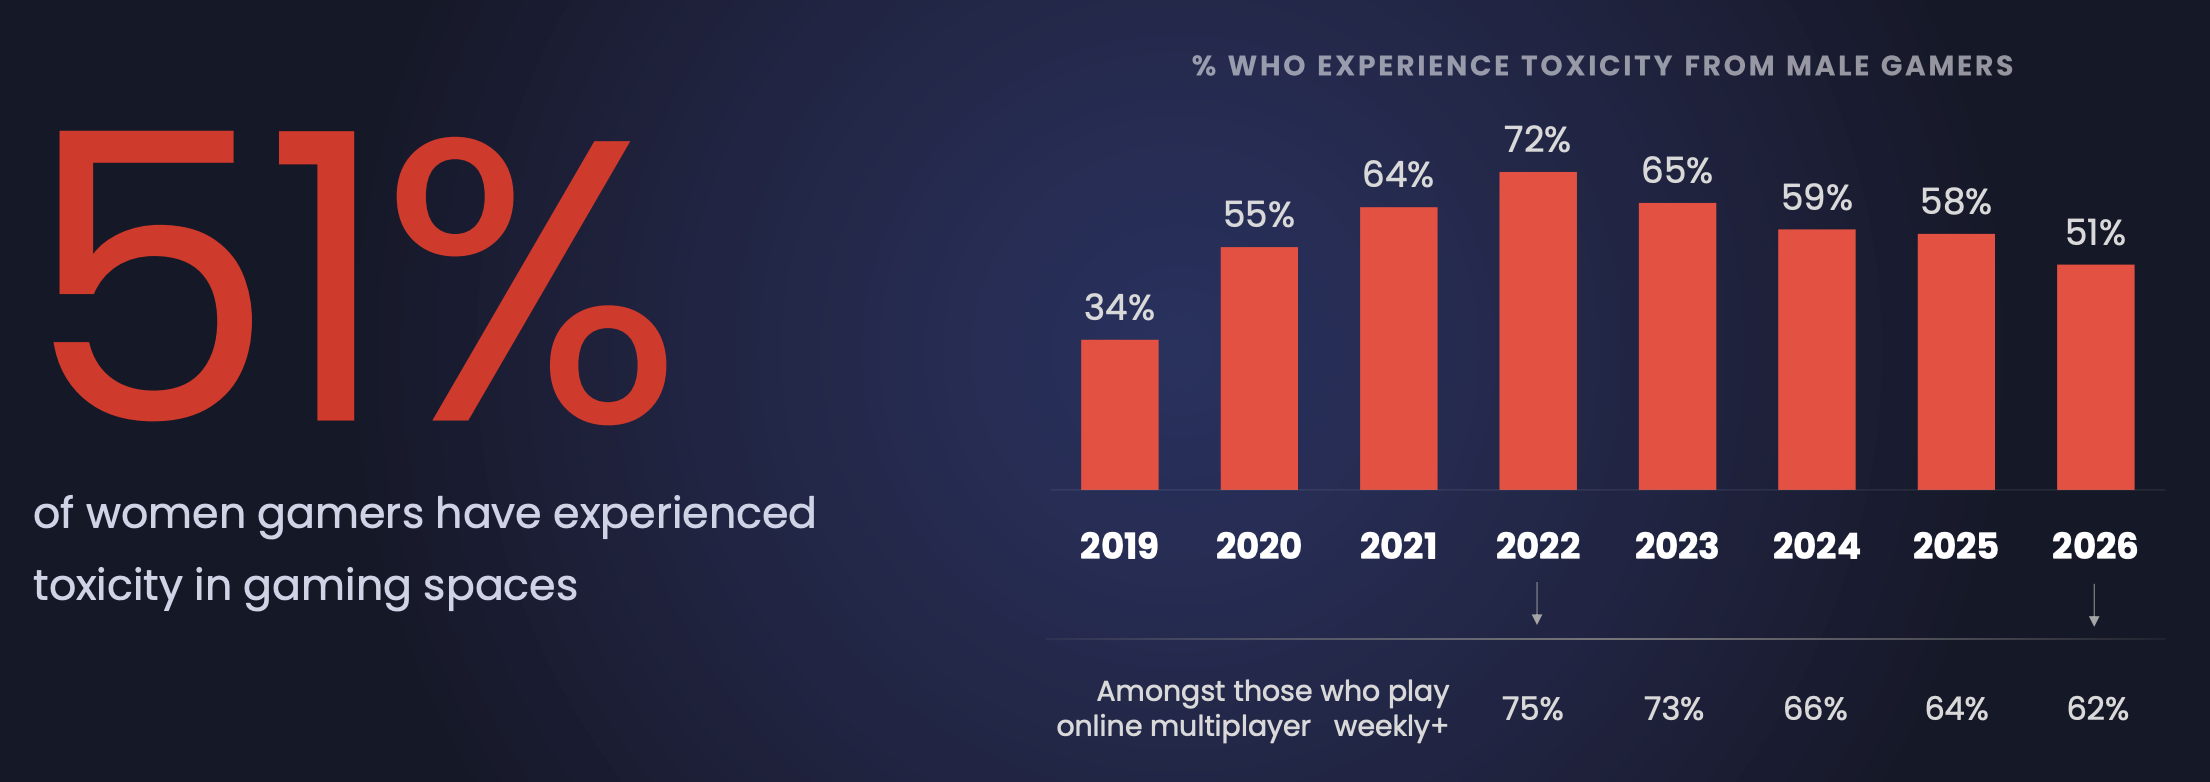
51% of women have experienced toxicity in games. The peak was in 2022 (72%), and the figure has been declining since. In 2025, it was 58%.
Among those who play online multiplayer at least weekly, the share is higher: 62% (75% in 2022). At the same time, 38% of women believe toxicity has gotten worse.
Among women aged 16-24, 79% have experienced toxicity.
Managing a distributed dev team shouldn’t mean managing a compliance headache. Mellow’s Contractor Management gives you ready-made contracts, IP compliance, and automated payouts for contractors in 150+ countries — for $35/month per contractor.
42% of women have been told by male players that they “don’t belong” in games. Among women aged 16-24, that number is 71%. 46% have been told they are “not real gamers.”
29% of respondents don’t call themselves gamers.
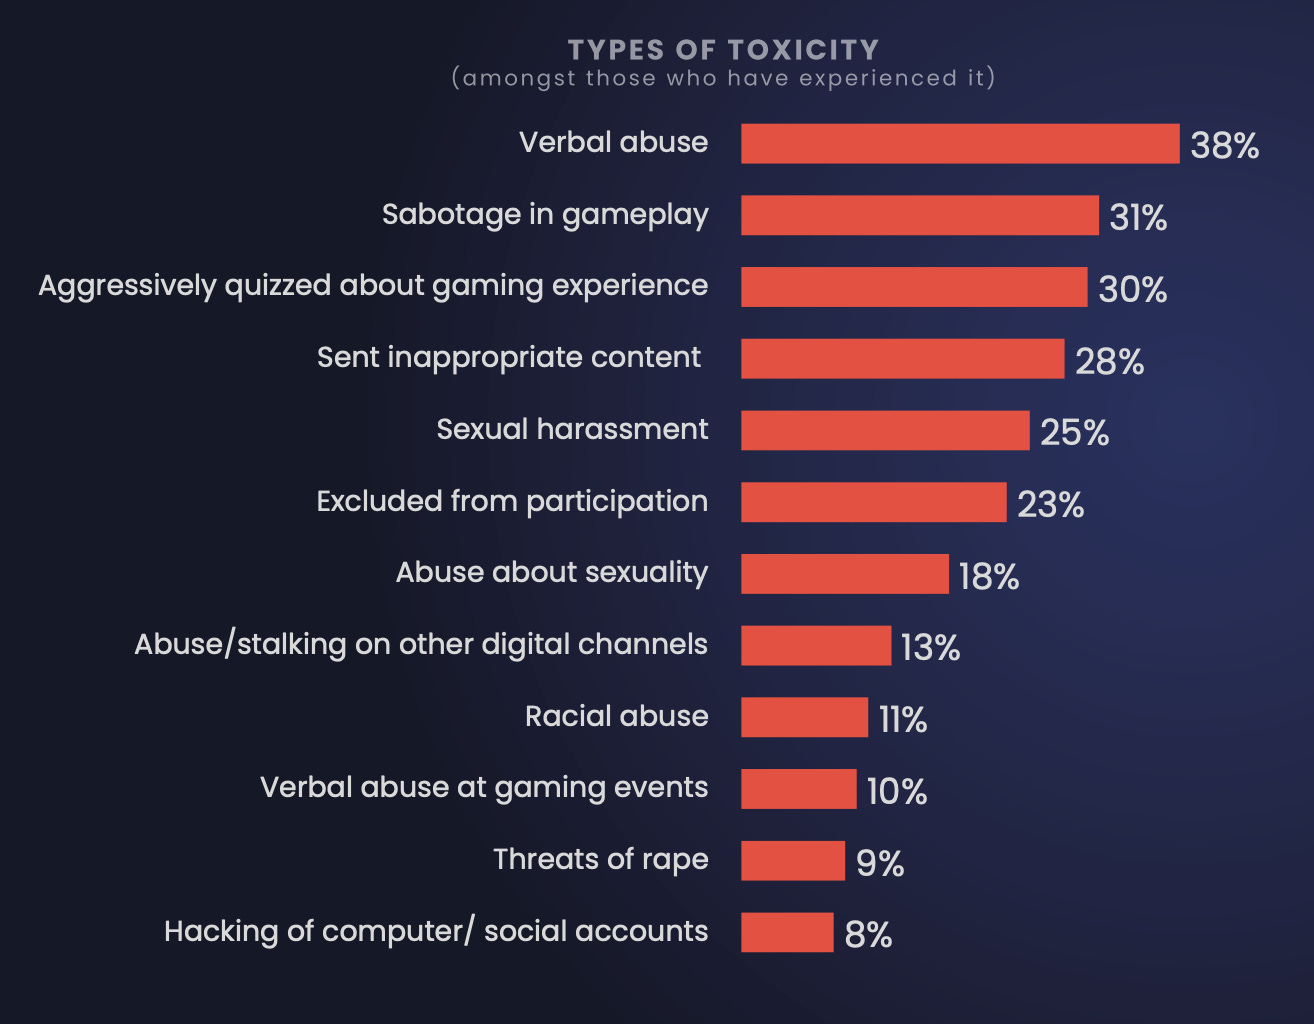
The most common types of toxicity are verbal abuse (38%), gameplay sabotage (31%), and being aggressively “quizzed” about gaming experience (30%). 25% have faced sexual harassment, and 9% have received rape threats.
Toxicity was most often mentioned in Call of Duty, Fortnite, GTA, Roblox, League of Legends, Overwatch, and Minecraft.
Bryter notes that this year, open-ended answers contained more cases of male players writing that women don’t belong in games.
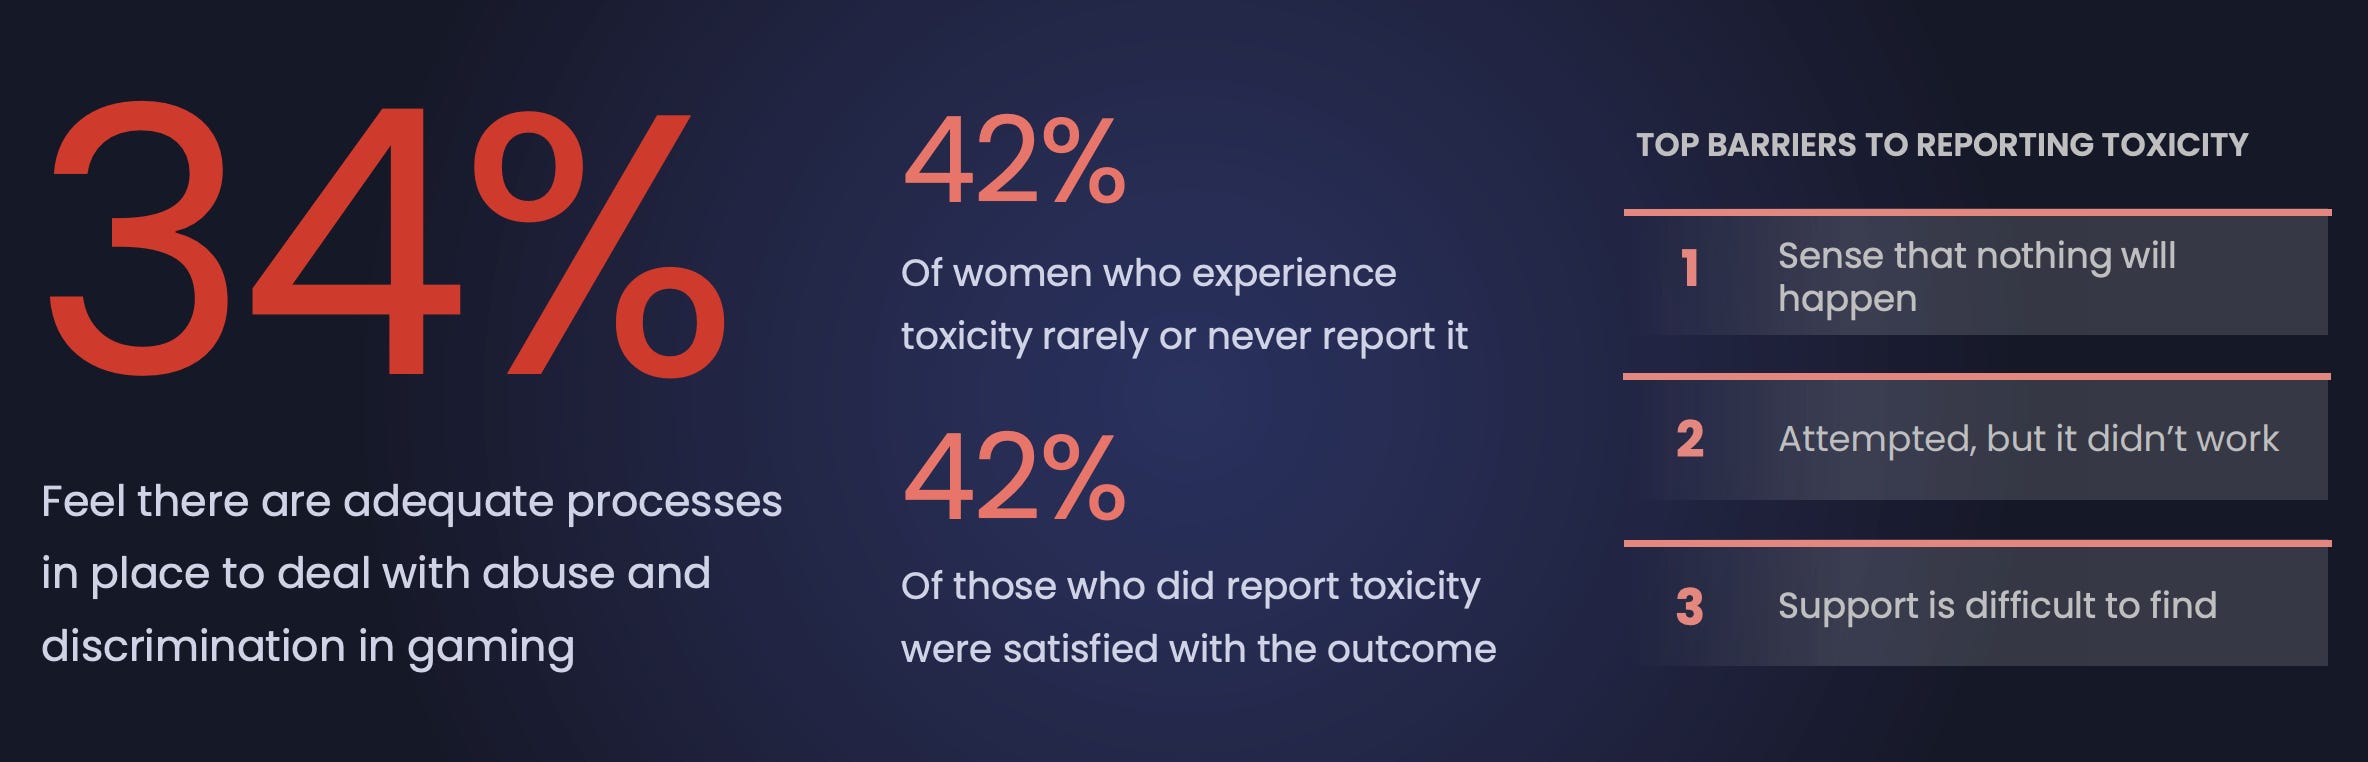
Only 34% of women believe games have adequate processes to deal with abuse and discrimination.
42% of those who experienced toxicity rarely or never report it. The main reason is that they feel nothing will happen. Among those who did report it, 42% were satisfied with the outcome.
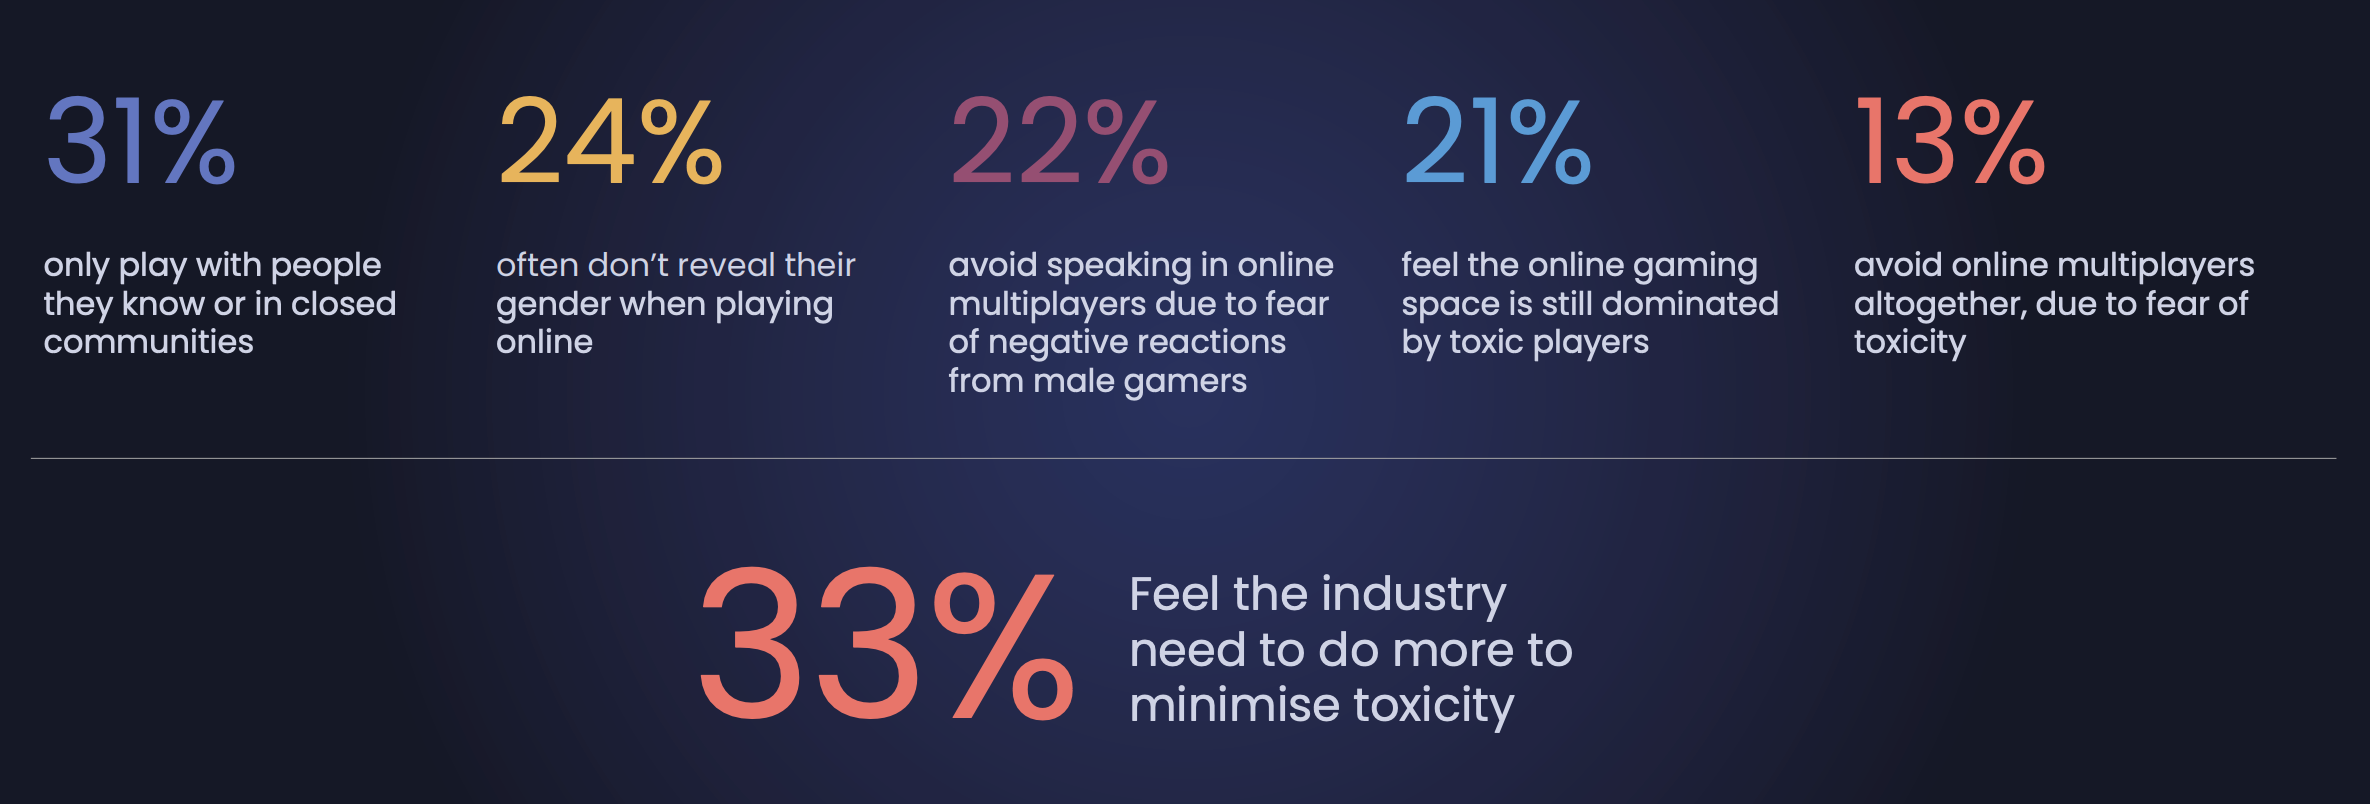
Because of toxicity, women limit how they play. 31% play only with people they know or in closed communities, 24% often hide their gender, and 22% avoid speaking in voice chat. 13% have given up on online multiplayer altogether.
33% believe the industry needs to do more to fight toxicity.