

Weekly Gaming Reports Recap: September 23 - September 27 (2024)
Big monetization report from Unity; Q2'24 Ad Monetization trends from Tenjin + GSD & GFK covered the EU and UK sales data in August'24.

Reports of the week:
Unity: Mobile User Acquisition and Monetization trends in 2024
GSD & GfK: August'24 PC/Console sales in the UK dropped by 1.5%
Tenjin: Ad Monetization in Mobile Games in Q2'24
Newzoo: Top-20 PC/Console Games of August 2024 by Revenue and MAU
GSD & GfK: Sales of PC/console games in Europe increased in August'24; GTA V is the best-selling game of the month
Unity: Mobile User Acquisition and Monetization trends in 2024

Data was collected from ironSource, Unity Ads, and Tapjoy.
Trend 1: Advertisers are diversifying their UA campaign optimization

Over the past two years, advertisers have increased their spending on campaigns optimized for ad revenue, IAP (in-app purchases), and hybrid ROAS (return on ad spend). There's also a rise in campaigns with tCPA (target cost per action) and tCPE (target cost per event), while interest in CPI (cost per install) campaigns is declining.

When looking at D7 ROAS (7-day return on ad spend) targets, leaders in spending still primarily optimize for ad revenue, but optimization for IAP + ad revenue is gaining popularity.

In the top 5 game genres across countries, the mix of optimizations varies greatly. For example, puzzle games equally use optimizations for ad revenue and IAP, while IAP optimization dominates in casino games.
Regarding event optimization, according to ironSource data, the most popular options include level completion, free trial registration, making an IAP, or watching a certain number of ads.
❗️Unity advises selecting an action performed by the top 5-20% of high-LTV users during their first seven days in the game. However, the company notes that the more complex the action, the lower the conversion rate, and the longer the campaign will take to learn.
Benchmarks for IPM (installs per mille) by genre: Arcade (24 IPM), Simulation (14.9 IPM), Action (10.9 IPM), Puzzle (10.3 IPM), Strategy (7.1 IPM).
Trend 2: It’s difficult to convert users into payers

On average, only 1.83% of users make an IAP. However, 26.5% of users who made a purchase once will make at least one more purchase within 30 days. Another 1.37% will do so within 60 days, and 0.46% within 90 days.
❗️Unity recommends adapting offers to the user’s stage in the game.

In-game currency sells well at all stages of the user’s lifecycle, with limited-time offers and bundles being particularly effective.
Games with high IAP revenue also see higher views of Rewarded Video ads.

Trend 3: More users are watching ads

User interaction with ads increased by 3.2% in 2023, with Tier 1 and Tier 2 countries leading the growth. This is likely due to worsening economic conditions, prompting users to seek other ways to gain in-game bonuses.
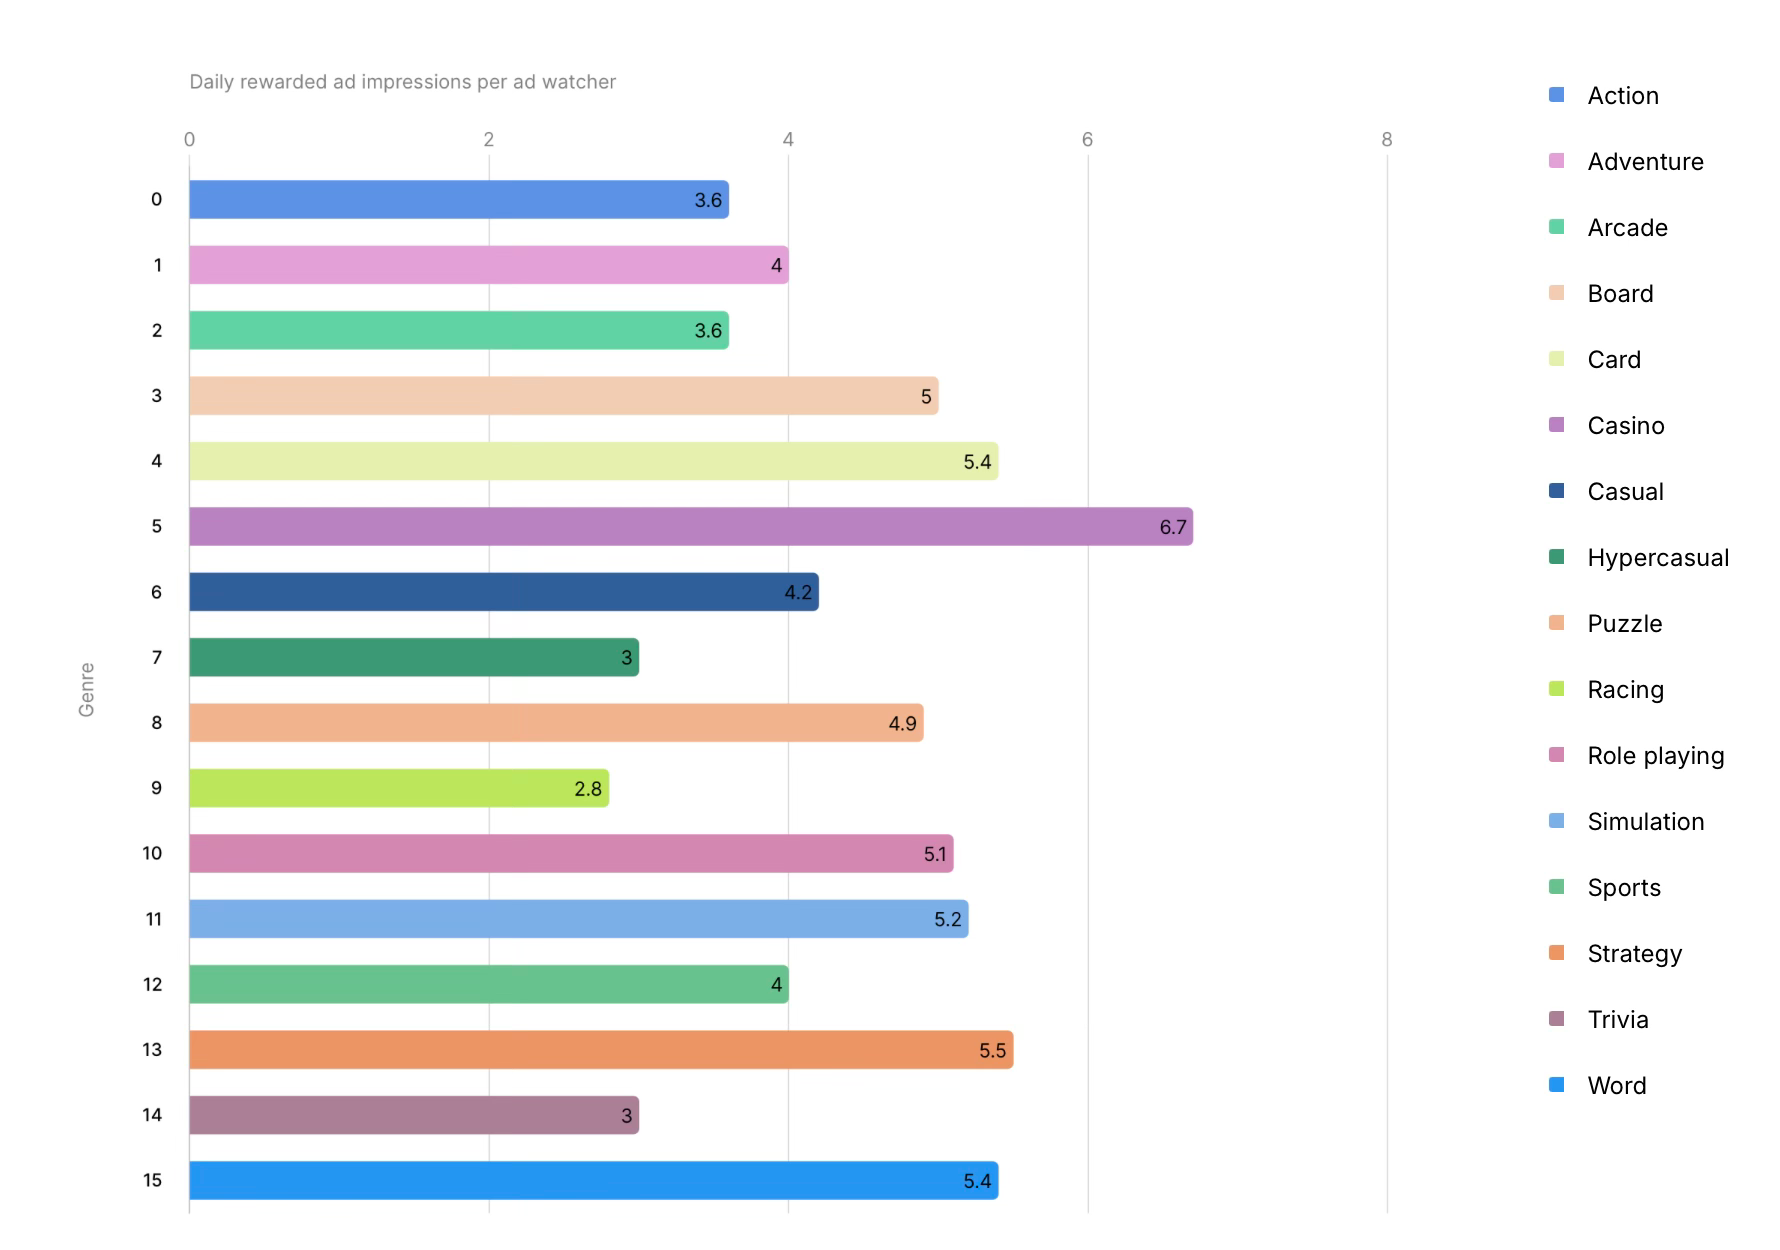
Rewarded Video ads are most popular in RPGs, casual, and word games.

The most ad views are seen in casino, strategy, and word games.
The right placement of Rewarded Ads increases views. Offering ads when the user runs out of resources results in a 38.1% conversion rate, while the conversion rate for ad views between levels is 23.8%.
Consider subscribing to the GameDev Reports Premium tier to support the newsletter. Get access to the list of curated articles & archive of Gaming Reports that I’ve been collecting since 2020.
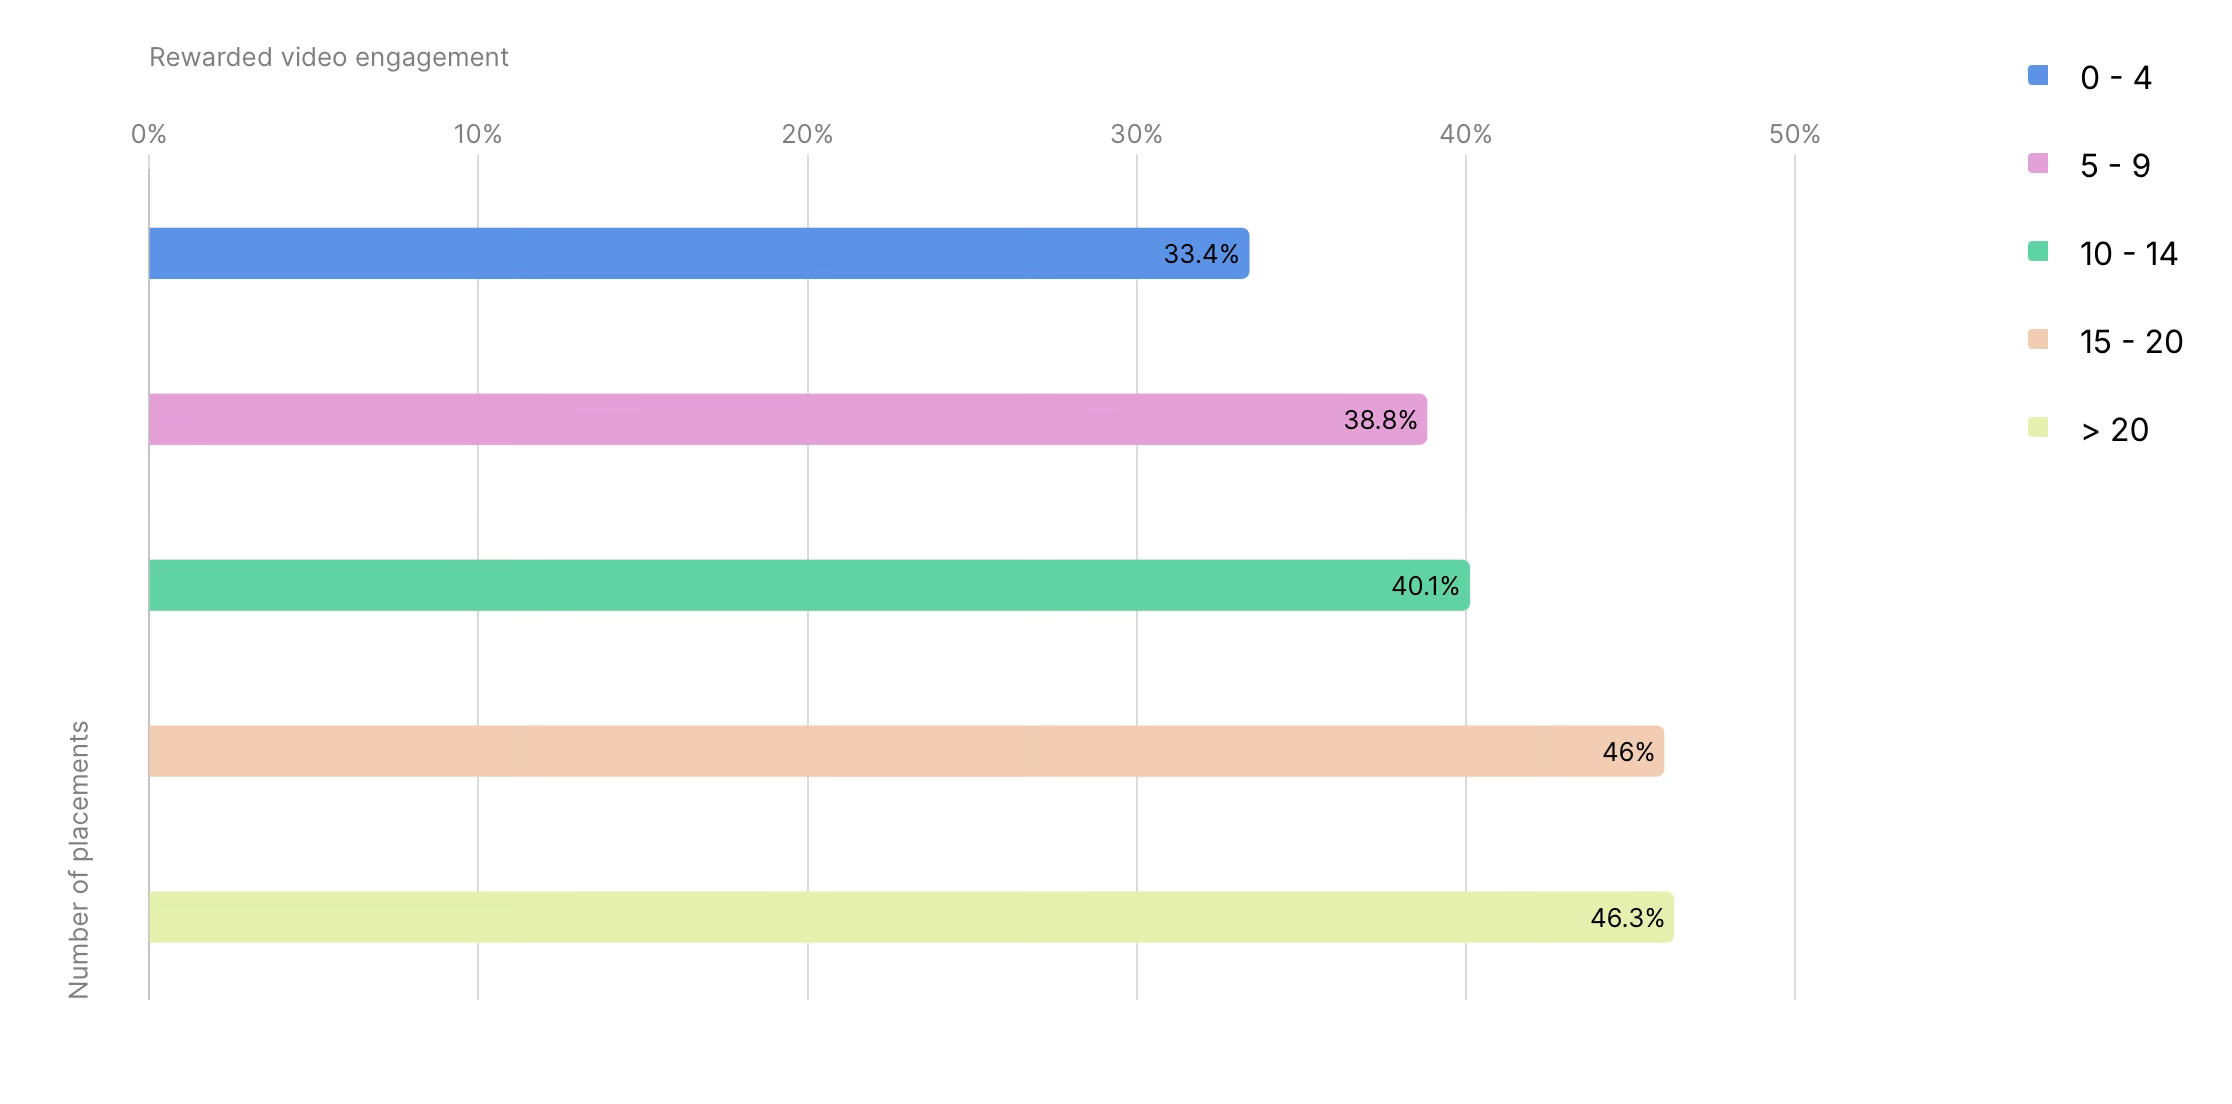
There’s a direct correlation between the number of Rewarded Ad placements and conversion rates. However, after 15-20 placements, conversion growth almost stops.
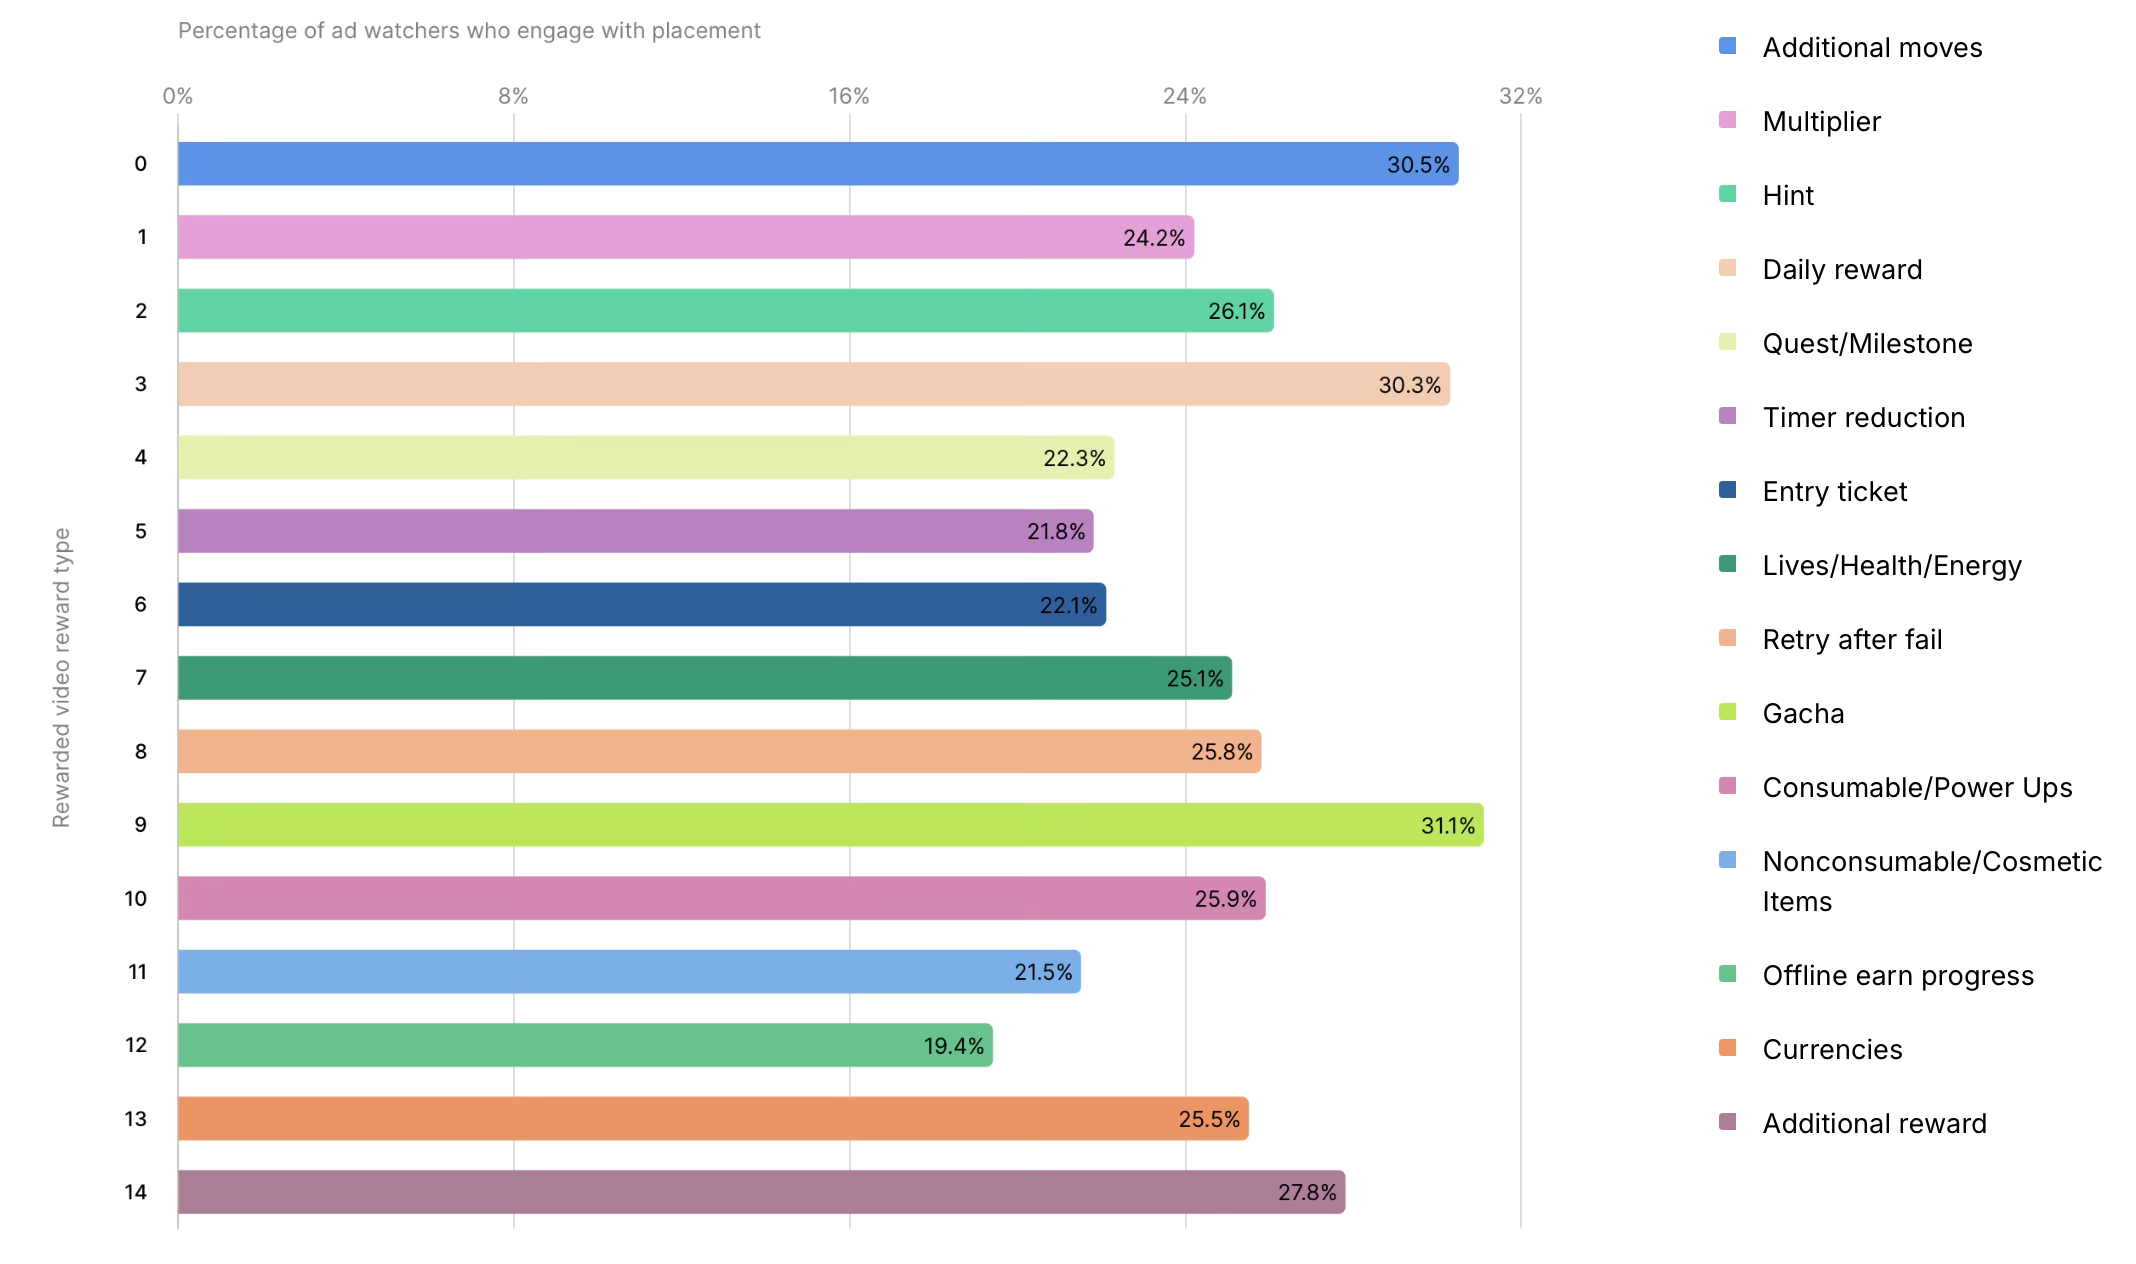
Gacha (31.1% conversion), extra moves (30.5%), and daily rewards (30.3%) are the top motivators for watching Rewarded Ads.
Trend 4: Offerwalls can attract highly motivated users
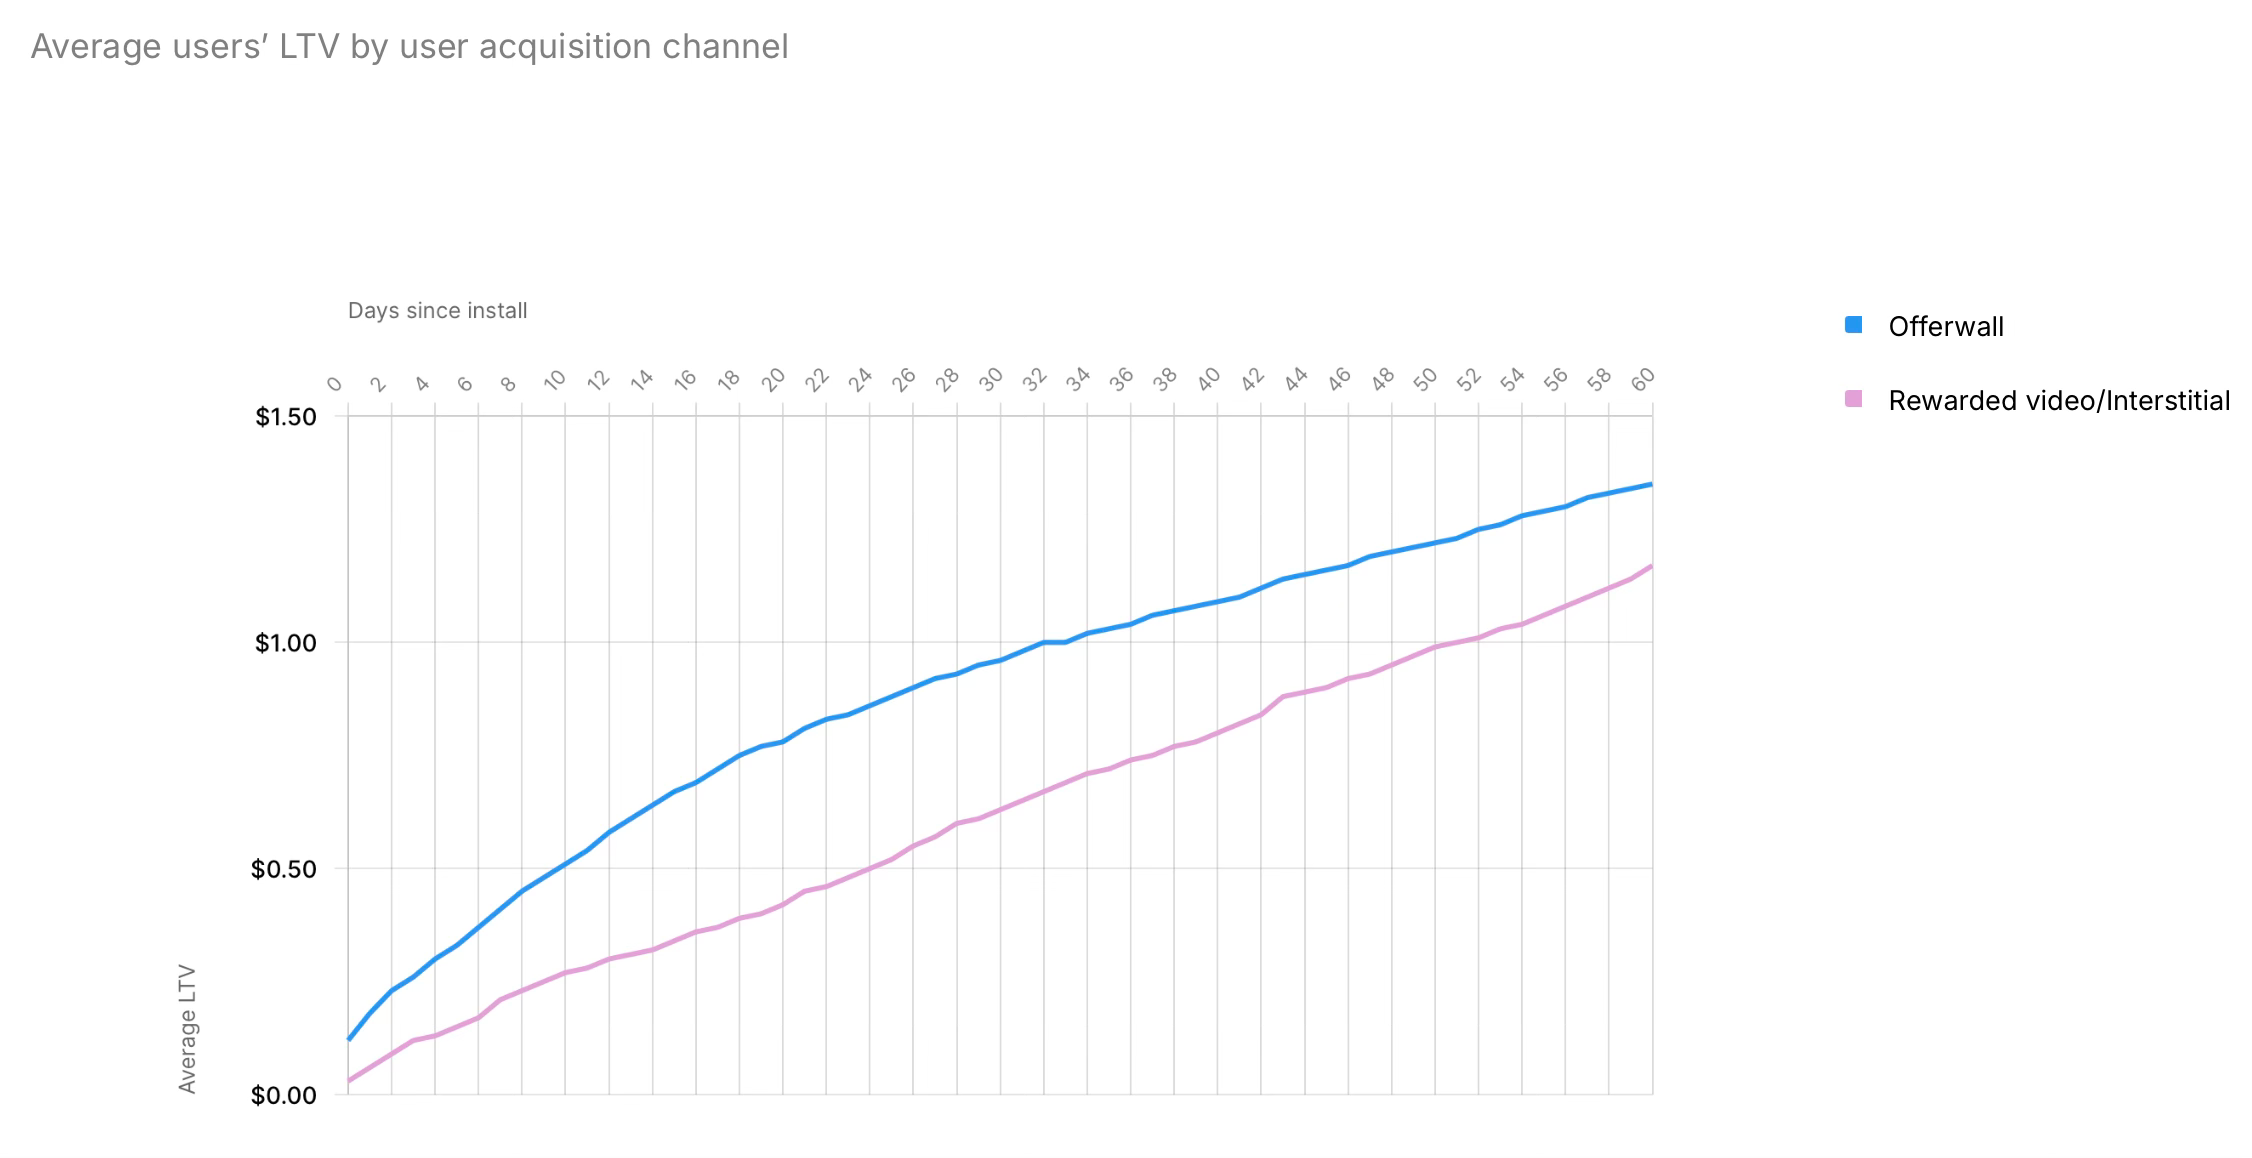
Users who come through offerwalls tend to have a higher LTV than those who come after watching other types of ads. The difference on the day of installation is 299%, decreasing to 16% by day 60.
❗️In the long run, users' motivation might not be as high.

Retention rates for users acquired through offerwalls are generally higher than for users who came through Rewarded Video or interstitial ads. The D7 difference is 71.7%, but it decreases to 12% by D30.

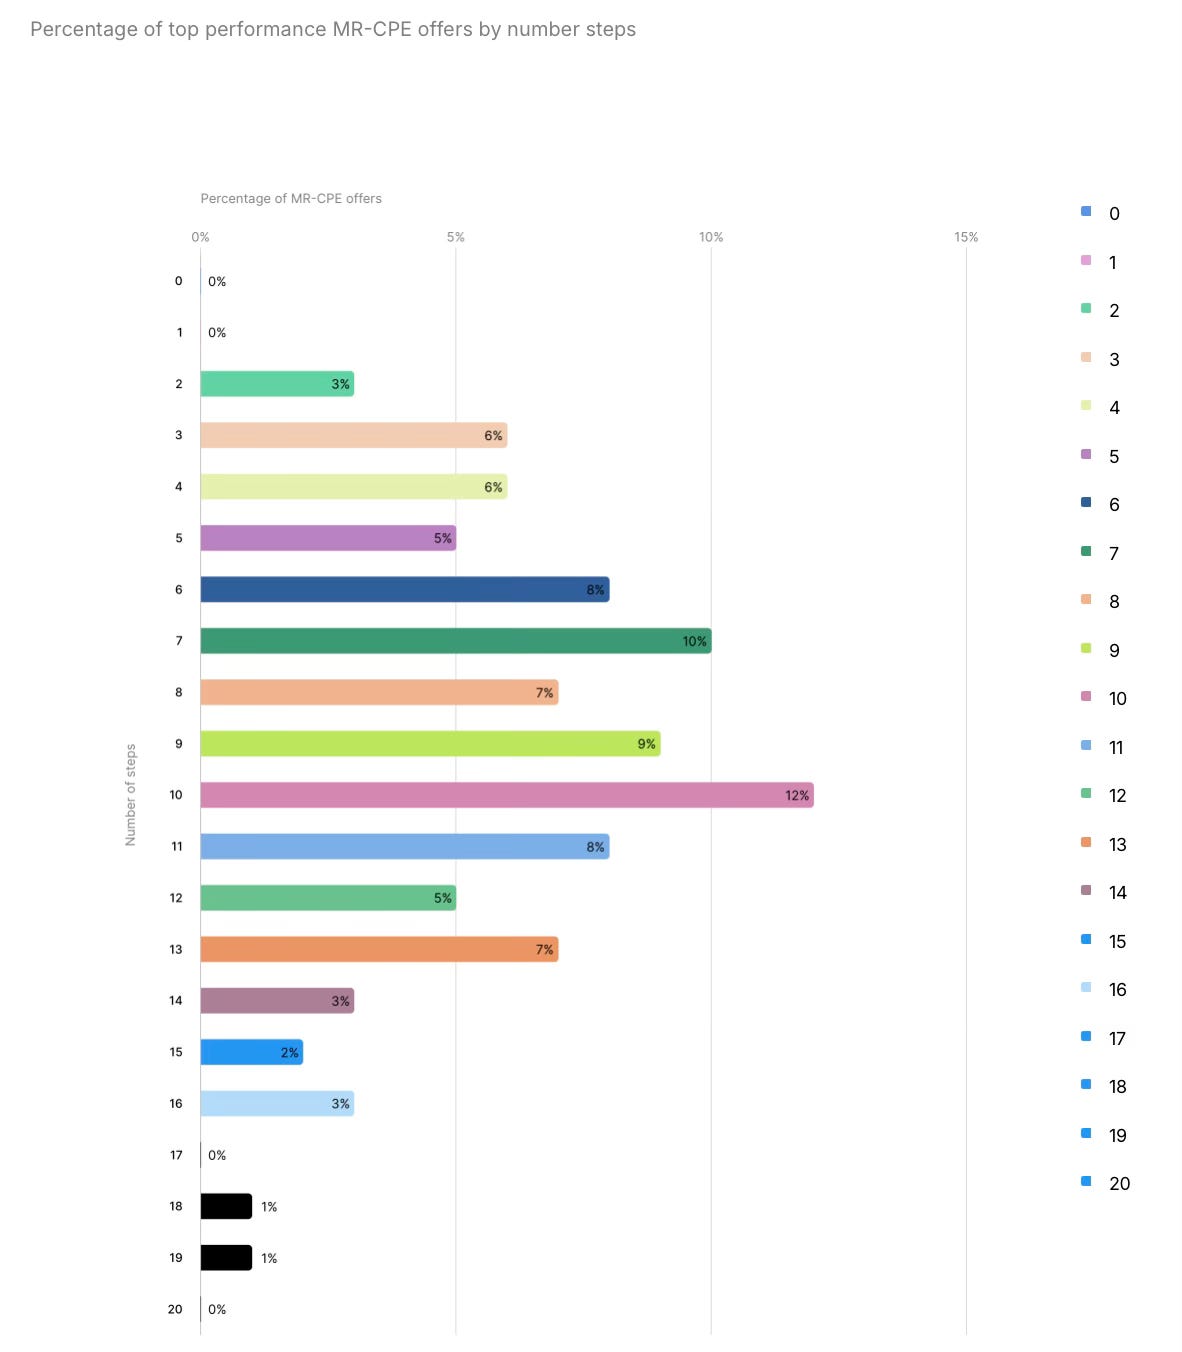
MR-CPE (Multiple Reward Cost Per Engagement) campaigns are some of the best in terms of results. In 24.2% of these campaigns, there are 3 to 6 steps; 37.3% have 7 to 10 steps; and 23.2% have 11 to 14 steps.
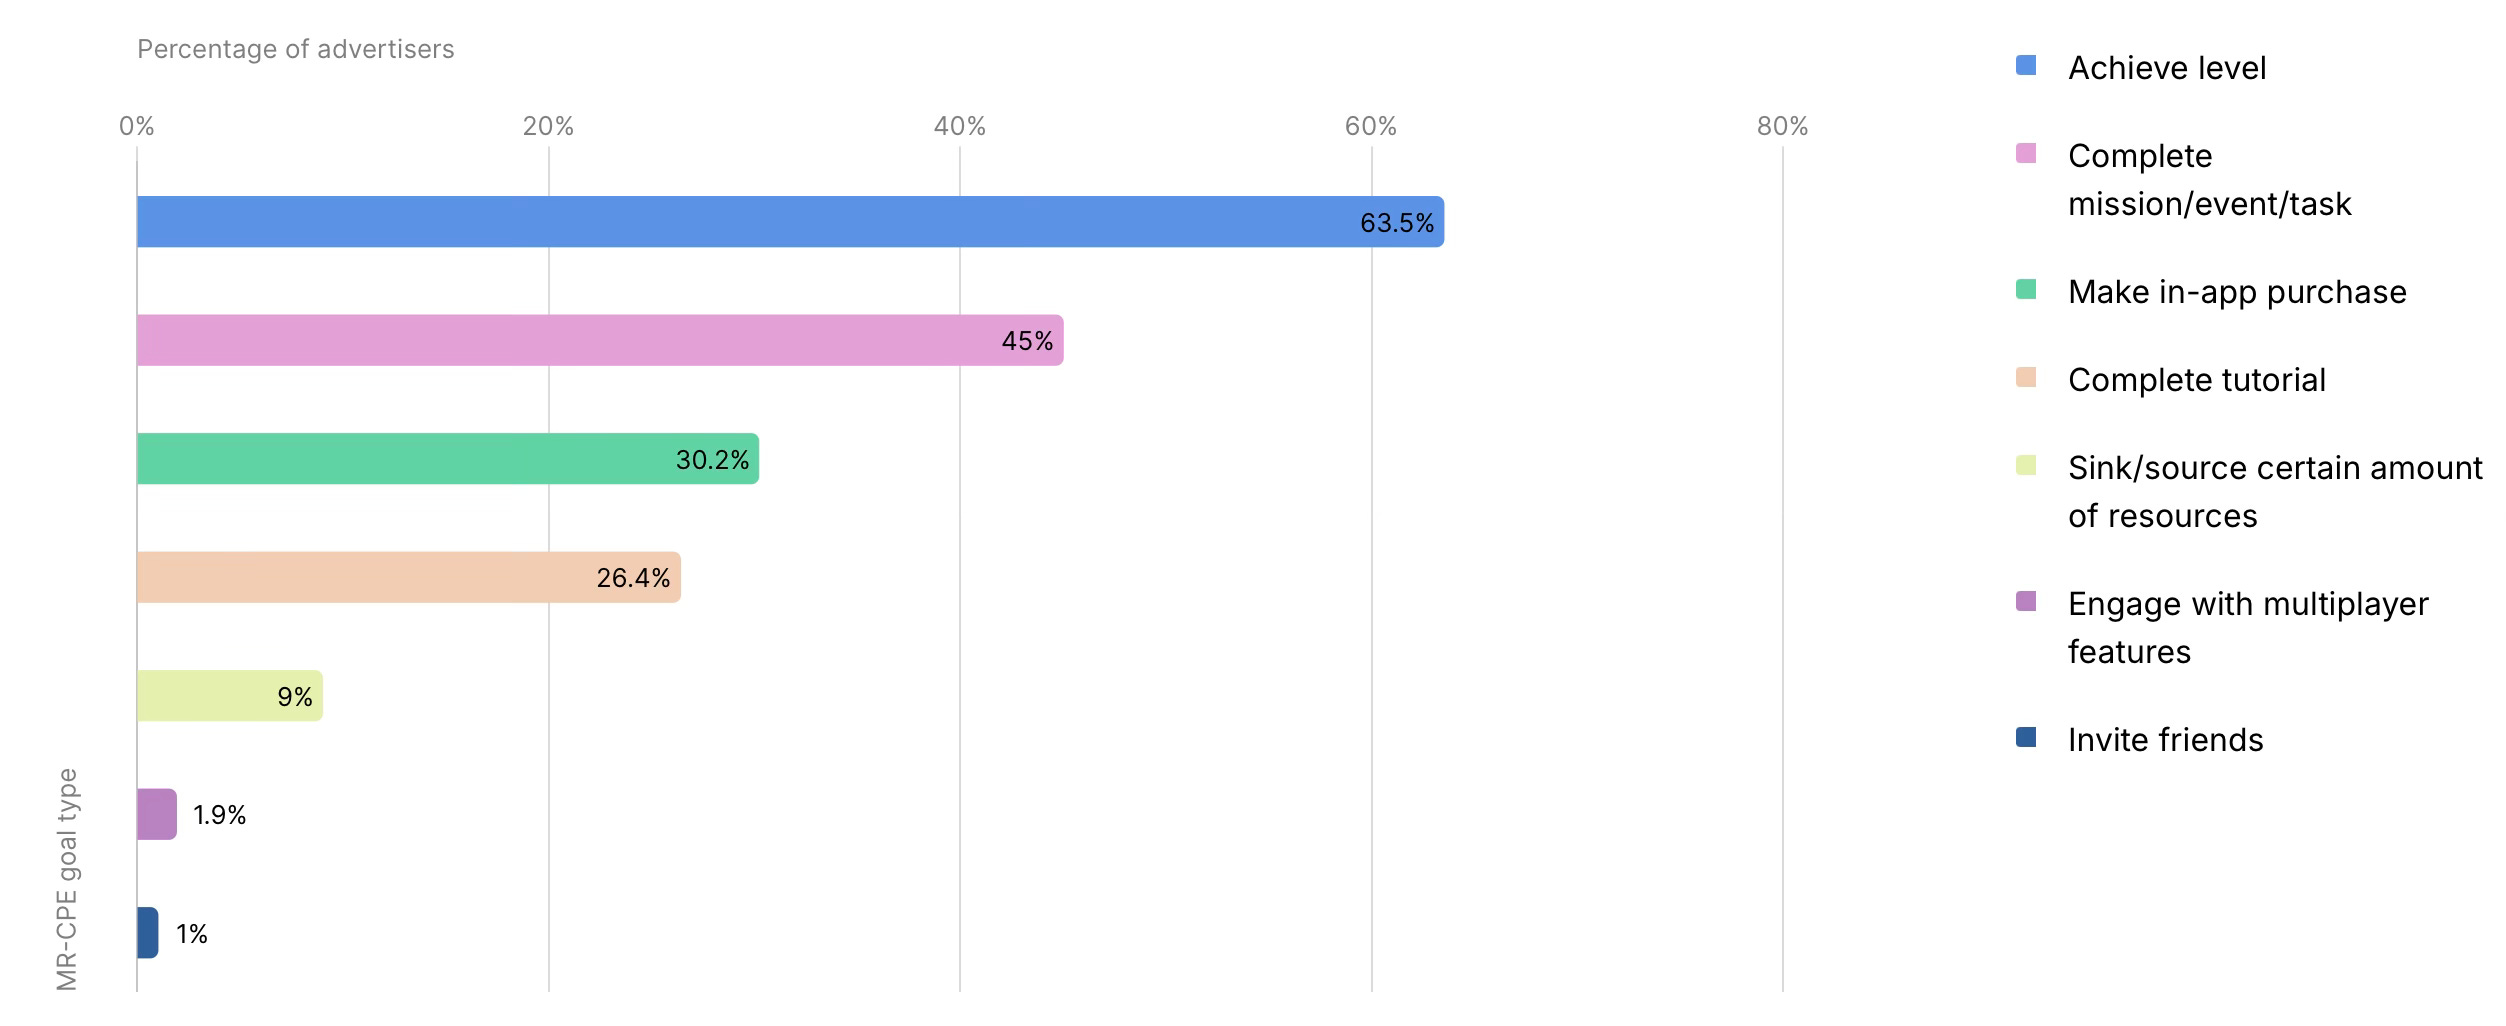
MR-CPE campaigns allow setting time limits. 63.5% of advertisers tie level completion to a time limit, 45% tie certain tasks, 30.2% tie IAP completion, and 26.4% tie tutorial completion to time limits.
The more complex the task, the lower the conversion rate. Almost 100% of users complete tasks tied to tutorial completion, but only 4.2% complete tasks related to IAP purchases.
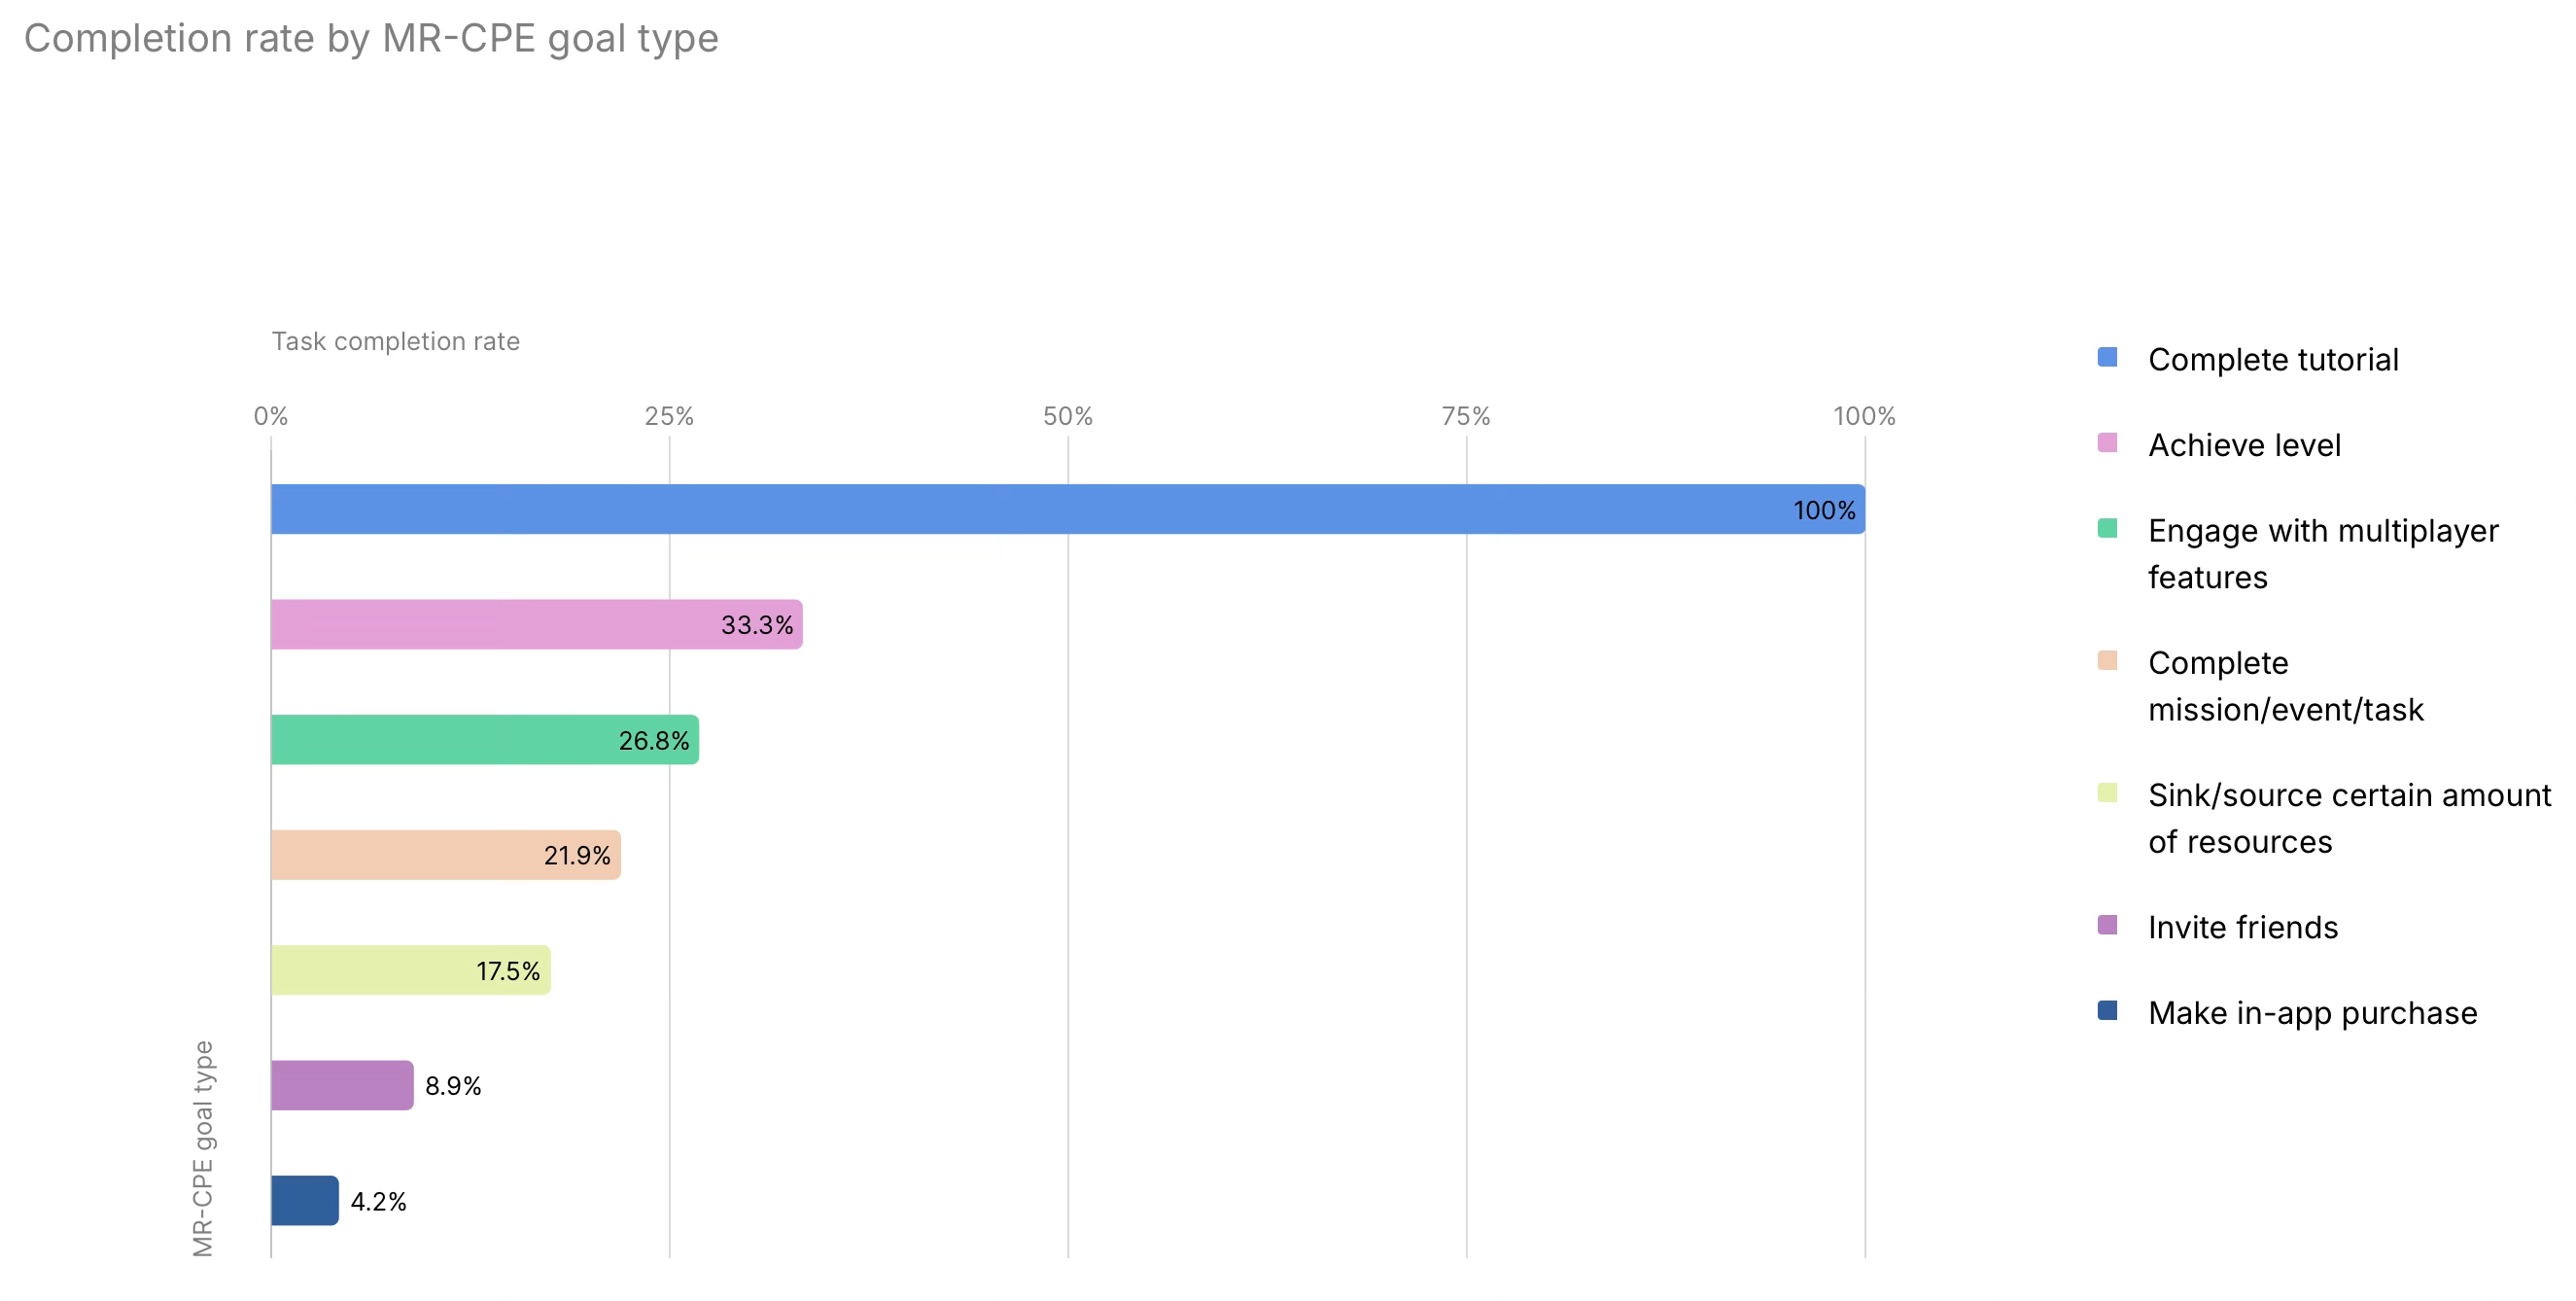
The average cost per paying user in the MR-CPE model is $21.17. A user who completes the tutorial is much cheaper at $0.64.

Trend 5: Offerwalls complement IAP revenue
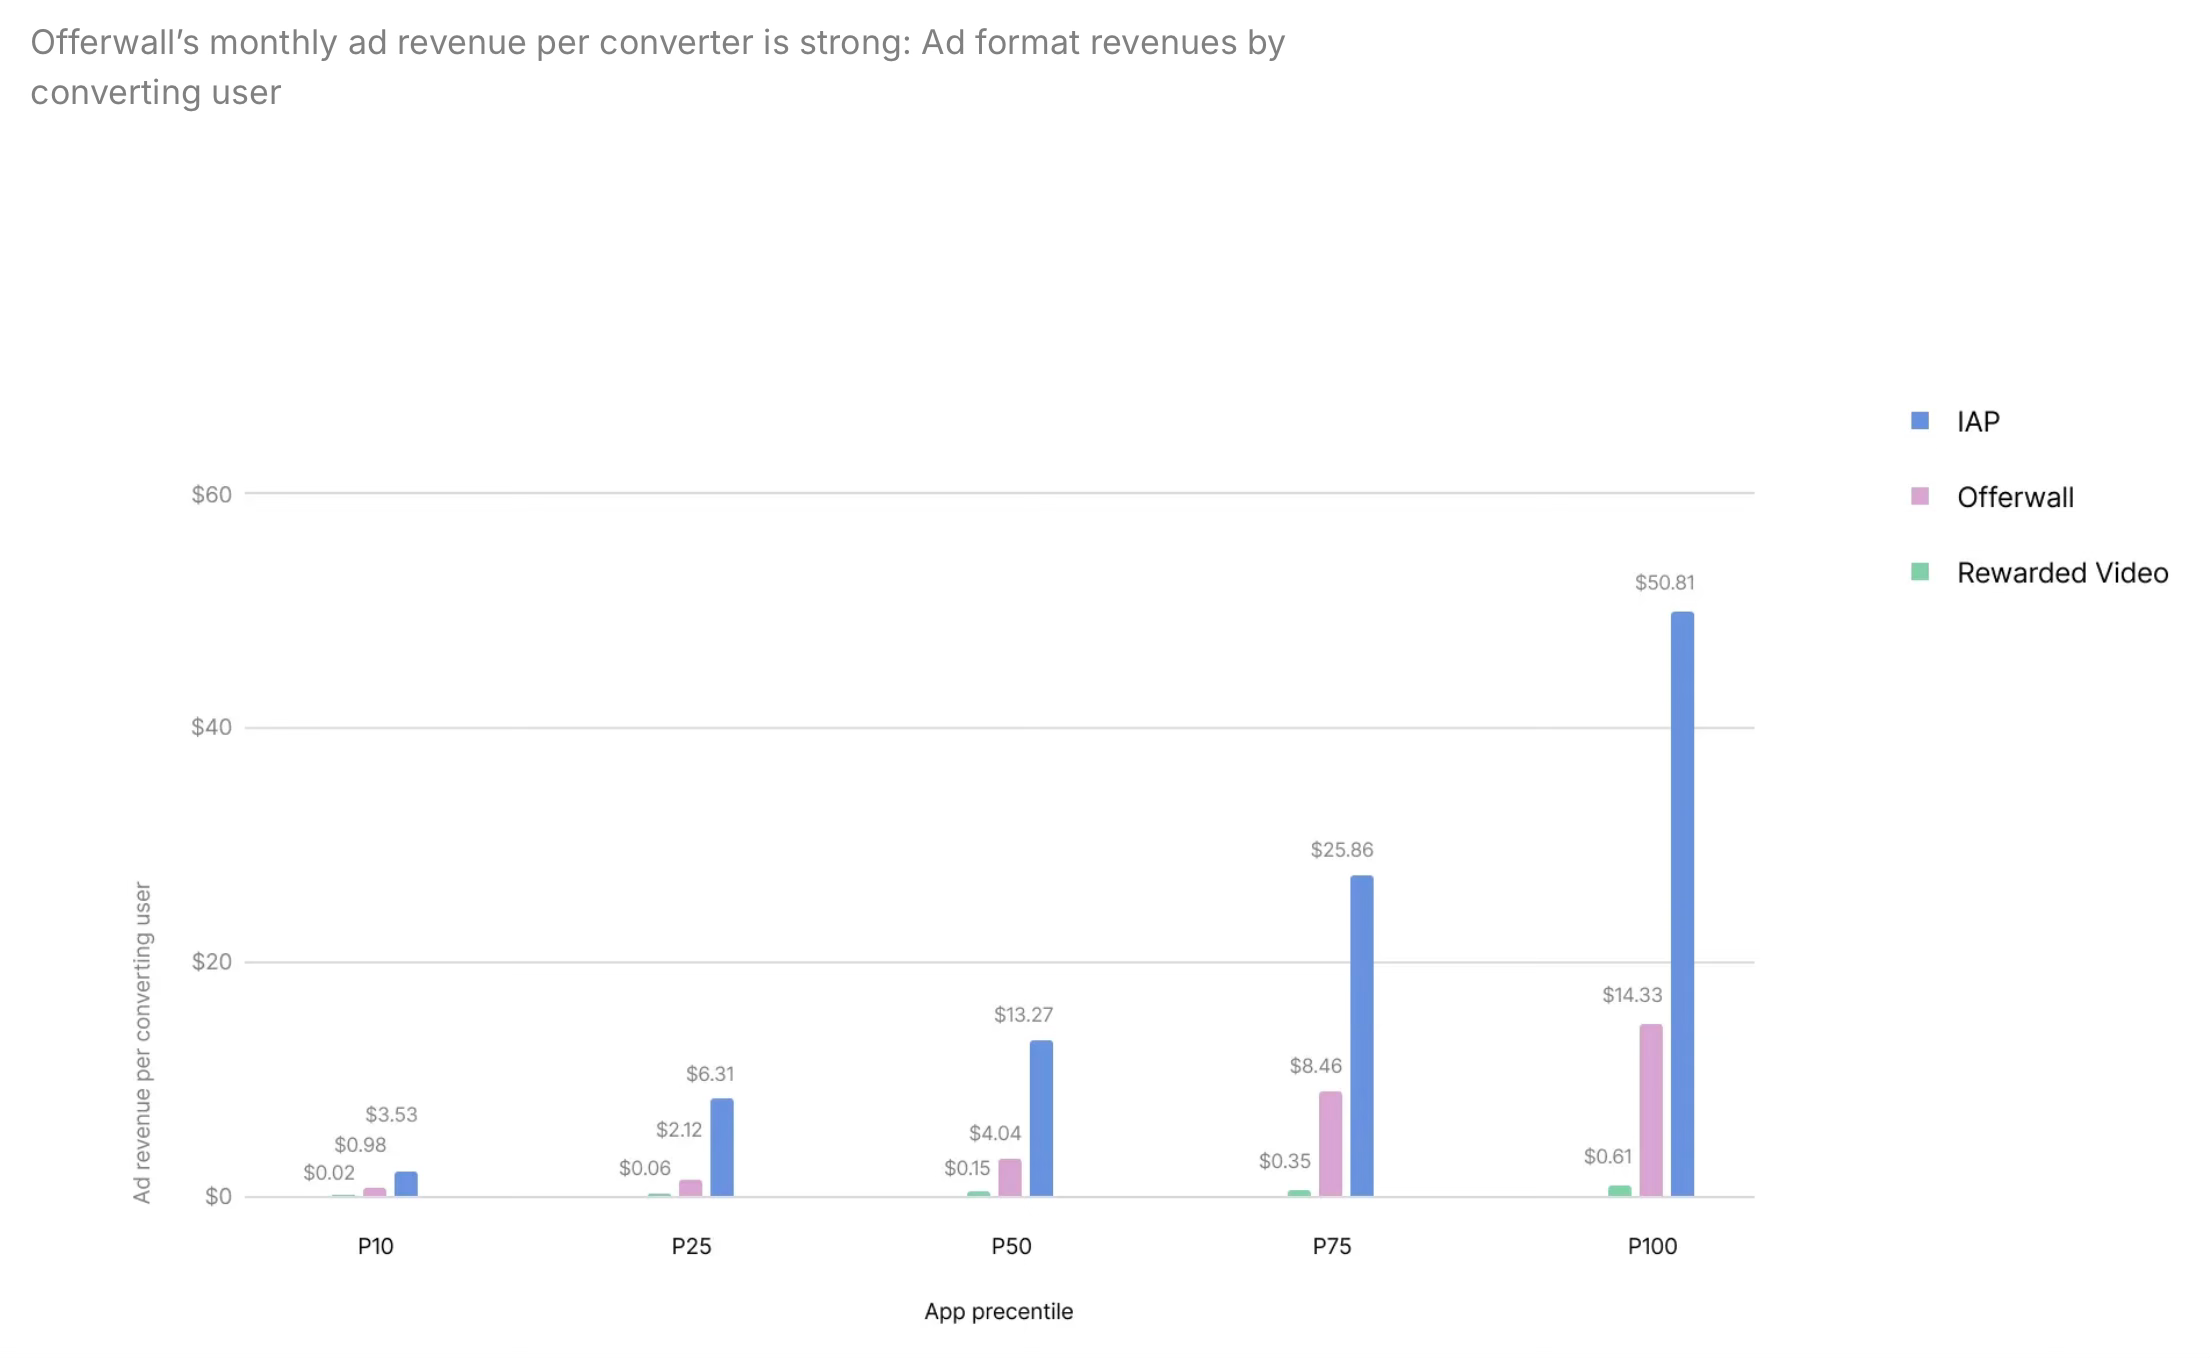
According to Unity, monthly ad revenue from offerwalls exceeds average ad revenue from Rewarded Videos. For the 50th percentile, monthly IAP revenue per paying user is $13.27, revenue from the same user via offerwalls is $4.04, and revenue from Rewarded Video is $0.15.
Offerwalls located in the lobby or on the main screen of a game are opened more often. The same goes for pop-ups.
GSD & GfK: August'24 PC/Console sales in the UK dropped by 1.5%

Analytical platforms report only actual sales figures obtained directly from partners. The mobile segment is also not included.
Game Sales
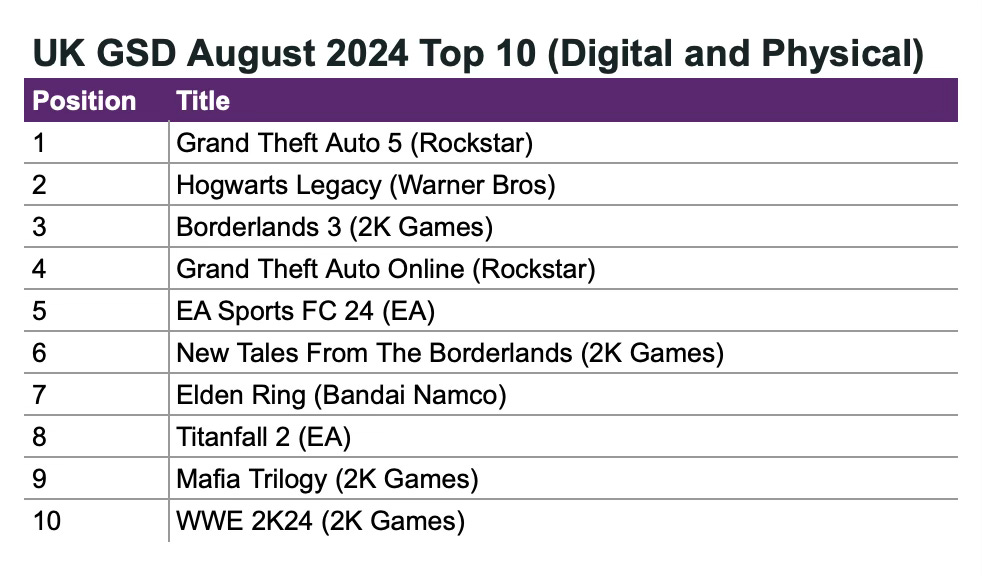
1.74 million games were sold in the UK in August 2024. This is 1.5% less than a year earlier.
Grand Theft Auto V took first place; Hogwarts Legacy was second; Borderlands 3 ranked third.
❗️Star Wars: Outlaws did not make the chart because the data was collected before August 24th.
Among new games, Madden NFL 25 performed best. The game debuted at 41st place on the chart, with sales 31.5% lower than the previous game in the series.
75% of sales recorded by companies in August 2024 were digital. This is 10 percentage points higher than in August 2023.
Hardware Sales
Fewer than 75,000 consoles were sold in the UK in August. This is 3% less than in July and 45% less than in August last year.
The PlayStation 5 remains the leader in sales. In August, numbers increased by 4% compared to July. But compared to last August, the drop is over 57%.
Nintendo Switch sales fell by 10% in August compared to July, and by 30% compared to last year.
Xbox Series S|X sales in August repeated July’s results but dropped 22% compared to last year. However, in terms of units sold, it surpassed the Nintendo Switch.
516.7 thousand accessories were sold in the UK in August. This is a 4.5% drop compared to July and a 9.6% drop compared to August 2023.
DualSense was the best-selling accessory in August (and for the whole year). PlayStation Portal ranked first in revenue (and sixth in units sold).
Tenjin: Ad Monetization in Mobile Games in Q2'24

The data for the report was collected by Tenjin and Clever Ads Solutions.
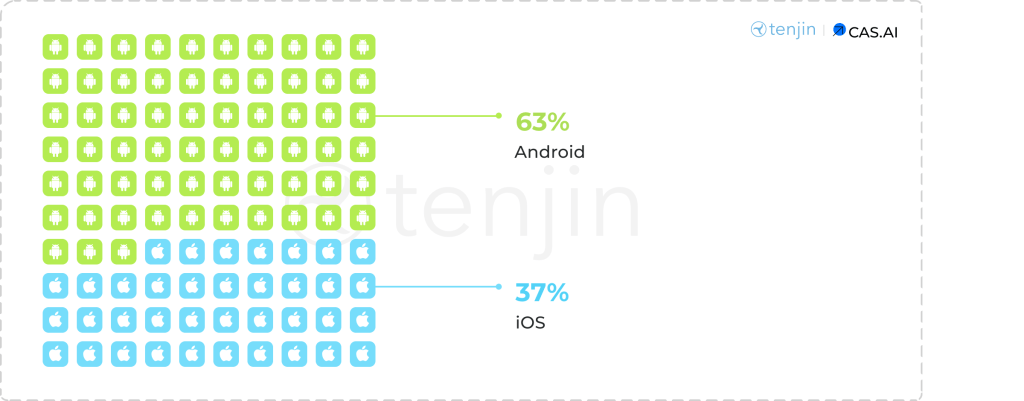
General data
63% of ad revenue recorded in Q2'24 came from Android. In Q1’24 it had 59%.
Ad revenue on iOS in the US accounted for 55% of the total volume.
Countries outside the top 10 on Android generate 29% of total ad traffic.
Japan, the US, and Australia are leaders in eCPM across different formats on iOS.
The US is the clear leader in eCPM on Android across all formats.
iOS Numbers

The US (52%), Japan (10%), and Russia (8%) were the leaders in ad revenue on iOS in Q2'24.

Looking at ad networks, 35% of ad traffic comes from AppLovin; 17% from Mintegral; 16% from Google Admob; 12% from Unity Ads; and 8% from ironSource. Other networks make up the remaining volume.

The average eCPM for banners in Q2'24 was $0.99 in the US, $0.73 in Russia, and $0.70 in Canada.

The leaders in average cost for Interstitial Ads were the US ($23.17), South Korea ($17.8), and Australia ($16.54).
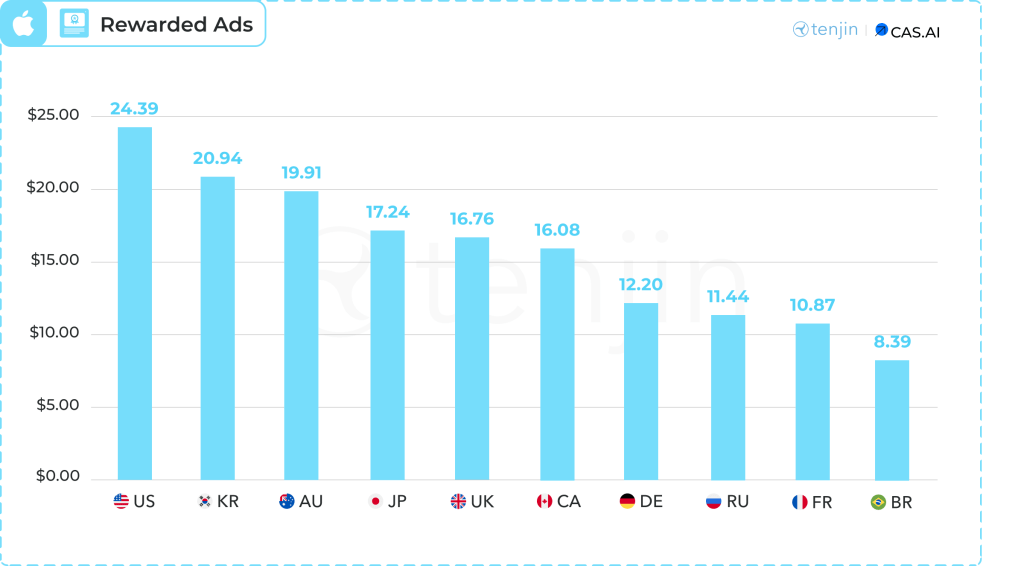
The average eCPM for Rewarded Ads in the US was $24.39; in South Korea, $20.94; and in Australia, $19.91.
Consider subscribing to the GameDev Reports Premium tier to support the newsletter. Get access to the list of curated articles & archive of Gaming Reports that I’ve been collecting since 2020.
Android Numbers

The US (30%), Russia (14%), and Brazil (6%) were the leaders in ad revenue on Android in Q2'24.

Google Admob leads on Android with 26%. It is followed by AppLovin (17%), Mintegral (16%), Unity Ads (13%), and Liftoff (5%).

The average eCPM for banners in Q2'24 was $2 in Canada, $1.18 in the US, and $0.86 in Japan.

The leaders in average eCPM for Interstitial Ads were the US ($16.15), Canada ($12.65), and Japan ($11.35).

The average eCPM for Rewarded Ads in the US was $30.25; in Canada, $23.13; and in South Korea, $22.01.
Newzoo: Top-20 PC/Console Games of August 2024 by Revenue and MAU

Newzoo tracks markets in the USA, UK, Spain, Germany, Italy, and France.
Revenue - All Platforms
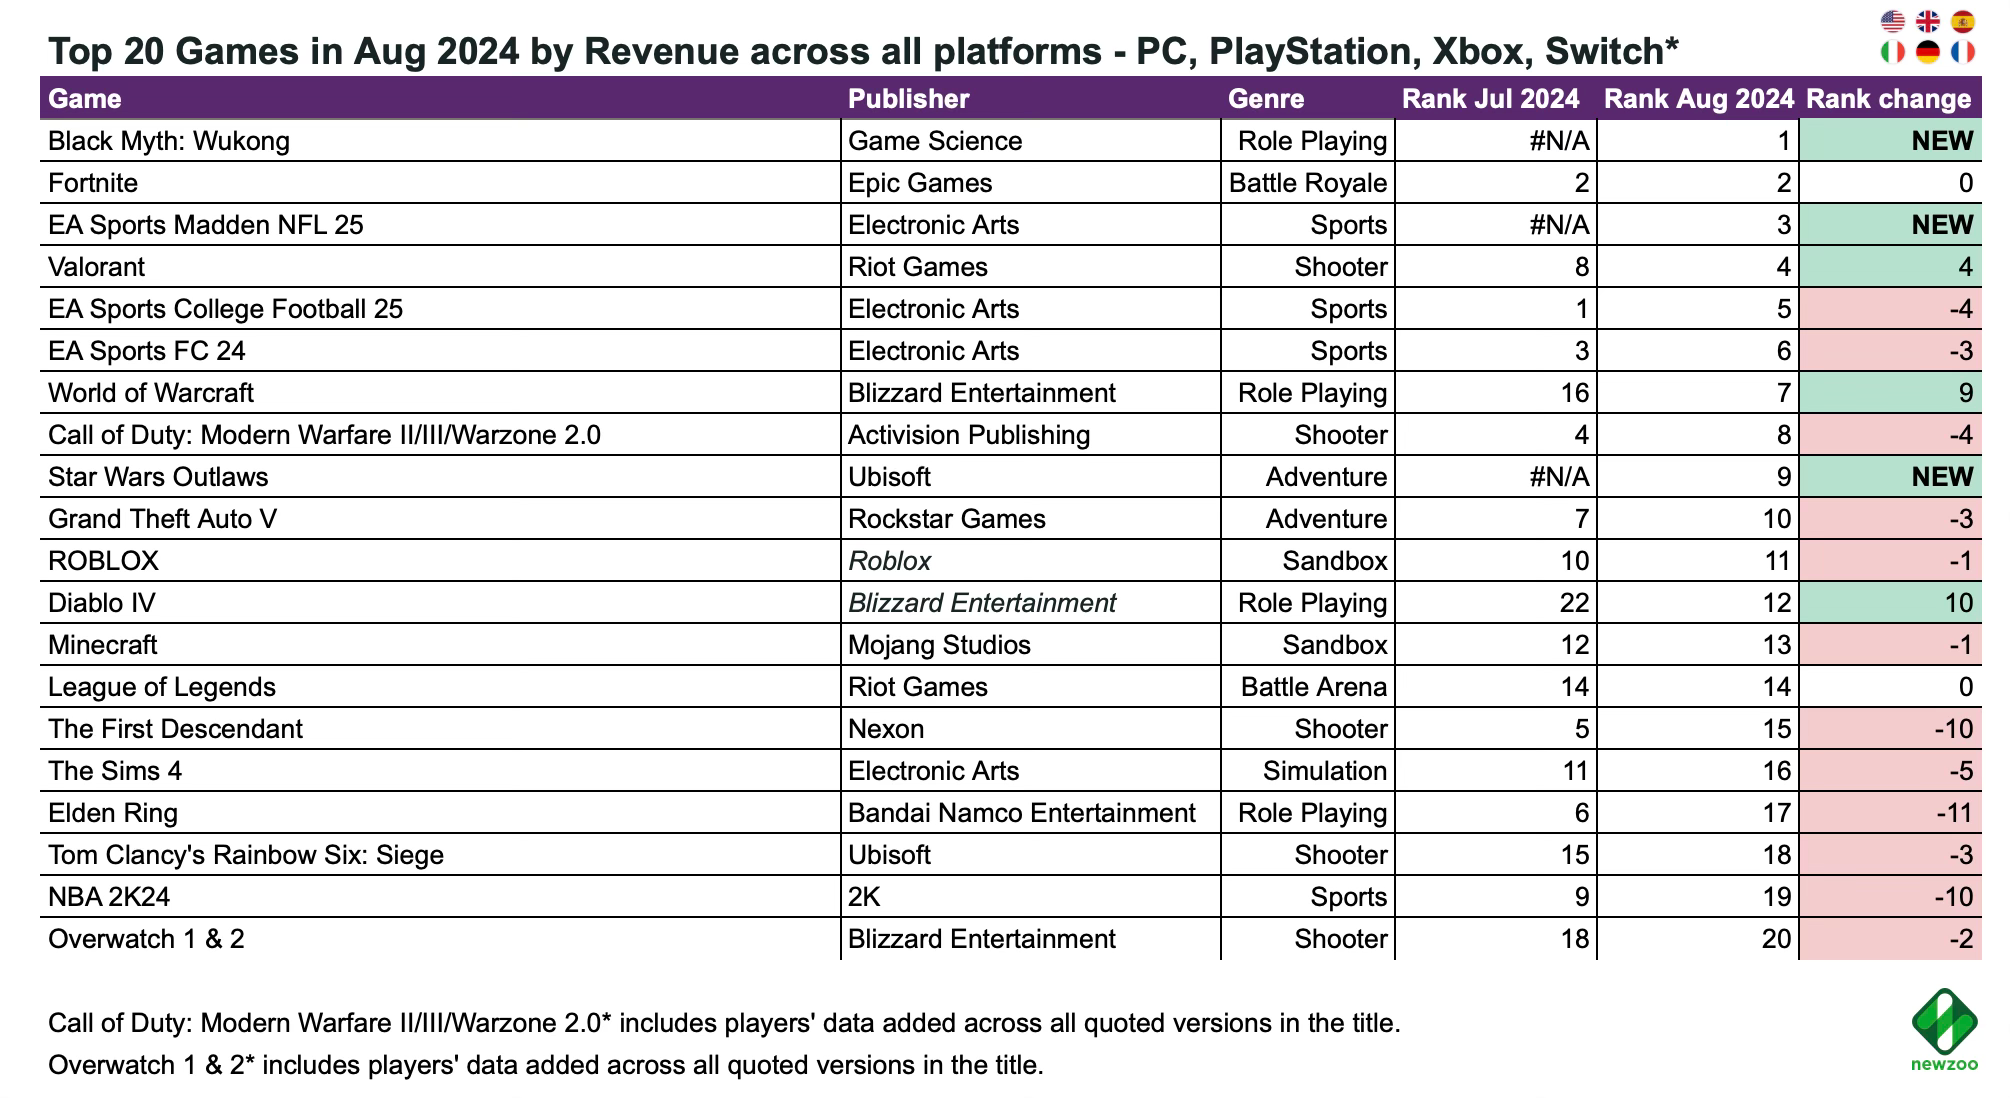
Black Myth: Wukong was the clear leader in August, far ahead of the competition. The game outpaced another major release, EA Sports Madden NFL 25. Most of the game's sales came from PC, while it ranked 3rd on PlayStation in August.
Star Wars Outlaws had a modest start, debuting at 9th place. Ubisoft has already acknowledged that the game's launch sales did not meet the company's expectations.
The First Descendant couldn't hold its place at the top and fell to 17th in the ranking.
Revenue - Individual Platforms


Valorant launched well on consoles, securing 5th place in revenue on Xbox and 6th place on PlayStation.
Crash Bandicoot: N. Sane Trilogy showed significant revenue growth on Xbox, but the game was actually added to Game Pass. The algorithms may have miscalculated this.
Consider subscribing to the GameDev Reports Premium tier to support the newsletter. Get access to the list of curated articles & archive of Gaming Reports that I’ve been collecting since 2020.
MAU - All Platforms


There were a few changes in the overall MAU ranking. However, Fall Guys jumped by 7 positions, Diablo IV by 10, and World of Warcraft by 9.
Black Myth: Wukong entered the top 20 on PC by MAU. It didn’t make it on PlayStation, but this could be due to its late release (August 19).
The free-to-play game Asphalt Legends Unite debuted in 11th place by MAU. The game is also available on mobile platforms.
GSD & GfK: Sales of PC/console games in Europe increased in August'24; GTA V is the best-selling game of the month

The analytics platforms report only the actual sales figures directly received from partners. The mobile segment is not included.
Game Sales
11.8 million PC and console games were sold in Europe in August. This is 7% more than in August 2023.
Grand Theft Auto V is the month's best-selling game, with its sales growing by 5.7% year-over-year (YoY).
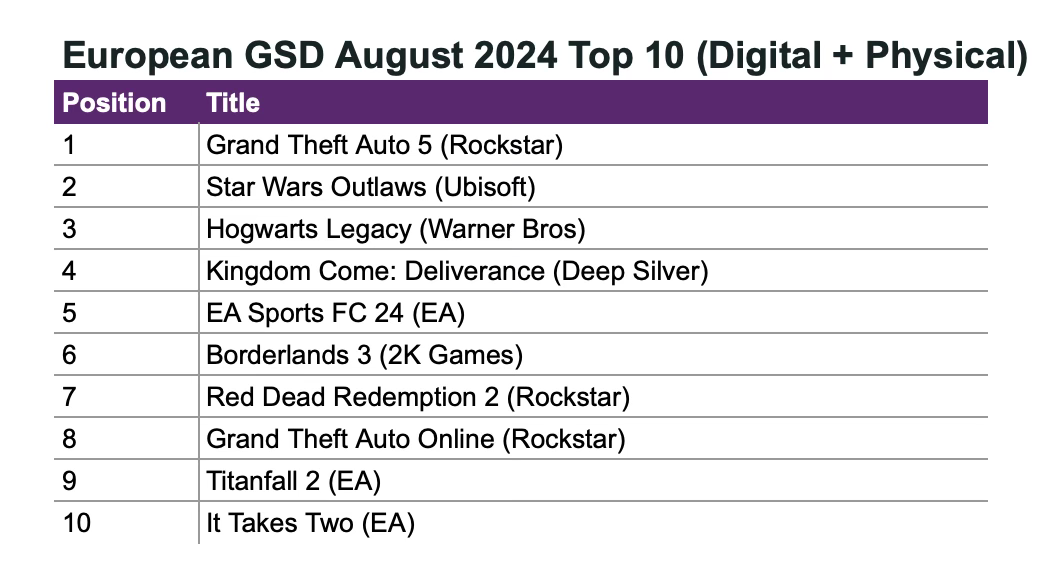
In second place is Star Wars: Outlaws. The game's sales can be described as disappointing, as in the first week it sold only half the number of copies that Star Wars Jedi: Survivor sold in the same period in 2023. However, sales are higher than in Star Wars: Squadrons.
❗️Black Myth: Wukong ranked 68th on the chart. However, this is due to the fact that the company did not share data on digital sales.
The infamous Concord ranked 347th in sales in Europe.
Hardware Sales
More than 300,000 consoles were sold in Europe in August 2024. This is 42% less than in August 2023, but 12% better than July 2024. In monetary terms, sales dropped 29% compared to last year.
The PlayStation 5 holds first place by a large margin, despite a 50% YoY sales decline.
The second place is held by the Nintendo Switch (-25% YoY).
1.1 million accessories were purchased by European users in August 2024. This is 17% less than in August 2023.