


Reports of the week:
PARP: The Polish Gaming Industry in 2025
Games and Numbers (September 9 — September 21, 2026)
Moloco: How the Best Mobile Games First Year Looks
Alinea Analytics: Steam earned $15 billion in the first eight months of 2026
Niko Partners: The Chinese Gaming Market in 2026
GameAnalytics: Key Roblox and Roblox Game Metrics in 2026
PARP: The Polish Gaming Industry in 2025
The Game Industry of Poland - Report 2025 was published by the Polish Agency for Enterprise Development (PARP). The Game Industry Conference collected the data, and Jakub Marszałkowski of Indie Games Poland led the research. Comments from market participants come from a Bankier.pl article.
The industry
As of October 2025, Poland has 824 active studios and publishers.
At the same time, at least 120 of the studios counted as active in the 2023 report have since closed, halted operations, or stopped making games. That is roughly one in four studios in two years.

Managing a distributed dev team shouldn’t mean managing a compliance headache. Mellow’s Contractor Management gives you ready-made contracts, IP compliance, and automated payouts for contractors in 150+ countries — for $35/month per contractor.
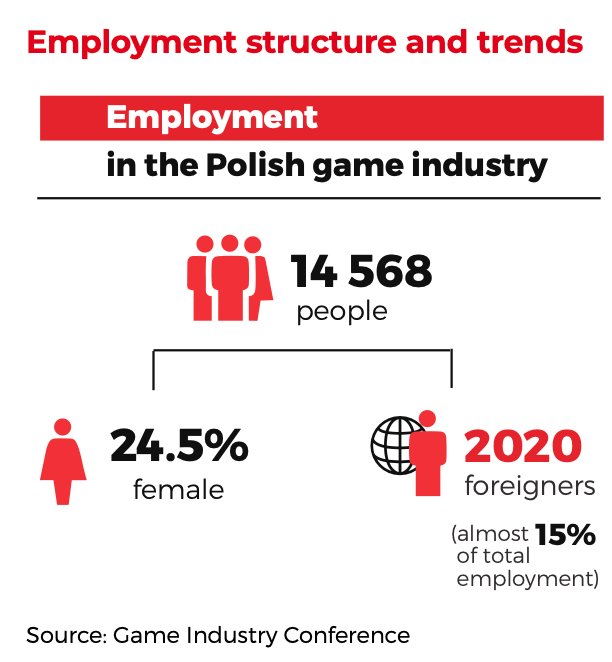
The Polish games industry employs 14,568 people. The previous report had 15,290. Women make up 24.5% of employees, and another 2,020 people (almost 15%) are foreigners. PARP notes that the number of foreign-owned studios in the country is growing. For example, Larian and Activision opened offices in Warsaw over the last two years.
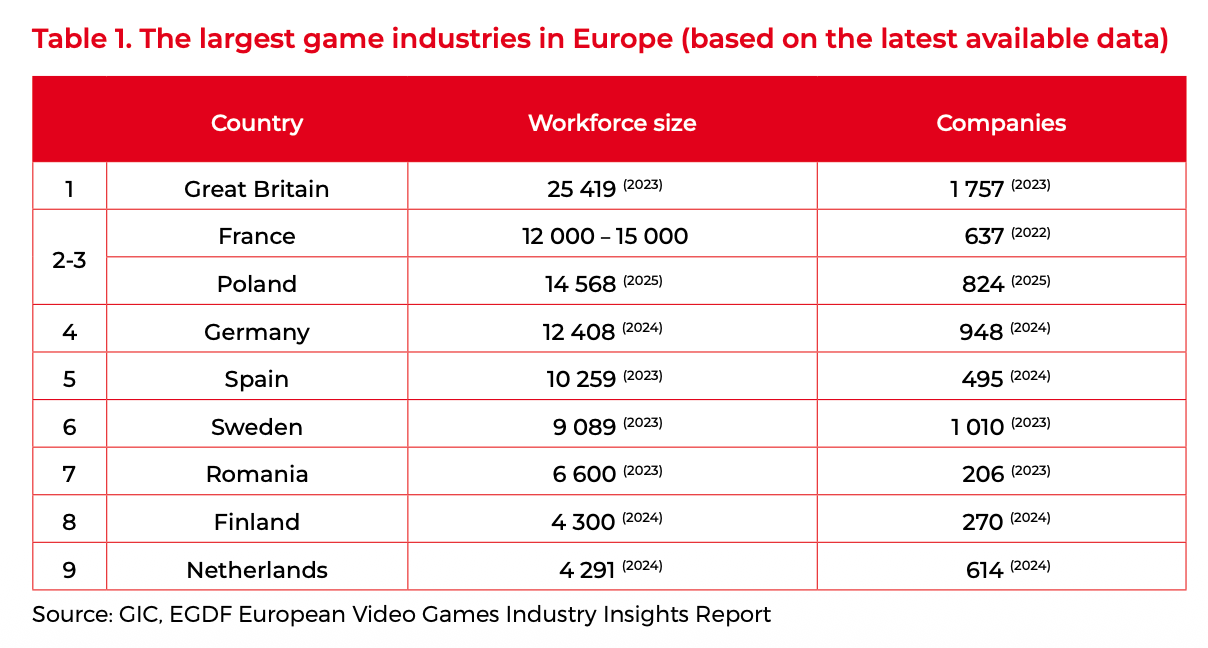
By headcount, Poland shares 2nd-3rd place in Europe with France (12,000 to 15,000 people). The UK leads by a wide margin, with 25,419 people and 1,757 companies. Germany is fourth, with 12,408 people. That said, the comparison uses 2025 data for Poland and older data for the other countries.
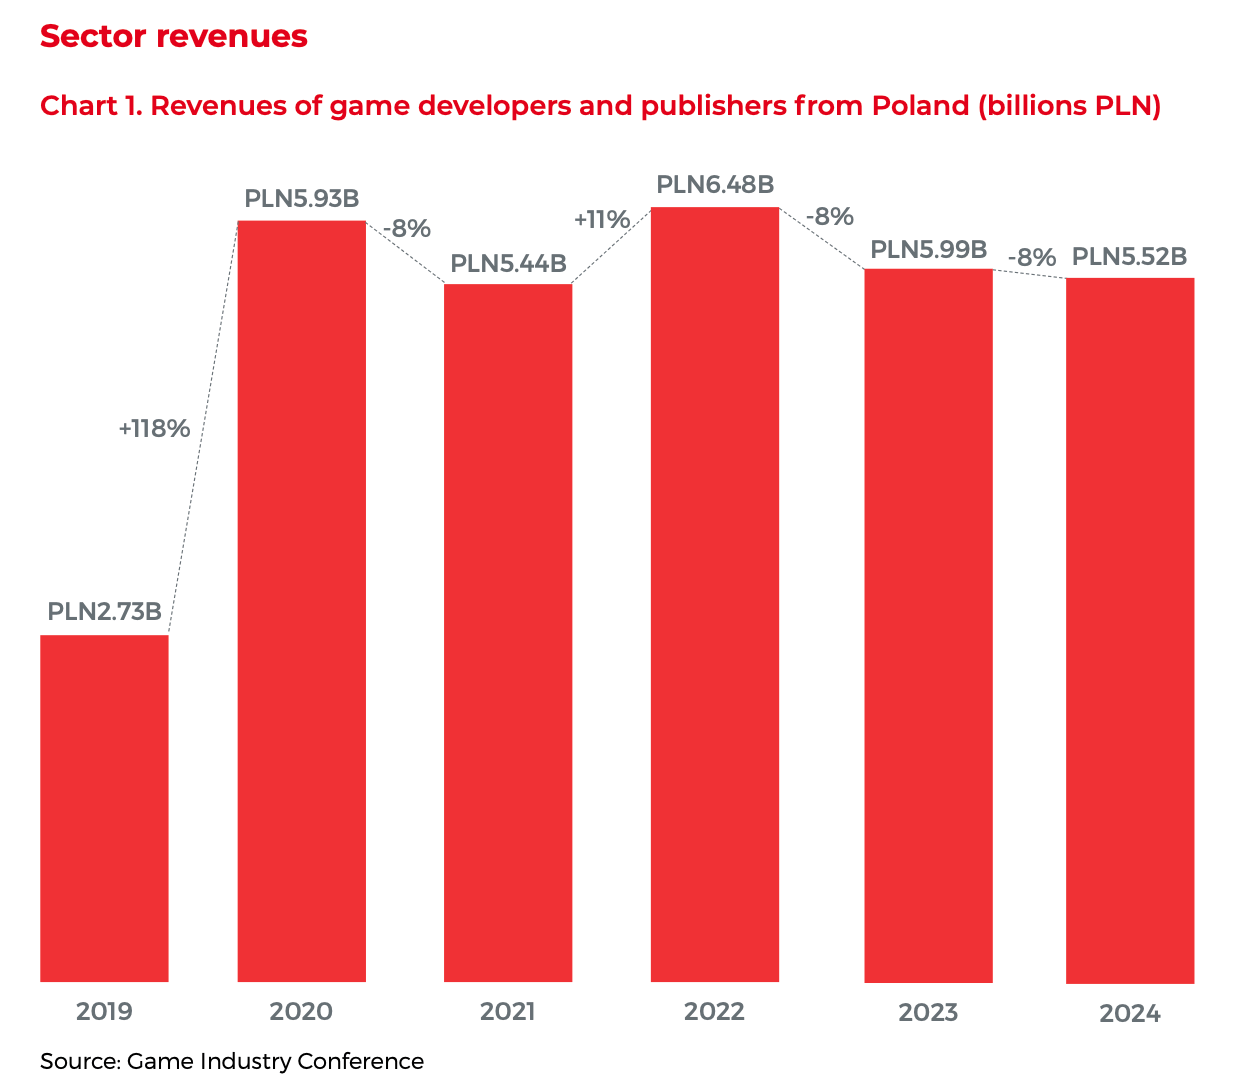
Polish developers and publishers earned PLN 5.52 billion (€1.293 billion; -8% YoY) in 2024. The peak was in 2022, at PLN 6.48 billion.
Large companies depend heavily on release cycles. Techland’s revenue fell 80% in 2023, from PLN 1.12 billion to PLN 229 million, after a record year with Dying Light 2. Excluding the largest studios, the rest of the industry stagnated in 2023 and declined in 2024.
Fewer than a third of Polish studios earn meaningful money regularly. Most are still working on their first commercial release.
97% of Polish games’ revenue comes from sales outside the country. North America, Europe, and Asia each account for 20% to 40% of sales, depending on the game. The top market is most often the US or China. Among European countries, the UK, Germany, and France usually make the top 3.
In 2025, 24 game companies were listed on the main market of the Warsaw Stock Exchange, and another 71 on NewConnect. The median revenue of main-market companies is €6.8 million. NewConnect looks worse: 5 companies have had their operations suspended, 6 have had no meaningful revenue for a long time, and another 13 earned less than €250 thousand in the last fiscal year.
Jakub Marszałkowski believes the stock exchange has become more of a burden for the industry. Companies spend significant resources on it and get almost nothing in return.
Platforms and business models
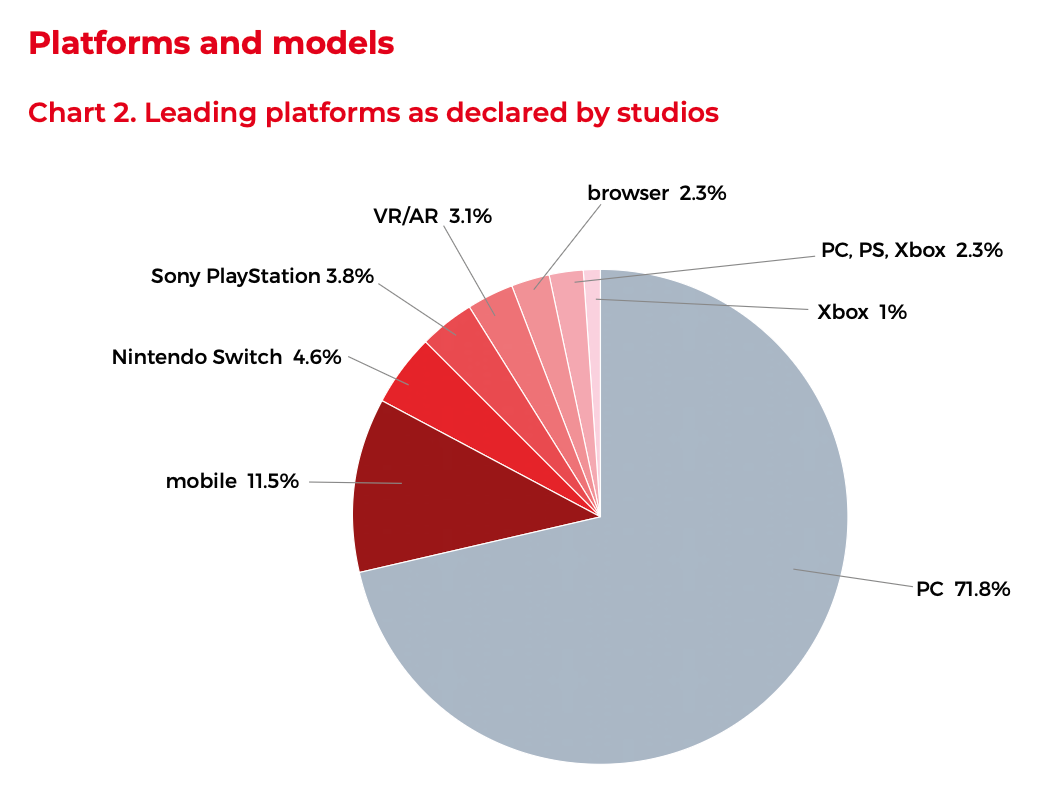
71.8% of Polish studios name PC as their main platform. Mobile accounts for 11.5%, Nintendo Switch for 4.6%, and PlayStation for 3.8%. The share of studios focused primarily on VR/AR more than halved, to 3.1%.
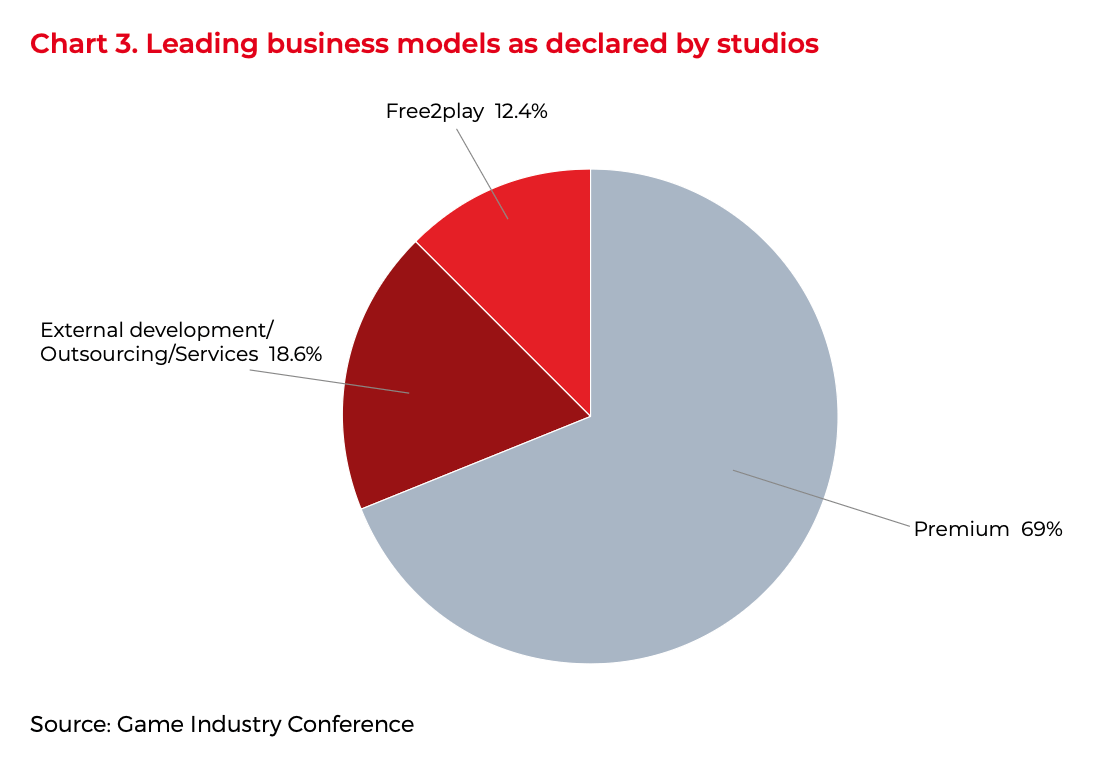
69% of studios make premium games, 18.6% work in outsourcing, and 12.4% make F2P games.
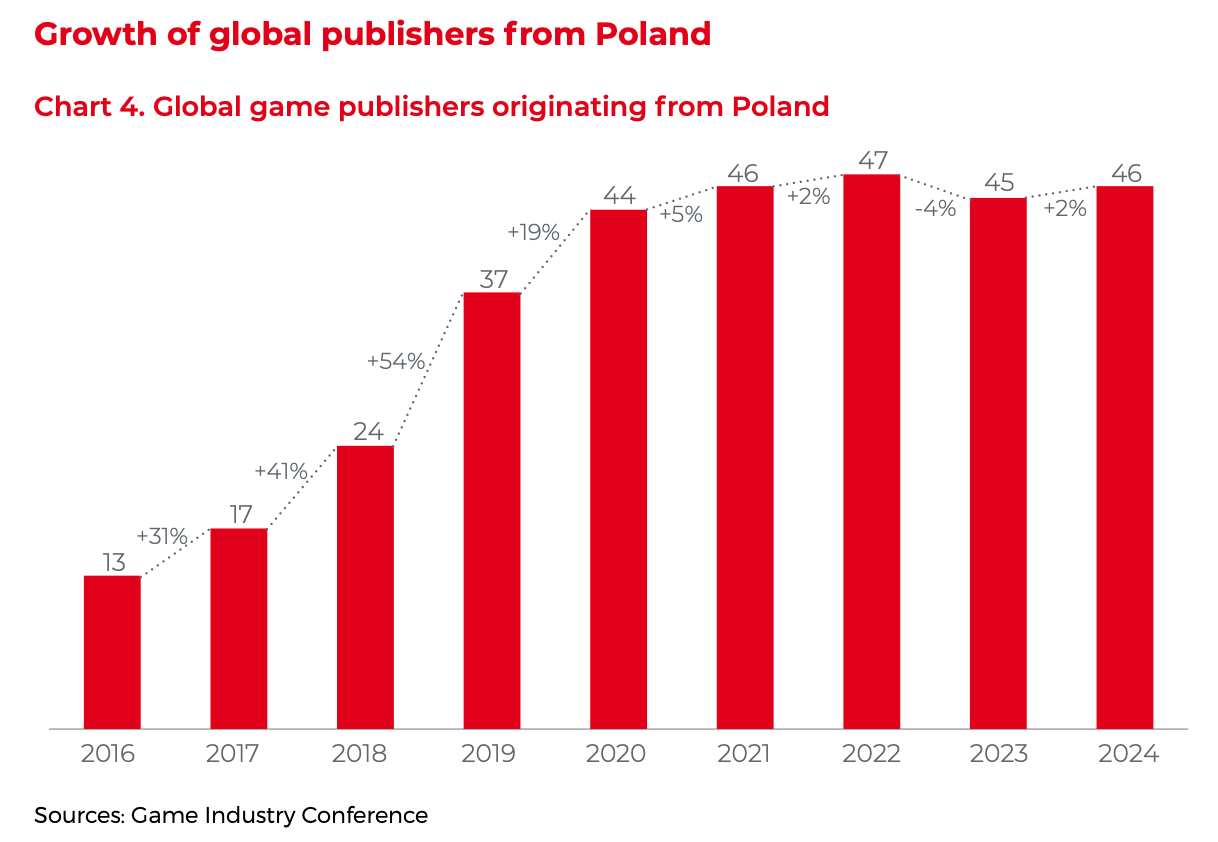
In 2024, 46 publishers in Poland released games globally. In 2016, there were 13. Since 2021, the number has hovered between 45 and 47.
Polish studios release more than 450 games every year. Over the last two years, releases declined slightly, mostly because of the mobile segment and VR.
Since 2014, 41 games from Polish developers have sold more than a million copies. 15 new IPs have joined this club since the previous report. Only a quarter of them are AAA projects.
Funding and competition
Until recently, Polish game development grew by more than 20% a year. According to Marszałkowski, the main reason for the downturn is funding. Investors have become more cautious, publishers have pulled out, and access to capital has been missing for the third year in a row.
PARP notes that the crisis among international publishers hit Poland hard: payment delays, budget cuts, and project cancellations. Polish studios are also forced to release games too early because development money runs out.
All state support programs for games in Poland ended in December 2023. The only one still running is a small video game support program at the Creative Industries Institute. For comparison, Germany has a support program worth €125 million a year.
In early 2026, Poland’s Ministry of Culture and National Heritage promised to start work on a development strategy for the games industry.
Adrian Jabłonka (Madnetic Games) says budgets have been cut across the industry. Small studios don’t have the resources to hire and train newcomers, and some experienced specialists are leaving game development. Madnetic Games itself has moved to smaller projects, and its main goal now is to finish what it has already started.
Meanwhile, competition keeps growing. Almost 20,000 games are released on Steam every year, and even a good project struggles to reach players.
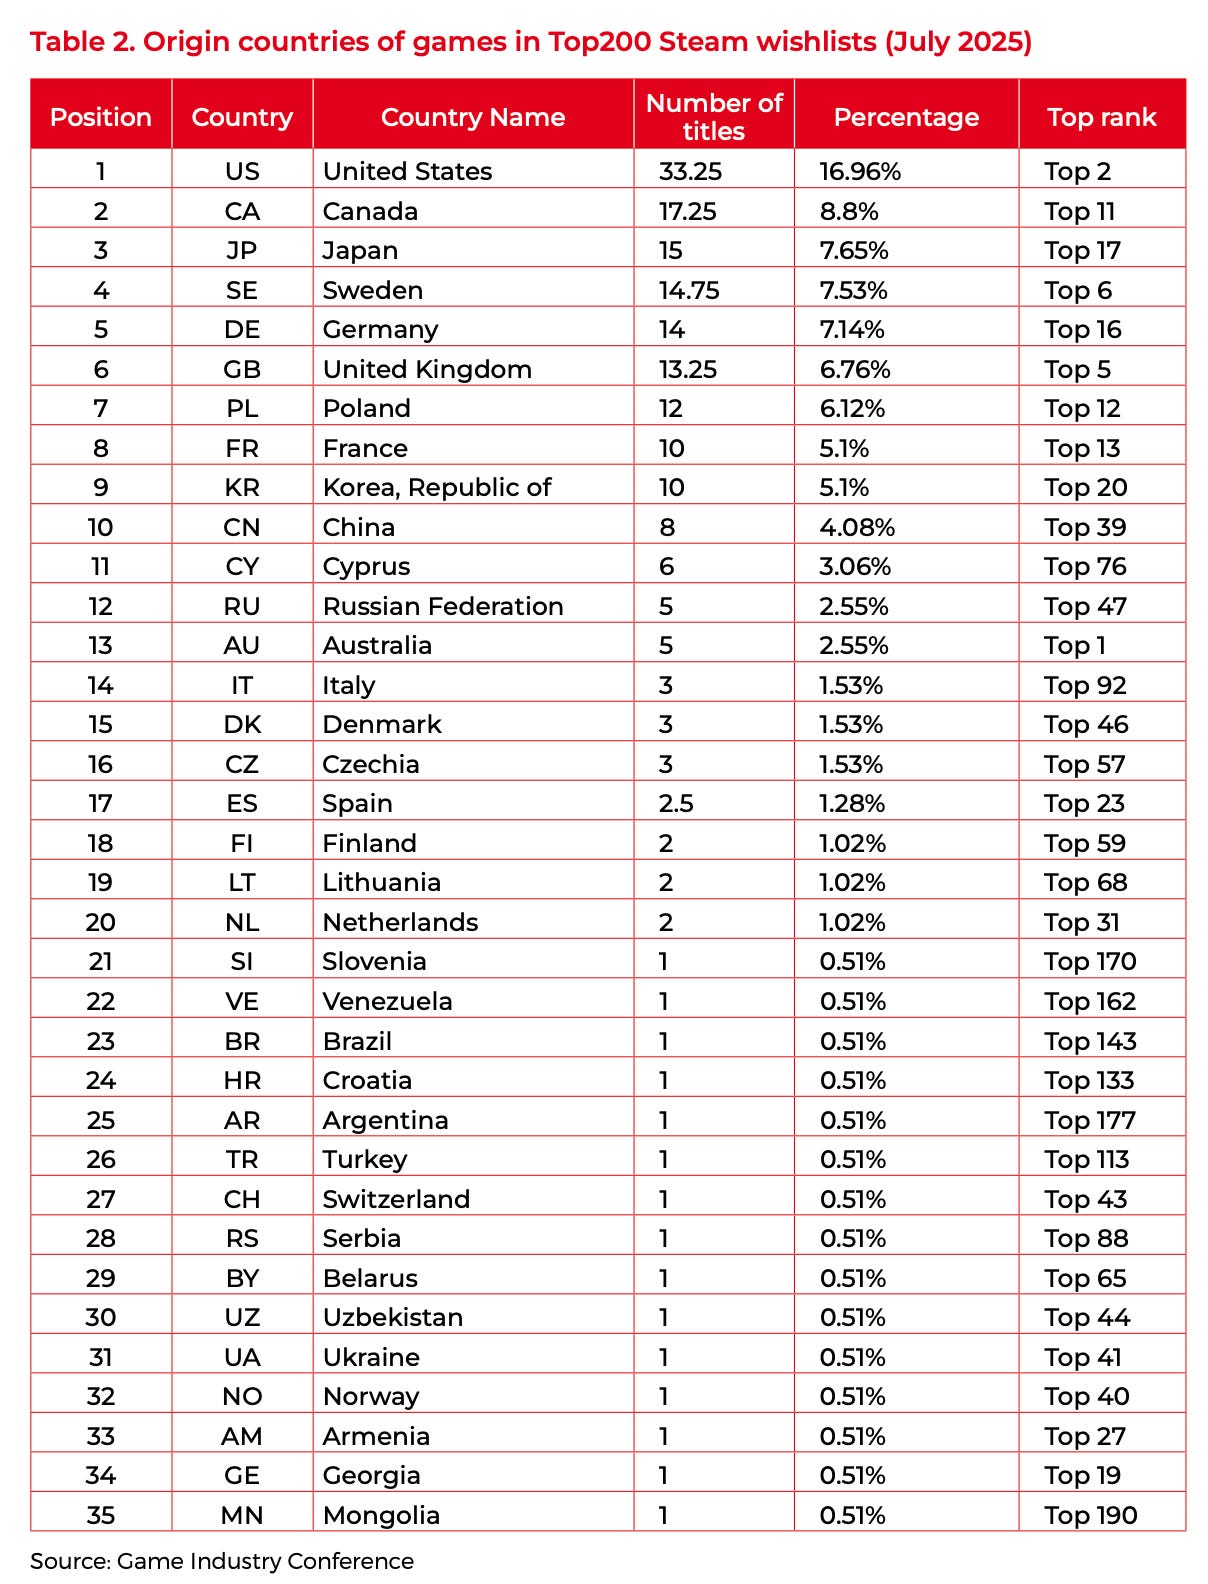
Steam’s list of the most anticipated games shows this well. In 2021, Poland led the Top 200 by wishlists, with 38 games. In July 2025, 12 Polish games entered the list (6.12%), and the country ranked 7th. The current leaders are the US (33.25 games), Canada (17.25), and Japan (15).
Managing a distributed dev team shouldn’t mean managing a compliance headache. Mellow’s Contractor Management gives you ready-made contracts, IP compliance, and automated payouts for contractors in 150+ countries — for $35/month per contractor.
PARP partly attributes this to large Polish studios currently working on new projects. But the main reason, according to the report’s authors, is the end of the support programs. For comparison, Germany has improved its result in this ranking by 466% since 2021.
Market participants don’t expect a quick recovery. Jabłonka (Madnetic Games) talks about a period of stagnation and correction. PARP sees cautious reasons for optimism: investors and publishers from Japan and South Korea are increasingly interested in Polish developers, and Chinese partners are coming back.
Large companies
Large companies, meanwhile, are doing well. CD Projekt earned PLN 867 million in 2025, with a net profit of PLN 595 million. The Witcher 3: Wild Hunt has sold more than 65 million copies, and Cyberpunk 2077 with the Phantom Liberty expansion is also selling well.
11 bit studios had record revenue of PLN 141 million in 2025. Operating profit was PLN 21.9 million, and net profit PLN 6.94 million.
Bloober Team’s Silent Hill 2 sold more than 2 million copies. In June 2026, the studio reported that revenue from Cronos: The New Dawn had exceeded its development costs.
Games and Numbers (September 9 — September 21, 2026)
PC/Console games
Sales of the Dragon Quest series by Square Enix have surpassed 100 million copies. The series passed 95 million in autumn 2025.
Dave the Diver by Mintrocket (Nexon) has sold 10 million copies. The paid DLC In the Jungle has sold 1 million copies.
The Phoenix Wright: Ace Attorney Trilogy collection by Capcom has sold over 5 million copies. The entire Ace Attorney series had sold 15 million copies as of June 30, 2026.

From concept art to launch-day marketing, most game studios rely on contractors in multiple countries. Mellow makes it simple to hire, pay, and stay compliant with talent in 150+ countries — no legal entity required.
Wardogs by Bulkhead and Team17 sold 2 million copies in five days in Early Access. The first million copies were sold on launch day. The studio needed to sell 400 thousand copies to break even. Tencent originally funded the project, but the company abandoned it and divested from Bulkhead.
ReStory: Chill Electronics Repairs sold 500 thousand copies in a month and a half after release. 300 thousand of those came in the first week.
Phantom Blade Zero by S-GAME has gathered over 3 million wishlists. The game is scheduled to launch on October 29, 2026.
Graveyard Keeper 2 by Lazy Bear Games and tinyBuild has passed 1 million wishlists on Steam. The game launches today (September 22) on PC and consoles.
Mobile games
Age of Magic by Playkot has earned $120 million over eight years. The game has been downloaded around 20 million times.
Ludus: Merge Arena by Cyprus-based Top App Games generated $29 million in gross revenue in the first half of 2026. Q2 was the best quarter in the game’s history, with $14.8 million earned.
Moloco: How the Best Mobile Games First Year Looks

Market data reflects Moloco’s analysis of Sensor Tower figures. The report is built on 55 mobile games (iOS and Android, US players) released between January 2024 and September 2025 that acquired traffic through Moloco. Each game was tracked over its first 12 months. Together, they account for more than $1.5 billion in IAP revenue and over 20 million paying users.
New Mobile Games
In 2025, 190,000 new mobile games were released. Only 2,500 of them passed 500,000 downloads in their first year.
Moloco notes that paid traffic drives most installs for a typical new release. For comparison, AppsFlyer reports that paid installs account for 59% of all IAP revenue in games.
A word from our sponsor

Game studios run on contractors — artists, composers, QA testers, translators — often spread across a dozen countries. That’s a lot of contracts, tax rules, and IP clauses to track. Mellow handles all of it: compliant contracts, automated payments, and IP protection built in, for contractors in 150+ countries.
At the same time, new releases’ share of mobile IAP revenue is not declining. Few titles break through, but those that do earn more.
The time it takes a new game to earn $20 million in IAP and subscription revenue fell by 21% from 2022 to 2025.
IAP revenue per install among US users grew 126% from 2021 to 2025. Also, 58% of new IAP games show ads to players who never make a purchase.
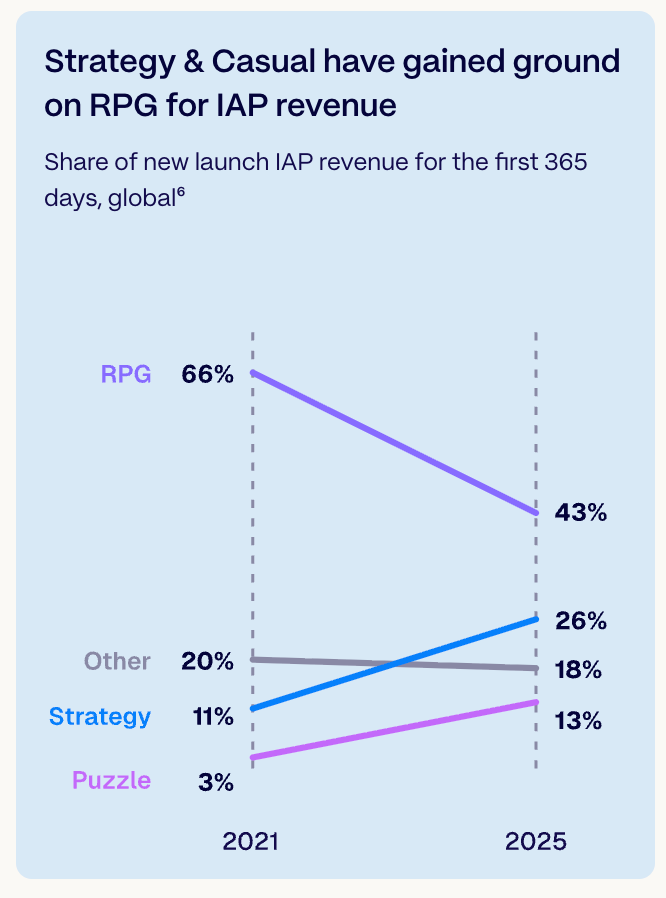
In 2021, RPGs accounted for 66% of new releases’ IAP revenue over their first 365 days. In 2025, that share fell to 43%. Over the same period, Strategy grew from 11% to 26%, and Puzzle from 3% to 13%.
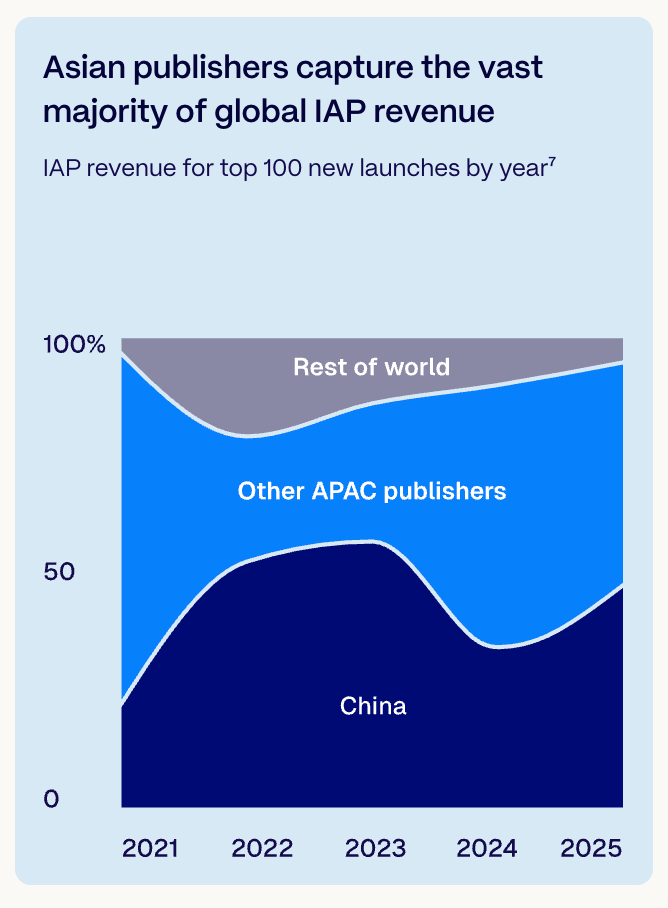
Asian publishers take almost all of the IAP revenue in the top 100 new releases. The share of Chinese companies dipped in 2024, but grew again in 2025. Publishers from the rest of the world account for a very small share.
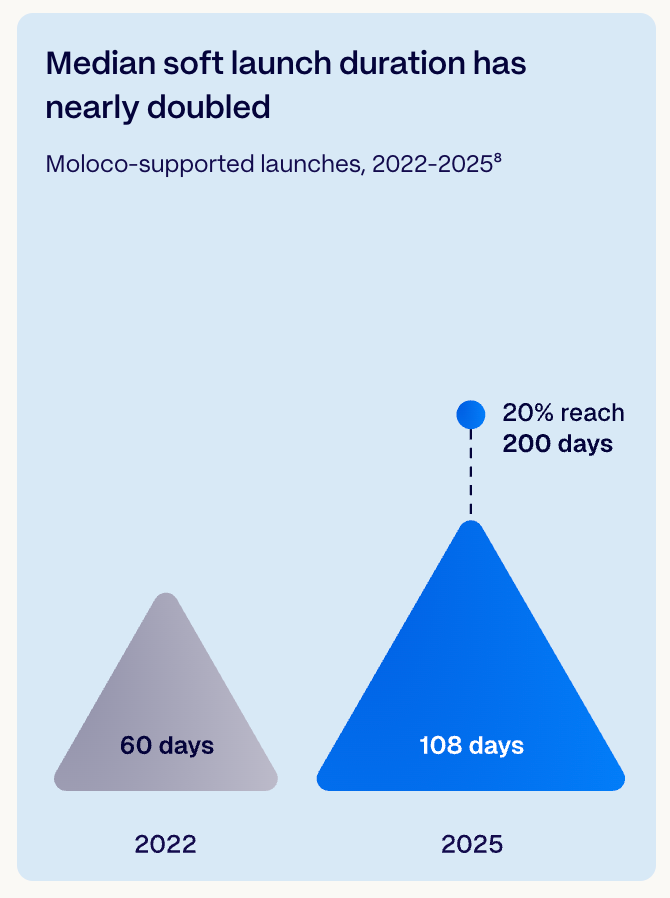
The median soft launch duration for games that acquired traffic through Moloco grew from 60 days in 2022 to 108 days in 2025. 20% of projects spend 200 days or more in soft launch.
Monetization
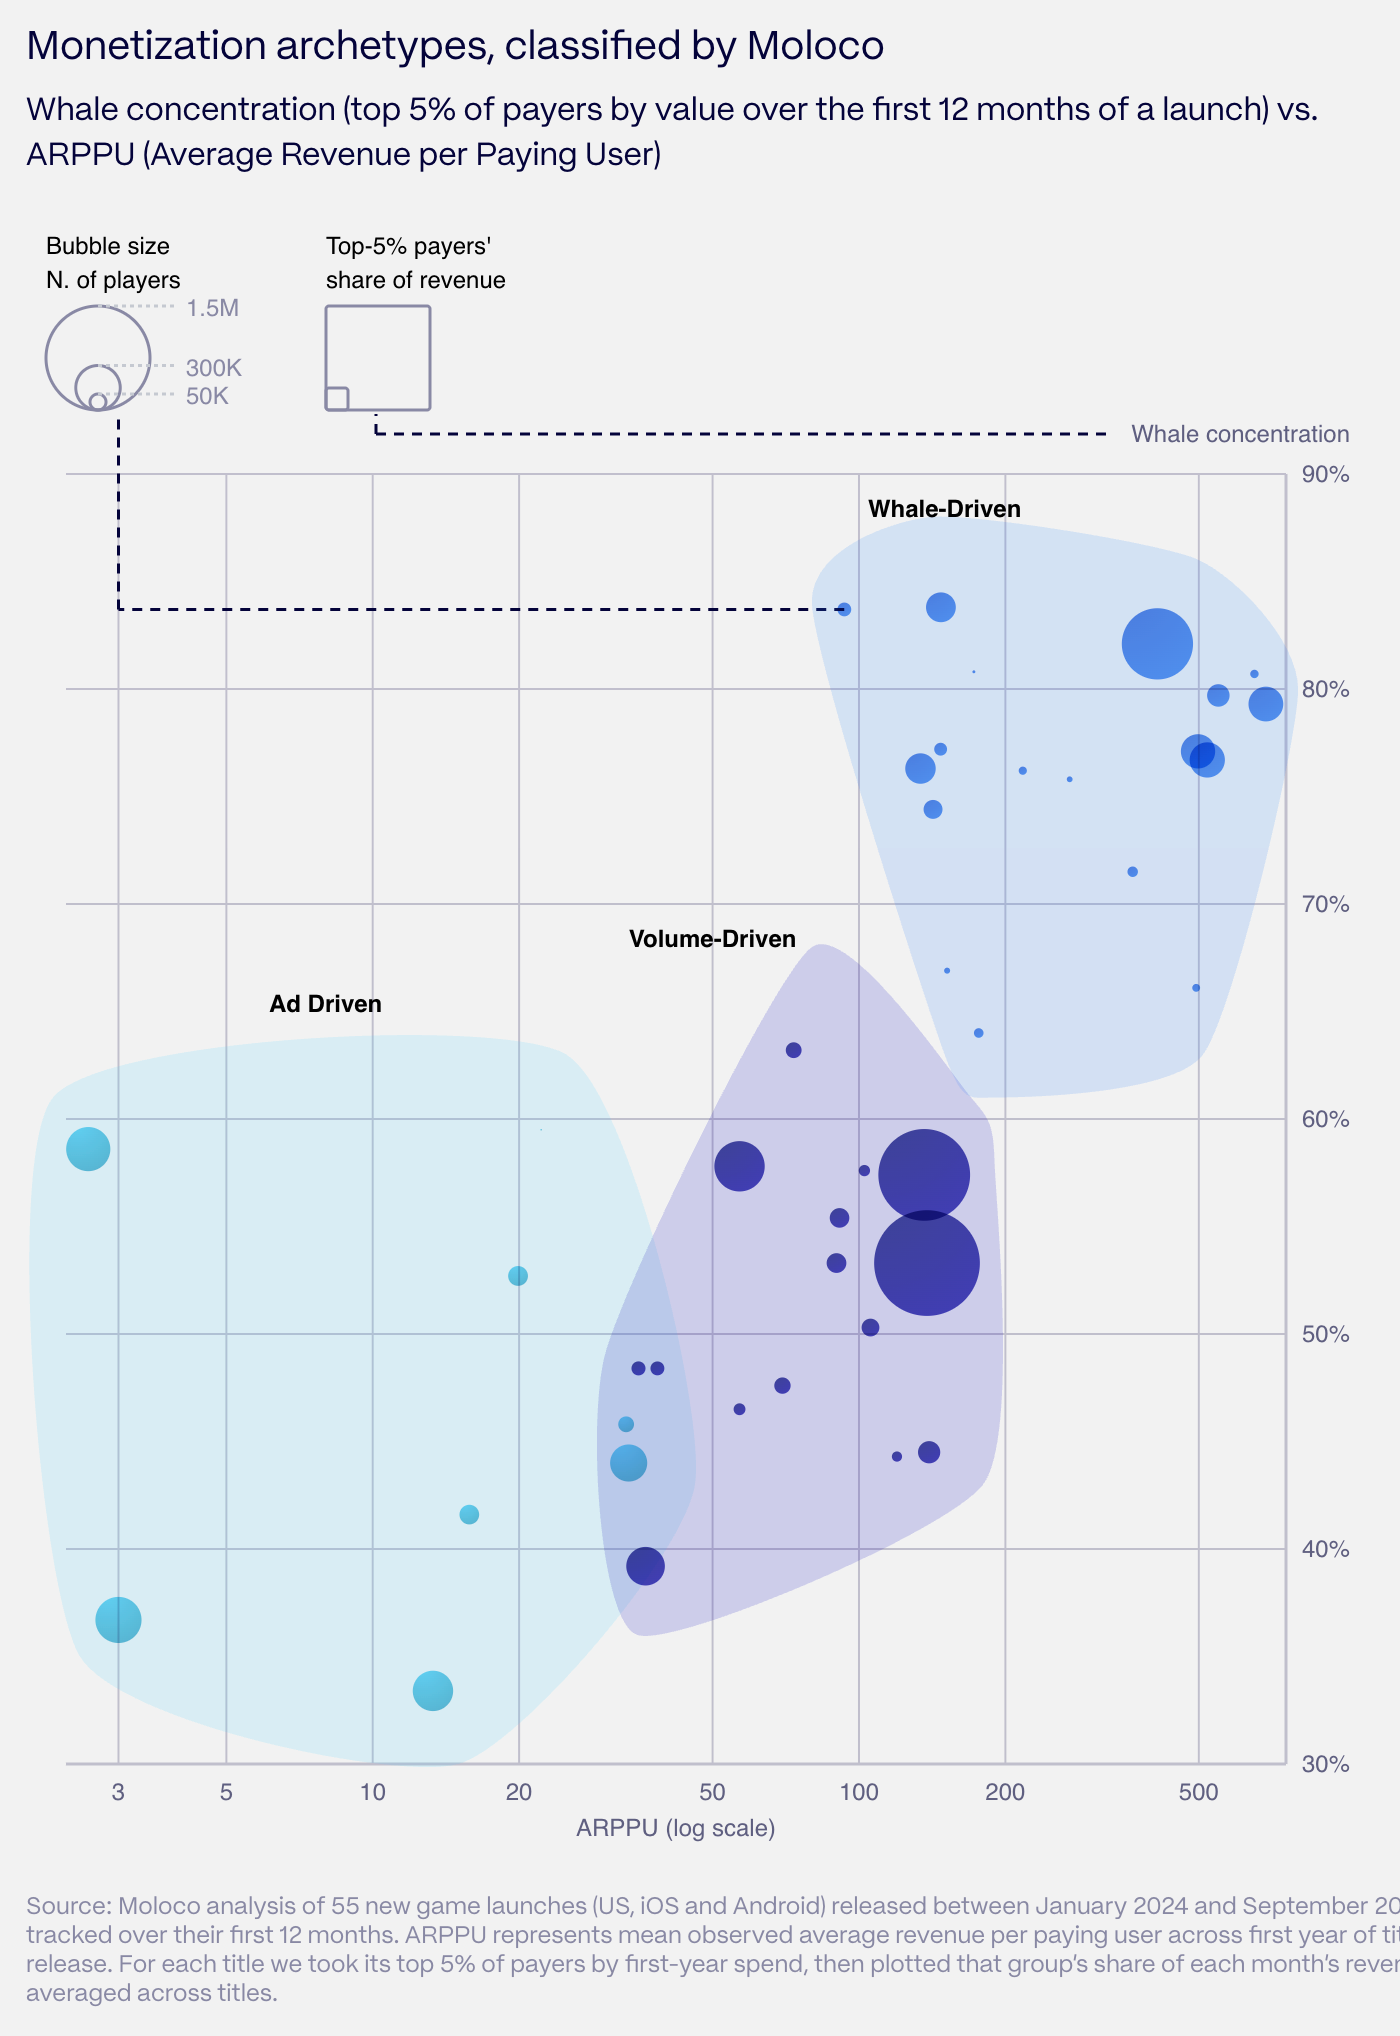
Moloco grouped games by monetization model rather than by genre. Whale-driven: the top 5% of payers bring in more than 70% of revenue, and ARPPU is usually above $100. Volume-driven: the top 5% of payers account for 40-65% of revenue, with ARPPU between $35 and $165. Ad-driven: most revenue comes from ads, and ARPPU is below $20. The rest of this section covers only whale-driven (18 games) and volume-driven (15 games) titles.
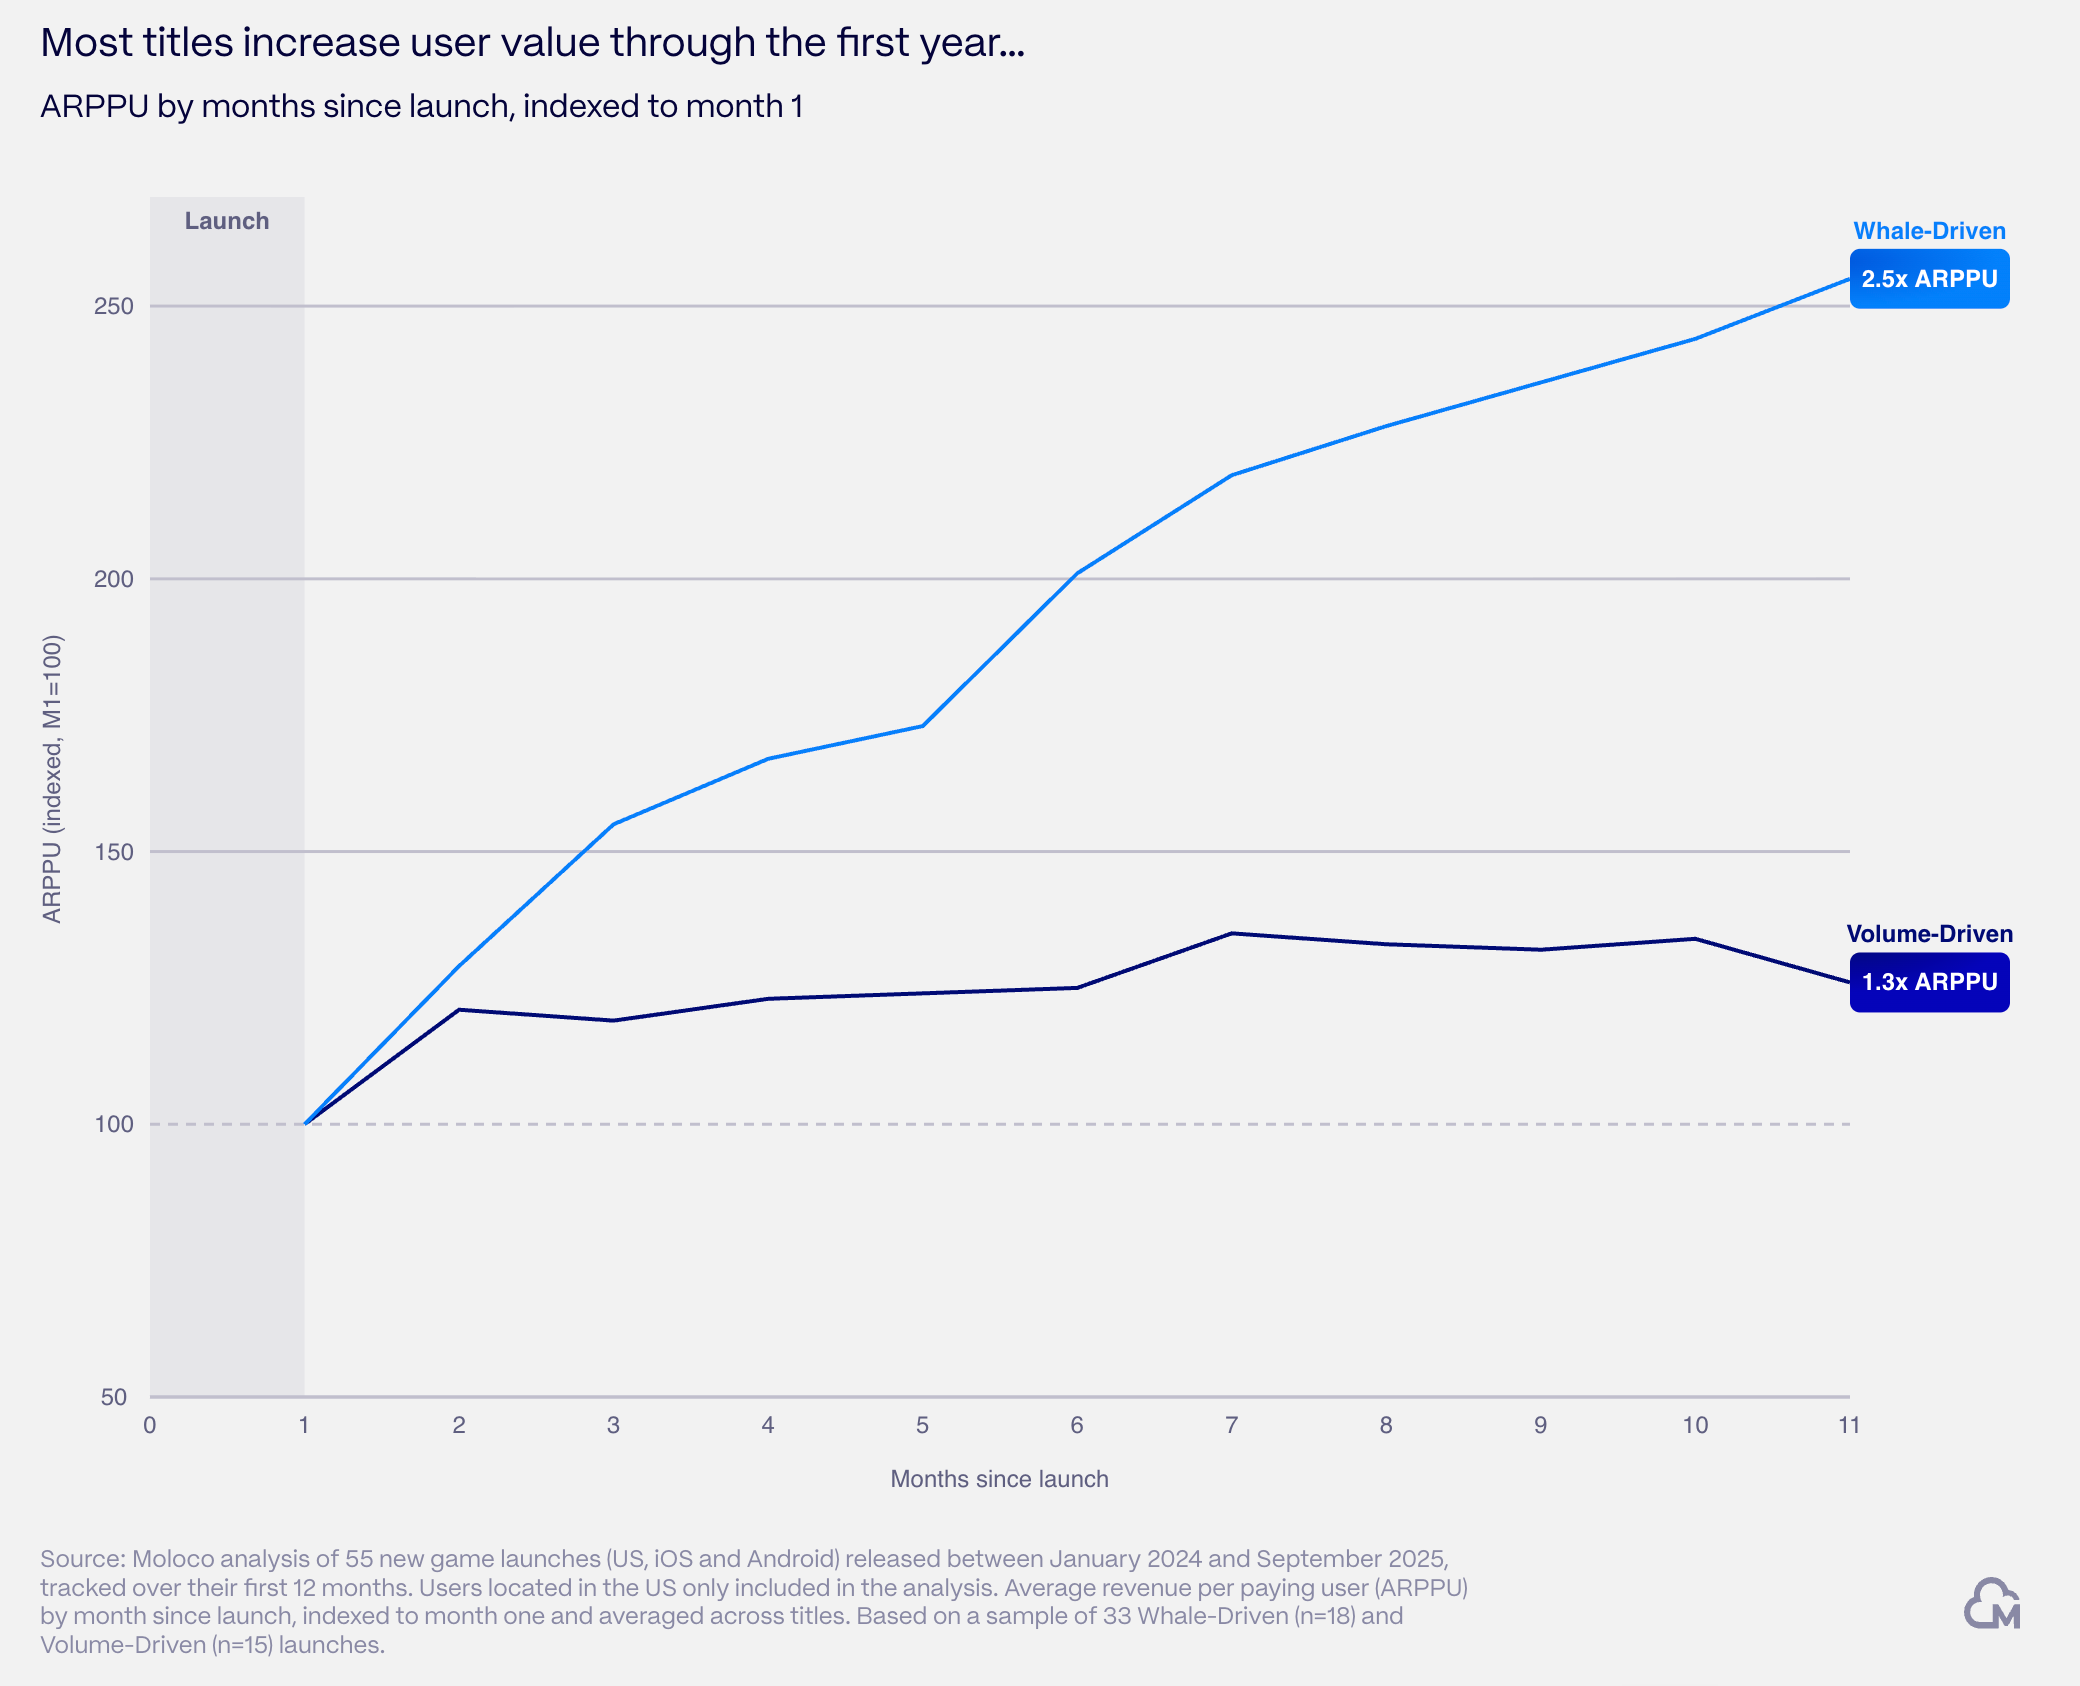
By the end of the first year, ARPPU in whale-driven games is 2.5x higher than in the first month after release. In volume-driven games, it is 1.3x higher.
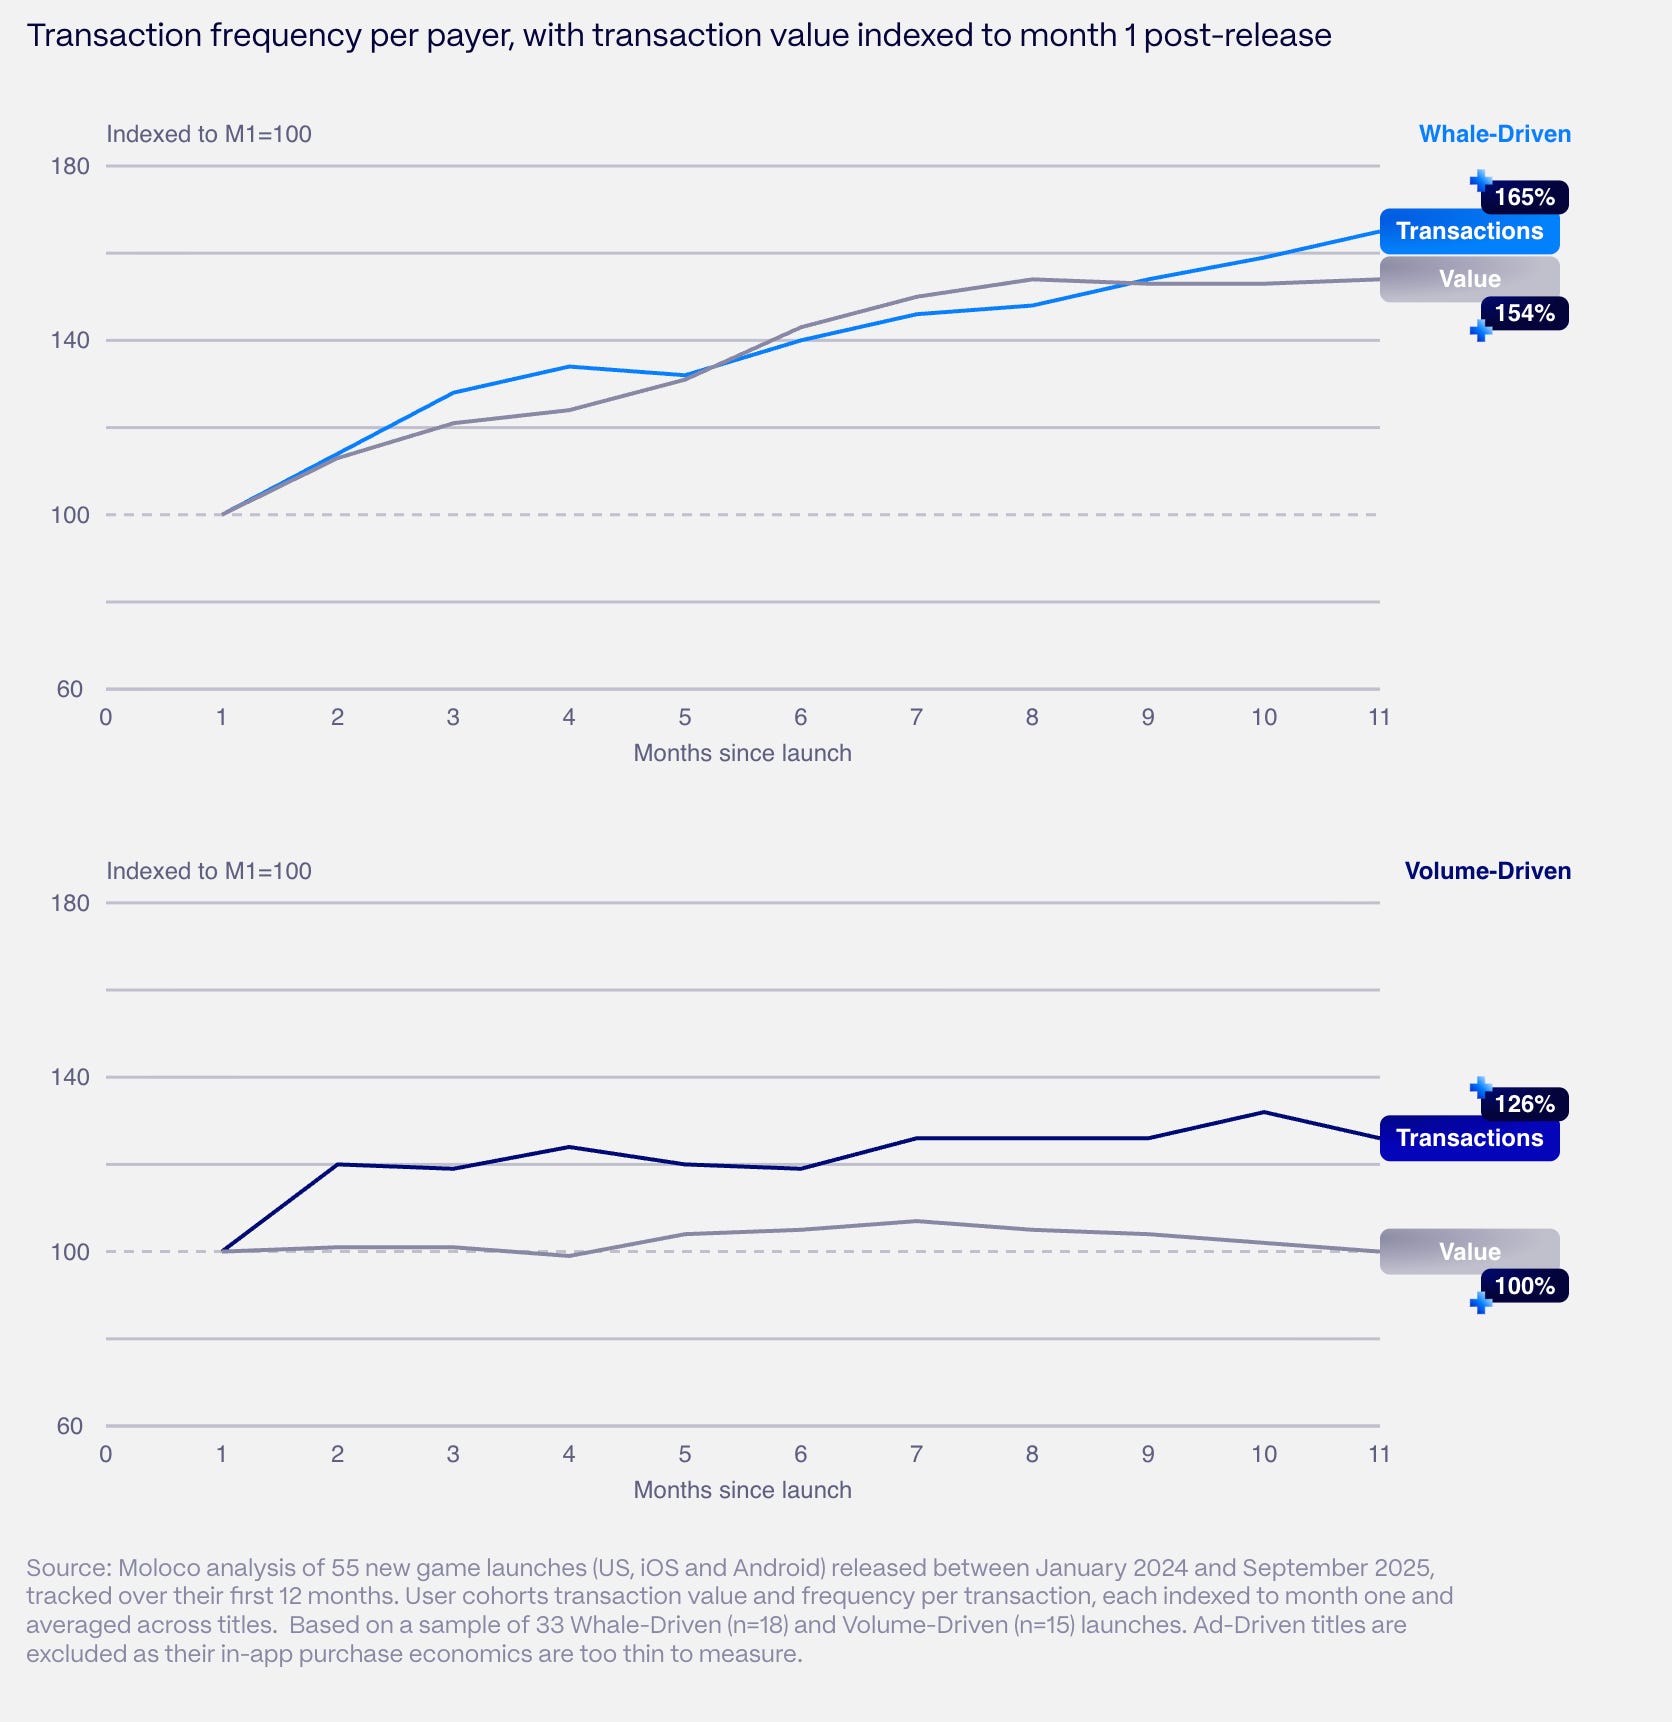
In whale-driven games, payers buy more often over time (+65% by the end of the year), and their average check grows as well (+54%). In volume-driven games, only purchase frequency grows (+26%), while the average check stays the same.
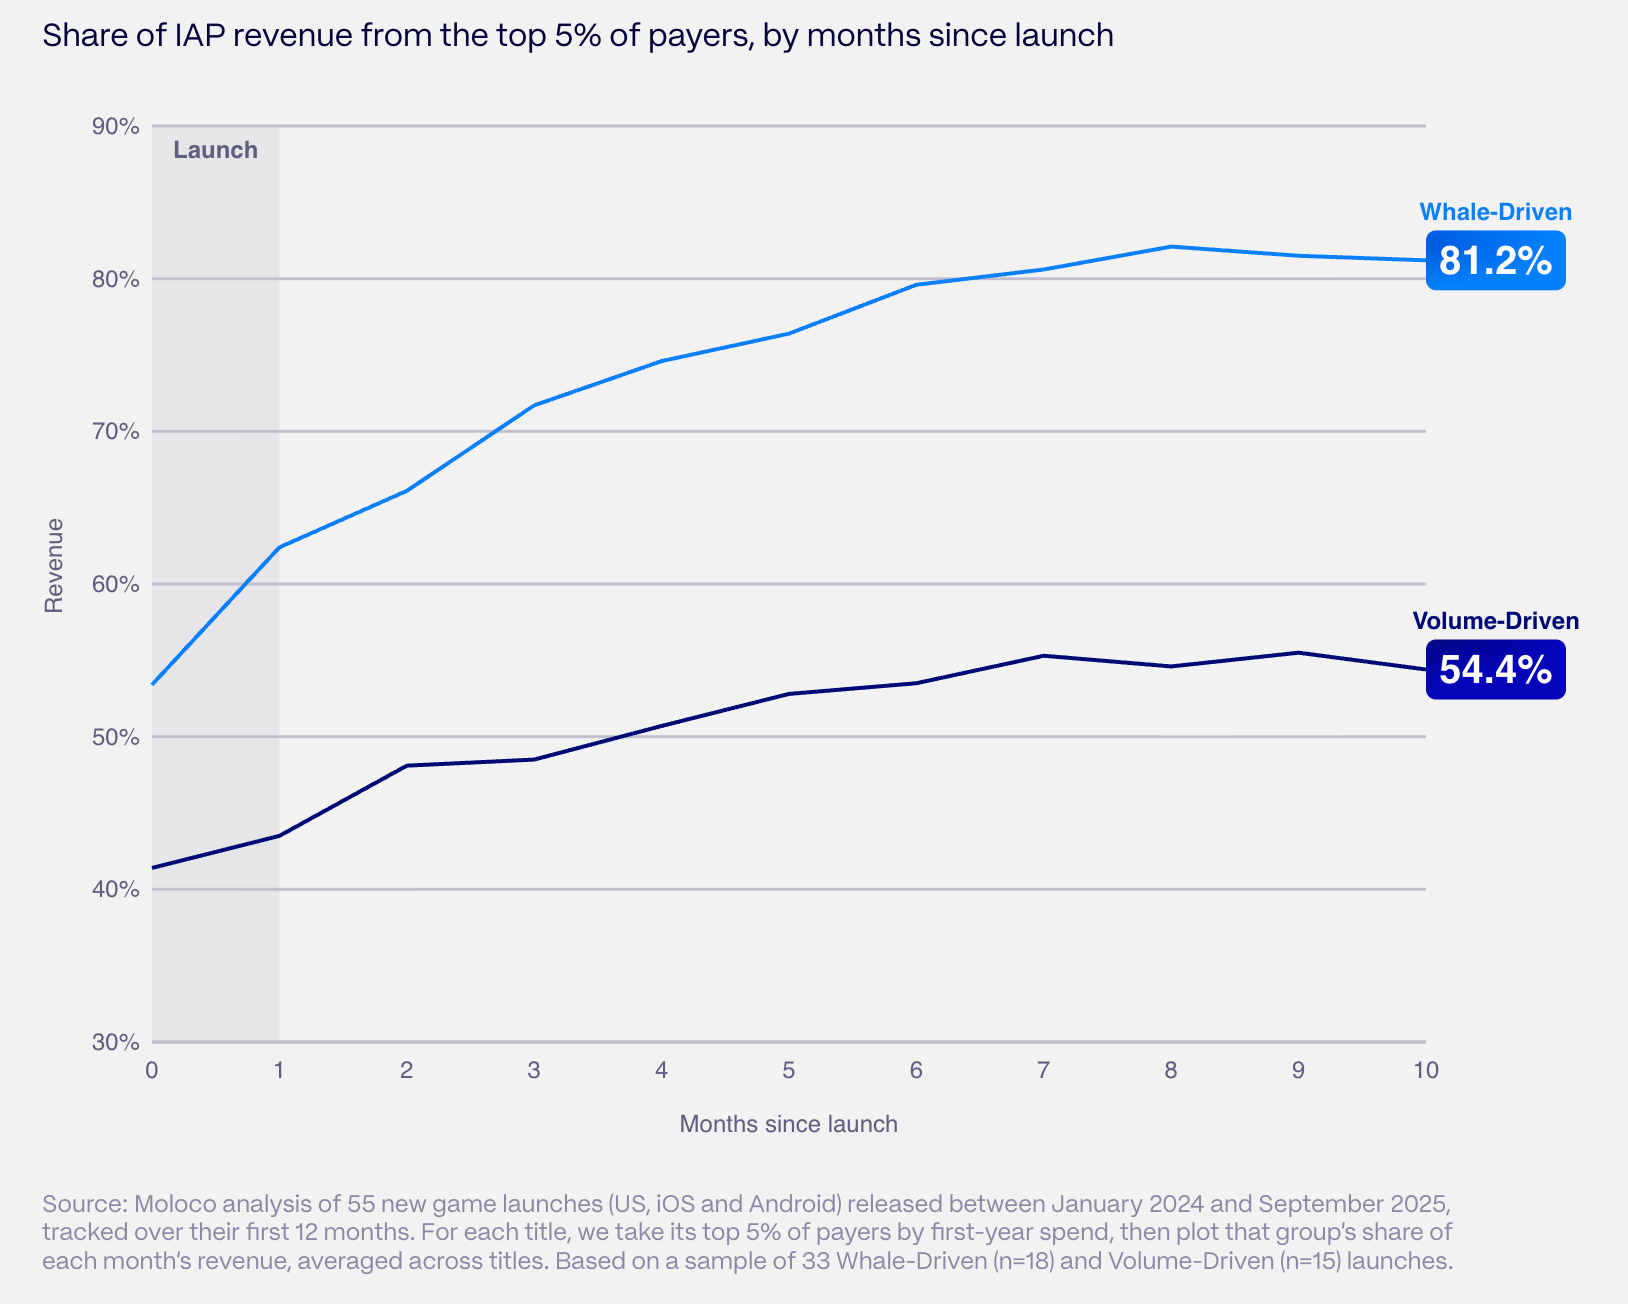
The whales’ share of revenue grows throughout the year. By month 10, the top 5% of payers account for 81.2% of revenue in whale-driven games, and 54.4% in volume-driven games.
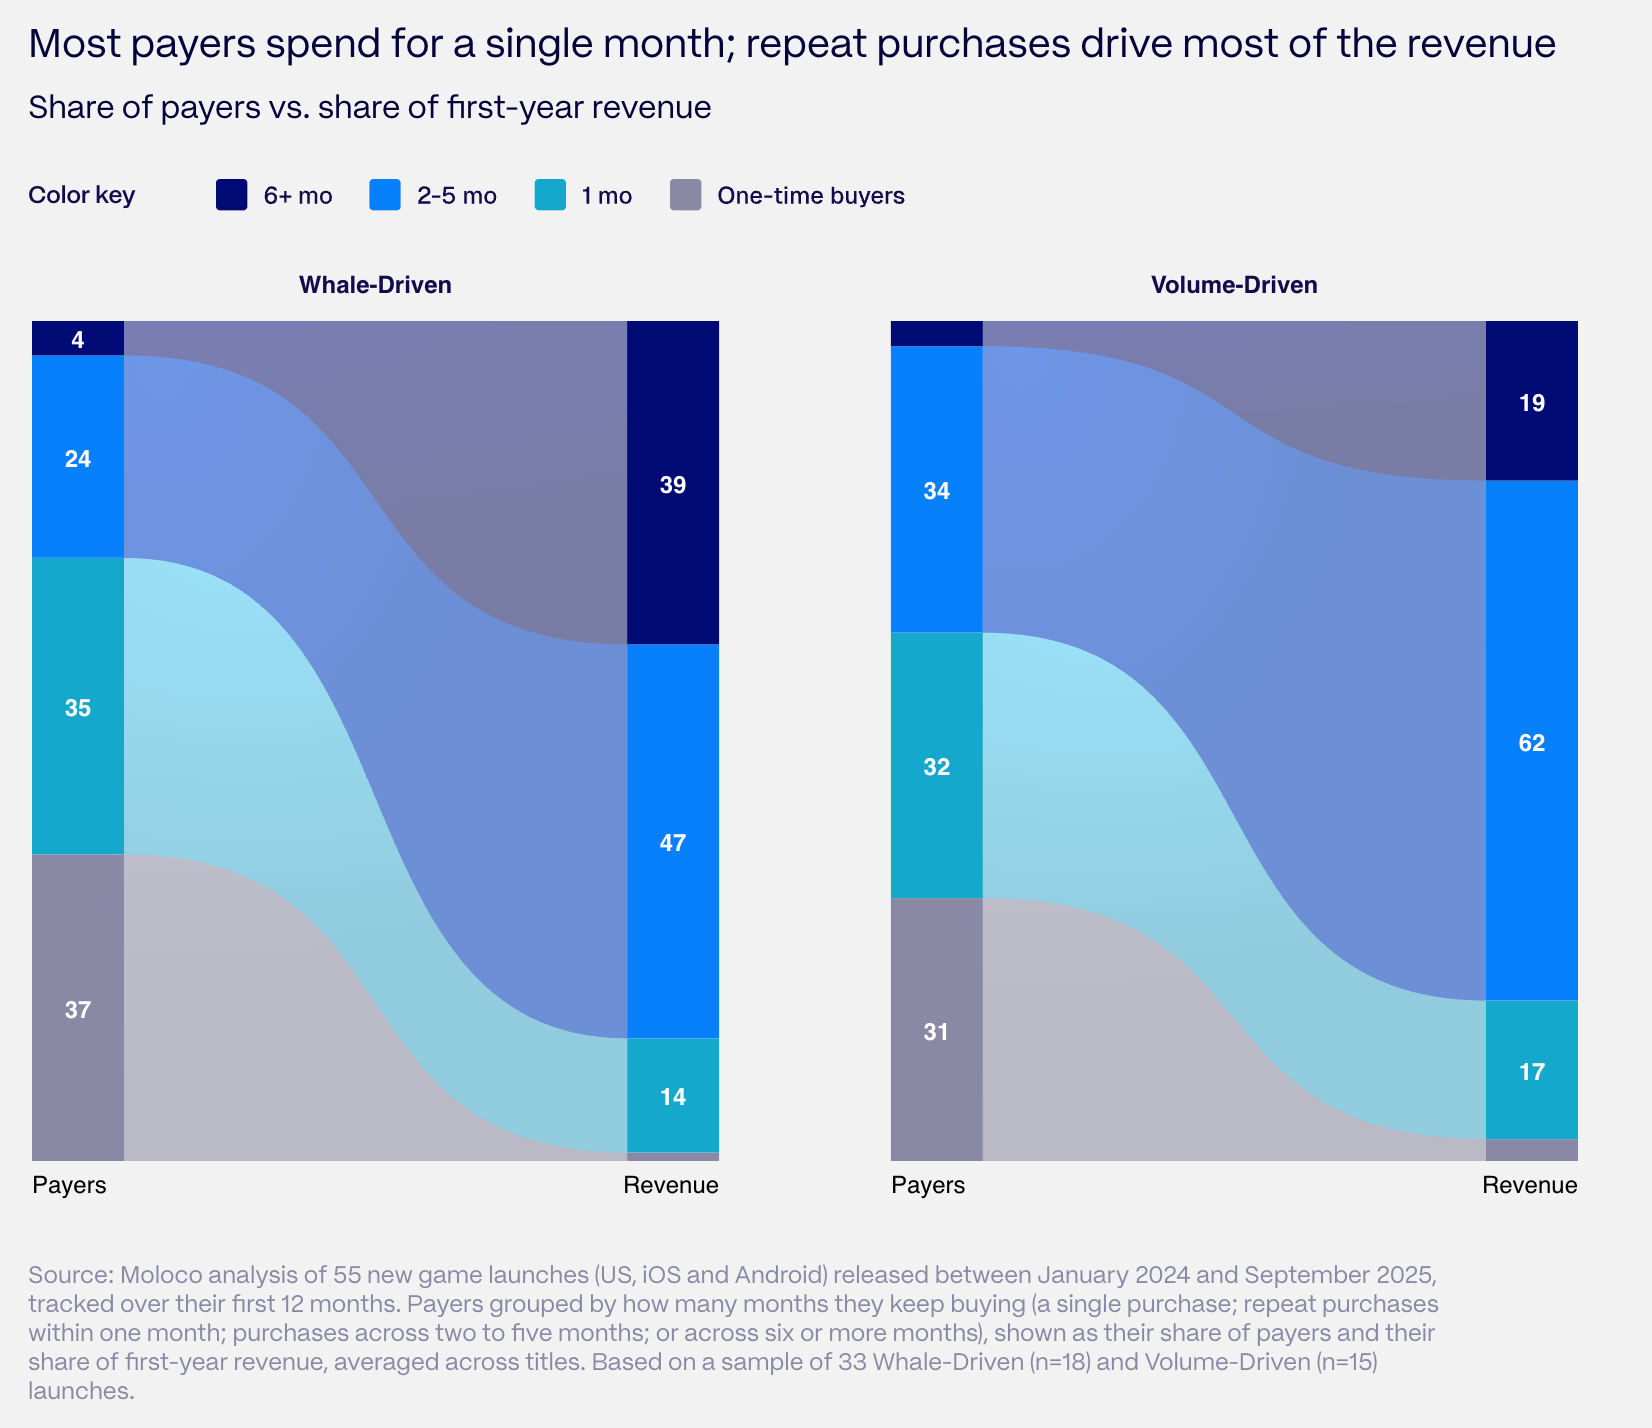
Most payers buy only once. In whale-driven games, 37% of payers make a single purchase, and another 35% buy several times, but within one month.
Meanwhile, the 4% of players who pay for 6 months or longer bring in 39% of whale-driven games’ first-year revenue. Another 47% comes from those who pay for 2 to 5 months.
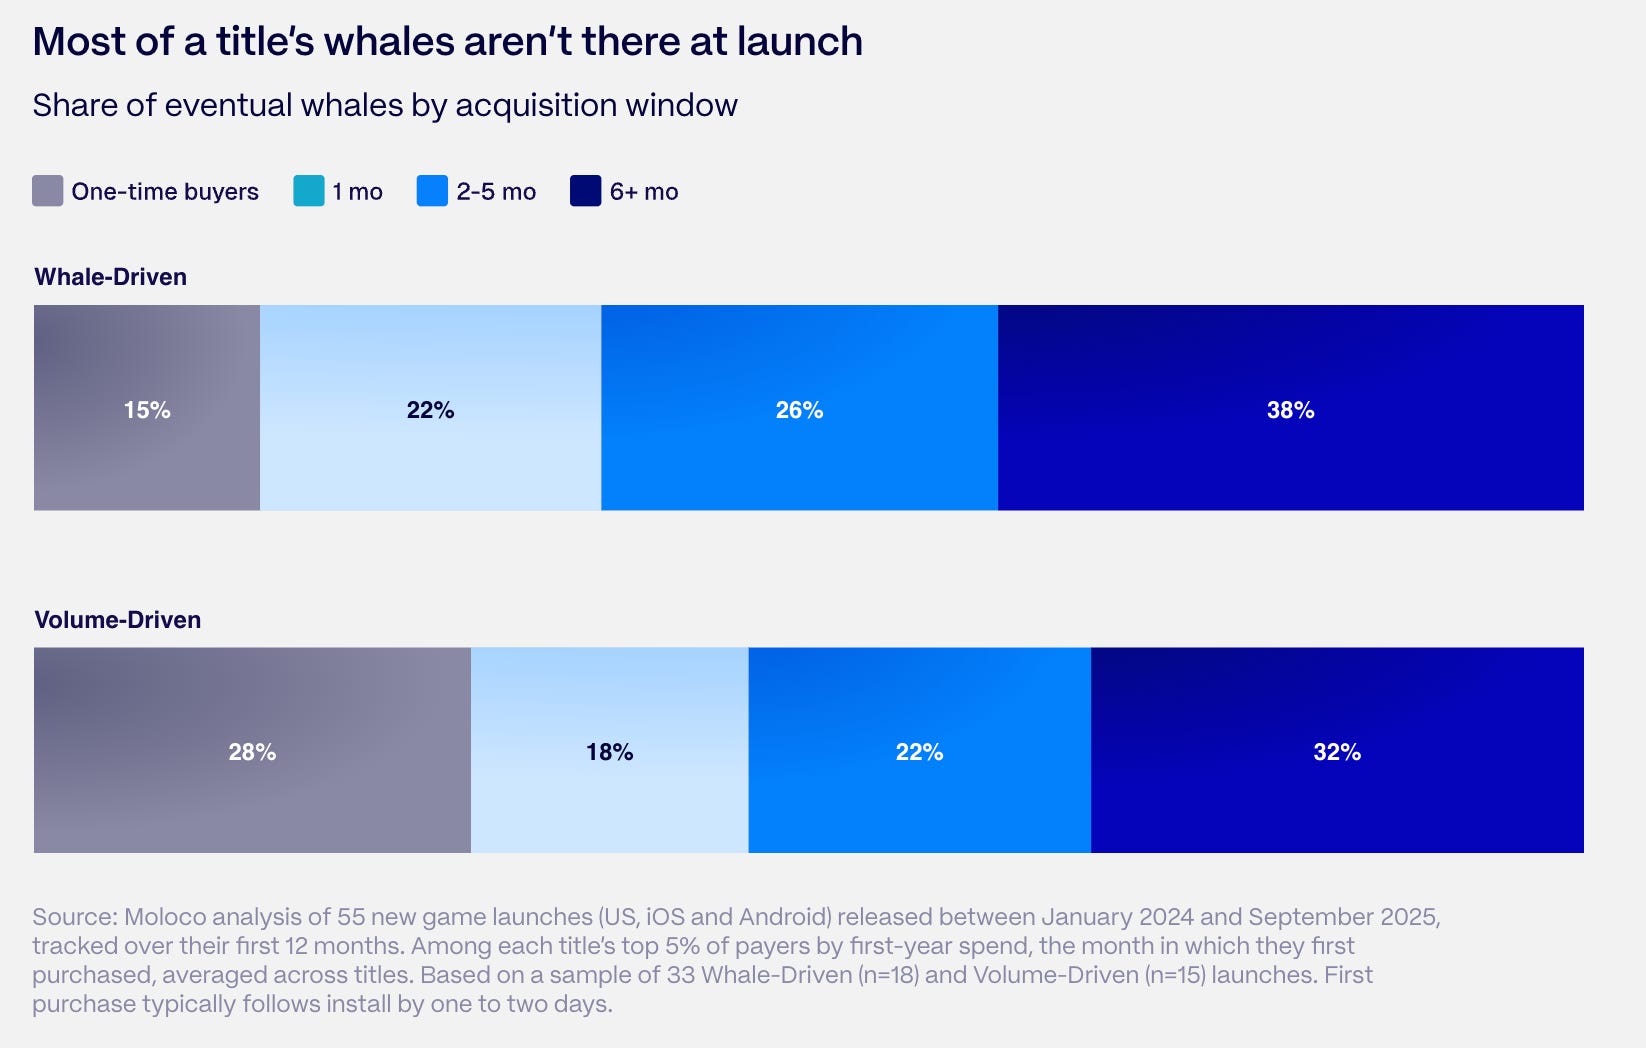
Whales arrive throughout the year. In whale-driven games, only 15% of future whales make their first purchase in the launch month, while 38% do so in month six or later. In volume-driven games, the figures are 28% and 32%, respectively.
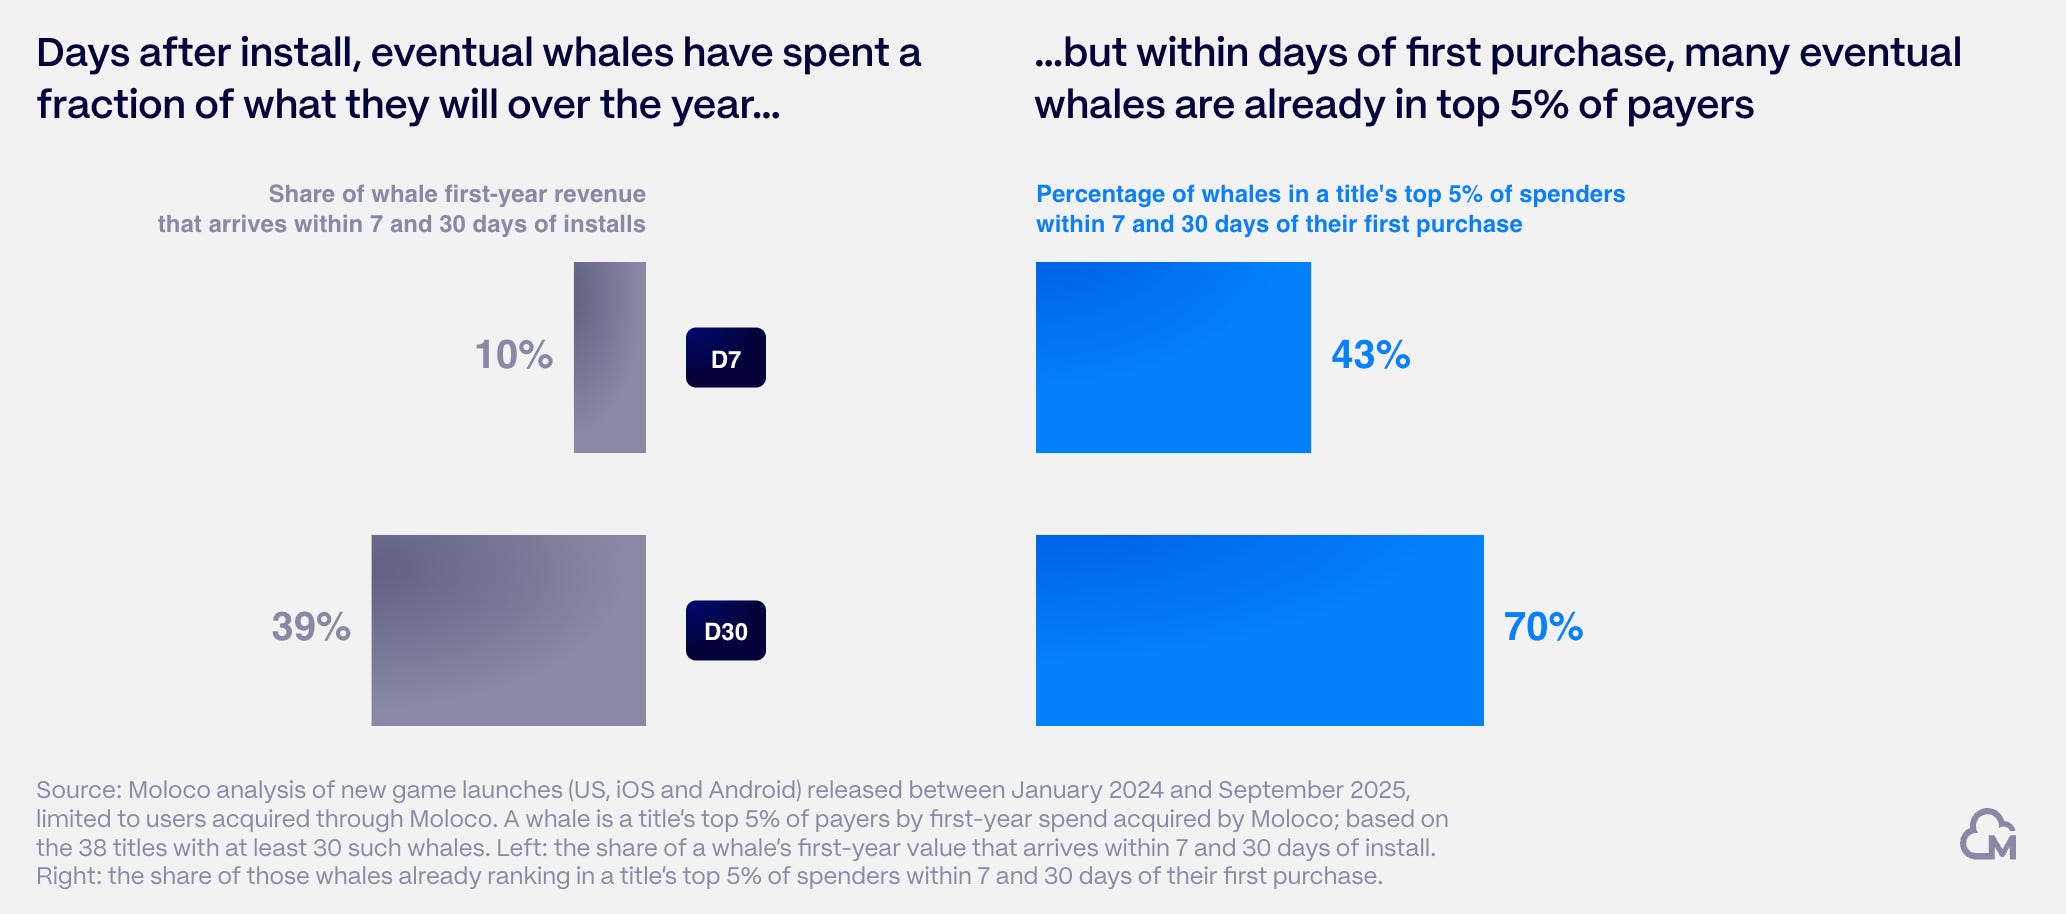
In the first 7 days after install, whales spend 10% of what they will spend over the year; within 30 days, 39%. At the same time, 43% of future whales enter the top 5% of payers within 7 days of their first purchase, and 70% within 30 days. Moloco concludes that it is possible to identify and acquire high-value players early.
A word from our sponsor
Game studios run on contractors — artists, composers, QA testers, translators — often spread across a dozen countries. That’s a lot of contracts, tax rules, and IP clauses to track. Mellow handles all of it: compliant contracts, automated payments, and IP protection built in, for contractors in 150+ countries.
User Acquisition
Breakout titles are the 7 most successful games in the sample. Each was among the top-grossing new releases of its year among Moloco clients. Moloco compares them with the other 48 games.
In the launch month, 94% of breakout titles’ UA budget goes to campaigns optimized for ROAS (not CPI/CPA). For other games, it is 65%. According to Moloco, successful titles use soft launch to set Retention benchmarks and realistic ROAS targets, while the rest learn this only after global release.


Breakout titles don’t cut UA in the second half of the year; they scale it up. Month 11 accounts for 11.5% of their annual US UA budget, while other games’ UA spend declines after launch.
At the same time, breakout titles’ D7 ROAS is lower by the end of the year than in the first month (67% of the starting level). For other games, it holds steady (101%). Moloco links this to successful titles evaluating UA on predicted long-term LTV rather than on fast payback.
❗️It’s worth noting that breakout titles were selected based on their final success. They may be scaling UA precisely because they see good numbers.
Creatives
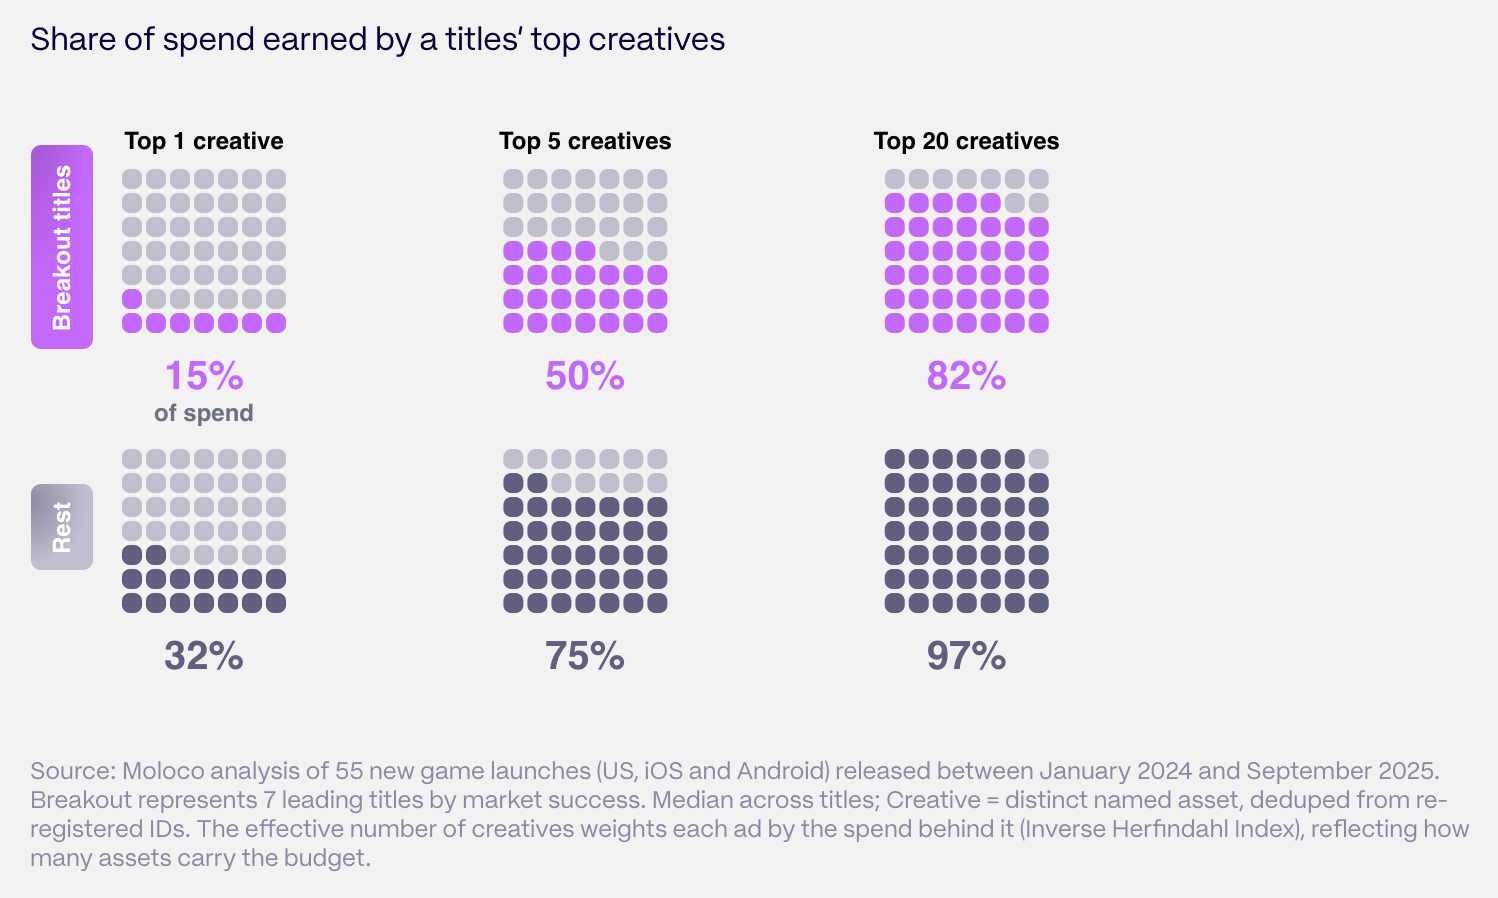
On average, breakout titles used 93 distinct creatives, compared to 37 for other games. Successful titles spread their budget more evenly: the top-spending creative accounts for 15% of spend, versus 32% for other games.
❗️Moloco only counts creatives that ran on its network. According to Sensor Tower, MONOPOLY GO! released 49,300 creatives in H1’26 alone.
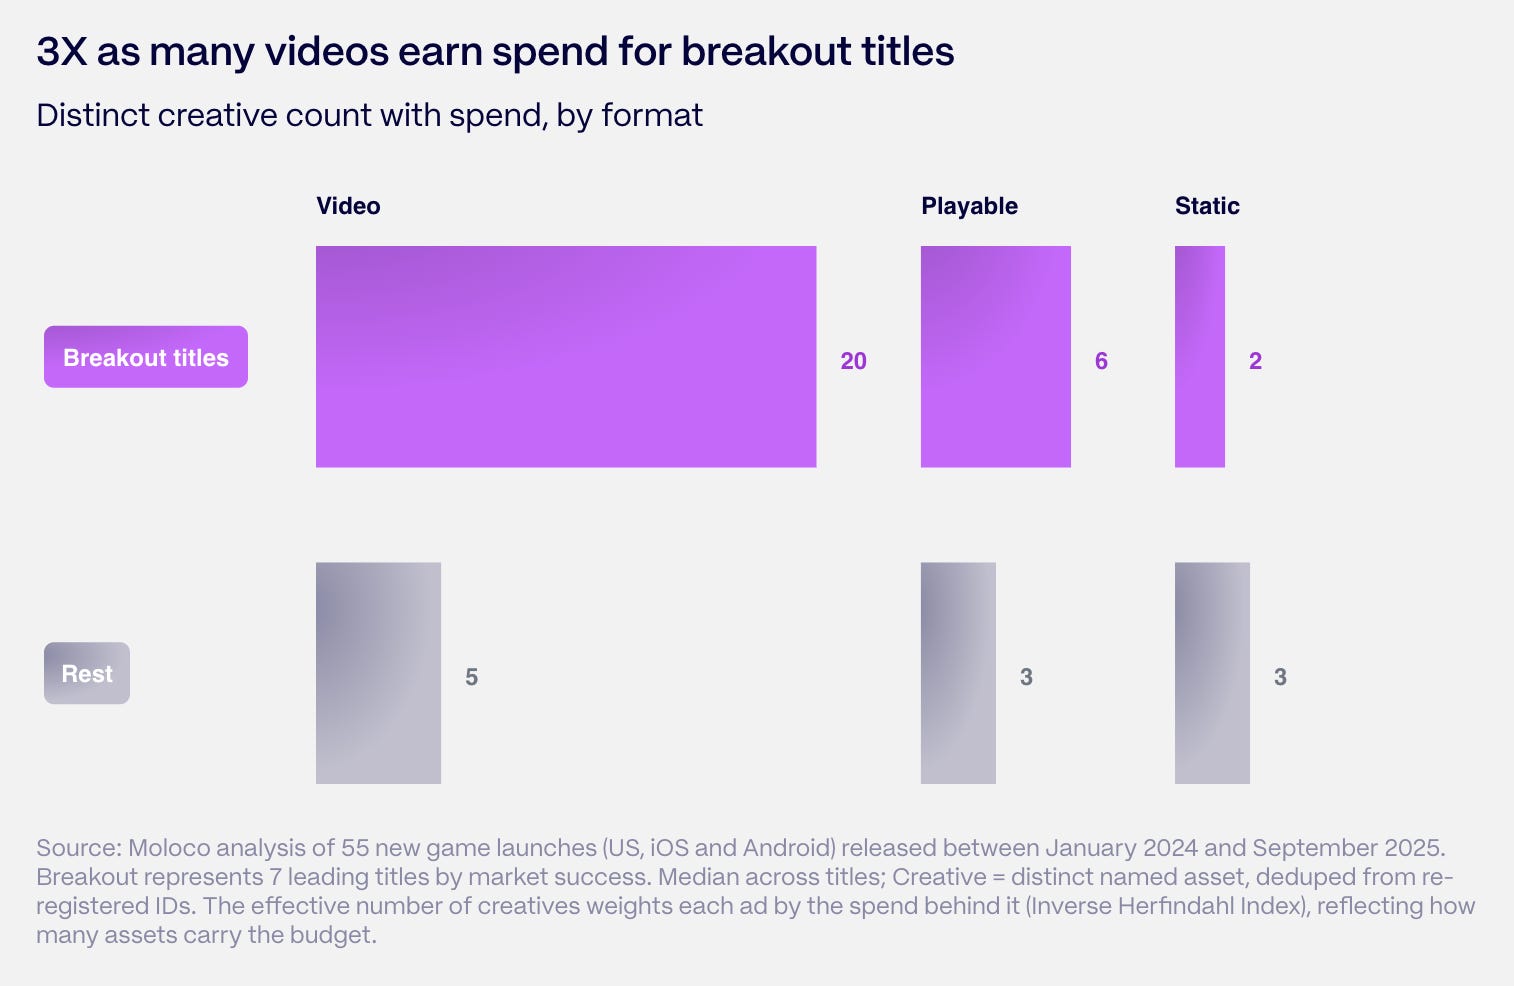
For breakout titles, 20 video creatives receive spend, versus 5 for other games. For playables, it is 6 versus 3.
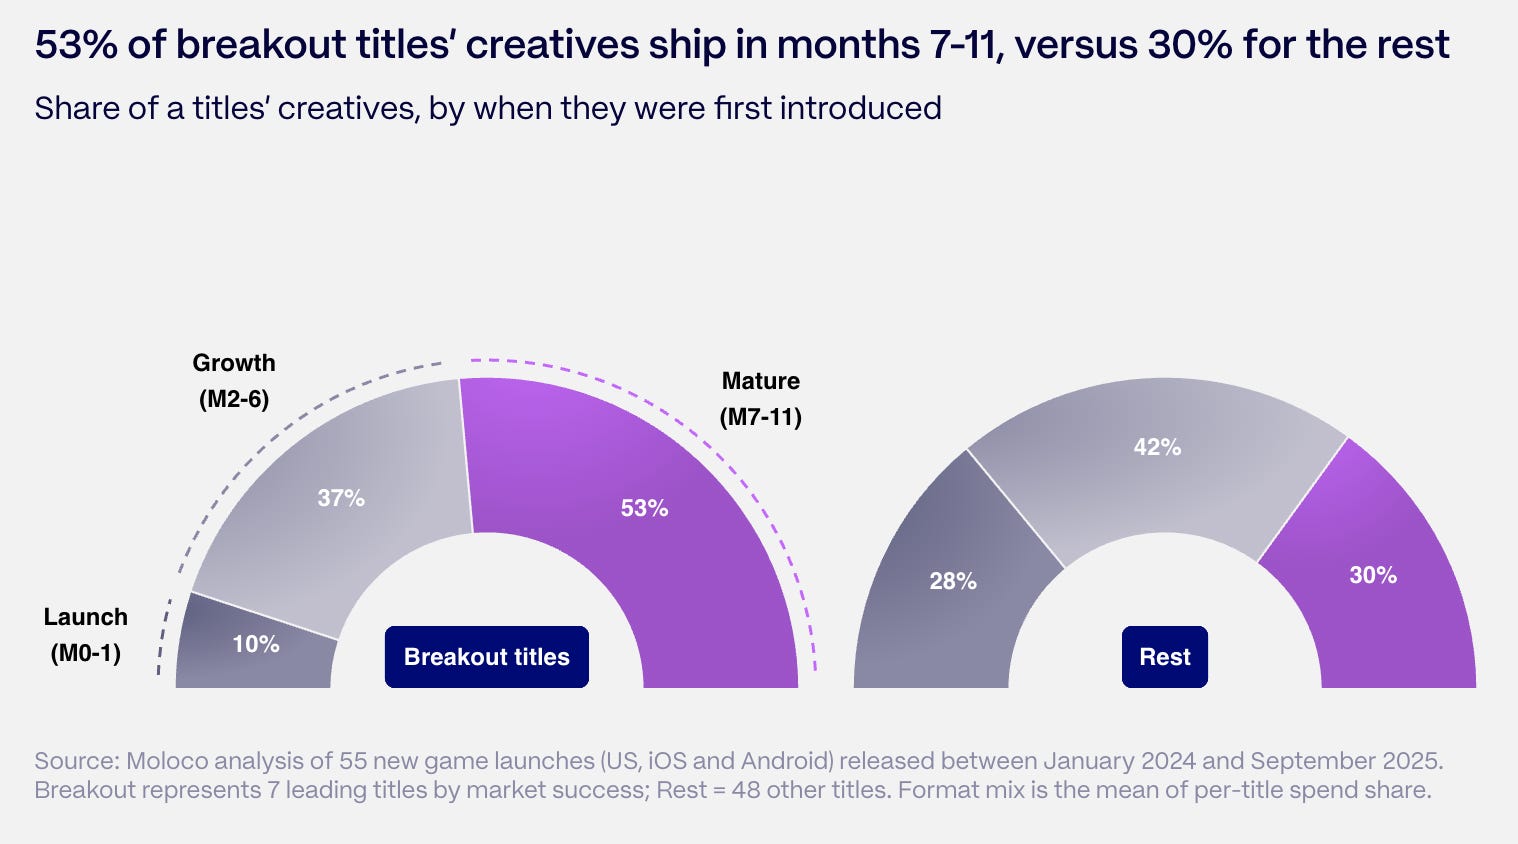
Breakout titles produce new creatives all year: 53% of their creatives appear in months 7-11 after release, compared to 30% for other games. Only 10% of breakout titles’ creatives come in the launch month, versus 28% for the rest.


The share of playables in breakout titles’ spend grows from 8% in the launch month to 22% by months 7-11. For other games, it grows from 2% to 12%. All breakout titles launched playables within their first 6 months. Across the market, according to Sensor Tower, playables accounted for 13.3% of all creatives in 2025, nearly double the previous year.
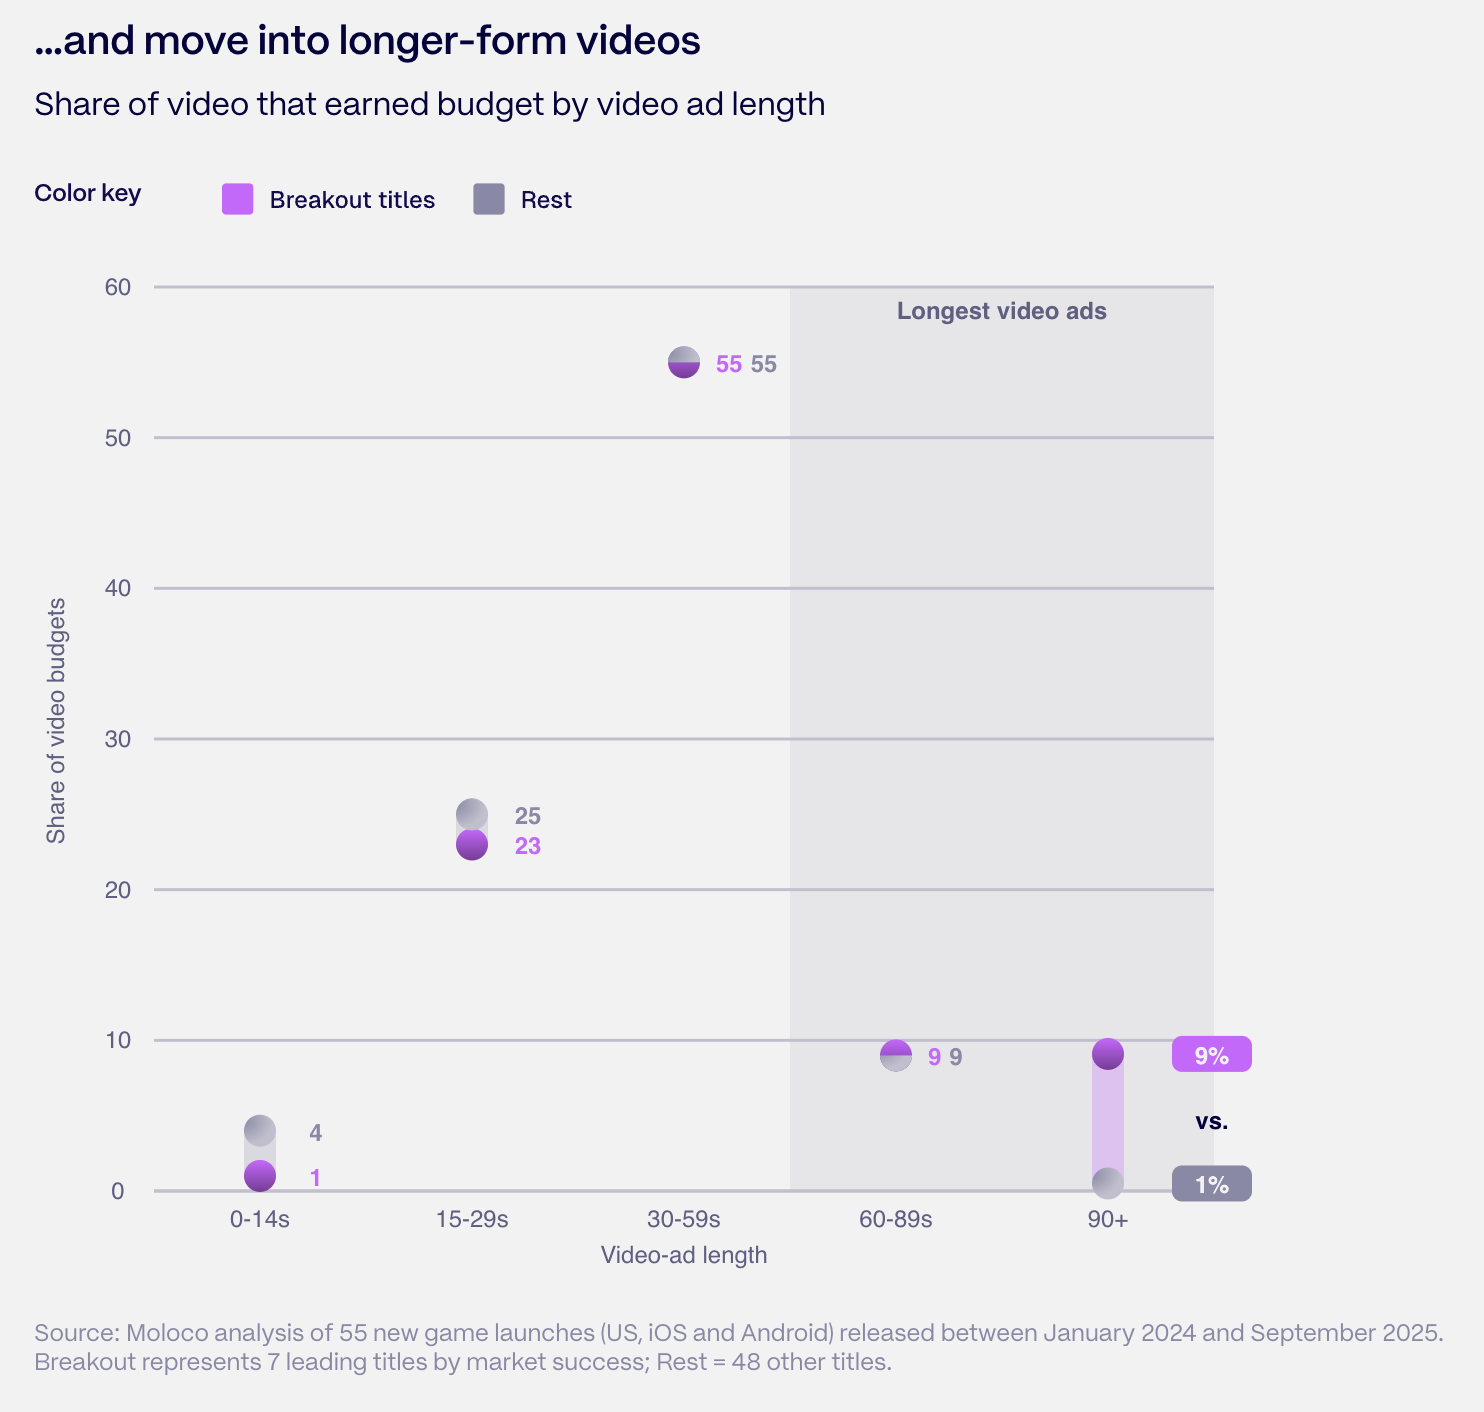
Breakout titles also put a noticeable share of their budget into long videos. Videos over 90 seconds account for 9% of their video budget, versus 1% for other games.
Alinea Analytics: Steam earned $15 billion in the first eight months of 2026
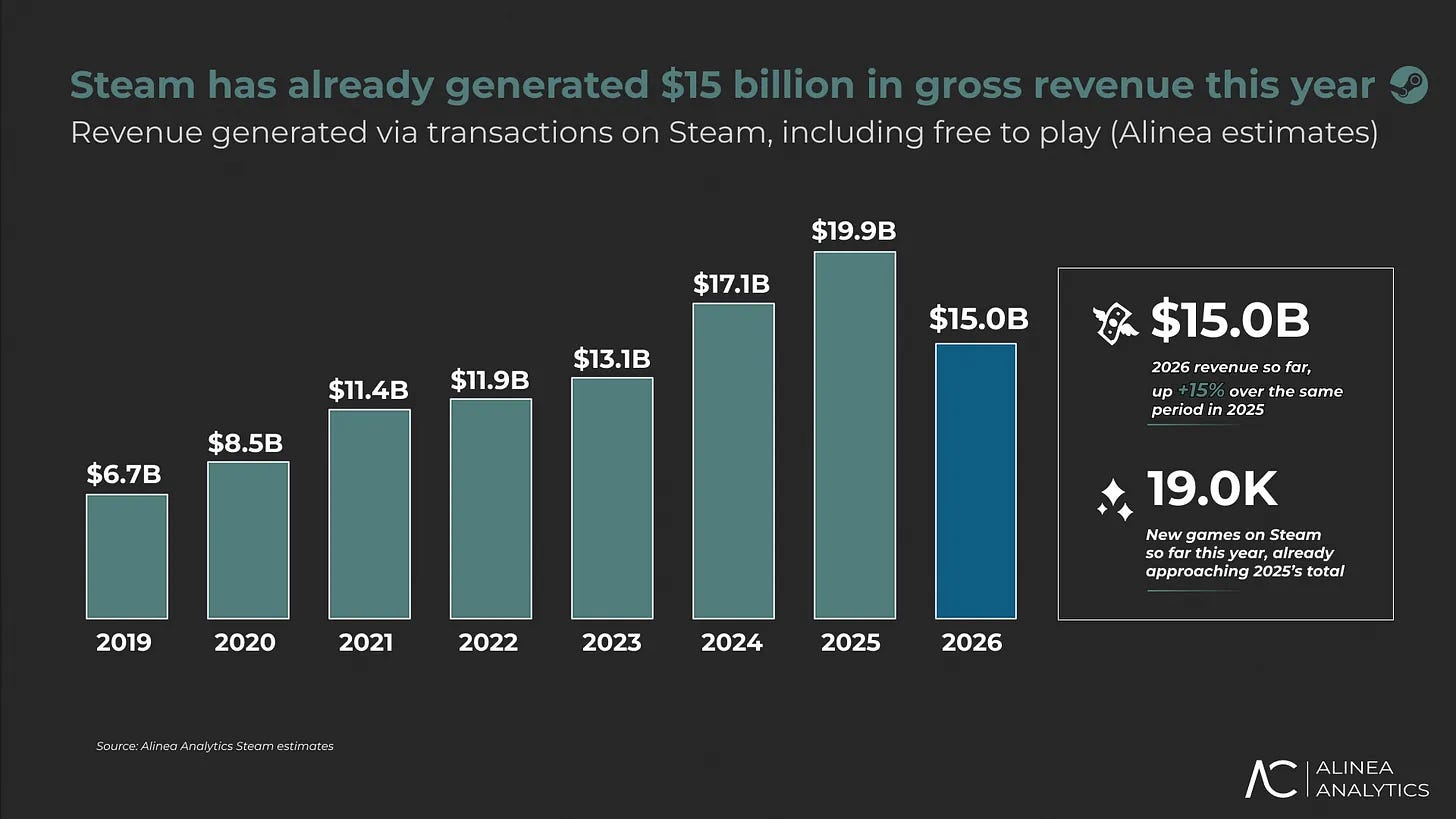
All figures are Alinea Analytics estimates, not official Valve data. Revenue is gross and covers all transactions on Steam, including F2P projects.
Market
From January to August 2026, Steam generated $15 billion in gross revenue. That is ~15% more than in the same period of 2025.
In eight months, the platform has already earned more than in all of 2023 ($13.1 billion). Steam’s revenue will most likely pass $20 billion for the first time in 2026. In 2025, it was $19.9 billion.
❗️Analyst estimates diverge sharply here. According to Video Game Insights data, Steam revenue in H1’26 was $5.36 billion (-5% YoY). Alinea Analytics puts the same period at $11.1 billion (+14.5% YoY). The scale gap may be because Alinea Analytics counts all transactions on Steam, including F2P games, while VGI counts only revenue from copy sales. But the estimates also disagree on direction.
At the same time, 19,000 new games have already been released on Steam in 2026. That is almost as many as in all of 2025, and more than in all of 2024.
New games of 2026
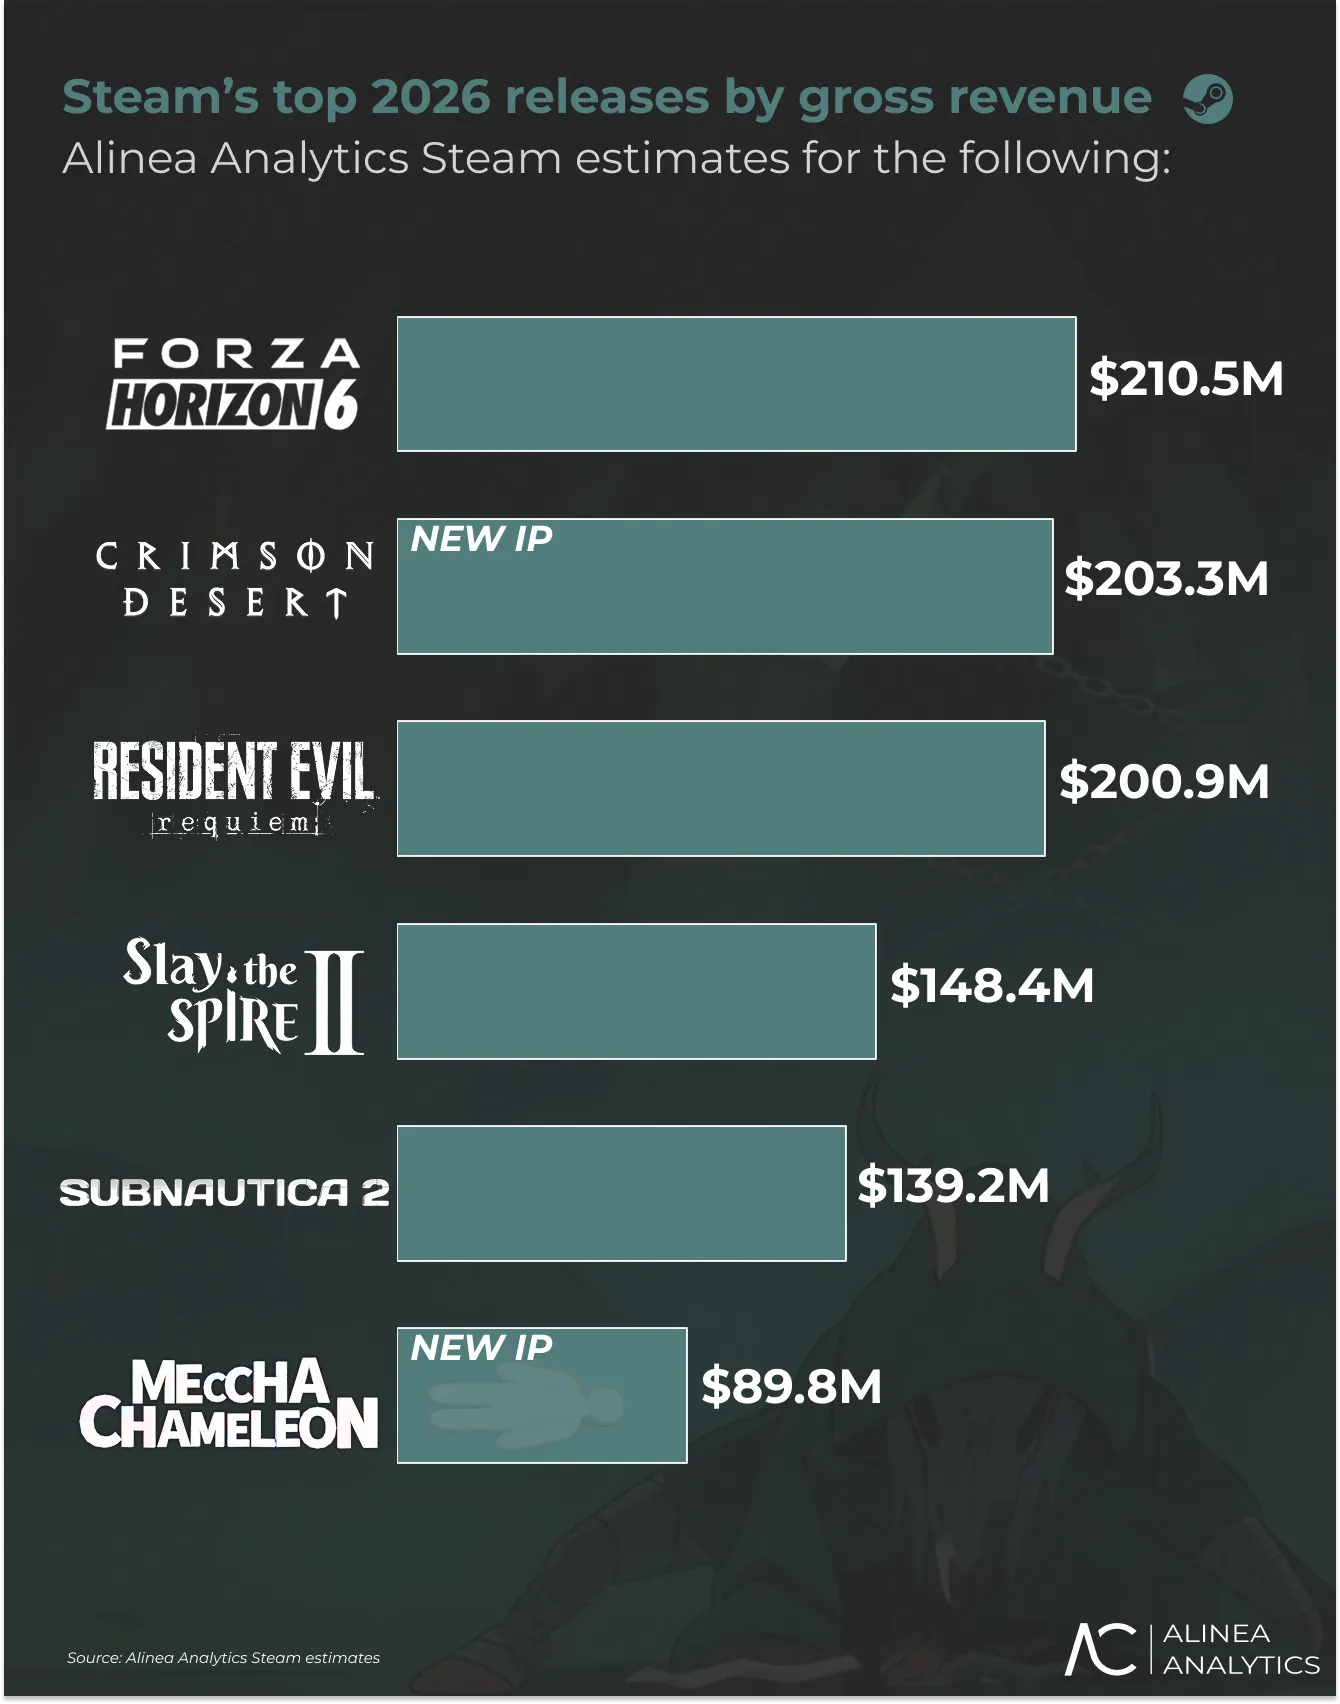
The top new 2026 releases on Steam by revenue: Forza Horizon 6 ($210.5 million), Crimson Desert ($203.3 million), and Resident Evil Requiem ($200.9 million).
Together with Slay the Spire 2, Subnautica 2, and MECCHA CHAMELEON, the six highest-grossing new releases earned just under $1 billion. That is ~6.6% of all Steam revenue in 2026.
The top 100 new games of 2026 earned ~$2.4 billion. That is ~15.9% of all Steam revenue over the eight months.
A word from our sponsor

Need a freelance 3D artist, composer, or QA tester fast? Mellow’s AI Scout finds qualified talent in under 48 hours — free to try, no commitment. Describe the role, get a shortlist, hire when you’re ready.
63% of the games in this top 100 are new IP. But more than half of the revenue (52.5%, or $1.25 billion) came from established franchises.
Crimson Desert alone accounts for ~18% of all new-IP revenue in the top 100. Without it, the remaining 62 new IPs make up only ~39% of the top 100’s revenue.
Steam’s “middle class”
Joost van Dreunen recently published Revenge of Steam’s mid-market. In his view, Steam’s growth now depends less on blockbusters, and the mid-market (games ranked 101 to 1,000 by revenue) is playing a growing role. Alinea Analytics decided to check what those games actually are.
The median game in this range earned ~$4 million in 2026: from $19.9 million at #101 to $1.9 million at #1,000.
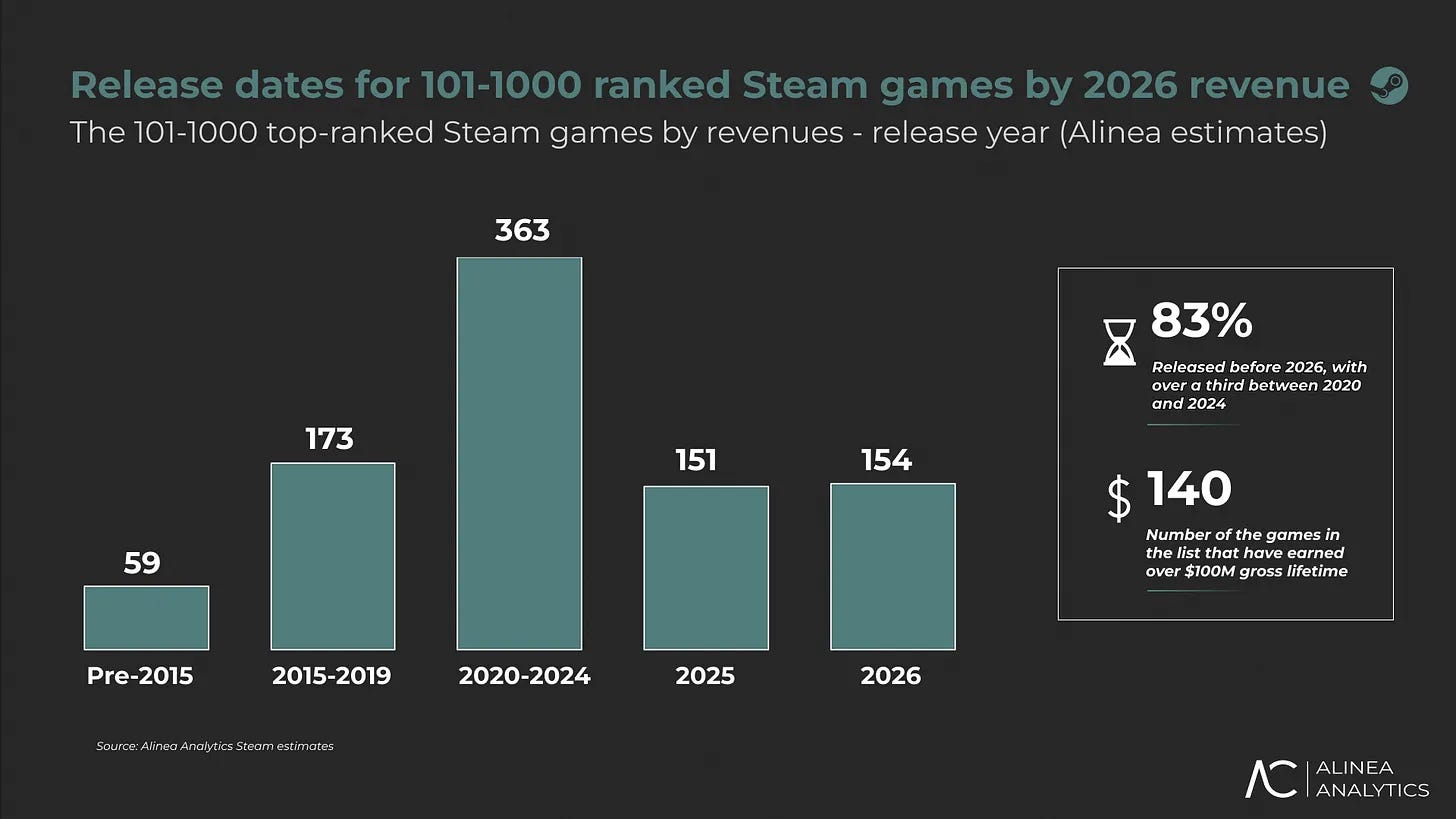
But 83% of the 900 games were released before 2026, and two-thirds are two or more years old. Most games on the list came out in 2020-2024 (363). Only 154 are 2026 releases (17%), and 151 are from 2025.
Games that have earned more than $50 million lifetime account for 51% of this segment’s 2026 revenue. About a third of the games on the list are in that group. 140 games have earned more than $100 million, and 5.2% have earned more than $200 million. That is Steam revenue only, not counting other platforms.
There are mid-budget projects on the list too, such as Mortal Shell II, Hell Let Loose: Vietnam, and The Seven Deadly Sins: Origin. But there are noticeably more old blockbusters.
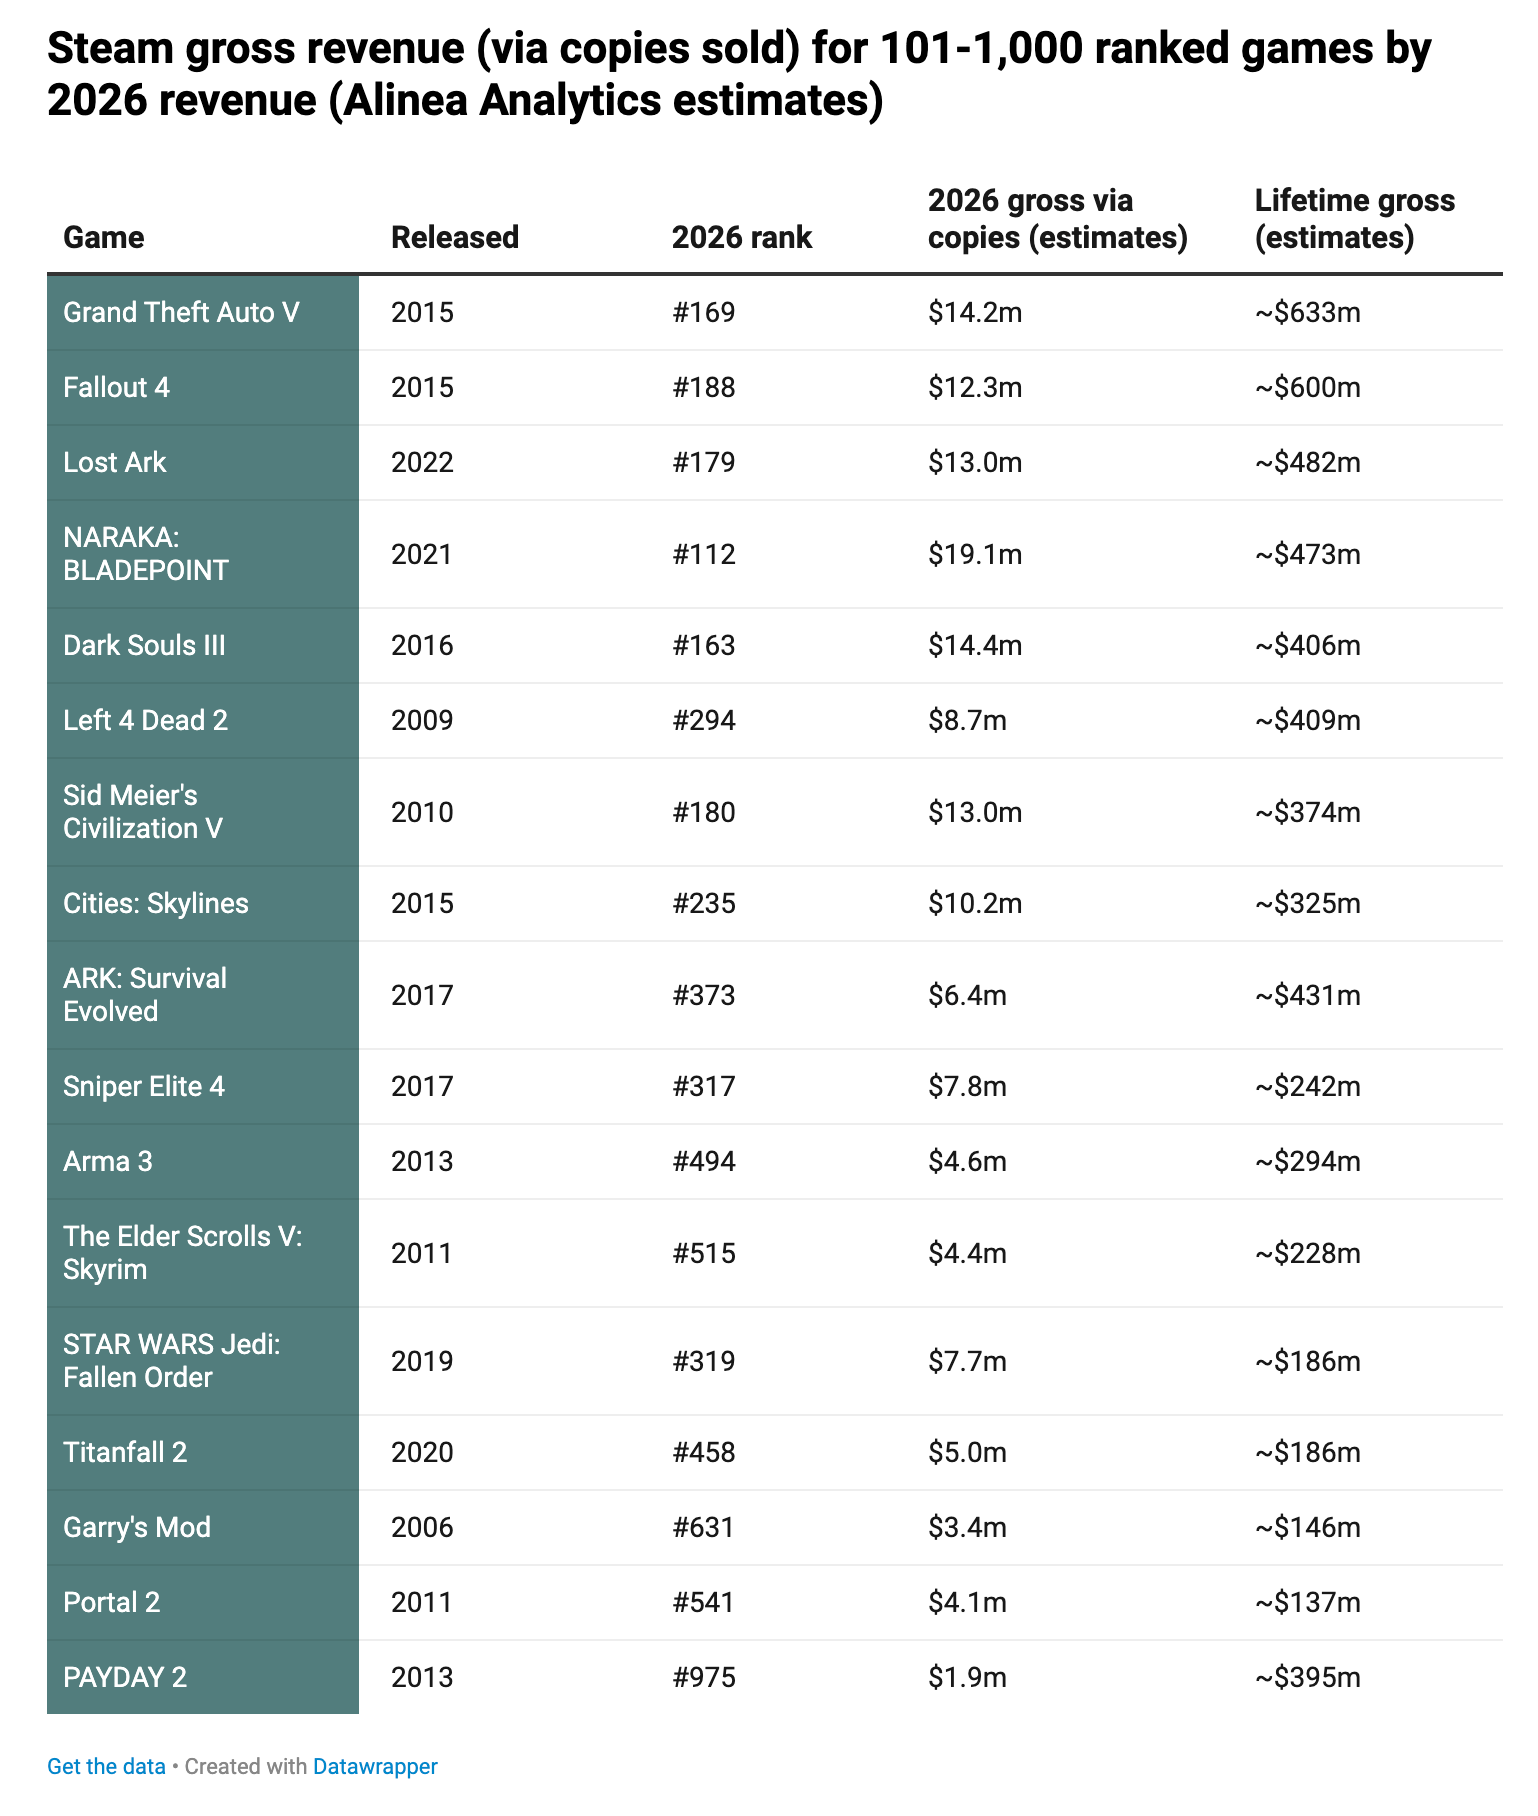
For example, GTA V (released in 2015) earned $14.2 million on Steam in 2026 and ranks #169. Over its lifetime, the game has earned ~$633 million on Steam. Fallout 4 has $12.3 million in 2026 (#188) and ~$600 million lifetime; Lost Ark has $13 million (#179) and ~$482 million.
Alinea Analytics concludes that Steam is still a hit-driven market. It’s just that many of those hits came out several years ago and are now sold at a discount. By Alinea Analytics’ own estimates, older games accounted for 79% of all Steam revenue in H1’26.
A game that earned $4 million in 2026 but was once built on a $100 million budget simply ends up next to an AA project with a $5 million budget on the chart. Comparing them directly isn’t quite fair.
Niko Partners: The Chinese Gaming Market in 2026
The player behavior data comes from a survey. Niko Partners defines the players as people who spent at least 60 minutes gaming on PC, mobile, or console in the past 30 days.
The Market
In 2025, players in China spent $51.8 billion on games (+5.4% YoY). The country’s market crossed the $50 billion mark for the first time.
❗️Niko Partners has raised its estimate for the Chinese market several times. In September 2025, analysts expected $50.7 billion for the year and $54.8 billion by 2029. In November, the forecast was raised to $51.2 billion and $57.1 billion, respectively. In the end, 2025 closed at $51.8 billion. Niko Partners attributes this to strong results from both new releases and older evergreen titles.
In 2026, Niko Partners projects the market will grow 4% to $53.9 billion. By 2030, revenue should reach $59.8 billion, at a projected CAGR of 2.9%.
❗️Meanwhile, according to CADPA, China’s domestic market grew 12.17% YoY in H1’26, to 188.45 billion yuan (~$27.9 billion). Based on official data, the growth rate is 3 times higher than Niko Partners expects for full-year 2026. The two approaches use different methodologies: CADPA counts the revenue of Chinese platforms and developers based on official data, while Niko Partners models player spending.
ARPU in China exceeded $70 for the first time in 2025. By 2030, it should rise to $77.68. In last year’s report, ARPU for 2024 was $68.
Managing a distributed dev team shouldn’t mean managing a compliance headache. Mellow’s Contractor Management gives you ready-made contracts, IP compliance, and automated payouts for contractors in 150+ countries — for $35/month per contractor.
By 2030, China will have 769 million players, which makes it the world’s largest gaming market by this metric. A year ago, Niko Partners counted 722 million players at the end of 2024.
Trends
China’s 15th Five-Year Plan (2026-2030) supports the gaming industry as part of the country’s push for digital innovation and cultural industries. More game licenses are being issued in 2026 than in 2025. In the first 10 months of 2025, China issued 1,441 licenses (+24% YoY).
Chinese companies are actively adopting generative AI in content production, operations, and the games themselves. UGC is growing at the same time. Many successful live-service games in China are gradually becoming platforms where players create and share content.
Niko Partners expects publishers to take more payments outside the usual storefronts, improving their margins. Direct-to-consumer monetization of IP (in the form of merchandise, etc.) will also grow.
Spending on premium PC and console games is growing, for both domestic and international titles. Foreign companies can still enter the Chinese market through platforms like Steam.
Analysts also expect growth in niche genres aimed at underserved audiences.
Niko Partners analysts see the AI infrastructure boom as the market’s main problem, since it has driven up demand for memory and semiconductors. As a result, consumer electronics components are in short supply, and device prices are rising.
The Audience and Its Preferences
On average, players in China spend 15.8 hours a week gaming. In 2025, it was 14.1 hours.
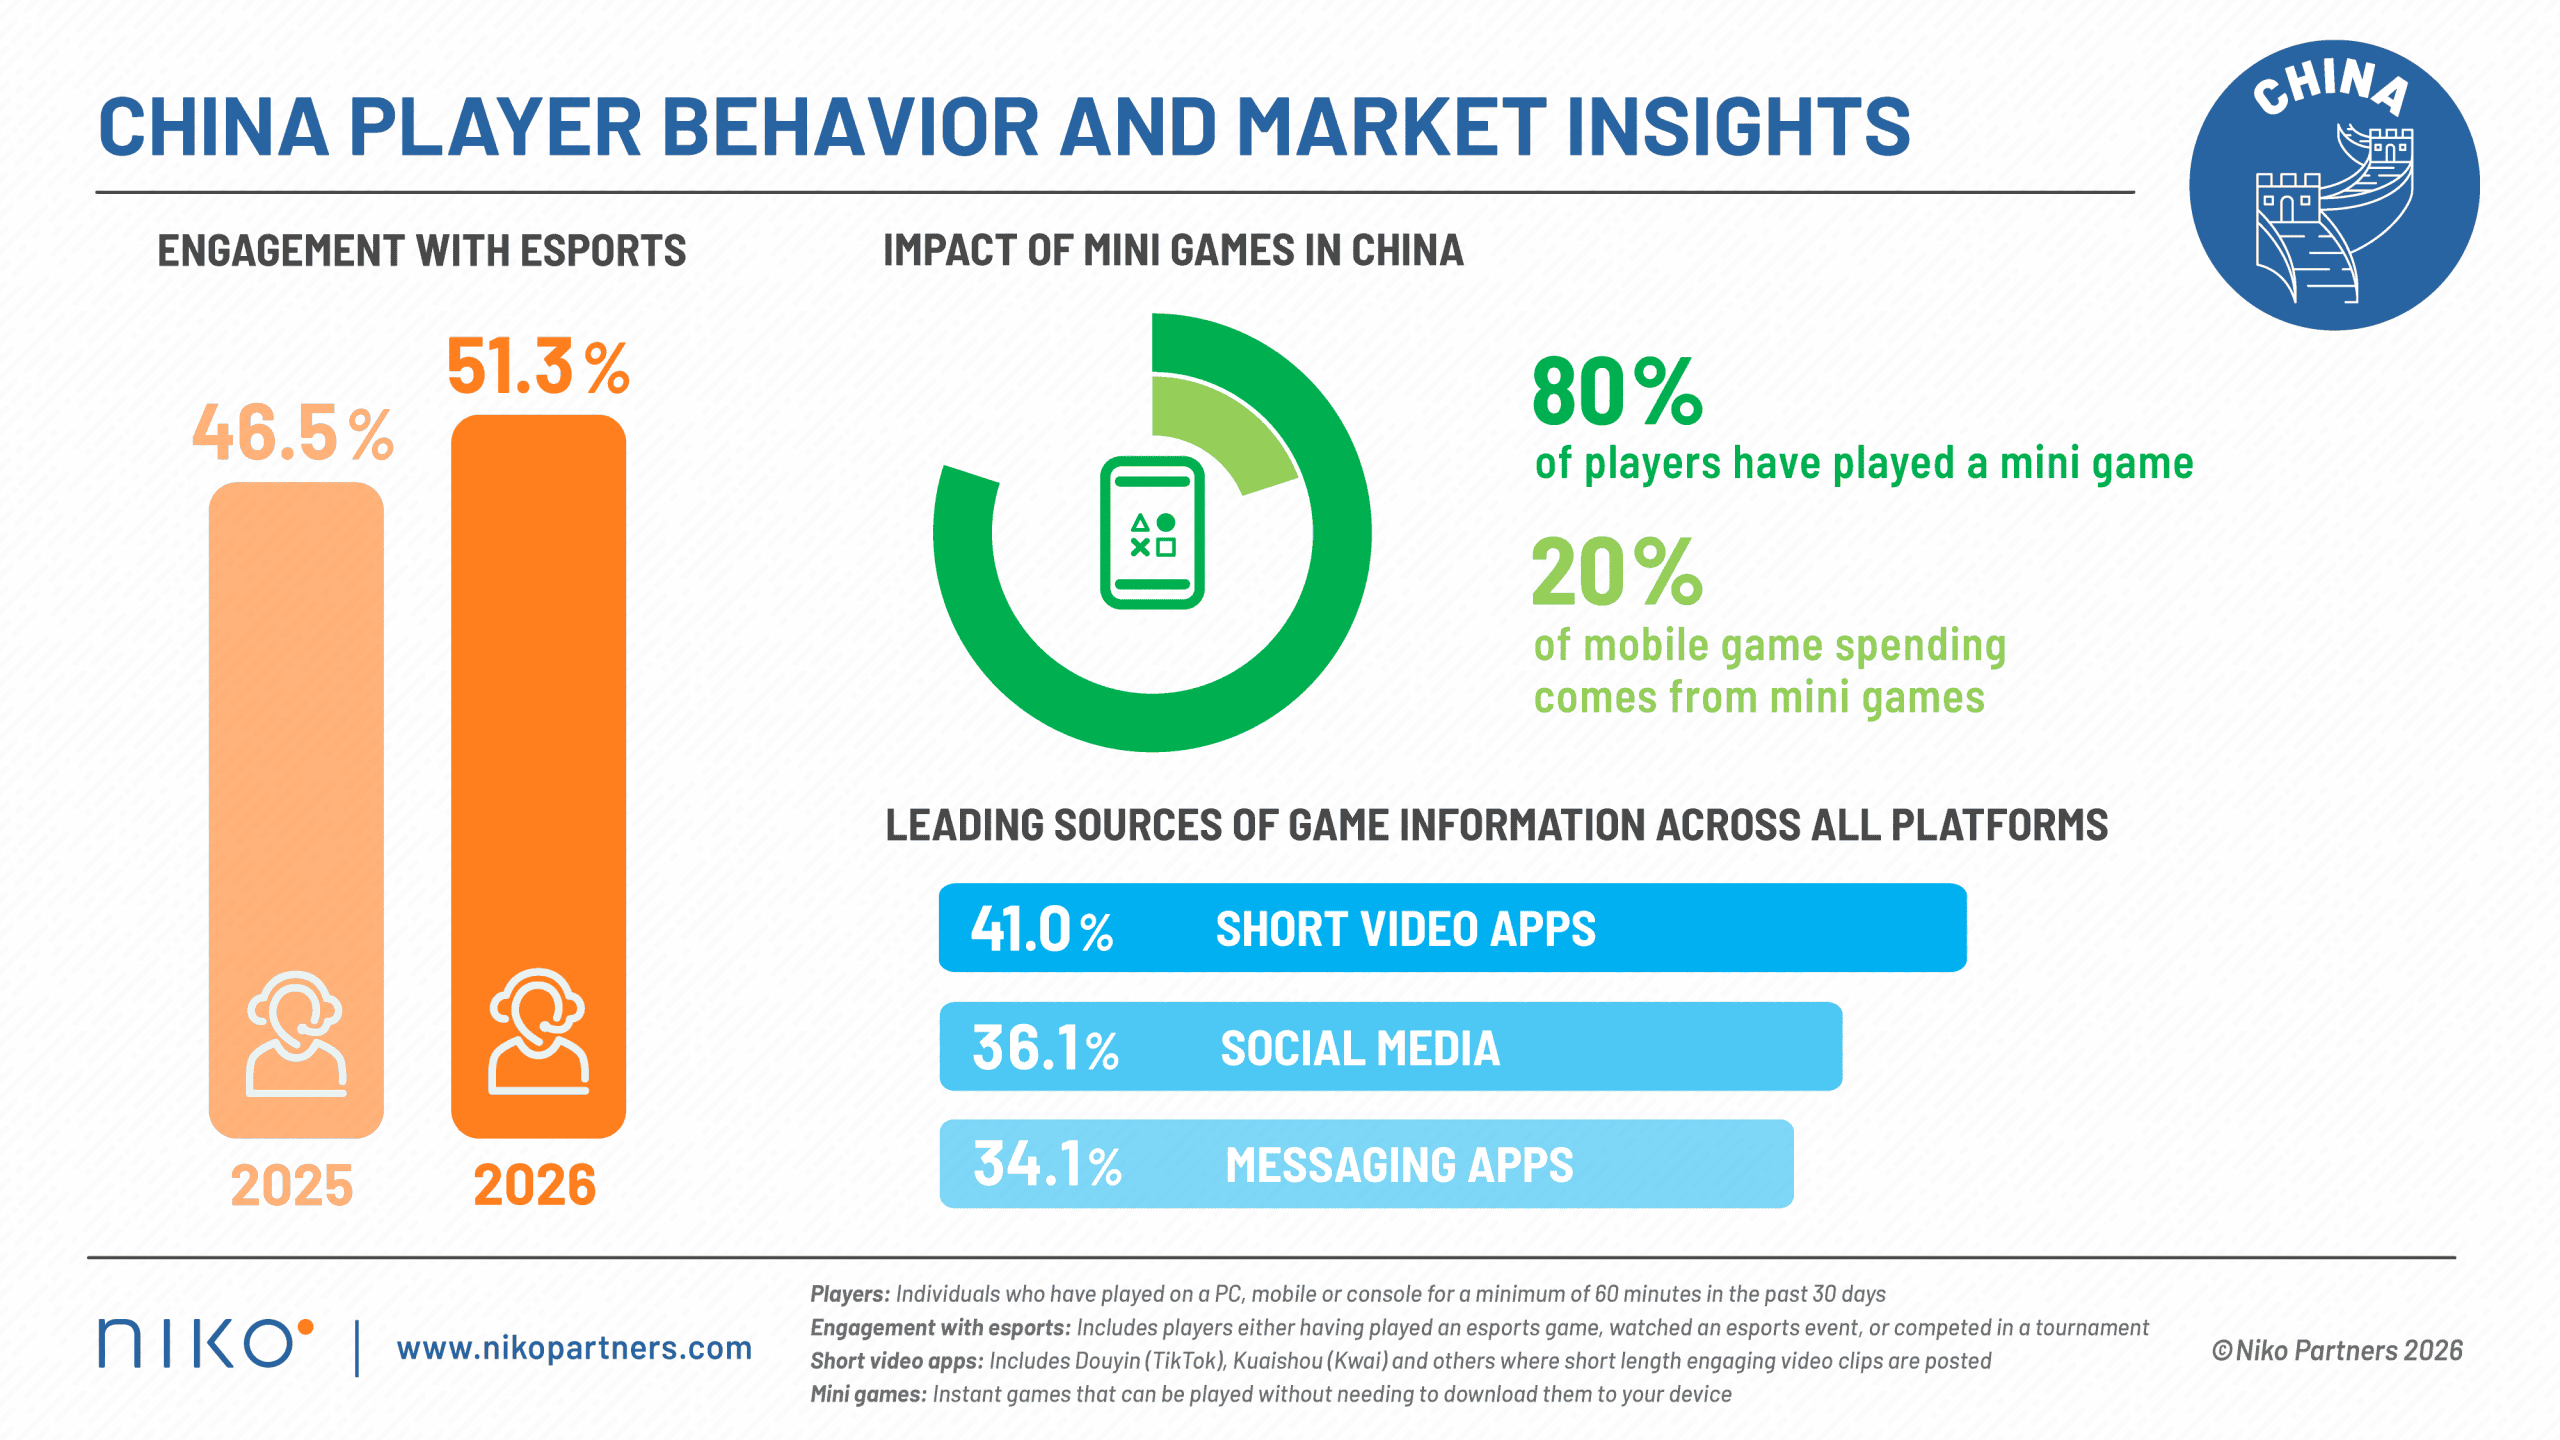
In 2026, 51.3% of players in China engage with esports in one way or another. A year ago, the share was 46.5%. Niko Partners counts as esports-engaged those who played esports games, watched tournaments, or competed in them.
80% of players in China have played mini games at least once. In last year’s report, the share was 84.4%.
Mini games, however, now account for nearly 20% of mobile game spending in the country. A year ago, Niko Partners put their share at ~10%, though of the whole market’s revenue, not just mobile. For comparison, according to CADPA, mini games earned 31.66 billion yuan (~$4.7 billion, +36.01% YoY) in H1’26, making them the fastest-growing segment of the Chinese market.
Short video apps like Douyin and Kuaishou are the main source of game information in China. 41% of players discover new games through them, and it is the #1 channel across all platforms: PC, mobile, and console. Social media (36.1%) and messaging apps (34.1%) follow. The short video share did not change over the year, while social media grew from 33.9%.
66% of players in China access games beyond the Great Firewall in one way or another. 33.6% use so-called “boosters” (gaming accelerators), 30.8% play on global servers, and 21.9% use a VPN.
The main reasons players in China quit games are poor balance (37.2%), cheaters and hacks (35.3%), and bugs (31%).
GameAnalytics: Key Roblox and Roblox Game Metrics in 2026
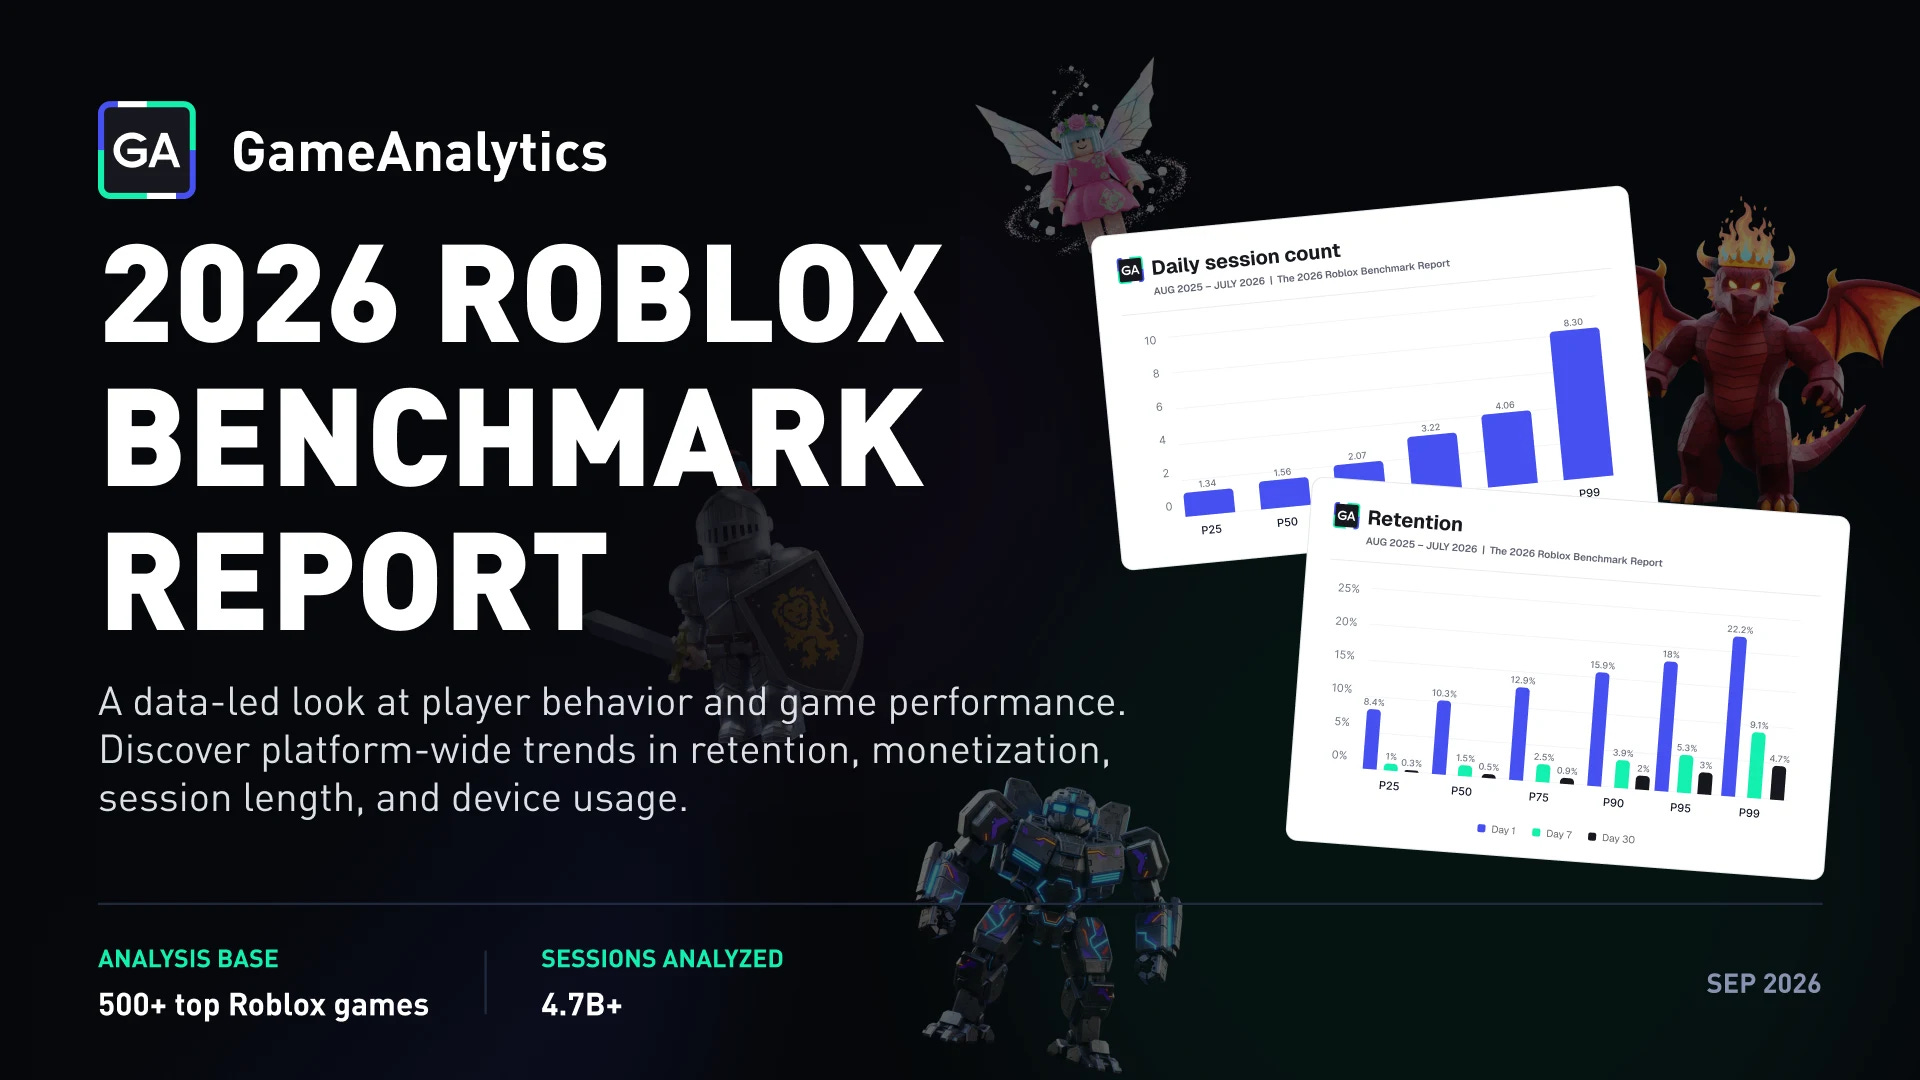
GameAnalytics analyzed data from more than 500 Roblox games using its analytics, with over 1 million MAU between August 2025 and July 2026. That’s 4.76 billion game sessions in total. Metrics are given in percentiles: p50 is the median, p99 is the top 1%.
Platform and Players
GameAnalytics notes that, according to Roblox itself, the platform’s DAU has declined every quarter since Q3’25, from 152 million to 123 million in Q2’26. Bookings growth has also slowed sharply.
From concept art to launch-day marketing, most game studios rely on contractors in multiple countries. Mellow makes it simple to hire, pay, and stay compliant with talent in 150+ countries — no legal entity required.
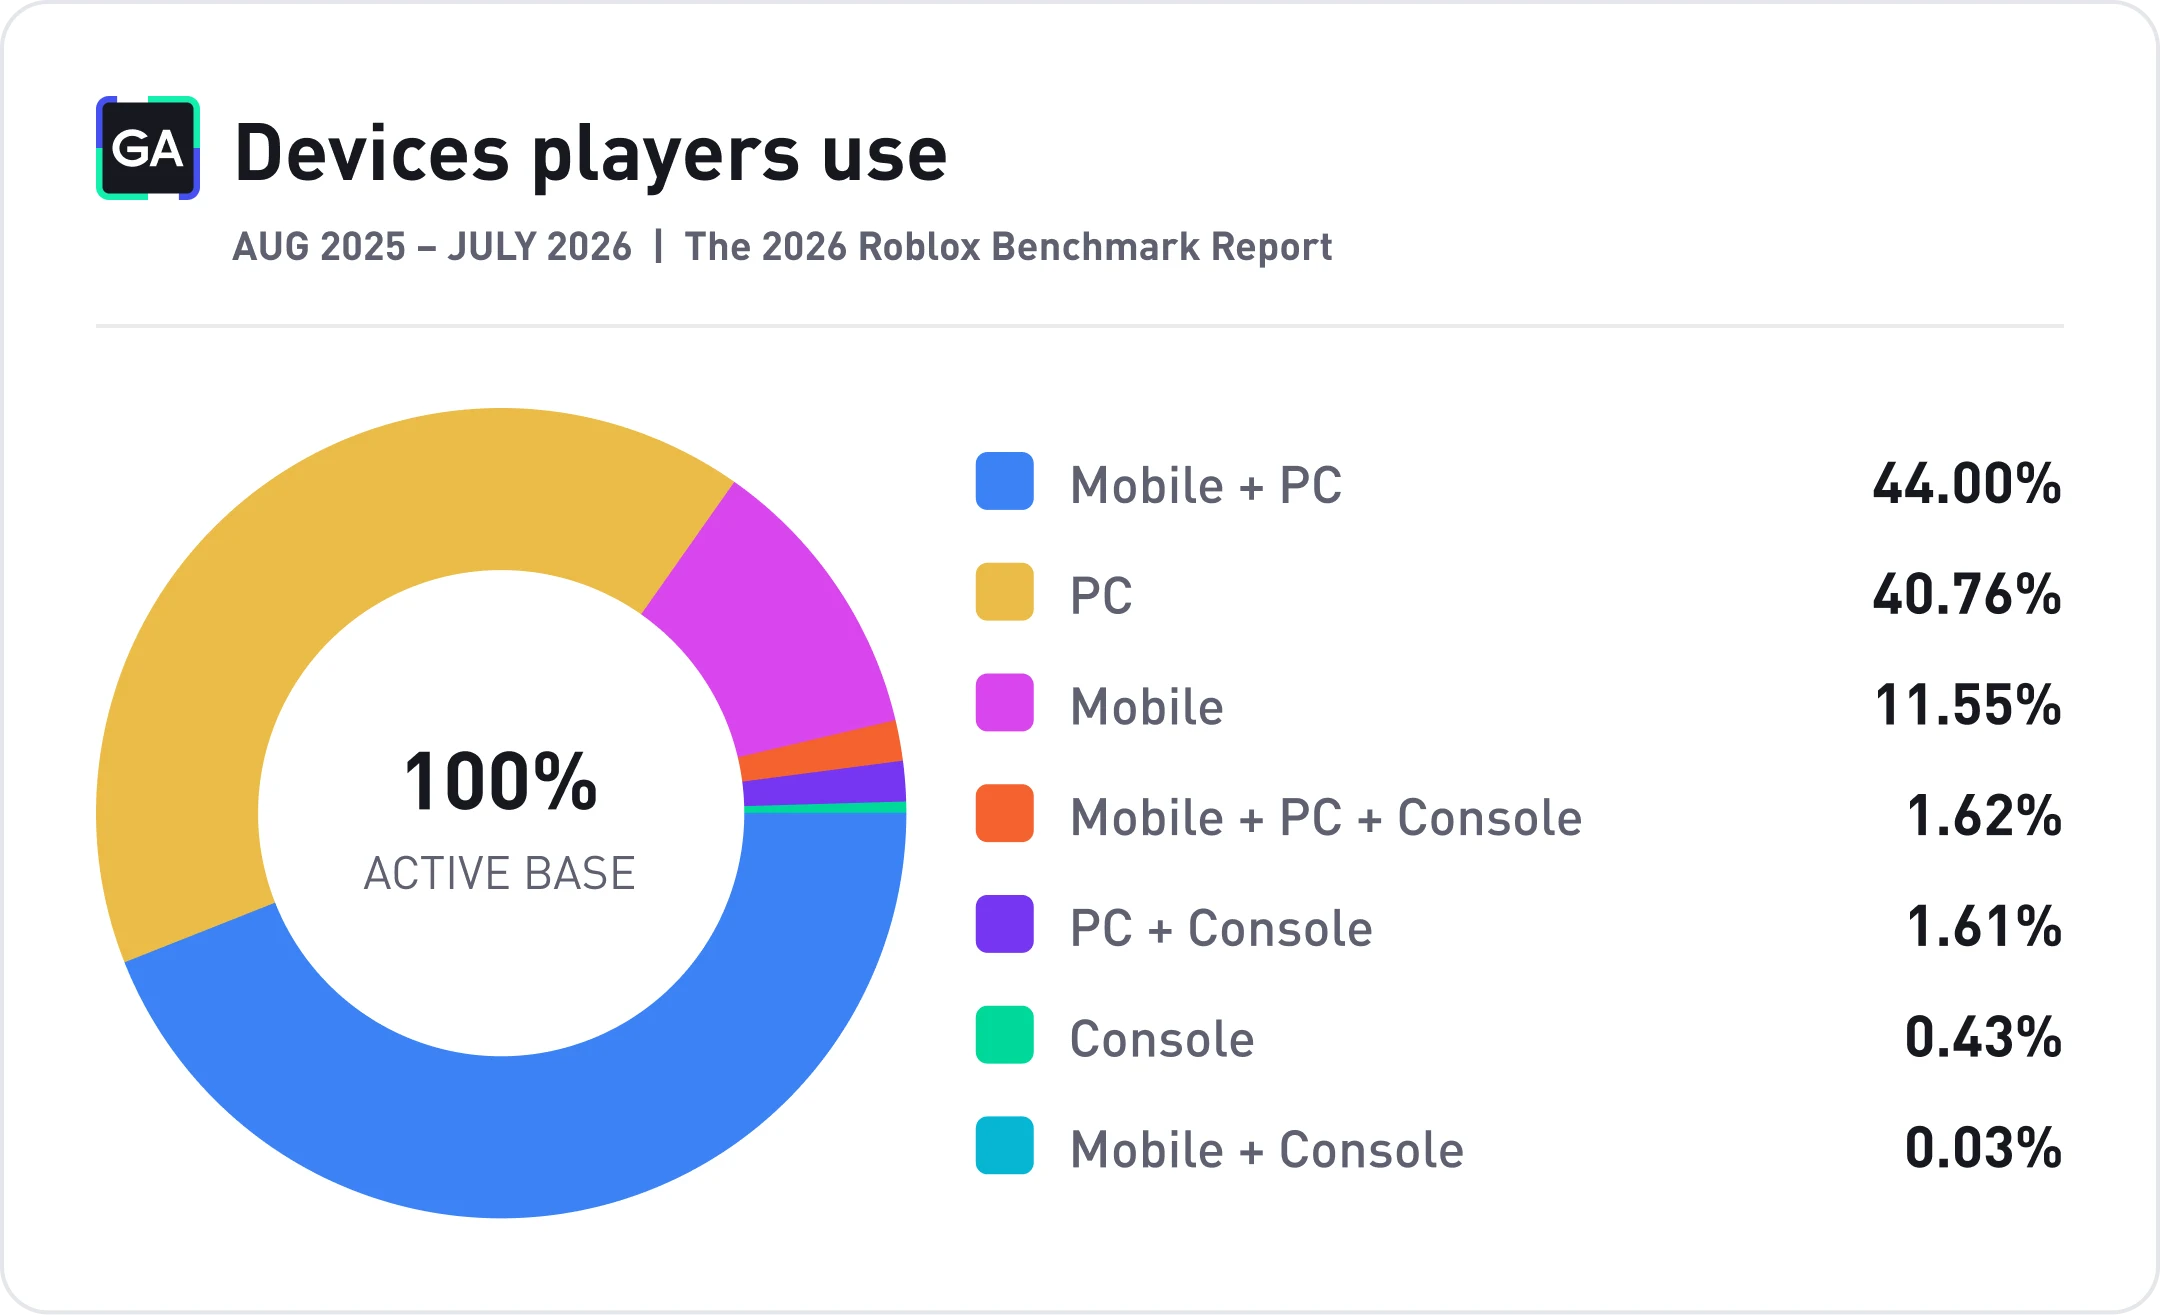
44% of Roblox players access the platform from both mobile and PC. A year ago, it was 48.39%. Meanwhile, the share of PC-only players grew (from 37.56% to 40.76%), and so did the share of mobile-only players (11.55%, up from 7-10% in 2025). Unlike the other metrics, GameAnalytics calculated this one across all 17,000+ Roblox games that use its analytics.
❗️According to Newzoo, 24% of Roblox players aged 10 to 65 played only on mobile in 2025. The difference may come down to methodology: GameAnalytics counts every device a player used at least once during the year, so it ends up with fewer “mobile-only” players. Newzoo, on the other hand, doesn’t count the youngest players.
Consoles still account for a very small share. Only 0.43% of players play exclusively on consoles (about 2% in 2025). In total, 3.69% of players use consoles, mostly alongside PC or mobile.
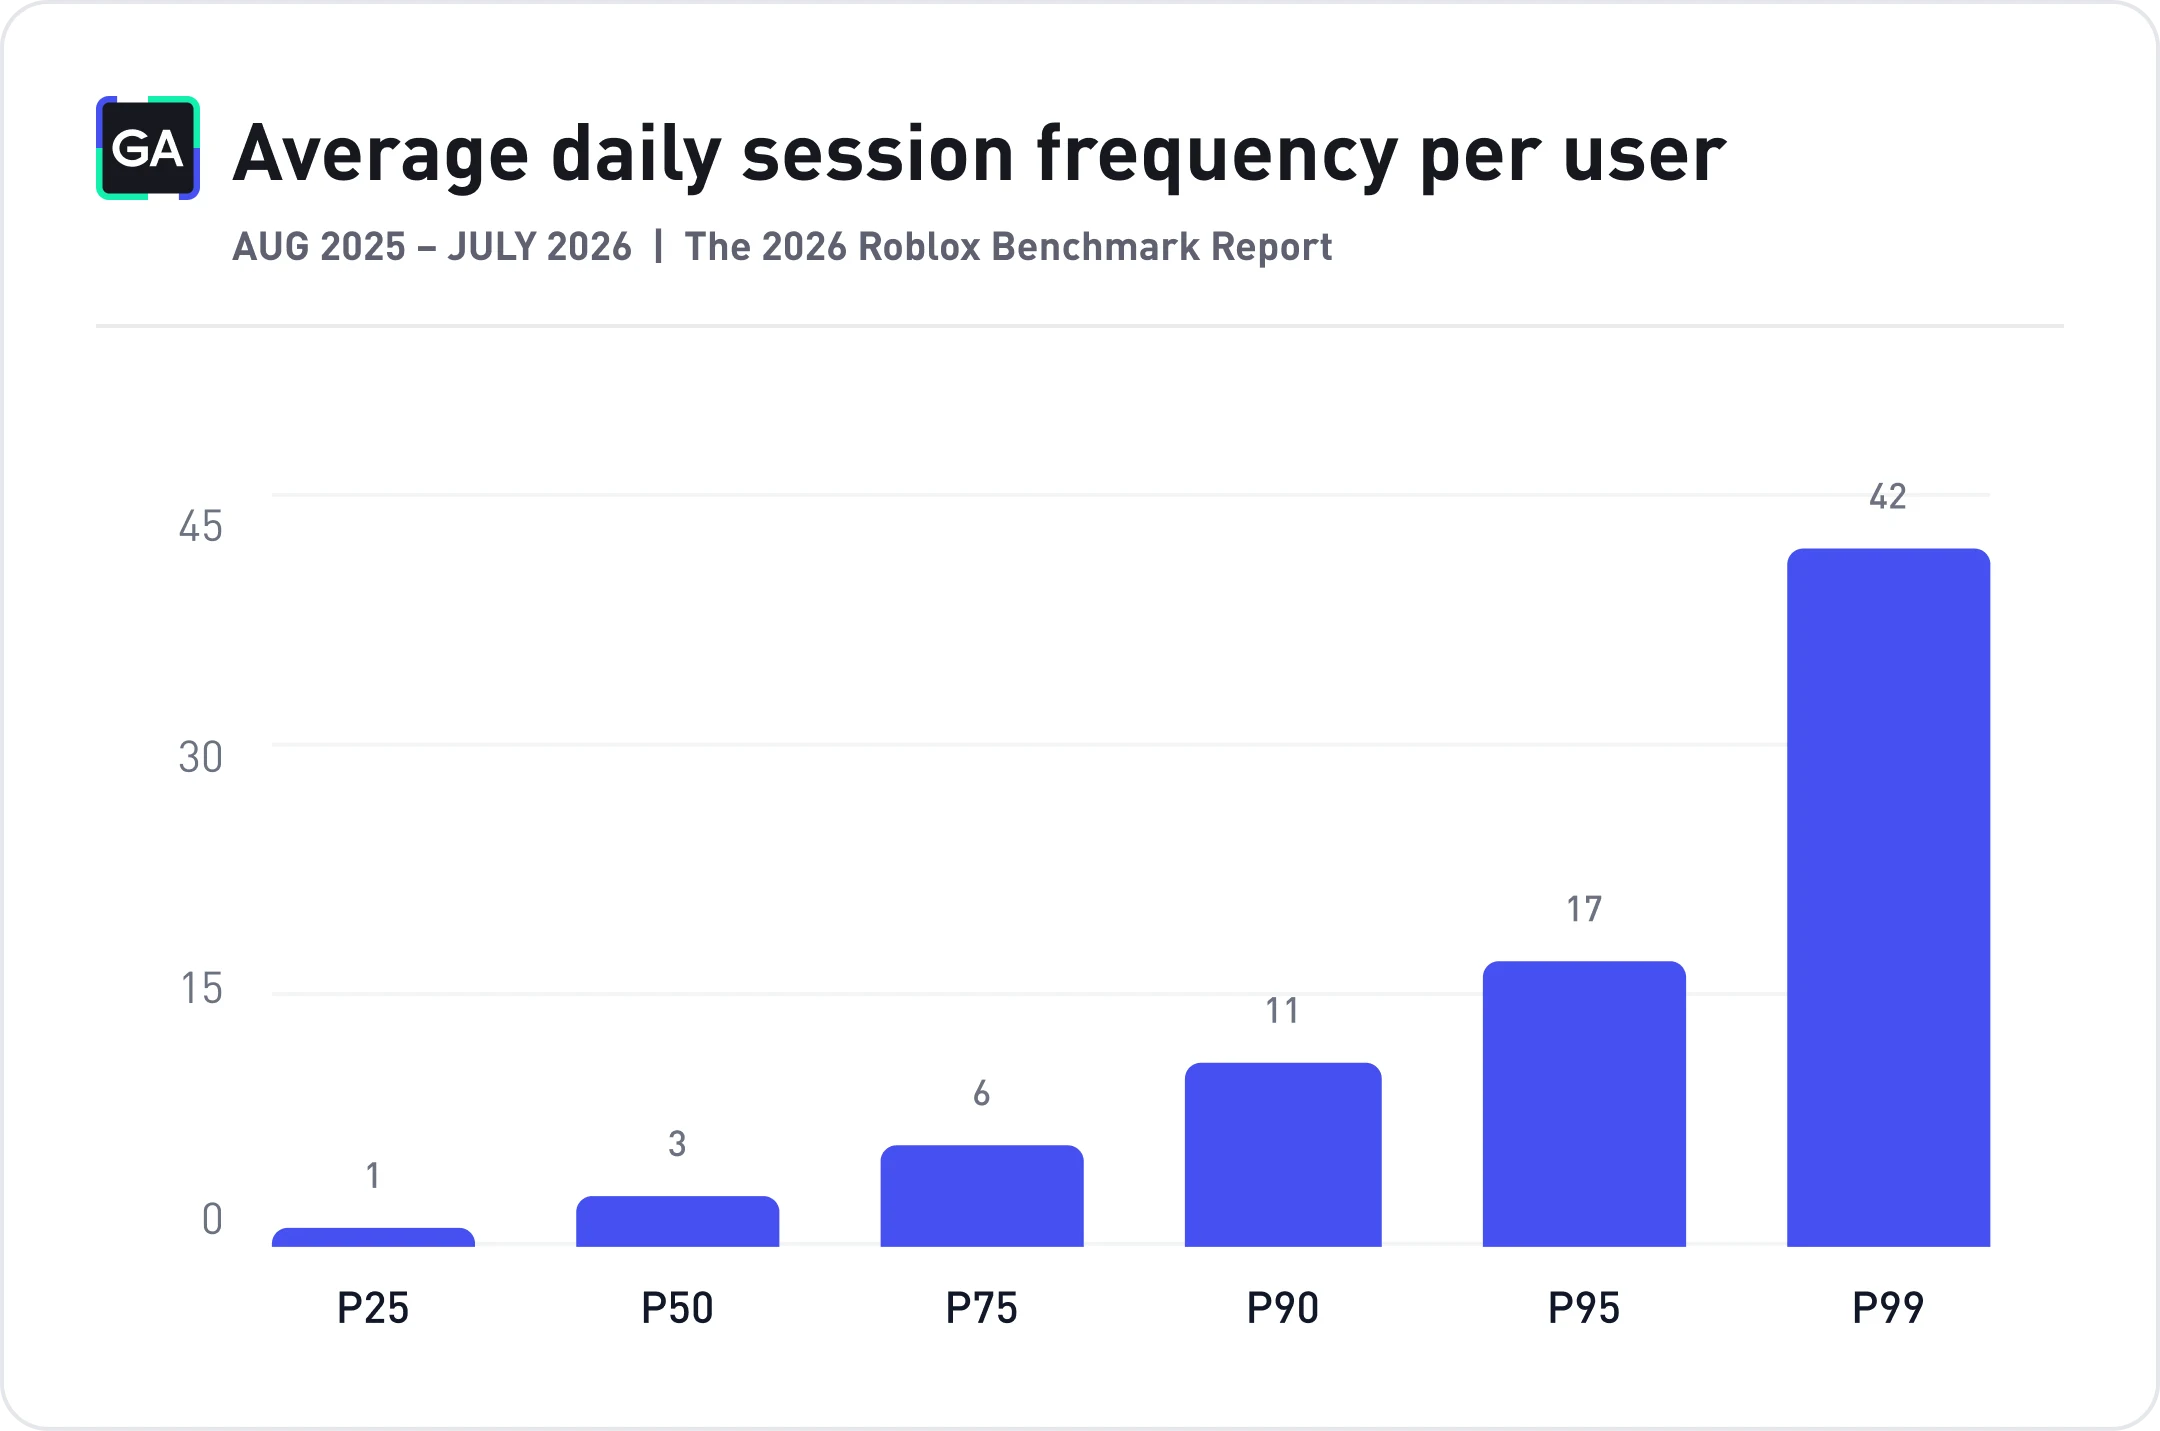
The median player opens Roblox games 3 times a day. The top 10% of players have 11 sessions a day, and the top 1% have 42.
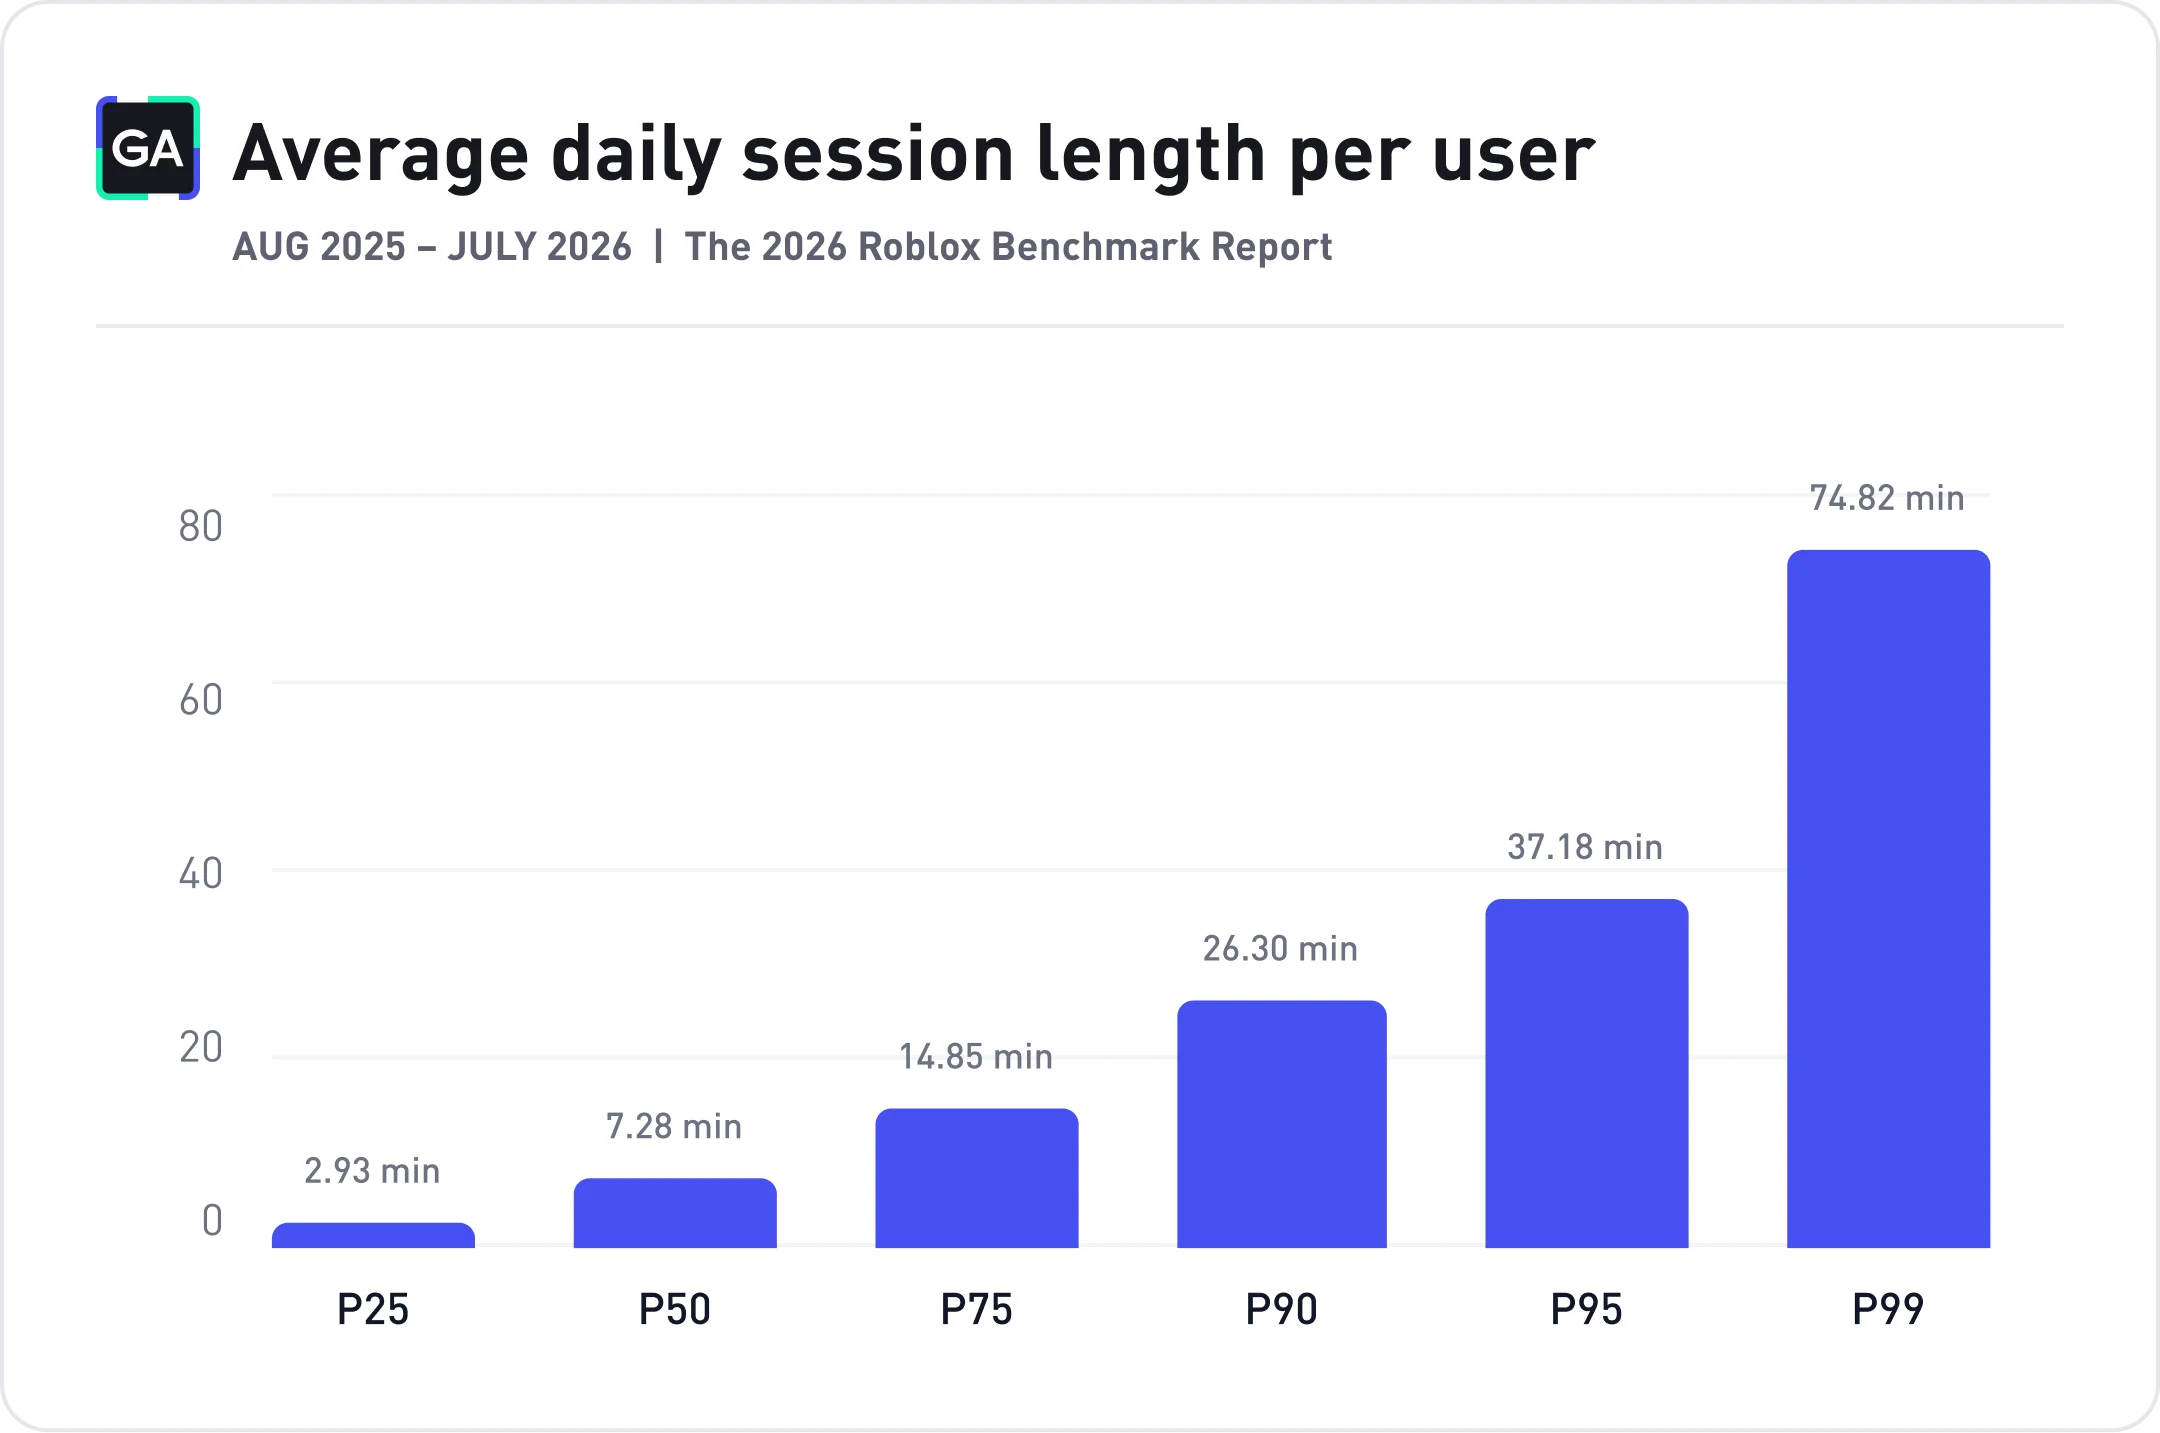
The median player session lasts 7.28 minutes. For the top 1%, it’s 74.82 minutes.
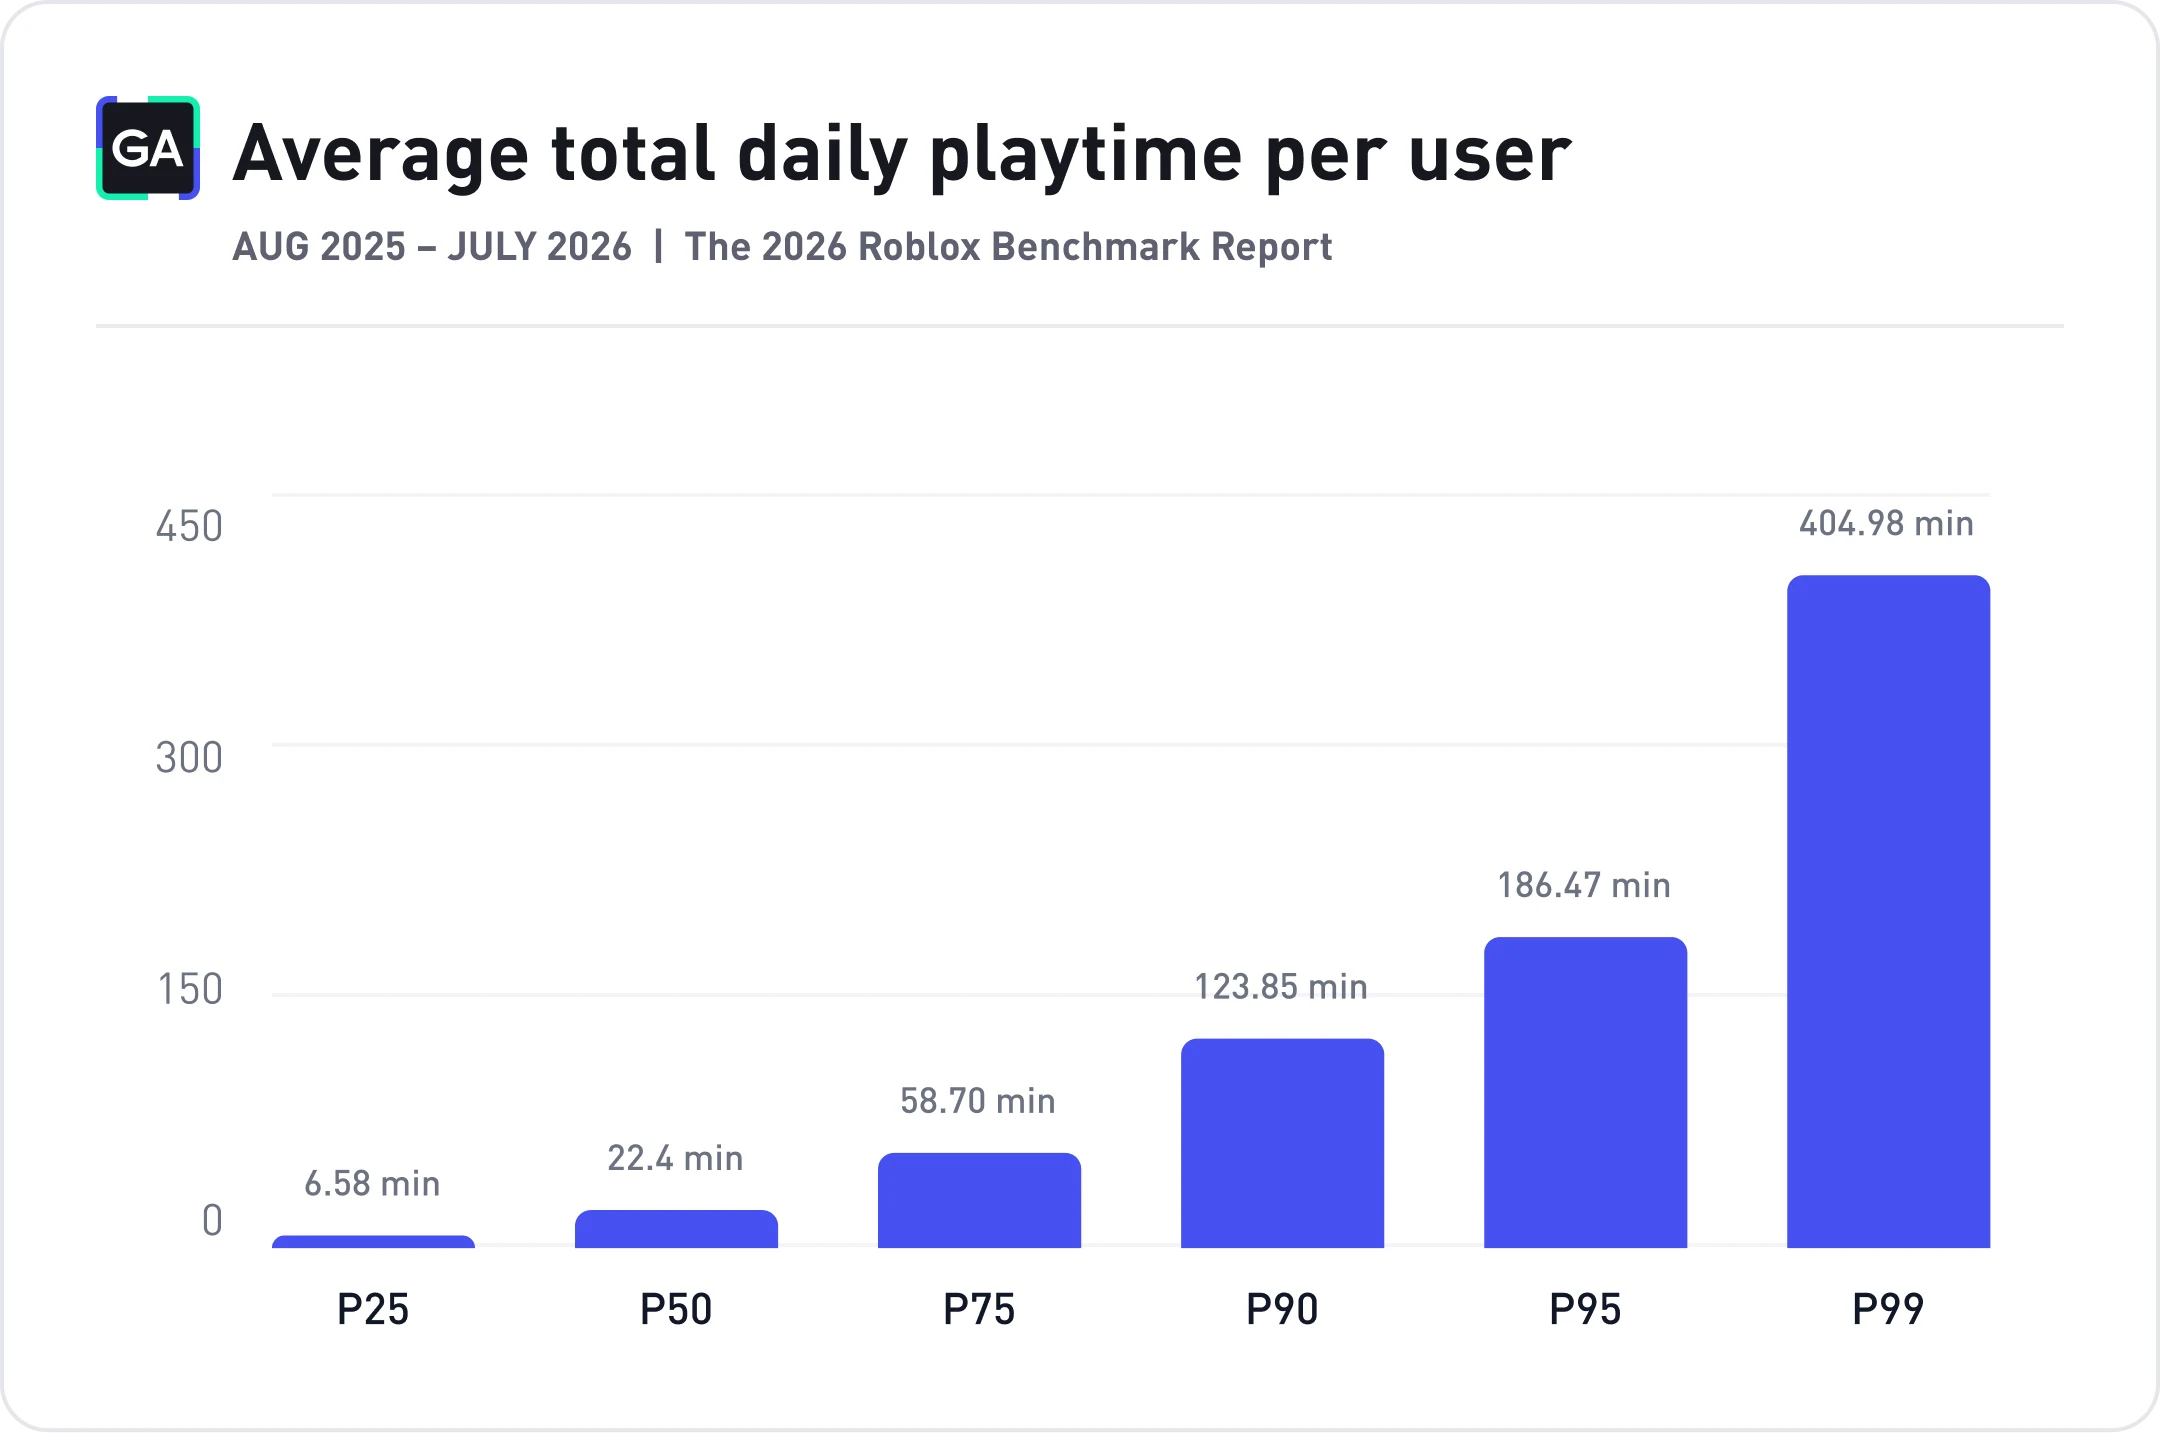
The median player spends 22.4 minutes a day in Roblox games. The top 10% spend more than two hours (123.85 minutes), and the top 1% almost seven hours (404.98 minutes).
Roblox itself reports 2.7 hours a day per user. But that figure covers all activity on the platform, including chat and avatar customization, while GameAnalytics counts only time spent in games. Roblox also uses averages in its reports, not medians.
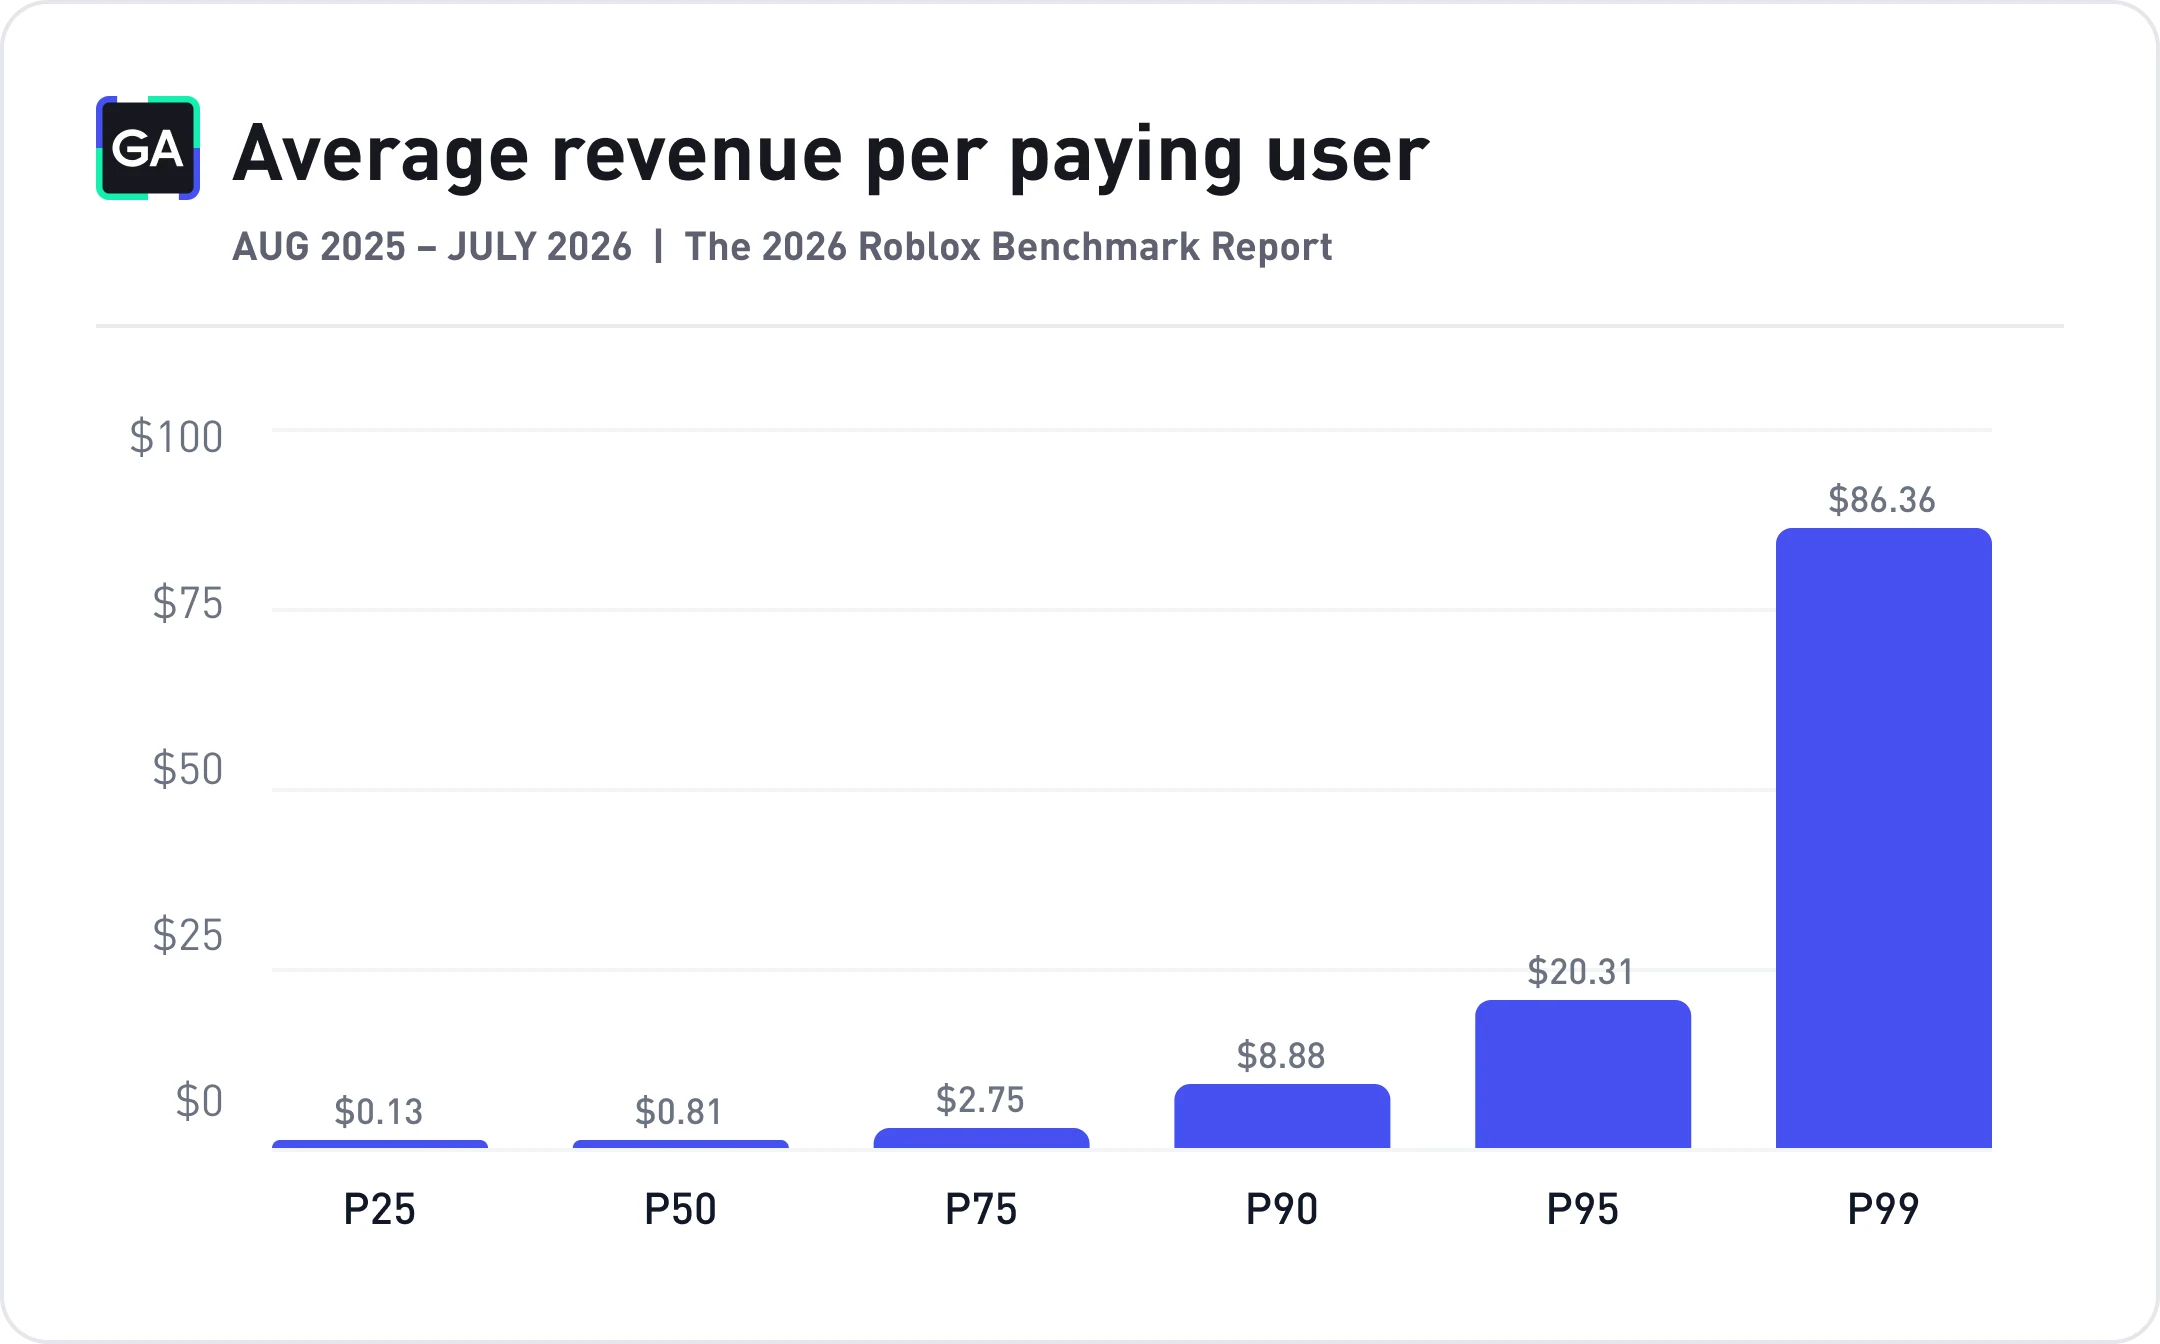
3.80% of players spent anything at all in Roblox games over the year. Two years ago, GameAnalytics reported that 4.2% of players paid.
The median paying player spent $0.81 over the year. The top 10% spent $8.88, and the top 5% spent $20.31. The top 1% of payers, however, spent $86.36.
Game Benchmarks
❗️Please note that GameAnalytics excluded projects that didn’t reach 1 million MAU during the year. If we include all projects, the metrics would be lower.
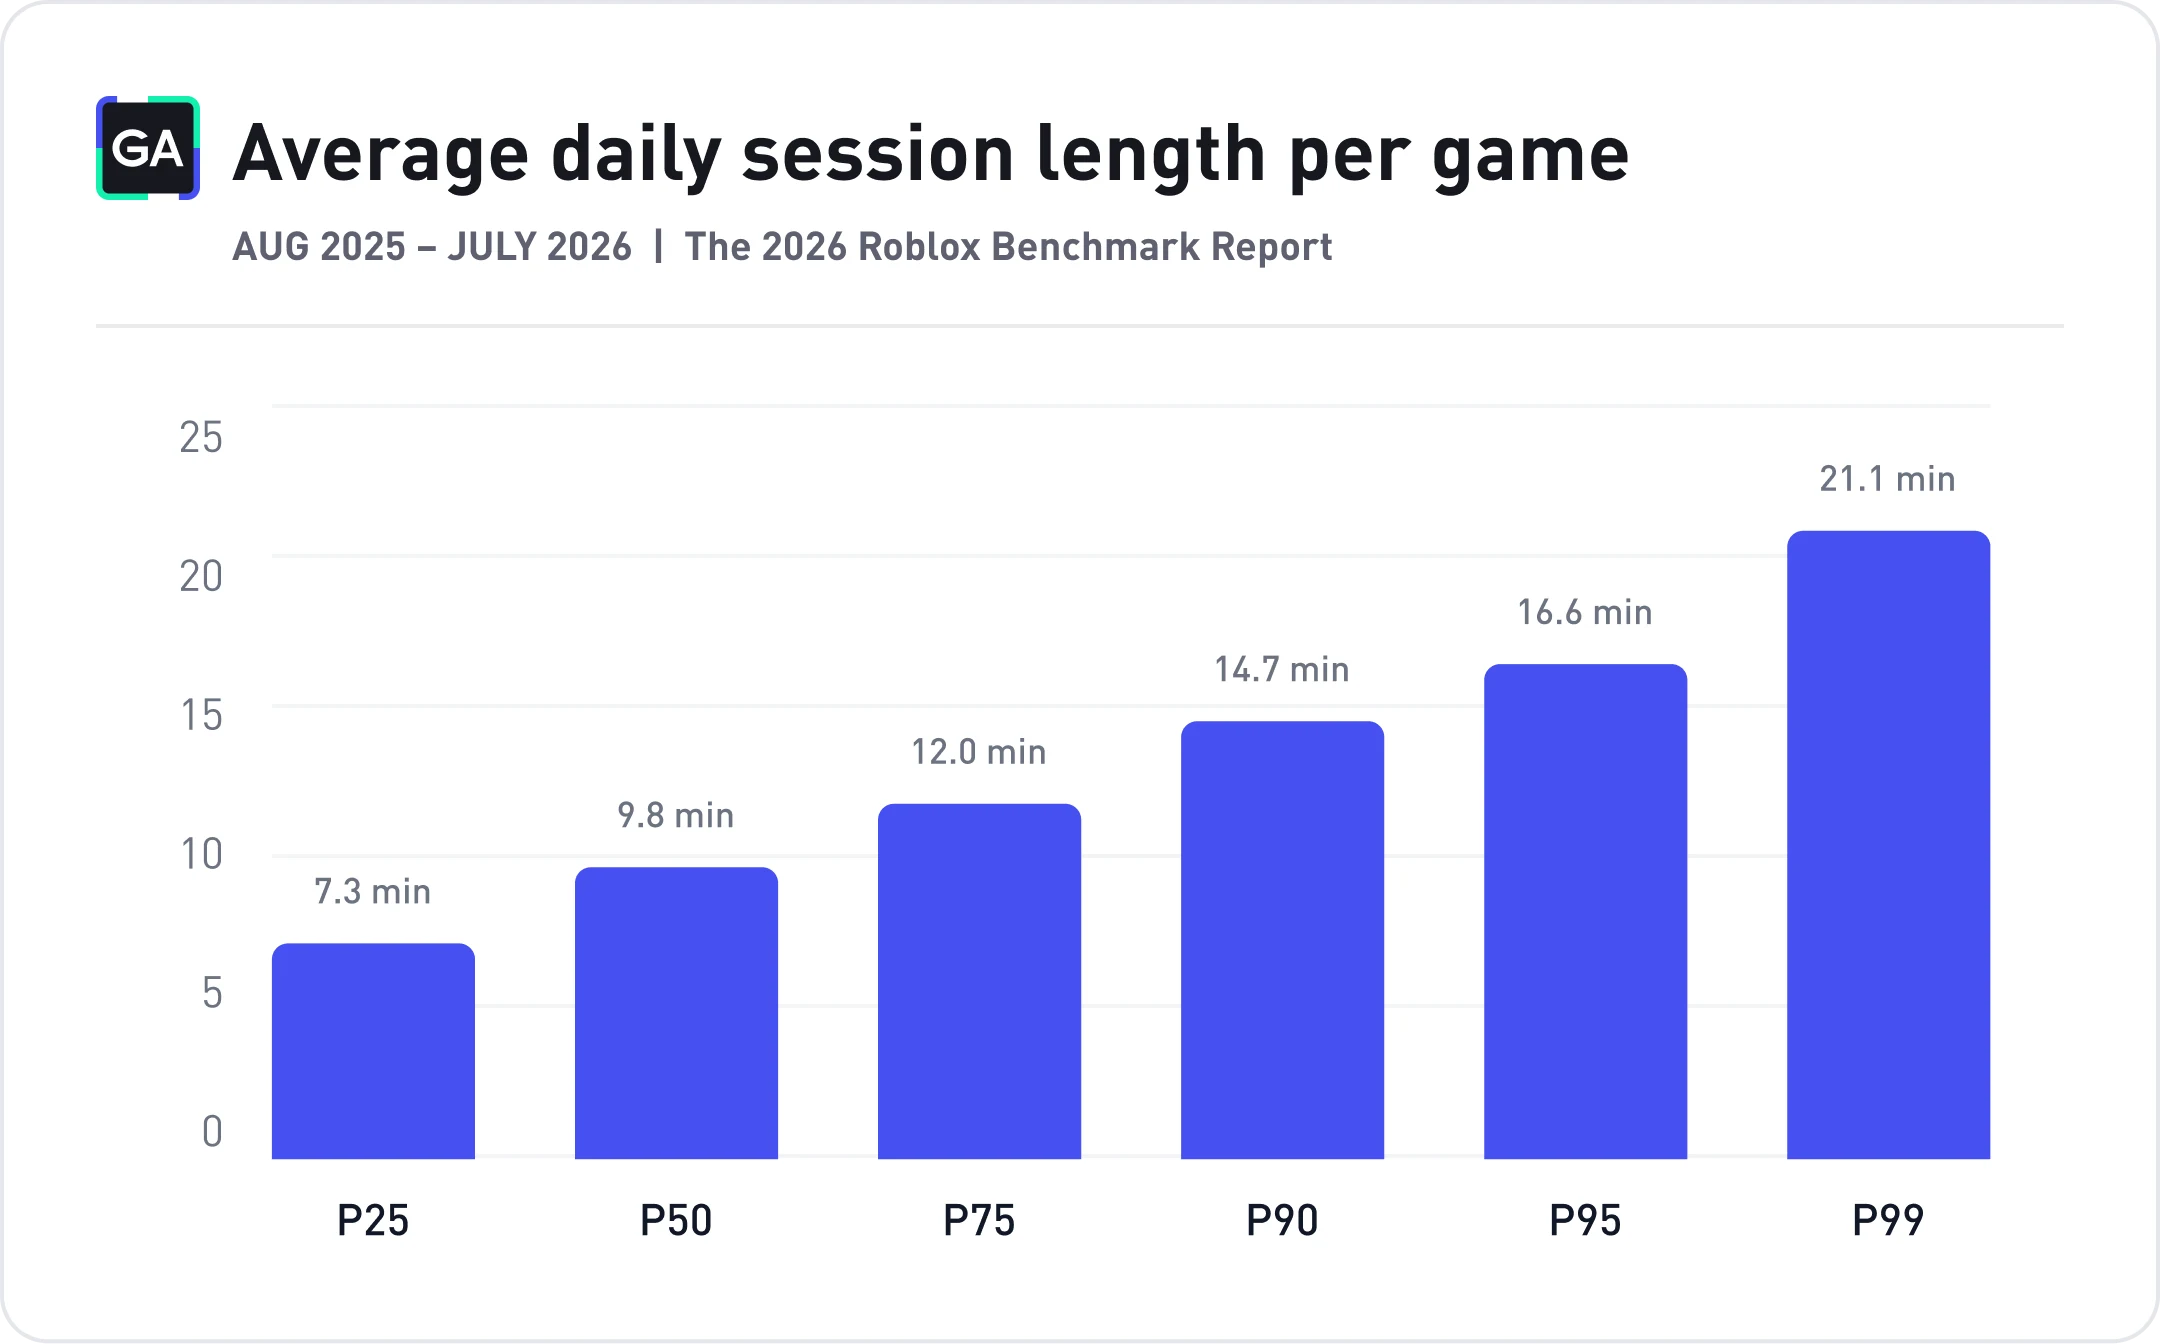
The median game session lasts 9.8 minutes. In the top 5% of games, it’s 16.6 minutes, and in the top 1%, 21.1 minutes.
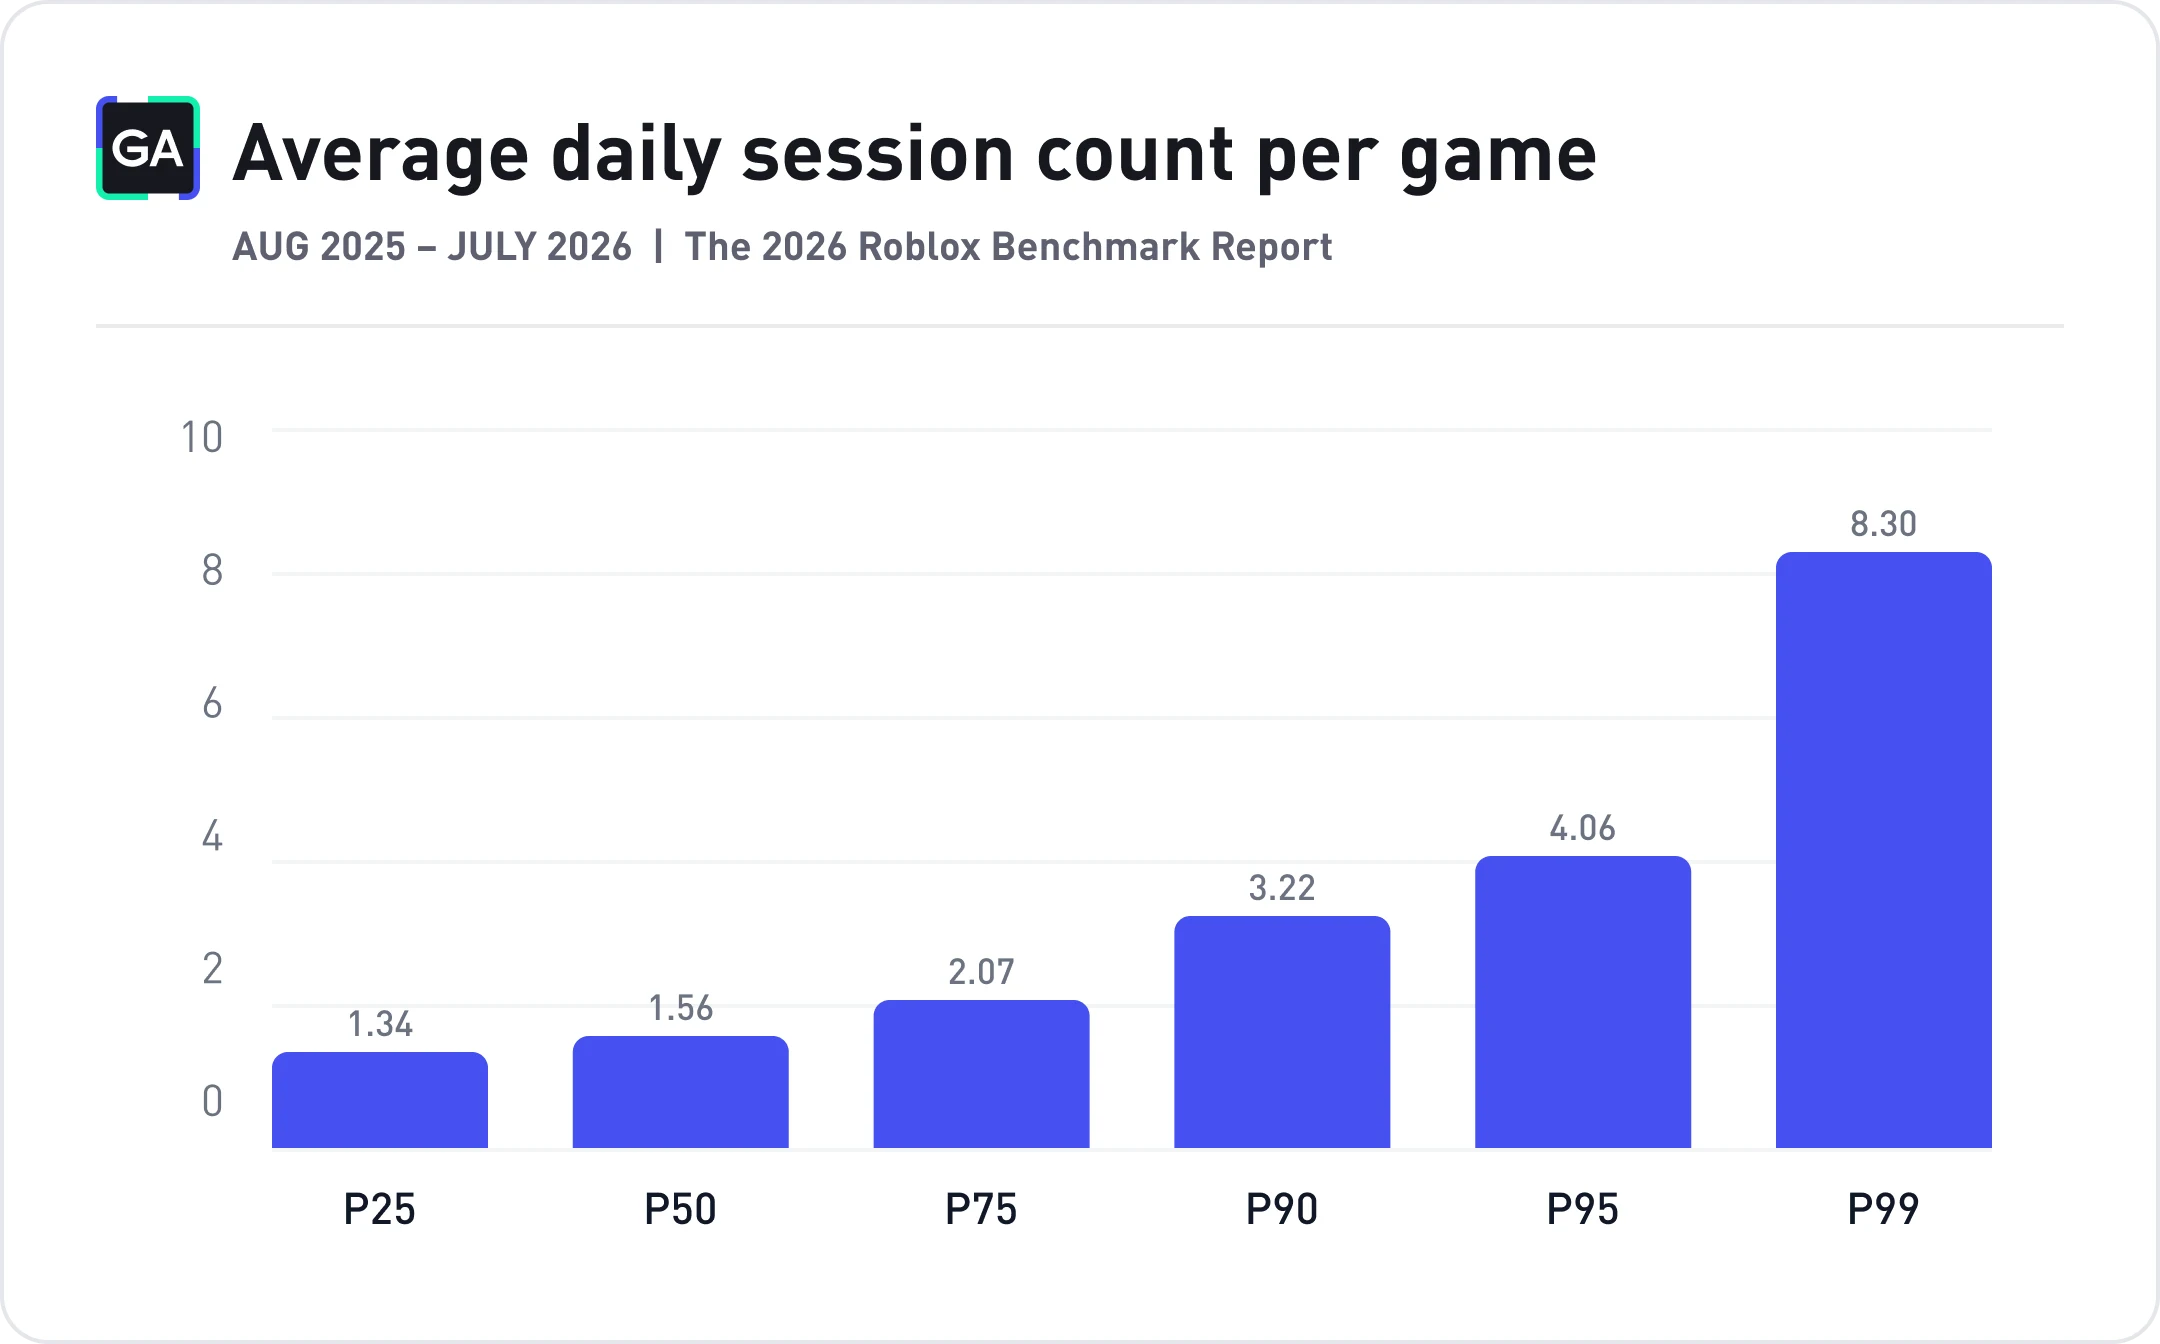
Players open the median game 1.56 times a day. The top 10% of games get 3.22 sessions, and the top 1% get 8.3.
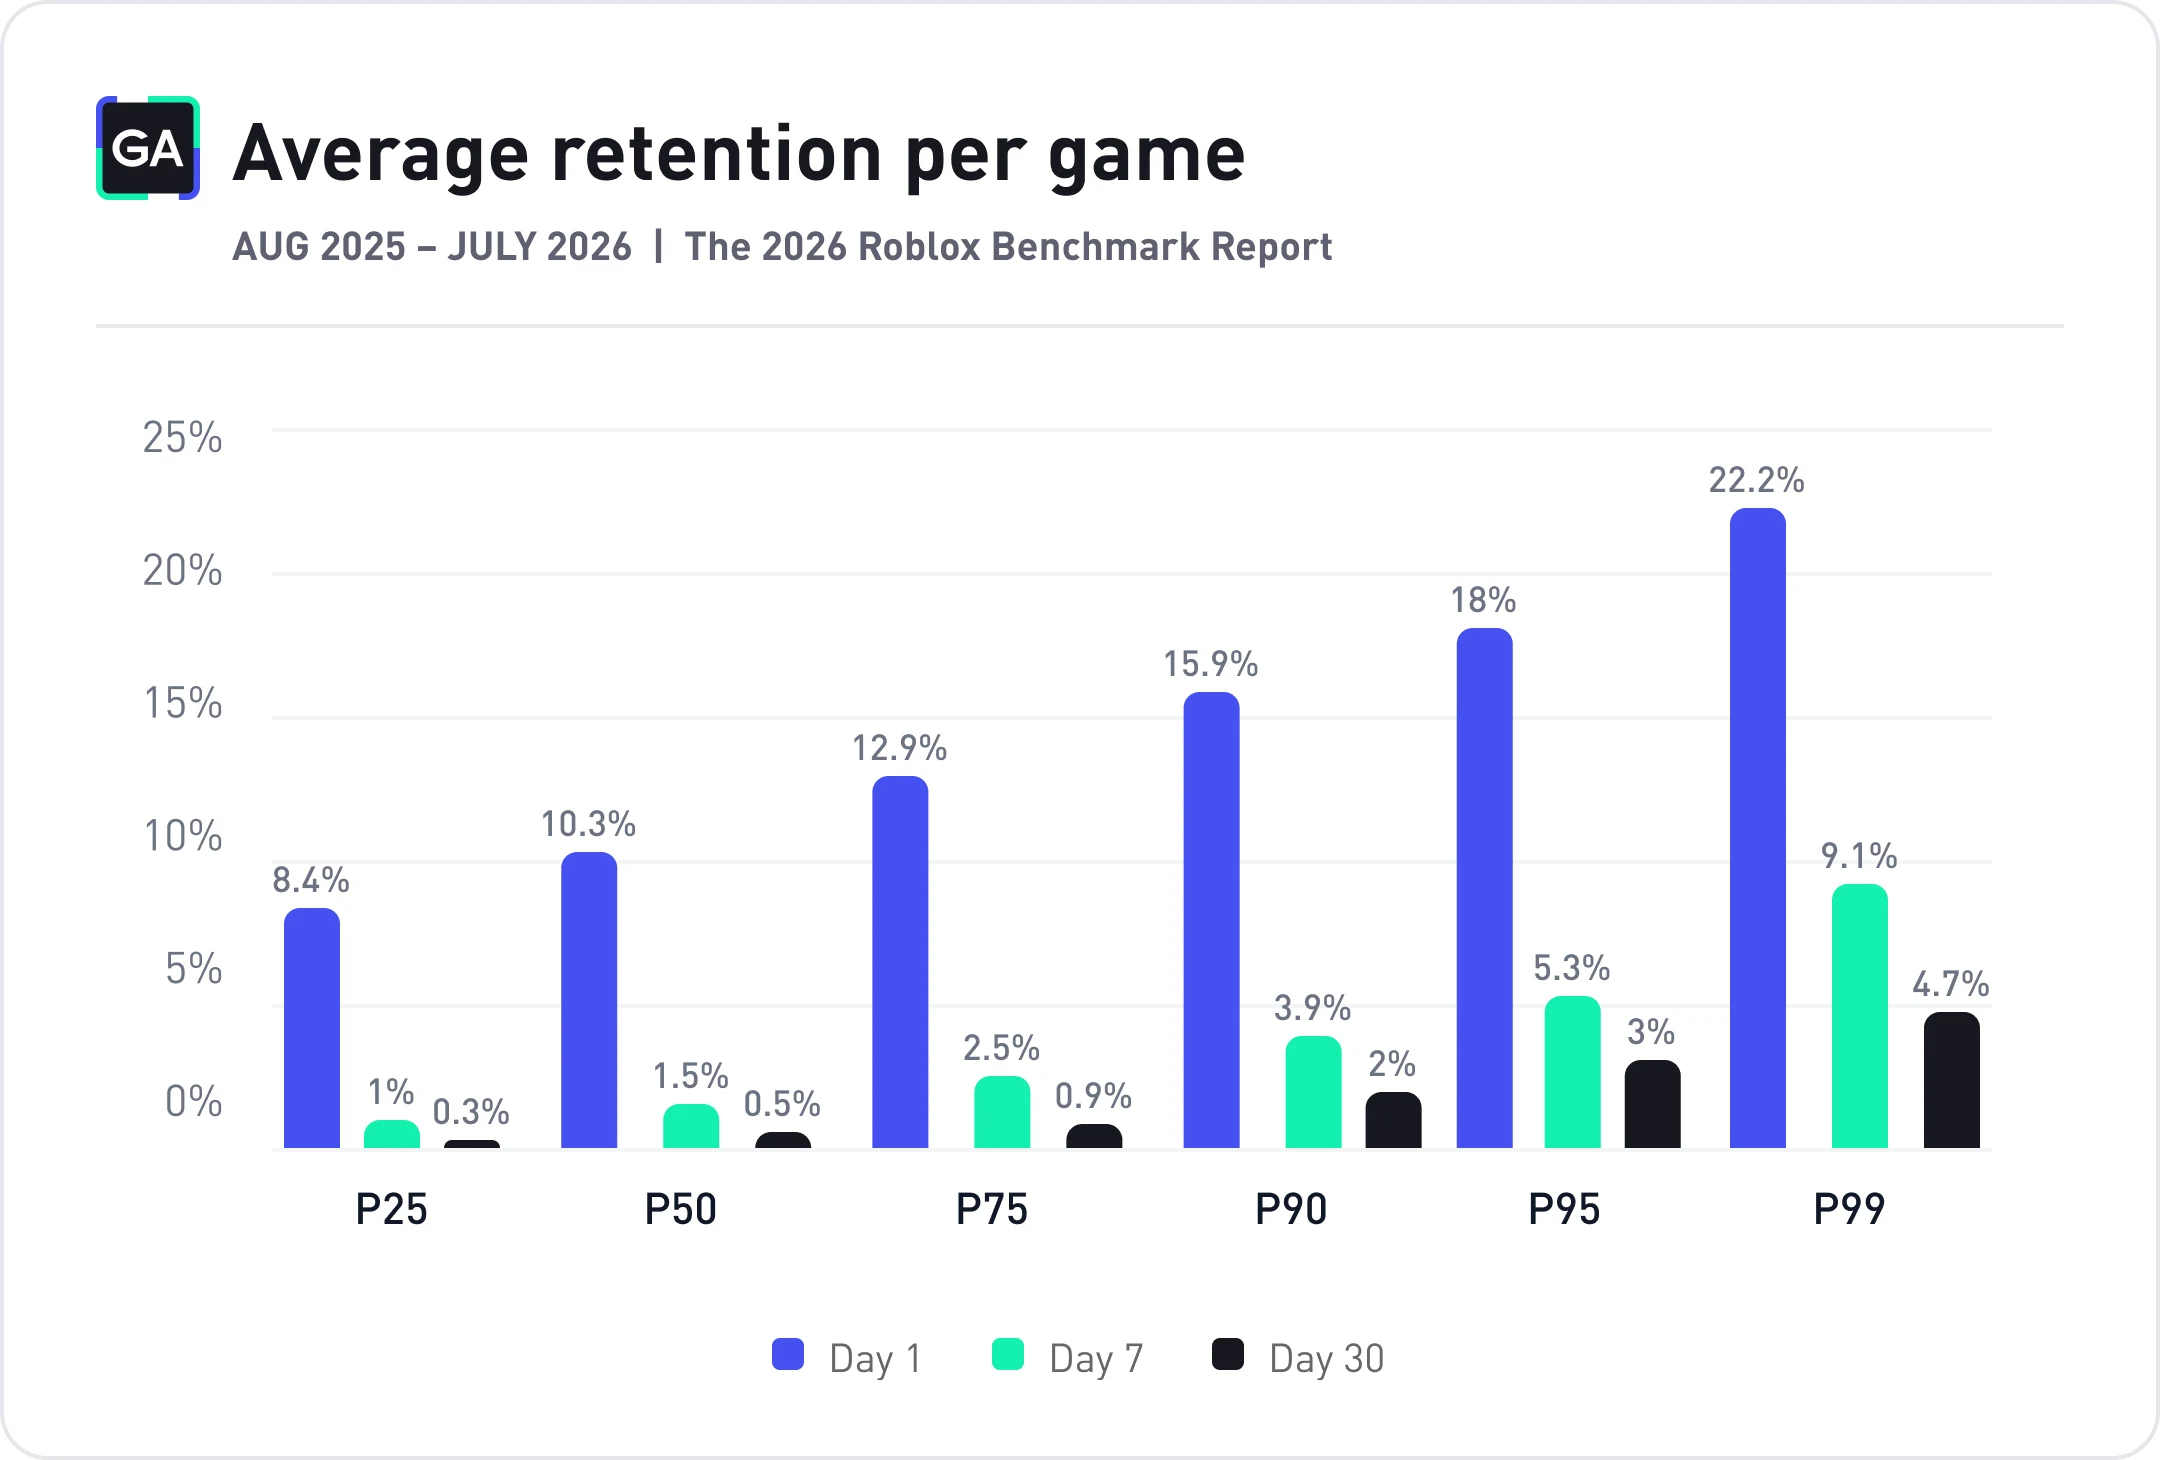
Median D1 retention for a Roblox game is 10.3%, D7 is 1.6%, and D30 is 0.5%. The top 1% of games have D1 of 22.2%, D7 of 9.1%, and D30 of 4.7%.
In its 2023 report, GameAnalytics wrote that 12-15% of players return after the first day. Back then, though, the sample also included smaller projects. So retention on Roblox seems to have declined.
From concept art to launch-day marketing, most game studios rely on contractors in multiple countries. Mellow makes it simple to hire, pay, and stay compliant with talent in 150+ countries — no legal entity required.
GameAnalytics notes that high D30 almost always belongs to games with big IPs or deep long-term progression. The company also considers the benchmarks circulating online (20% D1 is good, 40% is excellent) to be inflated: they’re usually based on small samples of games that are already successful.
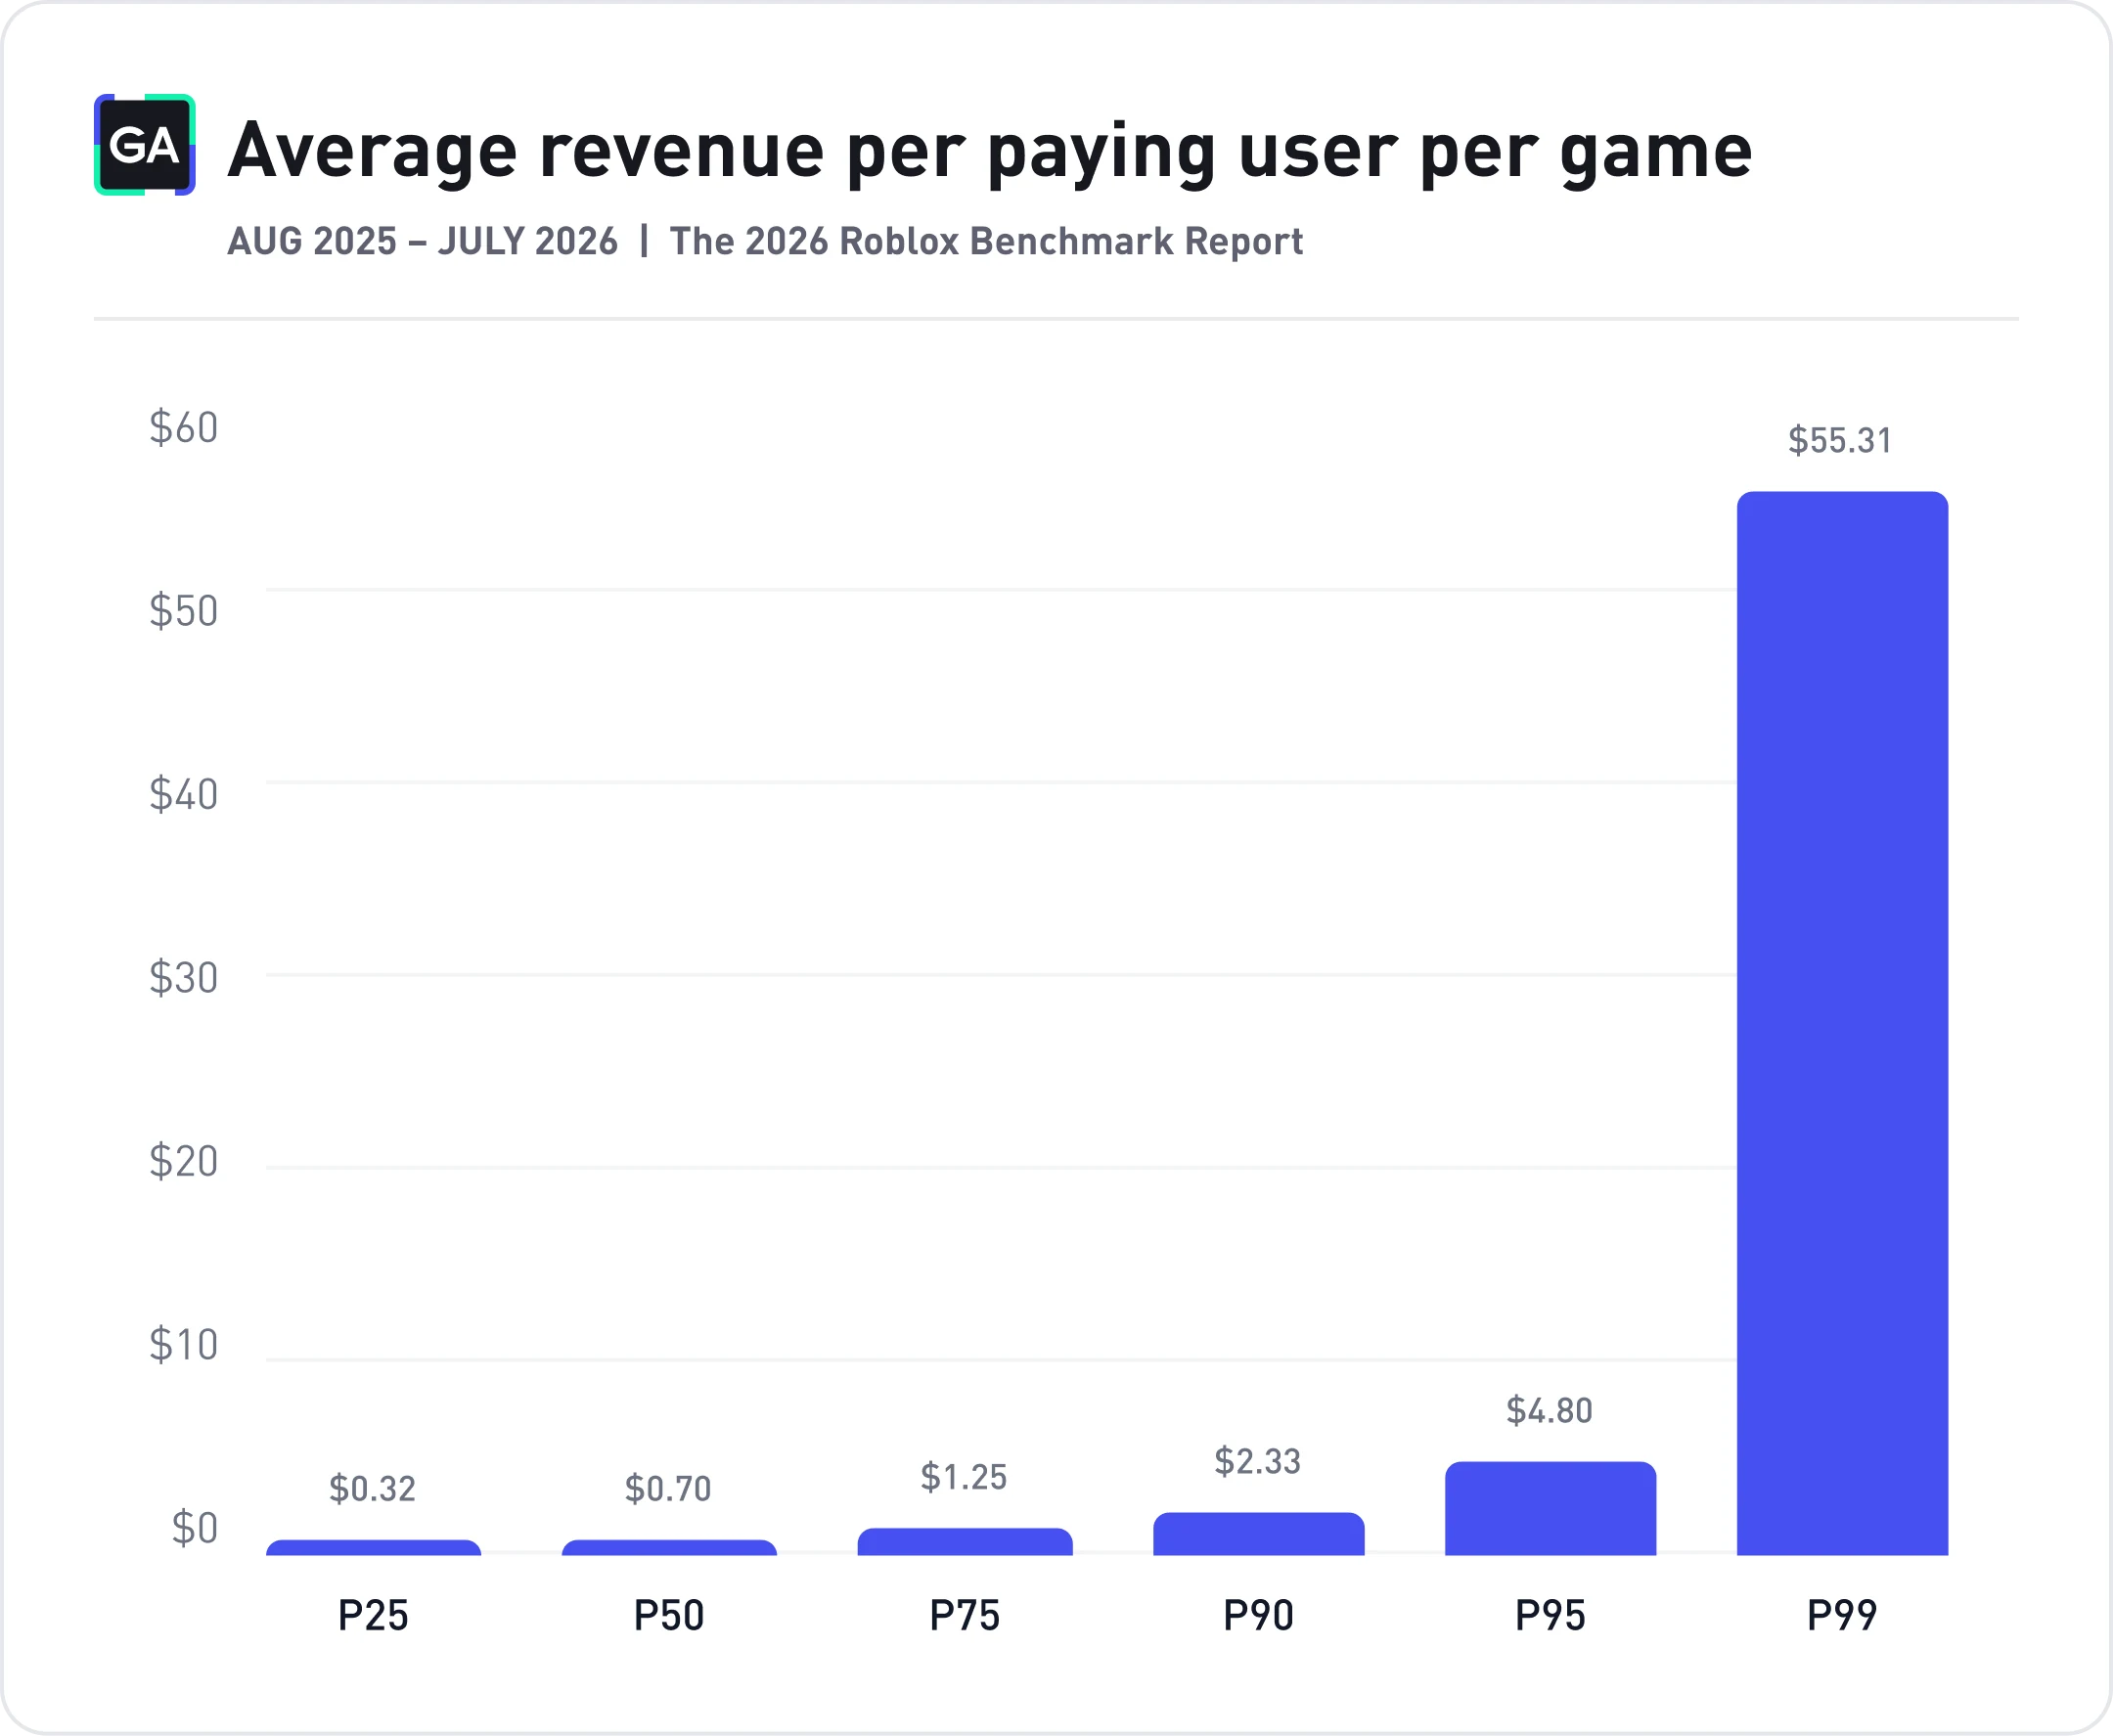
The median game’s ARPPU is $0.70. The top 10% of games have $2.33, and the top 5% have $4.80.
The top 1% of games, however, have an ARPPU of $55.31, almost 12 times higher than the top 5%.
Since August 2026, Roblox’s guidance for developers says that games strong in both retention and monetization may get more exposure on the Home page. One good metric is no longer enough.